Detection of RNA nucleoside modifications with the uridine-specific ribonuclease MC1 from Momordica charantia (original) (raw)
Abstract
A codon-optimized recombinant ribonuclease, MC1 is characterized for its uridine-specific cleavage ability to map nucleoside modifications in RNA. The published MC1 amino acid sequence, as noted in a previous study, was used as a template to construct a synthetic gene with a natural codon bias favoring expression in Escherichia coli. Following optimization of various expression conditions, the active recombinant ribonuclease was successfully purified as a C-terminal His-tag fusion protein from E. coli [Rosetta 2(DE3)] cells. The isolated protein was tested for its ribonuclease activity against oligoribonucleotides and commercially available E. coli tRNATyr I. Analysis of MC1 digestion products by ion-pairing reverse phase liquid-chromatography coupled with mass spectrometry (IP-RP-LC-MS) revealed enzymatic cleavage of RNA at the 5′-termini of uridine and pseudouridine, but cleavage was absent if the uridine was chemically modified or preceded by a nucleoside with a bulky modification. Furthermore, the utility of this enzyme to generate complementary digestion products to other common endonucleases, such as RNase T1, which enables the unambiguous mapping of modified residues in RNA is demonstrated.
Keywords: RNA structure, uridine, pseudouridine, enzymatic cleavage, modified nucleosides, RNA sequencing, RNA modification mapping, LC MS/MS
INTRODUCTION
Nucleoside-specific ribonucleases (RNases) are important molecular tools for locating the more than 120 modified nucleosides (Machnicka et al. 2013) within an RNA sequence by the process generally referred to as RNA modification mapping (Kowalak et al. 1993; Giessing and Kirpekar 2012). Emerging evidence indicates that these RNA modifications could be associated with a variety of human diseases through their structural and functional roles (Torres et al. 2014). To delineate the roles of nucleoside modifications, identification and mapping the location of these chemical groups within the overall RNA sequence is essential. Traditional or next-generation RNA-sequencing technologies primarily rely on polymerization-dependent copying of RNA into deoxyribonucleotides in DNA through Watson–Crick base-pairing (Van Dijk et al. 2014). Such copying, however, leads to loss of modification information of the original RNA chain.
Mass spectrometry is a powerful analytical technique that can directly measure the mass shift associated with RNA modifications (Gaston and Limbach 2014). McCloskey and coworkers initially developed a mass spectrometry-based approach for the identification and localization of nucleoside modifications in a given RNA (Kowalak et al. 1993). Their RNA modification mapping approach involves hydrolysis of a target RNA to nucleosides to determine the census of nucleoside modifications in combination with nucleoside-specific ribonuclease digestion of the target RNA for modification placement.
To simplify mass spectral analysis of RNase digestion products, this group noted that knowledge of the compositional value of one nucleoside residue imposes a constraint on the number of allowable base compositions for a given mass value thereby allowing one to specify unique base compositions within reasonable mass measurement errors (Pomerantz et al. 1993). In practice, base-specific RNase digestion of RNAs followed by separation and mass spectral analysis using ion-pairing reverse phase liquid chromatography-mass spectrometry (IP-RP-LC-MS) and collision-induced dissociation tandem mass spectrometry (CID MS/MS) allows one to readily map modified nucleosides onto the original RNA sequence (Gaston and Limbach 2014).
Currently, RNase T1 (guanosine specific) and RNase A (pyrimidine selective) enzymes are commercially available and compatible with RNA modification mapping by mass spectrometry. Recently, we described an overexpression system for RNase U2 (purine selective) because of the limited commercial availability of this enzyme (Houser et al. 2015). However, optimal RNA modification mapping requires generating sufficient overlapping digestion products from multiple RNases to reduce redundancies in digestion product sequences and modification placement (Gaston and Limbach 2014). Alternative strategies for generating overlapping digestion products include partial ribonuclease digestion, the use of nonspecific nucleases and alkaline hydrolysis (Wurst et al. 1978; Novikova et al. 2013; Puri et al. 2014). While such strategies can be effective, the RNA modification mapping approach would be enhanced by identifying new RNases with complementary nucleoside specificity.
Ribonuclease MC1, first isolated and sequenced from the seeds of the bitter gourd (Momordica charantia), has been reported to exhibit uridine-specific cleavage of RNA (Ide et al. 1991; Irie et al. 1993). The protein consists of 190 amino acid residues with a molecular weight of 21 kDa (Ide et al. 1991). RNase MC1, with its conserved residues at positions 32–38 and 81–92, is a member of the RNase T2 family. The crystal structure of RNase MC1 has been solved revealing its four disulfide bridge locations; six α-helices, four 310-helices and eight β-strands (Nakagawa et al. 1999; Suzuki et al. 2000). RNase MC1 is an interesting enzyme compared with other members of the T2 family (Luhtala and Parker 2010) that generally exhibit nonspecific ribonuclease activity. The uridine specificity of MC1 is postulated to be due to Asn71 and Leu73, which are variants as compared with other T2 family members. The side chains of Asn71 and Leu73 enable hydrogen bonding with uracil (Suzuki et al. 2000; Numata and Kimura 2001; Numata et al. 2001). Site-directed mutagenesis of Asn71 to Thr or Ser altered the uridine specificity to a guanosine preference, and mutation of Leu73 to Ala decreased the binding affinity toward uridine by >14-fold, thus strongly supporting the key roles of these residues for substrate binding (Numata et al. 2003). Based on these findings, RNase MC1 would be a useful enzyme to include in RNA modification mapping analyses.
Escherichia coli is the preferred bacterial system for large-scale production of recombinant proteins (Ferrer-Miralles and Villaverde 2013). The translation of a set of codons present in a recombinant gene depends on the abundance of tRNA species in the host (Ikemura 1985; Bulmer 1987). Thus, successful expression of a foreign gene benefits from a positive correlation of the codon bias of the expressed gene with the host tRNA population. One approach has been to supplement the host tRNA pool by overexpression of so-called rare tRNA genes to facilitate efficient translation of corresponding codons during protein expression (Harris et al. 2006). However, such engineered tRNAs can be undermodified (Krivos et al. 2011), which may impact their efficiency during translation. To overcome these limitations, a codon optimization tool was designed to adjust the codon usage of a target gene to resemble that of highly expressed genes (ribosomal proteins and elongation factors) of a host cell (Fuglsang 2003). Such an approach should enhance overexpression of plant-based genes within an E. coli host.
Here we report the _E. coli_-based inducible expression of a codon-optimized ribonuclease MC1 gene. After optimization of expression conditions, an active protein was successfully purified and characterized. The uridine specificity of MC1 was confirmed by analysis of transfer RNA (tRNA) digestion products using LC-MS/MS. The utility of MC1 for mapping modified nucleosides onto an RNA sequence is illustrated, and MC1 can be added to the arsenal of base-specific RNases compatible with RNA modification mapping by mass spectrometry.
RESULTS
Uridine-specific ribonuclease for RNA modification mapping
Among options for a uridine-specific ribonuclease, which would complement existing RNase T1-based RNA modification mapping, ribonuclease MC1 (P23540, GI:133173) (Ide et al. 1991; Irie et al. 1993) was identified as the most reasonable candidate to pursue. The protein consists of 190 amino acid residues with a molecular weight of 21 kDa. To ensure optimal expressivity of this plant-based ribonuclease gene in any one of the commercially available bacterial host strains and to obtain enhanced expression, the nucleotide composition of codons was adjusted to resemble the natural codon usage of highly expressed genes (e.g., ribosomal proteins) from E. coli. After confirming the sequence and reading frame of the recombinant MC1-(His)6 gene fusion as described in Materials and Methods, a number of experimental parameters including growth stage for protein induction, growth temperature, duration of induction, and concentration of inducer were investigated to optimize production of the active ribonuclease.
Of the two strains, Rosetta (DE3) and BL21, tested for recombinant protein expression in E. coli, significant expression of recombinant protein was observed only with Rosetta (DE3) cells but not with the BL21 host strain. Hence, further experiments were continued with Rosetta (DE3) cells bearing the recombinant plasmid.
Optimization of expression
A Rosetta (DE3) cell line bearing the recombinant plasmid, growing in LB media supplemented with ampicillin and chloramphenicol, was induced for MC1 expression by adding IPTG at different stages in the log-phase growth curve as measured by optical cell densities ranging from 0.3 to 0.9 units at λ600. Figure 1A depicts the representative growth curves following induction at each growth stage. In almost all cases, inducible expression of MC1 resulted in a change in the growth curve, shifting growth into the log phase. A comparison of the protein amounts purified from harvested cells revealed higher yields when cells were induced around an OD600 of 0.6 (Fig. 1B).
FIGURE 1.
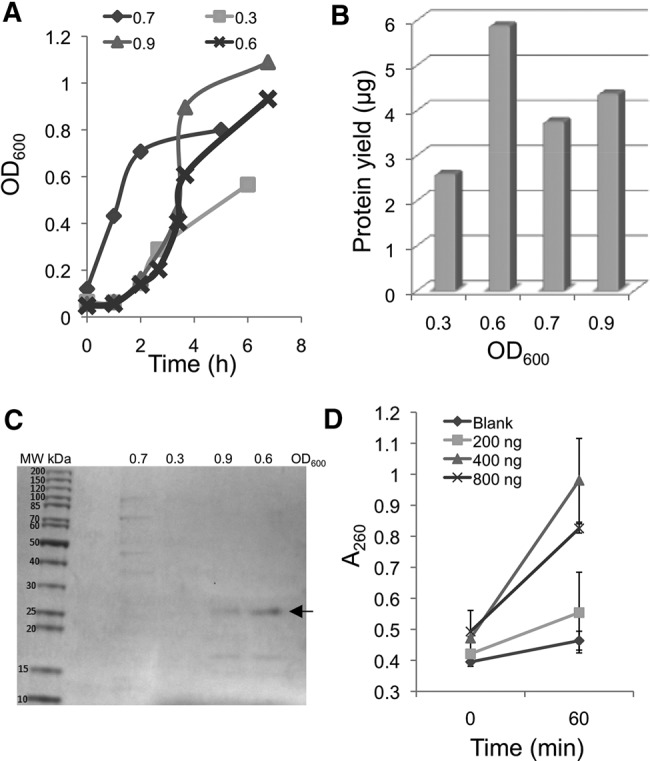
Optimization of MC1 expression conditions in E. coli. (A) Impact of growth phase on recombinant MC1 protein induction and yield. Rosetta cells with pETMC1 were grown in 200 mL LB media supplemented with antibiotics. The inducer IPTG was added at designated stages of log phase as measured by OD600 absorbance. OD600 reading was also recorded after 3 h of induction and the values plotted. (B) Plot showing comparison of protein yields from cells induced at different stages of log phase. (C) SDS-PAGE analysis of purified protein. Two micrograms of protein purified from each growth phase was boiled in Laemmli buffer and electrophoresed on a denaturing gel. The polypeptide with _M_r∼24 kDa is indicated by arrow. (D) Ribonuclease activity assay based on increase in absorbance at A260. Designated amounts of protein, obtained following induction of recombinant cells at 0.6 OD600, were incubated with 200 pmol of oligoribonucleotide standard for 1 h as described.
The purified protein was analyzed for its relative molecular mass and purity by SDS-PAGE (Fig. 1C). This analysis revealed a major polypeptide band at _M_r∼24 kDa with a few minor polypeptides of low molecular mass when cells were induced at an OD600 of 0.6 and 0.9. The expected molecular mass of the MC1-(His)6 fusion protein (24.1 kDa) is similar to that observed in SDS-PAGE suggesting the production of the anticipated polypeptide in the bacterial host. Surprisingly, no such polypeptide was observed when cells were induced at OD600 of 0.3 and 0.7. An examination of the respective growth curves suggests that the optical density remains essentially unchanged after 3 h of induction at OD600 of 0.7, indicating the suspension of metabolic activity in these host cells. Induction at early log phase (OD600 of 0.3) did not produce the anticipated polypeptide, likely because of a lower cell count and slower multiplication of cultured cells. Although induction at OD600 of 0.9 resulted in the ∼24 kDa polypeptide, the resulting protein yield was significantly less than the amount observed when induction occurred at OD600 of 0.6. Hence, induction at OD600 of 0.6 was considered optimal for expression of MC1 protein in the E. coli host.
The optimal duration of MC1 induction was observed to be 2 h from the point of IPTG addition at OD600 of 0.6, where protein yield peaked at ∼5 µg per 200 mL culture. Altering the growth temperature between 30°C and 37°C and IPTG concentrations between 0.4 and 1.0 mM had no significant impact on protein yield, which remained unchanged at ∼5 µg (data not shown).
Characterization of ribonuclease activity of MC1
Enzyme activity assay
A UV absorbance assay was created to establish the enzymatic activity of the purified protein. Changes in UV absorbance at 260 nm (A260) upon 37°C incubation of the purified protein with the oligonucleotide UAACUAUAACG was identified as the appropriate assay. Cleavage of UAACUAUAACG by the ribonuclease will result in oligonucleotide products with reduced stacking interactions compared with the starting substrate leading to an increase in A260 values. Three protein amounts were tested (200, 400, and 800 ng). An increase in A260 was measured when increasing the protein amount from 200 to 400 ng, while no additional increase was detected at 800 ng of protein (Fig. 1D). Presumably, the higher protein amount resulted in no further cleavage of the oligonucleotide substrate or the increased protein amount interferes with detection of any additional changes in the UV absorbance.
Cleavage preferences of MC1
To investigate the base specificity and other cleavage properties, ribonuclease MC1 was incubated with E. coli tRNATyr I and the digestion products were analyzed by IP-RP-LC-MS/MS. The nucleotide-specific cleavage properties were determined by a systematic examination of the MS/MS mass spectra from each oligonucleotide precursor ion whose mass is consistent with a cleavage product containing a 3′-phosphate. Evaluation of these data revealed oligonucleotide digestion products exhibiting 5′-uridine residues. Two such representative digestion products, ΨC and UCC, are shown in Figures 2 and 3, respectively. In contrast, the 3′-termini of digestion products were highly variable, but uridine was conspicuous by its absence. For longer digestion products where the 5′-terminus could not be directly observed in the MS/MS data, fragment ions at the second position consistent with the presence of uridine were observed. Based on this examination of the MS/MS data, a list of m/z values of expected tRNATyr I digestion products and their collision-induced dissociation (CID) fragment ions were calculated assuming cleavage at uridine residues yielding digestion products with 5′-uridine or 5′-modified uridine nucleosides.
FIGURE 2.
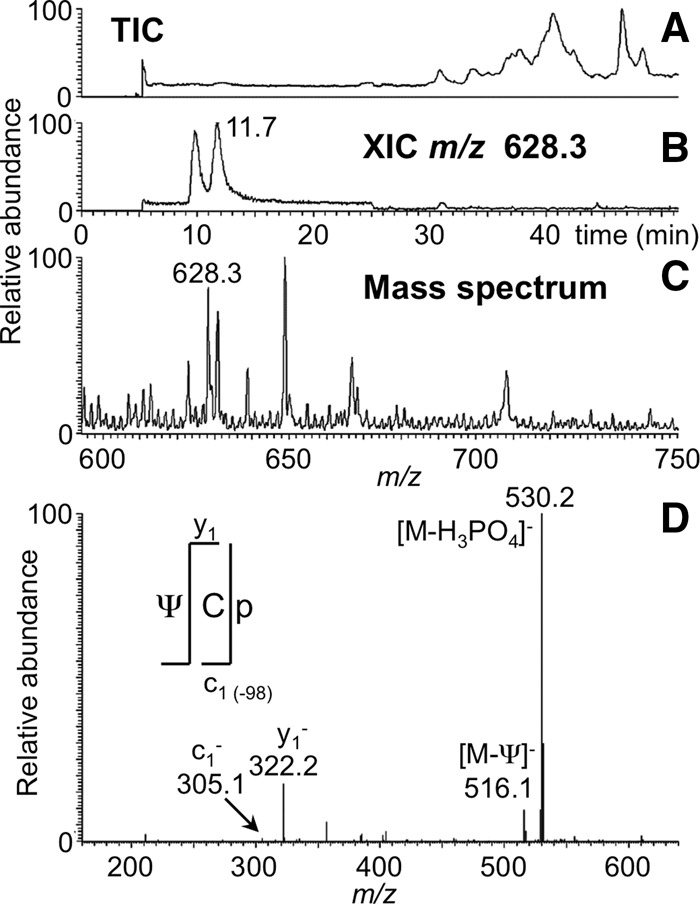
LC-MS/MS analysis of RNase MC1 digestion product ΨCp from E. coli tRNATyr I including (A) total ion chromatogram (TIC), (B) extracted ion chromatogram (XIC) for m/z 628.3, corresponding to the digestion product ΨCp (position 55–56), and (C) the mass spectrum associated with the XIC at 11.7 min. (D) Tandem mass spectrum (MS/MS) of the collision-induced dissociation (CID) of the m/z 628.3 precursor ion is depicted. The observed sequence informative product ions, c (with common 5′ end) and y (with common 3′ end) with a subscript denoting the position of cleavage on phosphodiester backbone, are labeled and plotted following the nomenclature of McLuckey et al. (1992).
FIGURE 3.
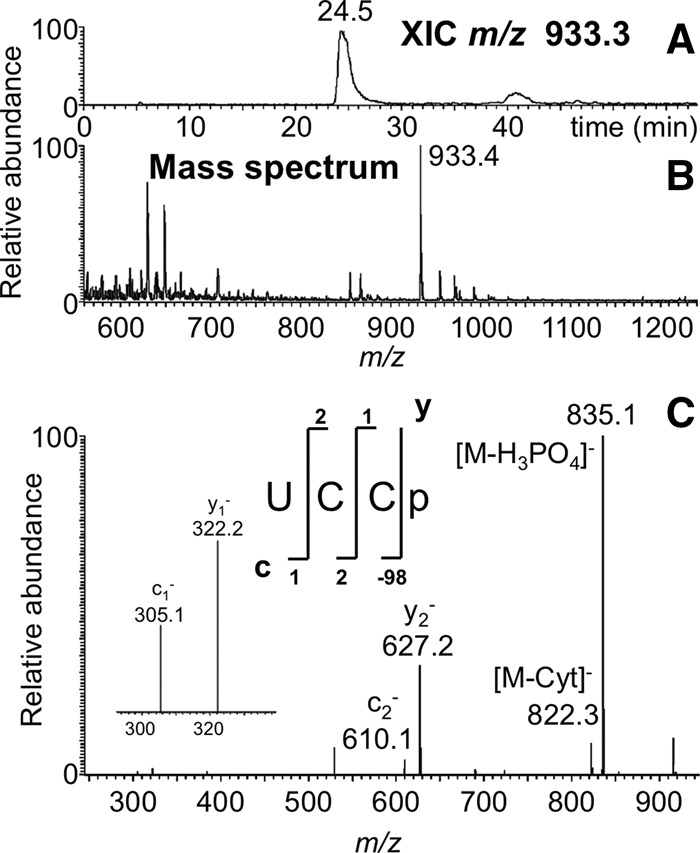
LC-MS/MS analysis of RNase MC1 digestion product UCCp from E. coli tRNATyr I including (A) XIC for m/z 933.4, corresponding to the digestion product UCCp (position 55–56) and (B) the mass spectrum associated with the XIC at 24.5 min. (C) CID tandem mass spectrum of m/z 933.4 precursor ion is depicted with sequence informative fragment ions labeled.
Using these digestion rules, the entire LC-MS/MS data set for tRNATyr I was examined. Among the predicted digestion products was one from the 3′ end of the tRNA, UCCCCCACCACCA. This cytidine-rich digestion product was detected experimentally in high abundance (Fig. 4). Significantly, no digestion products corresponding to cleavage at cytidine were observed in the LC-MS/MS data indicating the specificity of the purified protein toward uridine.
FIGURE 4.
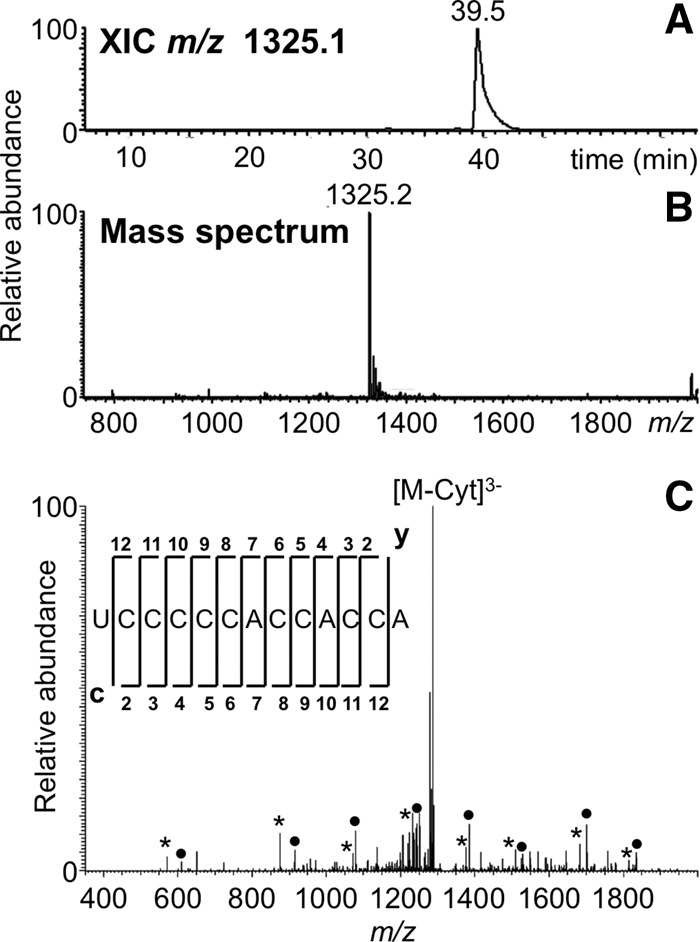
LC-MS/MS analysis of RNase MC1 digestion product UCCCCCACCACCA from E. coli tRNATyr I including (A) XIC for m/z 1325.1 corresponding to the digestion product UCCCCCACCACCA (position 73–85), and (B) the mass spectrum associated with the XIC at 39.5 min. (C) CID tandem mass spectrum of m/z 1325.2 precursor ion is depicted with sequence informative fragment ions labeled; asterisk (*) denotes c-type fragment ions and solid bullet (•) denotes y-type fragment ions.
A further examination of the experimental data revealed the presence of 3′-linear and 2′,3′-cyclic phosphates for digestion products (a representative digestion product is shown in Fig. 5). The presence of cyclic phosphates is consistent with an RNase T2 mechanism, which proceeds via the 2′,3′-cyclic phosphate intermediate before forming the 3′-linear phosphate as the final product (Kaiser et al. 1975; Suzuki et al. 2000). This feature was not enzyme concentration dependent, as excess enzyme (up to 50× enzyme) did not affect cyclic phosphate levels. Concentration-independent formation of the cyclic phosphate is more consistent with a slow rate of phosphodiester bond hydrolysis.
FIGURE 5.
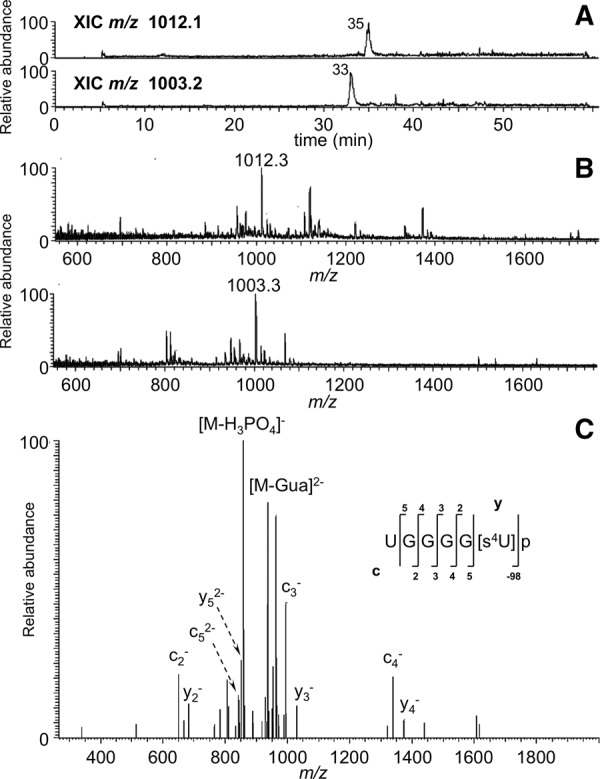
LC-MS/MS analysis of RNase MC1 digestion products UGGGG[s4U]p and UGGGG[s4U] > p from E. coli tRNATyr I. (A) XICs of m/z 1012.3 (linear phosphate) and m/z 1003.3 (2′,3′-cyclic phosphate) are shown. (B) Mass spectra associated with the XICs at 35 and 33 min are presented. (C) CID tandem mass spectrum of m/z 1012.3 precursor ion is depicted with sequence informative fragment ions labeled.
Cleavage preferences at post-transcriptionally modified uridines
The tRNATyr I substrate allowed for an initial investigation into the influence of modified nucleosides on the cleavage properties of MC1. This tRNA contains multiple modified nucleosides: 4-thiouridine [s4U8], 2′-_O_-methylguanosine [Gm17], queuosine [Q34], 2-methylthio-N _6_-isopentenyladenosine [ms2i6A37], 5-methyluridine [m5U54], and two pseudouridines [Ψ39 and Ψ55] (Goodman et al. 1970). While uridine and pseudouridine are indistinguishable based on mass, other modifications can be directly identified by their characteristic mass shift from the unmodified canonical nucleoside, and placed within the overall tRNATyr I sequence upon examination of the MS/MS data.
4-thiouridine and 5-methyluracil
Of great interest was determining whether MC1 cleavage is impacted by the presence of modified uridines. As tRNATyr I contains three modified uridines (s4U, m5U, and Ψ), the LC-MS/MS data were evaluated by generating in silico predicted digestion products where s4U and m5U are either recognized for cleavage or not and comparing the experimental data against these predicted m/z values. The data revealed the presence of m/z values that correspond to the case where s4U and m5U are not recognized by MC1. For example, the digestion product UGGGG[s4U]p was detected at m/z 1012.3 (Fig. 5A,B) and this sequence was confirmed by MS/MS (Fig. 5C). Similarly, m5U was not recognized as a substrate for cleavage as noted by detection of the digestion product UCGAAGG[m5U] at m/z 1320.5, which also was confirmed by the MS/MS data (Fig. 6).
FIGURE 6.
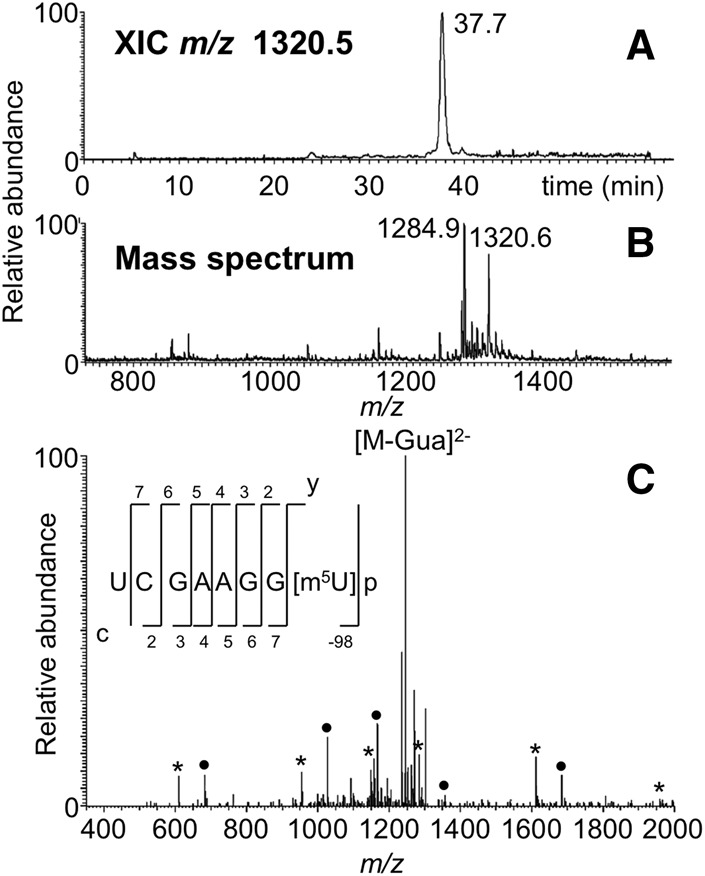
LC-MS/MS analysis of RNase MC1 digestion product UCGAAGG[m5U]p from E. coli tRNATyr I including (A) XIC for m/z 1320.2, corresponding to the digestion product UCGAAGG[m5U] (position 47–54) and (B) the mass spectrum associated with the XIC at 37.7 min. A co-eluting ion (m/z 1284.6) observed in the mass spectrum corresponds to the MC1 digestion product (UCACAGAC, position 46–53) belonging to the tRNATyr II isodecoder (RY1661) (Goodman et al. 1970). (C) CID tandem mass spectrum of m/z 1320.6 precursor ion is depicted with sequence informative fragment ions labeled; asterisk (*) denotes c-type fragment ions and solid bullet (•) denotes y-type fragment ions.
If MC1 had recognized these modified nucleosides as substrates, the digestion products would have been single nucleotides (5′ monophosphates of s4U or m5U) as they are followed by either uridine or pseudouridine in the tRNATyr I sequence. To confirm that no partial cleavages at s4U or m5U occurred, the predicted doubly charged digestion products consistent with such cleavage, (3)-UGGGG-(7) at m/z 851.1 and (56)-UCGAAGG-62 at m/z 1160.1, were also searched for within the data. No ions for these m/z values were detected, confirming that s4U and m5U are not recognized as substrates by MC1.
Pseudouridine
If MC1 recognizes pseudouridine as a substrate, the expected digestion products are predicted at m/z 628.4 (ΨC) and m/z 815.1 (ΨCGAA). The former was found as illustrated in Figure 2, and data consistent with the latter is shown in Figure 7. Although pseudouridine cannot be distinguished from uridine by mass, no other tRNATyr I digestion products corresponding to the sequence UC or UCGAA are expected. Therefore, uridine and pseudouridine are indistinguishable in terms of the nucleoside specificity of MC1.
FIGURE 7.
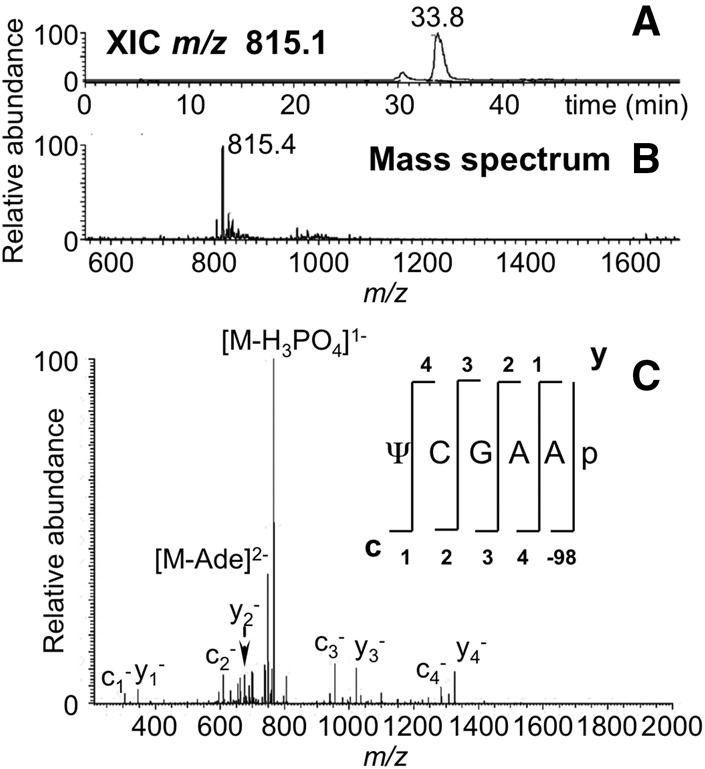
LC-MS/MS analysis of MC1 digestion product ΨCGAAp from E. coli tRNATyr I including (A) XIC for m/z 815.4, corresponding to the digestion product ΨCGAAp (position 55–59) and (B) the mass spectrum associated with the XIC at 37.7 min. (C) CID tandem mass spectrum of m/z 815.4 precursor ion is depicted with sequence informative fragment ions labeled.
Missed cleavages
An analysis of the MC1 cleavage patterns of tRNATyr I also revealed that cleavage was not observed if a uridine is preceded by a bulky modified nucleoside. For example, queuosine at position 34 inhibited MC1 cleavage at U35 as noted by digestion products detected at m/z 1100.5 and m/z 1091.7, which are consistent with the 3′-linear phosphate and 2′,3′-cyclic phosphate digestion products, respectively, for the oligonucleotide U[Q]UA[ms2i6A]A (Fig. 8). Tandem mass spectrometry of these precursor ions confirmed the sequence, revealing the influence of the 5′-nucleoside on uridine recognition and cleavage.
FIGURE 8.
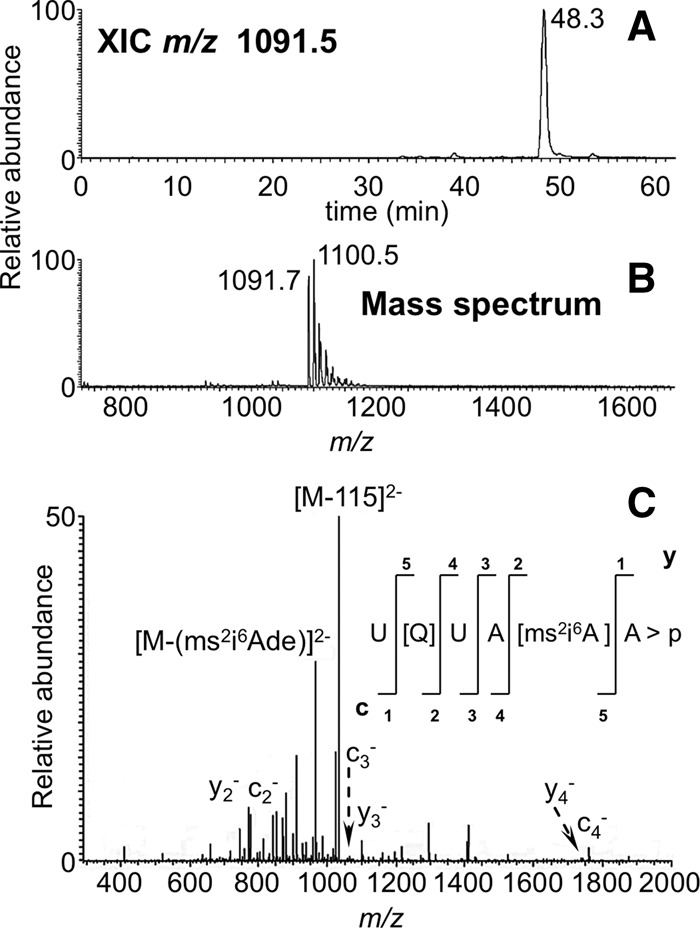
LC-MS/MS analysis of RNase MC1 digestion products U[Q]UA[ms2i6A]A > p and U[Q]UA[ms2i6A]Ap from E. coli tRNATyr I including (A) XIC for m/z 1091.5 and (B) the mass spectrum associated with the XIC at 48.3 min. The mass spectrum reveals the doubly charged ions for both linear (m/z 1100.5) and 2′,3′-cyclic phosphate (m/z 1091.7) digestion products of U[Q]UA[ms2i6A]A (positions 33–38). (C) CID tandem mass spectrum of m/z 1091.7 precursor ion is depicted with sequence informative fragment ions labeled. Fragmentation of queuosine in the oligonucleotide by loss of 115 Da is indicated in the mass spectrum.
To determine whether partial digestion at uridines occurs, tRNATyr I substrate was incubated with varying amounts of MC1. At low enzyme/substrate ratios (0.05–1 µg protein per 3 µg of tRNA), partial digestion at consecutive uridines was noted. These partial digestions could be eliminated by increasing the enzyme/substrate ratio (2.5 µg protein per 3 µg of tRNA).
An examination of predicted MC1 digestion products from tRNATyr I reveals the absence of a 26-nt-long GC-rich digestion product (UCCCCGAGC[Gm]GCCAAAGGGAGCAGAC) in the experimental data. As noted above, nonspecific digestion products were not detected, suggesting that the experimental LC-MS/MS conditions are not optimal for detection of such a large oligonucleotide digestion product.
Docking of RNase MC1 with modified uridine monophosphates
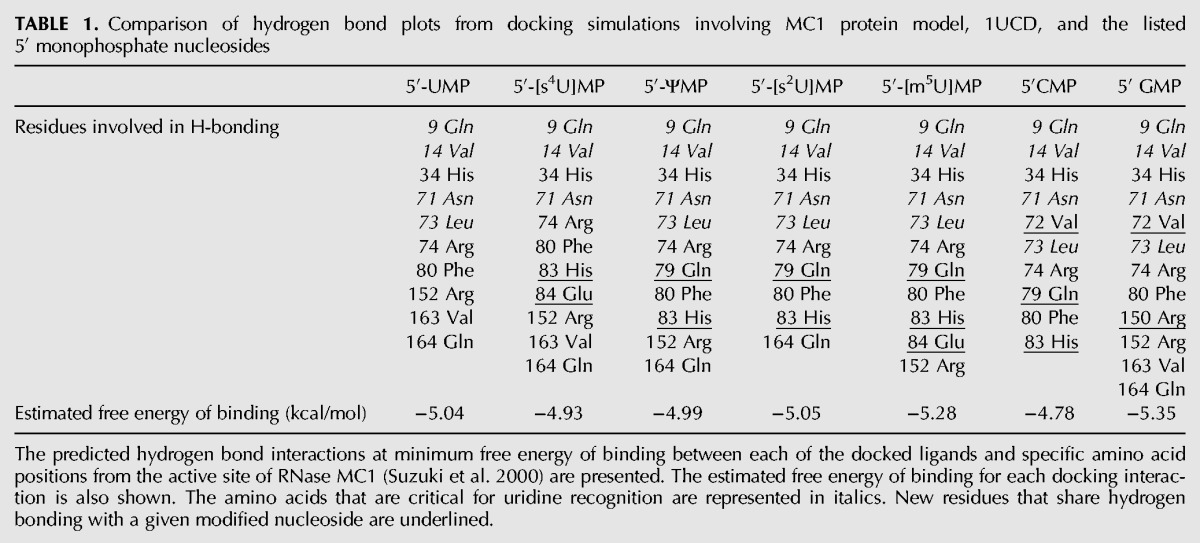
To examine the possible rationale for the lack of cleavage at s4U and m5U, docking simulations were performed using the crystal structure of the MC1/5′-UMP complex (1UCD). For all simulations, unmodified (UMP) and modified (s4UMP and m5UMP) nucleotides were inserted using the initial coordinates of 5′-UMP. Within these docking simulations, the amino acid residues that are predicted to be associated with H-bonding in the MC1/UMP complex were found to be identical to those reported previously (Table 1; Suzuki et al. 2000). Proceeding accordingly, hydrogen bonding plots from each docking interaction were compared with that of UMP to identify any differences in amino acid residues involved in hydrogen bonding. As shown in Table 1, almost all of the tested nucleotides including 5′-CMP and 5′-GMP are predicted to retain hydrogen bonding with a majority of the amino acids (including those critical amino acid residues, represented in italics) that were identified as interacting with 5′-UMP. However, amino acids at other positions (underlined) are also predicted to be associated with hydrogen bonding with these nucleosides. An examination of the estimated free energy of binding for each docking interaction did not reveal any significant differences among all of the nucleotides investigated. These data suggest that the reaction rate, rather than substrate recognition and binding, is a more likely explanation for the absence of cleavage at modified uridines.
TABLE 1.
Comparison of hydrogen bond plots from docking simulations involving MC1 protein model, 1UCD, and the listed 5′ monophosphate nucleosides
DISCUSSION
RNA modification mapping has been premised on the use of the highly specific RNase T1 that provides the base composition constraint necessary to simplify data interpretation (Pomerantz et al. 1993) allowing modified nucleosides to be placed onto the overall RNA sequence (Kowalak et al. 1993). Beyond RNase T1, the only other routinely commercially available base-specific RNase is RNase A, which cleaves at unmodified and some modified pyrimidines (Douthwaite and Kirpekar 2007) generating a number of shorter RNase digestion products that are not particularly useful for modification placement due to sequence redundancies. Although we recently described an overexpression system for RNase U2 (Houser et al. 2015), this enzyme cleaves at unmodified purines with a slight selectivity toward adenosine (Hossain and Limbach 2009) and, thus, does not greatly enhance sequence coverage during RNA modification mapping. At present, there remains a need for additional nucleoside-specific RNases that can complement the information generated by RNase T1 digests.
The U-specific ribonuclease MC1 was identified as a promising candidate for RNA modification mapping due to the availability of the protein sequence and the previously reported crystal structure and biochemical characterization that established its specificity for uridine (Ide et al. 1991; Suzuki et al. 2000; Numata and Kimura 2001; Numata et al. 2001, 2003). To avoid purifying this enzyme from its native plant source, the target gene was cloned and expressed in a more easily manageable bacterial system. However, such bacterial expression can be deleterious to the host cell due to the ribonuclease activity of the expressed protein. This non-native enzymatic activity along with codon bias-related challenges in eukaryotic gene expression might explain why RNase U2 (Martínez-Ruiz et al. 2000) was initially expressed in Pichia pastoris rather than E. coli. Recently, we demonstrated expression of a codon-optimized RNase U2 gene behind the pelB signal sequence to direct the expressed protein to the E. coli periplasm, thereby avoiding the deleterious effects possible if the cellular RNA was exposed to the expressed protein (Houser et al. 2015).
Our success with RNase U2 expression led us to consider a similar strategy for RNase MC1. Optimal expression conditions were identified (Fig. 1) that resulted in the generation of an easily purified active recombinant RNase of relatively good yield. The recombinant enzyme was found to possess the predicted uridine specificity (Figs. 2–4), which should be a strong complement to RNase T1-based RNA modification mapping strategies.
The overexpression host strain was found to impact RNase MC1 yield and activity. Our experience in expressing other plant proteins has revealed that even after supplementation with rare tRNA genes in the Rosetta, the recombinant protein quality and yield could vary depending on the amino acid sequence of recombinant protein. Here, however, the Rosetta strain was found to be more effective than the BL21 strain. One possible explanation is that MC1 contains disulfide linkages and incorrect or lack of formation of these disulfide bonds could lead to increased turnover or targeting of protein to inclusion bodies. It would be of interest to determine if the recombinant protein produced from the Rosetta strain is characterized by appropriate disulfide bond formation as compared against protein overexpressed in the BL21 strain.
During LC-MS/MS characterization of a model RNA substrate, E. coli tRNATyr I, that was digested with RNase MC1, we found that, unlike RNases T1, U2 or A that cleave RNA at the 3′ end of the substrate nucleoside, MC1 exclusively cleaved RNA at the 5′ end of uridine with the phosphate being retained on the 3′ end of the preceding nucleoside. We found both 3′-linear and 2′,3′-cyclic digestion products (Fig. 5), which are consistent with the RNase T2 family two-stage endonucleolytic cleavage where the 2′,3′-cyclic phosphate is the cleavage intermediate (Kaiser et al. 1975).
The RNA cleavage preferences of MC1 indicate that the enzyme's binding site does not distinguish pseudouridine from uridine (Figs. 2, 7) but replacement of oxygen with sulfur at the C4 position makes s4U a nonsubstrate (Fig. 5). Similarly, an extra methyl group at C5 makes m5U a nonsubstrate (Fig. 6). These observations suggest that the binding pocket of the enzyme might be just enough to accommodate uridine or pseudouridine but no other nucleosides. This specificity can be identified in the crystal structure (Suzuki et al. 2000) through the hydrogen bonding occurring among the peptide backbone, key amino acid side chains and the partially ionizable groups on the 5′-UMP substrate. These key interactions are further supported by biochemical studies where it was found the enzyme lost its specificity upon site-directed mutagenesis of key residues (Numata et al. 2003).
To identify whether s4U and m5U are not substrates for MC1 cleavage because they disrupt those key interactions observed in the crystal structure, docking studies were performed. Not surprisingly, only subtle changes in hydrogen bonding patterns (Gln79, His83) were noted when pseudouridine was docked in place of uridine (Table 1). For s4U, one key hydrogen bonding interaction with Leu73 was not seen and a new interaction with Glu84 is predicted. Similarly, with m5U this same Glu84 interaction was observed even though the Leu73 hydrogen bond was maintained. These modeling results suggest that, in addition to maintaining hydrogen bonds previously found to be key for uridine specificity, these modified nucleosides disrupt the enzyme binding pocket through formation of a new hydrogen bond to Glu84, which may adversely impact the catalytic activity of MC1. Modeling results also predict that 2-thiouridine (s2U) should be tolerated within the binding pocket and serve as a substrate for MC1 cleavage. Confirmation of s2U cleavage and the binding versus catalysis effect of s4U and m5U require further experimental investigation.
Although the lack of appropriate structural models prohibit a more rigorous examination of the influence of the nucleoside 5′-adjacent to the cleaved uridine, experimental data revealed that queuosine, which is a bulky 7-deazaguanosine modification, inhibited cleavage of the 3′-adjacent uridine (Fig. 8). Although other bulky modifications were not examined here, it seems reasonable to suspect that uridines immediately 3′-adjacent to bulky modifications may not be cleaved. As most bulky modifications are found—to date—at position 34 or 37 of tRNAs, it should be easy to characterize such behavior with additional studies on select tRNAs.
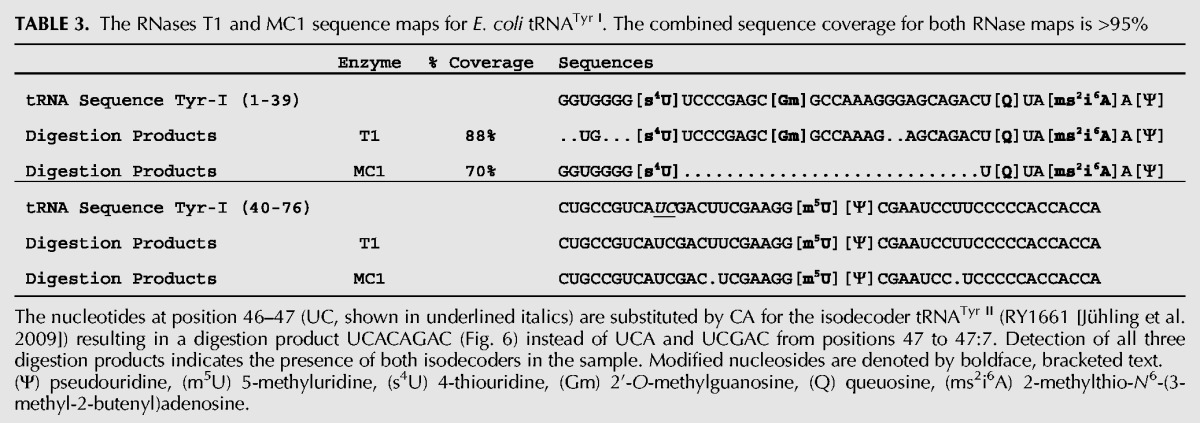
With an understanding of the cleavage specificity of MC1 in hand, the predicted advantages of including this RNase within a general RNA modification mapping strategy are significant. RNase MC1 with its demonstrated uridine specificity directly complements data obtained from the guanosine specific RNase T1 allowing four of the five nonpseudouridine modifications to be unambiguously placed within the overall sequence (Table 2). Indeed, a comparison of the sequenced T1 digestion products of tRNATyr I (Durairaj and Limbach 2008) with that found here after MC1 digestion results in >95% tRNA sequence coverage (Table 3). A further advantage of another nucleoside-specific RNase was noted by the detection of an MC1 digestion product (UCGCAGACp, m/z 1284.3, position 46–53, Fig. 6) by LC-MS that arises from a second isodecoder (tRNATyr II) in the commercial sample. Moreover, one would predict that GC-rich RNAs would be more amenable to RNase MC1 analysis as larger oligonucleotide digestion products should be generated. Conversely, GC-poor RNAs would remain amenable to RNase T1 with the two used in tandem being the preferred option.
TABLE 2.
Comparison of the observed RNase MC1 digestion products with those of RNase T1 and sequence map for E. coli tRNATyr I using the Sprinzl tRNA numbering system
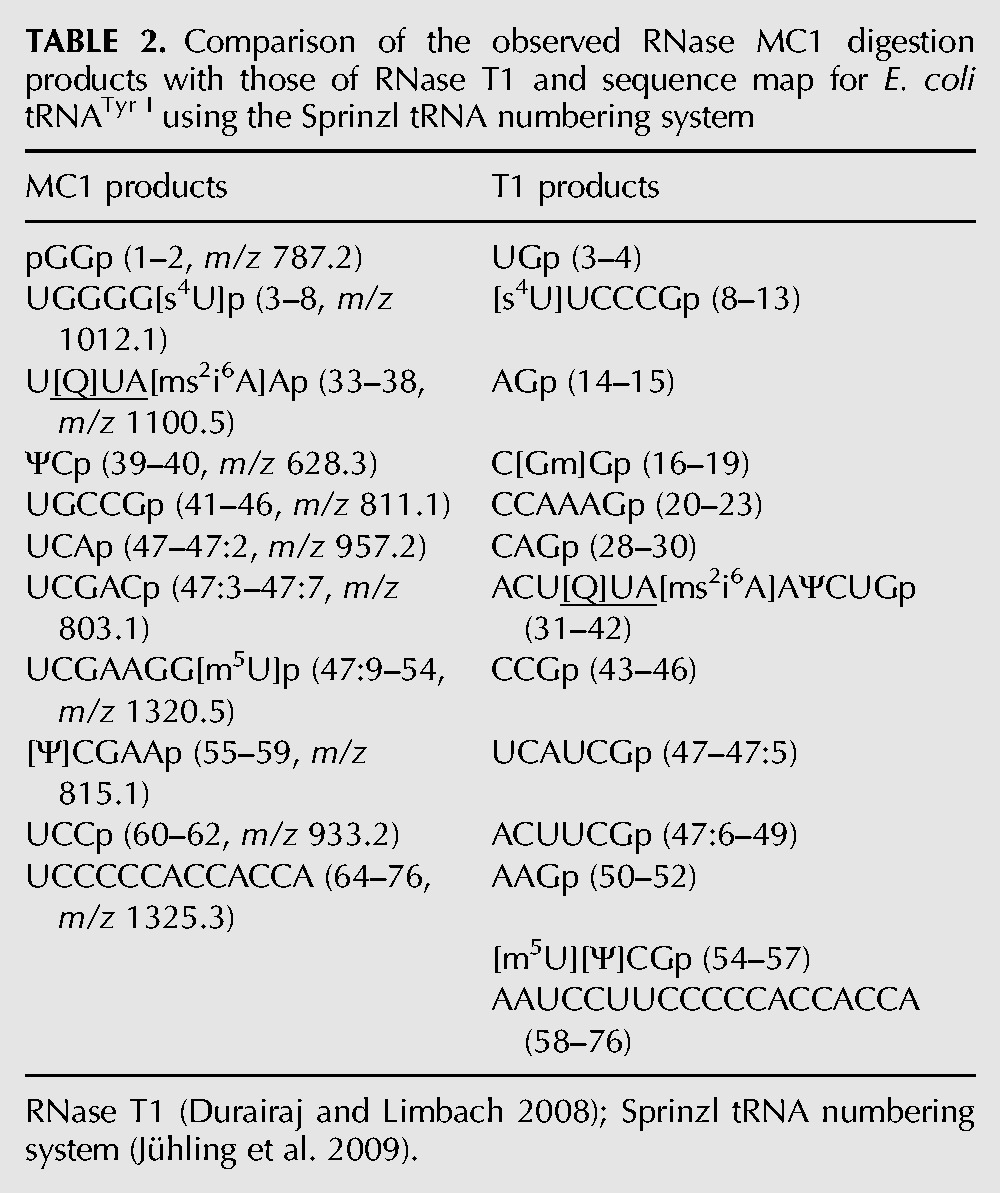
TABLE 3.
The RNases T1 and MC1 sequence maps for E. coli tRNATyr I. The combined sequence coverage for both RNase maps is >95%
Another significant advantage of RNase MC1 for RNA modification mapping by mass spectrometry is the inherent challenge in characterizing oligonucleotides containing multiple cytidines and uridines. Uridine differs from cytidine by 1 Da (O versus NH) and the presence of C-13 isotopes, which are readily detected by mass spectrometry, can easily result in challenges in differentiating the number and sequence location of these pyrimidines. This challenge is particularly noteworthy for larger digestion products wherein the “all light” (C-12) isotope peak is no longer the most abundant. Because we have shown that digestion with MC1 ensures a single uridine will be present at the 5′-terminus of each digestion product (with the bulky modification exception as noted above), the number of cytidines should also be more easily determined based on accurate mass measurements (Pomerantz et al. 1993; Meng and Limbach 2004), and prior sequence reconstruction challenges will be minimized.
The advantages of a uridine-specific nuclease that is inhibited by modifications (except pseudouridine) should also accrue in other areas. Methylated uridines, for example, should be detectable in RNA-seq analyses as each site would be missed during MC1 digestion. A comparison of RNA-seq transcripts generated using this nuclease against the genomic prediction would, therefore, reveal such post-transcriptional modifications on a genome-wide basis. Other biochemical approaches that have effectively been limited to RNase T1, such as RNA footprinting, should also benefit from an additional RNase of high specificity.
MATERIALS AND METHODS
Designing synthetic gene and cloning
Using the MC1 amino acid sequence as a template, a synthetic gene with the natural codon bias of E. coli was designed using the codon optimization tool (Fuglsang 2003) at Integrated DNA Technologies (IDT; http://www.idtdna.com/CodonOpt). _Bam_H1 and _Hind_III sites were added at the 5′ and 3′ ends, respectively, to enable cloning into the IPTG (Isopropyl β-D-1-thiogalactopyranoside)-inducible expression cassette of the pET22b vector (EMD-Millipore). Such a strategy was expected to yield an MC1 polypeptide with an N-terminal fusion of the pelB leader peptide and a C-terminal fusion of the His-tag (His)6 sequence. The pelB signal peptide is expected to direct the fusion protein to the periplasmic space, thus obviating any potential deleterious effects of ribonuclease activity on host cell RNA machinery. After confirming the sequence and reading frame of the recombinant clone through translation of the experimentally obtained sequence, Rosetta (DE3) cells bearing the recombinant pET22b-MC1 were used for MC1 production. Rosetta DE3 cells were transformed with recombinant pET22b (+) MC1 plasmid and plated on an LB-ampicillin (50 µg/mL) and chloramphenicol (34 µg/mL) plate. A single colony was then grown overnight in LB-medium supplemented with ampicillin and chloramphenicol for a starter culture. The starter culture was subsequently used to inoculate either 0.20 L (small scale) or 1 L media supplemented with antibiotics. The cells were grown in an orbital shaker at 30°C with constant shaking at 200 rpm. Expression was induced by adding IPTG to the broth media.
Optimization of protein expression conditions
Four different experimental variables were investigated to determine the optimal conditions for inducible expression of RNase MC1. Initially, different bacterial growth stages (measured by optical density at 600 nm ranging from 0.3 to 0.9 units) were evaluated for protein induction. Four different flasks of 200 mL LB media were inoculated with 2 mL from the same starter culture. One mL of cells was drawn at regular intervals (30–90 min) to measure the optical density at 600 nm. The duration of induction, effect of different growth temperatures and inducer concentrations were investigated while keeping cell culture volume constant (0.20 L). The expression conditions that produced maximum amounts of active protein as verified by a Bradford assay and SDS-PAGE were considered optimal. Each experiment was repeated at least three times to ensure reproducibility.
Ribonuclease MC1 purification
The induced MC1 protein was purified by either a batch process or column chromatography using a Nickel-Sepharose resin (Novagen) as per the manufacturer's instructions. Batch purification was employed during investigation of the optimal expression conditions, and column chromatography was performed for large-scale purification. The purified protein yield was measured by Bradford assay. The eluted protein was exchanged with 100 mM ammonium acetate (pH 5.5) buffer and concentrated using an Amicon Ultra 0.5 mL filter.
Characterization of MC1 for mapping nucleoside modifications
The presence of putative MC1 protein in the eluted fractions was confirmed by the detection of a ∼24 kDa polypeptide on 4%–20% denaturing polyacrylamide gels (Precise, Thermo Scientific). Nonspecific ribonuclease activity of the purified protein was tested by incubating 200 pmol of a substrate oligonucleotide (UAACUAUAACG) and defined amounts (100–800 ng) of protein at 37°C for 1 h in a 10-µL volume. UV-absorbance measurements at 260 nm (A260) were recorded at _T_0 and after 1 h (_T_1h) on a nanophotometer (Implen) as per the manufacturer's instructions. Buffer controls containing RNA oligomer with no protein were also assayed in an identical fashion.
The nucleoside-specific enzymatic cleavage of RNA by the purified protein was tested by incubating 3 µg of the commercially available E. coli tRNATyr I (Sigma-Aldrich) with defined amount of purified enzyme (100–2000 ng) at 37°C for 2 h and analyzing the digestion products by IP-RP-HPLC-MS as described previously (Wong et al. 2013). The digestion products were separated on a 1 × 150 mm XBridge C18 column (Waters) employing mobile phase A (200 mM hexafluoroisopropanol [HFIP] [Sigma], 8.15 mM triethylamine [TEA, Fisher Fair Lawn] in water [Burdick and Jackson, Bridgeport], pH 7.0) and mobile phase B (100 mM HFIP, 4.08 mM TEA in 50% methanol [Burdick and Jackson], pH 7.0) at a flow rate of 30 µL/min. The gradient was as follows: 5% B to 20% B in 5 min; 20% B to 30% B in 2 min; 30% B to 95% B in 43 min; hold at 95% B for 5 min, followed by equilibration for another 15 min at 5% B.
The eluted digestion products were subjected to mass analysis using a Thermo Scientific LTQ-XL mass spectrometer. The instrument settings for automatic acquisition of tandem mass spectrum of each mass-selected precursor ions were identical to those described previously (Wong et al. 2013). The sheath gas, auxiliary gas, and sweep gas at the ionization source were set to 25, 14, and 10 arbitrary units (au), respectively. The spray voltage was 4 kV, the capillary temperature was 275°C, the capillary voltage was −23 V and the tube lens was set to −80 V.
The theoretical m/z (mass/charge) values of putative digestion products (both U-specific and nonspecific) and the corresponding collision-induced dissociated (CID) fragment ions were computed using Mongo Oligo (http://mods.rna.albany.edu/masspec/Mongo-Oligo). To confirm uridine specificity for digestion, an LC-MS/MS data set from RNase MC1 digestion of E. coli tRNATyr I was acquired as described. Each MS/MS spectrum was analyzed for the presence of m/z 328.1 (A), 344.2 (G), 304.1 (C), and 305.1 (U) that correspond to the c1 product ion masses for the canonical nucleotides (McLuckey et al. 1992). Similarly, the MS/MS spectra were also examined for the presence of m/z 346.2 (A), 362.2 (G), 322.1 (C), and 323.1 (U) that correspond to the y1 product ion masses for the canonical nucleotides (McLuckey et al. 1992) assuming the digestion product was present with a 3′-linear phosphate. If none of these m/z values were observed (as in the case of longer oligomers or exclusive 2′,3′-cyclic phosphates), the m/z values corresponding to the c2 product ion combinations (e.g., UA/UG/UC/UU/AU/GU/CU) were considered.
Docking modified uridines to MC1
The crystal structure of the MC1-5′-UMP (PDBID: 1UCD) complex was retrieved from www.rcsb.org for docking simulations with various modified uridylic acid ligands including 5′-ΨMP, 5′-[s4U]MP, 5′-[s2U]MP, and 5′-[m5U]MP to the UMP binding site. The docking calculations were performed on docking server (http://www.dockingserver.com) (Huey et al. 2007; Bikadi and Hazai 2009). The ligand structures were created using the My Ligands feature. The protein preparation wizard prepared the protein and a grid-based method was employed with default parameter without any constraints. Affinity (grid) maps of 20 × 20 × 20 Å grid points and 0.375 Å spacing were generated using the Autogrid program (Morris et al. 1998). AutoDock parameter set- and distance-dependent dielectric functions were used in the calculation of the van der Waals and the electrostatic terms, respectively. Docking simulations were performed using the Lamarckian genetic algorithm (LGA) and the Solis & Wets local search method (Solis and Wets 1981). Initial position, orientation, and torsions of the ligand molecules were set randomly. Each docking experiment was derived from 100 different runs that were set to terminate after a maximum of 2.5 × 10⁶ energy evaluations. The population size was set to 150. During the search, a translational step of 0.2 Å and torsion steps of 5 were applied. The Merck Molecular Force Field (MMFF94) (Halgren 1996) was used for energy minimization of the ligand molecule.
DATA DEPOSITION
The codon-optimized nucleotide sequence has been submitted to GenBank with the accession number KT183360.
ACKNOWLEDGMENTS
We thank an anonymous reviewer for useful comments on the potential RNA-seq applications of RNase MC1. Financial support of this work was provided by the National Institutes of Health (GM58843), the National Science Foundation REU Program NSF CHE-1156449, and the University of Cincinnati.
Footnotes
REFERENCES
- Bikadi Z, Hazai E. 2009. Application of the PM6 semi-empirical method to modeling proteins enhances docking accuracy of AutoDock. J Cheminform 1: 15. [DOI] [PMC free article] [PubMed] [Google Scholar]
- Bulmer M. 1987. Coevolution of codon usage and transfer RNA abundance. Nature 325: 728–730. [DOI] [PubMed] [Google Scholar]
- Douthwaite S, Kirpekar F. 2007. Identifying modifications in RNA by MALDI mass spectrometry. Methods Enzymol 425: 3–20. [DOI] [PubMed] [Google Scholar]
- Durairaj A, Limbach PA. 2008. Improving CMC-derivatization of pseudouridine in RNA for mass spectrometric detection. Anal Chim Acta 612: 173–181. [DOI] [PMC free article] [PubMed] [Google Scholar]
- Ferrer-Miralles N, Villaverde A. 2013. Bacterial cell factories for recombinant protein production; expanding the catalogue. Microb Cell Fact 12: 113. [DOI] [PMC free article] [PubMed] [Google Scholar]
- Fuglsang A. 2003. Codon optimizer: a freeware tool for codon optimization. Protein Expr Purif 31: 247–249. [DOI] [PubMed] [Google Scholar]
- Gaston KW, Limbach PA. 2014. The identification and characterization of non-coding and coding RNAs and their modified nucleosides by mass spectrometry. RNA Biol 11: 1568–1585. [DOI] [PMC free article] [PubMed] [Google Scholar]
- Giessing AM, Kirpekar F. 2012. Mass spectrometry in the biology of RNA and its modifications. J Proteomics 75: 3434–3449. [DOI] [PubMed] [Google Scholar]
- Goodman HM, Abelson JN, Landy A, Zadrazil S, Smith JD. 1970. The nucleotide sequences of tyrosine transfer RNAs of Escherichia coli. Eur J Biochem 13: 461–483. [DOI] [PubMed] [Google Scholar]
- Halgren TA. 1996. Merck molecular force field. I. Basis, form, scope, parameterization, and performance of MMFF94. J Comput Chem 17: 490–519. [Google Scholar]
- Harris ES, Rouiller I, Hanein D, Higgs HN. 2006. Mechanistic differences in actin bundling activity of two mammalian formins, FRL1 and mDia2. J Biol Chem 281: 14383–14392. [DOI] [PubMed] [Google Scholar]
- Hossain M, Limbach PA. 2009. Multiple endonucleases improve MALDI-MS signature digestion product detection of bacterial transfer RNAs. Anal Bioanal Chem 394: 1125–1135. [DOI] [PubMed] [Google Scholar]
- Houser WM, Butterer A, Addepalli B, Limbach PA. 2015. Combining recombinant ribonuclease U2 and protein phosphatase for RNA modification mapping by liquid chromatography-mass spectrometry. Anal Biochem 478: 52–58. [DOI] [PubMed] [Google Scholar]
- Huey R, Morris GM, Olson AJ, Goodsell DS. 2007. A semiempirical free energy force field with charge-based desolvation. J Comput Chem 28: 1145–1152. [DOI] [PubMed] [Google Scholar]
- Ide H, Kimura M, Arai M, Funatsu G. 1991. The complete amino acid sequence of ribonuclease from the seeds of bitter gourd (Momordica charantia). FEBS Lett 284: 161–164. [DOI] [PubMed] [Google Scholar]
- Ikemura T. 1985. Codon usage and tRNA content in unicellular and multicellular organisms. Mol Biol Evol 2: 13–34. [DOI] [PubMed] [Google Scholar]
- Irie M, Watanabe H, Ohgi K, Minami Y, Yamada H, Funatsu G. 1993. Base specificity of two plant seed ribonucleases from Momoridica charantia and Luffa cylindrica. Biosci Biotechnol Biochem 57: 497–498. [Google Scholar]
- Jühling F, Mörl M, Hartmann RK, Sprinzl M, Stadler PF, Pütz J. 2009. tRNAdb 2009: compilation of tRNA sequences and tRNA genes. Nucleic Acids Res 37: D159–D162. [DOI] [PMC free article] [PubMed] [Google Scholar]
- Kaiser PM, Bonacker L, Witzel H, Holý A. 1975. Studies on the reaction mechanism of a ribonuclease II from Aspergillus oryzae (author's transl.). Hoppe Seylers Z Physiol Chem 356: 143–155. [PubMed] [Google Scholar]
- Kowalak JA, Pomerantz SC, Crain PF, McCloskey JA. 1993. A novel method for the determination of post-transcriptional modification in RNA by mass spectrometry. Nucleic Acids Res 21: 4577–4585. [DOI] [PMC free article] [PubMed] [Google Scholar]
- Krivos KL, Addepalli B, Limbach PA. 2011. Removal of 3′-phosphate group by bacterial alkaline phosphatase improves oligonucleotide sequence coverage of RNase digestion products analyzed by collision-induced dissociation mass spectrometry. Rapid Commun Mass Spectrom 25: 3609–3616. [DOI] [PubMed] [Google Scholar]
- Luhtala N, Parker R. 2010. T2 Family ribonucleases: ancient enzymes with diverse roles. Trends Biochem Sci 35: 253–259. [DOI] [PMC free article] [PubMed] [Google Scholar]
- Machnicka MA, Milanowska K, Osman Oglou O, Purta E, Kurkowska M, Olchowik A, Januszewski W, Kalinowski S, Dunin-Horkawicz S, Rother KM, et al. 2013. MODOMICS: a database of RNA modification pathways---2013 update. Nucleic Acids Res 41: D262–D267. [DOI] [PMC free article] [PubMed] [Google Scholar]
- Martínez-Ruiz A, García-Ortega L, Kao R, Oñaderra M, Mancheño JM, Davies J, Martínez del Pozo Á, Gavilanes JG. 2000. Ribonuclease U2: cloning, production in Pichia pastoris and affinity chromatography purification of the active recombinant protein. FEMS Microbiol Lett 189: 165–169. [DOI] [PubMed] [Google Scholar]
- McLuckey SA, Van Berker GJ, Glish GL. 1992. Tandem mass spectrometry of small, multiply charged oligonucleotides. J Am Soc Mass Spectrom 3: 60–70. [DOI] [PubMed] [Google Scholar]
- Meng Z, Limbach PA. 2004. RNase mapping of intact nucleic acids by electrospray ionization Fourier transform ion cyclotron resonance mass spectrometry (ESI-FTICRMS) and 18O labeling. Int J Mass Spectrom 234: 37–44. [Google Scholar]
- Morris GM, Goodsell DS, Halliday RS, Huey R, Hart WE, Belew RK, Olson AJ. 1998. Automated docking using a Lamarckian genetic algorithm and an empirical binding free energy function. J Comput Chem 19: 1639–1662. [Google Scholar]
- Nakagawa A, Tanaka I, Sakai R, Nakashima T, Funatsu G, Kimura M. 1999. Crystal structure of a ribonuclease from the seeds of bitter gourd (Momordica charantia) at 1.75 A resolution. Biochim Biophys Acta 1433: 253–260. [DOI] [PubMed] [Google Scholar]
- Novikova IV, Hennelly SP, Sanbonmatsu KY. 2013. Tackling structures of long noncoding RNAs. Int J Mol Sci 14: 23672–23684. [DOI] [PMC free article] [PubMed] [Google Scholar]
- Numata T, Kimura M. 2001. Contribution of Gln9 and Phe80 to substrate binding in ribonuclease MC1 from bitter gourd seeds. J Biochem 130: 621–626. [DOI] [PubMed] [Google Scholar]
- Numata T, Suzuki A, Yao M, Tanaka I, Kimura M. 2001. Amino acid residues in ribonuclease MC1 from bitter gourd seeds which are essential for uridine specificity. Biochemistry 40: 524–530. [DOI] [PubMed] [Google Scholar]
- Numata T, Suzuki A, Kakuta Y, Kimura K, Yao M, Tanaka I, Yoshida Y, Ueda T, Kimura M. 2003. Crystal structures of the ribonuclease MC1 mutants N71T and N71S in complex with 5′-GMP: structural basis for alterations in substrate specificity. Biochemistry 42: 5270–5278. [DOI] [PubMed] [Google Scholar]
- Pomerantz SC, Kowalak JA, McCloskey JA. 1993. Determination of oligonucleotide composition from mass spectrometrically measured molecular weight. J Am Soc Mass Spectrom 4: 204–209. [DOI] [PubMed] [Google Scholar]
- Puri P, Wetzel C, Saffert P, Gaston KW, Russell SP, Cordero Varela JA, van der Vlies P, Zhang G, Limbach PA, Ignatova Z, et al. 2014. Systematic identification of tRNAome and its dynamics in Lactococcus lactis. Mol Microbiol 93: 944–956. [DOI] [PMC free article] [PubMed] [Google Scholar]
- Solis FJ, Wets RJB. 1981. Minimization by random search techniques. Math Oper Res 6: 19–30. [Google Scholar]
- Suzuki A, Yao M, Tanaka I, Numata T, Kikukawa S, Yamasaki N, Kimura M. 2000. Crystal structures of the ribonuclease MC1 from bitter gourd seeds, complexed with 2′-UMP or 3′-UMP, reveal structural basis for uridine specificity. Biochem Biophys Res Commun 275: 572–576. [DOI] [PubMed] [Google Scholar]
- Torres AG, Batlle E, Ribas de Pouplana L. 2014. Role of tRNA modifications in human diseases. Trends Mol Med 20: 306–314. [DOI] [PubMed] [Google Scholar]
- Van Dijk EL, Jaszczyszyn Y, Thermes C. 2014. Library preparation methods for next-generation sequencing: tone down the bias. Exp Cell Res 322: 12–20. [DOI] [PubMed] [Google Scholar]
- Wong SY, Javid B, Addepalli B, Piszczek G, Strader MB, Limbach PA, Barry CE III. 2013. Functional role of methylation of G518 of the 16S rRNA 530 loop by GidB in Mycobacterium tuberculosis. Antimicrob Agents Chemother 57: 6311–6318. [DOI] [PMC free article] [PubMed] [Google Scholar]
- Wurst RM, Vournakis JN, Maxam AM. 1978. Structure mapping of 5′-32P-labeled RNA with S1 nuclease. Biochemistry 17: 4493–4499. [DOI] [PubMed] [Google Scholar]