Induction of autophagy and apoptosis by miR-148a through the sonic hedgehog signaling pathway in hepatic stellate cells (original) (raw)
. 2015 Aug 15;5(9):2569–2589.
Abstract
Autophagy is an evolutionarily conserved biological process that is activated in response to stress. Increasing evidence indicate that dysregulated miRNAs significantly contribute to autophagy and are thus implicated in various pathological conditions, including hepatic fibrosis. MiR-148a, a member of the miR-148/152 family, has been found to be downregulated in hepatic fibrosis and human hepatocellular carcinoma. However, the role of miR-148a in the development of hepatic fibrosis remains largely unknown. In this study, we describe the epigenetic regulation of miR-148a and its impact on autophagy in hepatic stellate cells (HSCs), exploring new targets of miR-148a. We found that miR-148a expression was significantly increased under starvation-induced conditions in LX-2 and T-6 cells. In addition, dual-luciferase reporter assays showed that miR-148a suppressed target gene expression by directly interacting with the 3’-untranslated regions (3’-UTRs) of growth arrest-specific gene 1 (Gas1) transcripts. Intriguingly, Gas1, which encodes a Hedgehog surface binding receptor and facilitates the Hedgehog (Hh) signaling pathway, inhibited autophagosome synthesis. Furthermore, we demonstrated a novel function for miR-148a as a potent inducer of autophagy in HSCs. Overexpressing of miR-148a increased autophagic activity, which inhibited proliferation and promoted apoptosis in HSCs. In conclusion, these data support a novel role for miR-148a as a key regulator of autophagy through the Hh signaling pathway, making miR-148a a potential candidate for the development of novel therapeutic strategies.
Keywords: miR-148a, hepatic stellate cells, hedgehog signaling pathway, autophagy, growth arrest-specific gene 1, hepatocellular carcinoma
Introduction
Hepatic fibrosis is a complex pathological process in liver tissue that is characterized by the excessive accumulation and altered deposition of extracellular matrix (ECM). Hepatic fibrosis develops after sustained chronic liver injury in response to oxidative stress and may progress to cirrhosis and hepatocellular carcinoma (HCC) [1]. In recent decades, hepatic fibrosis has become an urgent clinical problem due to the growing prevalence of metabolic syndrome. Perisinusoidal hepatic stellate cells (HSCs) play a predominant role in the pathophysiology of hepatic fibrosis [2]. The activation and phenotypic transformation of HSCs into myofibroblast-like cells is a pivotal mechanism that is attractive for research into the treatment of liver fibrogenesis. Recently, growing evidence has demonstrated that HSCs activation involves various cellular processes, including autophagy and microRNAs (miRNAs) [3,4].
Autophagy is a fundamental and highly evolutionarily conserved intracellular self-digestive process that balances cellular energy metabolism via degradation, quality control of intracellular organelles and the recycling redundant cytoplasmic proteins [5]. Autophagy is stimulated by several metabolic stress, including starvation and hypoxia, and autophagy dysfunction is intimately associated with various human diseases, including cancer, inflammation, neurodegenerative diseases and hepatic fibrosis [6]. Multiple studies have shown that autophagy is controlled by multiple central signaling pathways such as the PI3K/Akt/mTOR pathway [7], the ROS/JNK pathway [8], and the Hedgehog (Hh) pathway [9]. Previous in vitro and in vivo studies have demonstrated that the autophagy machinery participates in the activation of HSCs, and the inhibition of autophagy substantially decreases collagen production [10]. Although these recent findings demonstrate a role for autophagy in liver fibrosis, further investigation of the molecular mechanisms that regulate autophagy is still needed, and whether autophagy regulators are beneficial in the treatment of hepatic fibrosis remains to be elucidated.
The Hh signaling pathway plays a pivotal role in regulating critical cell fate decisions and is involved in wound-healing responses in a number of adult tissues, including the liver [11]. Hh signaling has been shown to promote proliferation, inhibit apoptosis and accelerate the epithelial-to-mesenchymal transition (EMT) in biliary epithelial cells and HSCs [12]. In addition, recent studies have suggested that the Hh pathway, which plays a key role during development, negatively regulates autophagy under both basal and induced conditions [13]. Pharmacological or genetic inhibition of the Hh signaling pathway markedly induces autophagy in CML cells [14], pancreatic ductal adenocarcinoma cells [15] and human HCC cells [16,17].
MiRNAs are a family of endogenous non-coding RNA molecules that range approximately 18-22 nucleotides in length and can post-transcriptionally regulate gene expression by preferentially interact with the 3’-untranslated regions (3’-UTRs) of target mRNAs to modulate translational efficiency and/or mRNA stability [18]. MiRNAs play an essential role in many fundamental cellular processes including apoptosis, proliferation, differentiation, oncogenesis and autophagy, and studies have shown that aberrant miRNA expression is closely associated with liver fibrosis [19]. Meanwhile, miRNA expression may function as a novel regulator of the Hh signaling pathway. MiR-326 acts downstream of the sonic hedgehog signaling and regulates the expression of Gli2 and smoothened in embryonic mouse lungs [20]. MiR-506 acts as a tumor suppressor by directly targeting Hh signaling pathway transcription factor Gli3 in human cervical cancer [21]. Moreover, over a dozen miRNAs have recently been determined to directly regulate autophagic signaling by altering the intracellular levels of key autophagy related proteins, including miR-142a-3p, miR-221, miR-216a, and miR-106b [22-25]. Among these differentially expressed miRNAs, miR-148a particularly attracted our attention because it has been found to be downregulated in hepatic fibrosis, cirrhosis, and hepatocellular carcinoma. MiR-148a, a member of the miR-148/152 family, is differently expressed in tumor and non-tumor tissues and is involved in the onset and progression of disease [26]. Gailhouste et al. found that miR-148a was important for hepatic differentiation through its direct targeting of DNA methyltransferase (DNMT) 1 and that miR-148a exerted a beneficial effect by repressing of HCC cell malignancy in hepatocyte maturation [27]. MiR-148a may arrest Met/Snail signaling and therefore inhibit EMT and metastasis in HCC cells [28]. Intriguingly, growth arrest-specific gene 1 (Gas1), a predicted miR-148a target that encodes an Hh surface binding receptor, can positively regulate and facilitate Hh signaling [29] and consequently inhibit autophagic activity.
In the present study, we report that Gas1 is a direct target of miR-148a and further demonstrate that Gas1 enhances the activation of Hh signaling and reduces autophagic activity in HSCs. In addition, we demonstrate that miR-148a is a potential inducer of autophagy through the suppression of Hh signaling under starvation conditions. More importantly, miR-148a overexpression may inhibit proliferation and promote apoptosis by inducing autophagy in HSCs. Our results provide novel mechanistic insight into the role of miR-148a in autophagy and thus suggest new therapeutic approaches for the future treatment of liver fibrosis and prevention of hepatocellular carcinoma.
Materials and methods
Plasmids, antibodies, and reagents
The previously described plasmids pEGFP-LC3 (human) [30] (Addgene, plasmid #24920, Cambridge, MA, USA) and pBABEpuro GFP-LC3 (rat) (Addgene, plasmid #22405, Cambridge, MA, USA) [31] were obtained from the Addgene plasmid repository and used for in vitro assays. The following antibodies were purchased from Santa Cruz Biotechnology: Rabbit polyclonal anti-human (Rat) Gas1, Patch1, Gli1 (1:2,000, Santa Cruz, CA, USA) and rabbit anti-human GAPDH antibody (1:1,000, Santa Cruz, CA, USA). Rabbit anti-human (Rat) LC3B, p62, and goat anti-rabbit horseradish peroxidase (HRP)-conjugated secondary antibody (1:1,000, Cell Signaling, Danvers, MA, USA) were obtained from Cell Signaling Technology. Other reagents were obtained as follows: bafilomycin a1 (Baf a1), Purmorphamine (Pur), and Cyclopamine (Cyc) were obtained from Selleck Chemicals Co. Ltd (Houston, TX, USA). MTT (3-(4, 5-dimethylthiazol-2-yl)-2, 5-diphenyltetrazolium bromide) was obtained from Millipore (MTT reagent A, 5 mg/ml, Millipore). All antibodies and reagents were used according to the manufacturers’ protocols.
Cell lines and cell culture
The spontaneously immortalized human HSCs line LX-2 and rat T-6 cells, which exhibit the typical features of activated hepatic stellate cells (generous gifts from Professor Scott Friedman, Mount Sinai School of Medicine, New York, NY and Professor Lie-Ming Xu, Shanghai University of Traditional Chinese Medicine, Shanghai, China, respectively), were maintained on plastic culture plates or glass chamber slides in Dulbecco’s modified Eagle’s medium (DMEM, high glucose) supplemented with 10% heat-inactivated fetal bovine serum (FBS; Sigma Chemical Co, St. Louis, MO, USA), 100 U.ml-1 streptomycin sulfate and 100 U.ml-1 penicillin G sodium salt. The cells were incubated at 37°C, 5% CO2 in a humidified atmosphere, and the media was replaced every 2 days. The cells were subsequently treated for different experimental purposes.
MiRNA and siRNA transfection
Exponentially growing LX-2 and T-6 cells were plated in six-well plates at 2 × 10⁵ and 4 × 10⁵ cells per well, respectively. Generally, cells were transfected at 70-80% confluence. The synthetic miR-148a mimic, the inhibitor and the negative control (NC) were purchased from Ambion GenePharma Co. Ltd (Austin, Texas, USA). Gas1 siRNA was purchased from Santa Cruz Biotechnology, Inc. (sc-37435#, Santa Cruz, CA, USA). LX-2 or T-6 cells were transiently transfected with the miR-148a mimic, the inhibitor or the negative control (NC) for 48 h. HSCs were transfected using Lipofectamine™ 2000 (Invitrogen, Carlsbad, CA, USA) for 72 h to transfect plasmids encoding GFP-LC3 or Gas1 siRNA according to the manufacturer’s protocol. Transfection efficiency was estimated to be between 70-80% in all cases based on transfection with a GFP expressing plasmid. No treatment was used as a blank control for all experiments. Equal amounts of Gas1 siRNAs were used as follows: hsa-5’-GCU GCA GAG AUA ACC GGC UGA UCU A-3’ and 5’-CGG CUG AUC UAU ACU GCC AGC UCU A-3’ [32]; Rat-5’-CAT GGC CCG CCT GTG CTT CGG-3’ and 5’-GCC GAA GCA CAG GCG GCC ATG-3’.
Target prediction and dual-luciferase reporter assay
The predicted miR-148a target genes were retrieved from the TargetScan (http://www.targetscan.org), Miranda (http://www.microrna.org) and miRTarBase (http://mirtarbase.mbc.nctu.edu.tw) database. Gas1, a glycosylphosphatidyl-inositol-linked membrane glycoprotein, was one of the potential candidates, that caught our attention because it encodes a Hedgehog surface binding receptor and facilitates Hh signaling and because of the putative miR-148a binding sequences in the 3’-UTRs of the Gas1 mRNA.
To assess whether Gas1 was a direct target of miR-148a, a dual-luciferase® reporter assay was performed. Briefly, 293T cells (2 × 10⁴ cells/well) were plated in a 24-well plate and co-transfected with 20 nM of miRNA control or miR-148a, 5 ng of pRL-TK (Promega, Madison, WI, USA) using Lipofectamine™ 2000 (Life Technologies) and 10 ng of firefly luciferase reporter that containing the wild-type or mutant-type Gas1 3’-UTRs. The pRL-TK vector was co-transfected as an internal control to correct for the differences in both transfection and harvest efficiency. Transfections were performed in duplicate and repeated in three independent experiments, and the results were normalized to pRL-TK luciferase activity. Luciferase activities were analyzed with a Dual-Luciferase Reporter Assay System (Promega, Madison, WI, USA) on a Microplate Fluorescence Reader (Winooski, VT, USA) 48 h after transfection.
RNA extraction and quantitative reverse-transcription PCR (qRT-PCR) of mRNA and miRNA
Total RNA, including miRNA, was extracted from cultured LX-2 and T-6 cells 48 h after transfection or treatment using an Invitek Mini Kit (74106) (Invitek) or TRIzol reagent (Invitrogen, Brooklyn, NY, USA) according to the manufacturer’s instructions. QRT-PCR was performed using reverse transcription kit (Takara, RR047A) and SYBR Green PCR Master Mix (Takara, RR716). Briefly, RNA (2 μg) was used as a template for cDNA synthesis with high capacity cDNA synthesis kit and random primers. Then, the cDNA templates were mixed with gene-specific primers for Gas1 and for the internal control GAPDH, as well as Taqman 2 × universal PCR master mix. An applied Biosystems 7500 Real-Time PCR machine (Applied Biosystems, Foster City, CA, USA) was used and programmed as follows: 50°C, for 2 min; 95°C, for 10 min; 95°C, for 15 s; 60°C, for 1 min, with the latter two steps repeated for 40 cycles. For the quantification of miR-148a, 10 ng of RNA was used as a template, and cDNA was synthesized with miRNA-specific primers. The results were normalized to GAPDH or U6 expression. Fluorescence signals from each sample were collected at the end point of every cycle, and the expression levels of the genes and of miR-148a were calculated using the double delta Ct method based on the internal controls, normalized to the control group and plotted as relative values (RQ). Data were collected from three separate experiments. The following primer sequences were used for qRT-PCR: GAPDH primers: 5’-AGC CAC ATC GCT CAG ACA C-3’; 5’-GCC CAA TAC GAC CAA ATC C-3’; miR-148a primers: 5’-ACA CTC CAG CTG GGT CAG-3’; 5’- CTC AAC TGG TGT CGT GGA-3’; Gas1 primers: 5’-CGG AGC TTG ACT TCT TGG A-3’; 5’-TCA GCA CCT TCC CTT TCG A-3’; LC3B primers: 5’-CGA CTT ATT CGA GAG CAG CA-3’; 5’-ACC TCT GAG ATT GGT GTG GA-3’; P62 primers: 5’-ATG CTG TCC ATG GGC TTC TC-3’; 5’-GCC GCT CCG ATG TCA TAG TT-3’; U6 primers: 5’-CTC GCT TCG GCA GCA CA-3’; 5’-AAC GCT TCA CGA ATT TGC GT-3’.
Protein extraction and western blotting
Proteins were extracted 48 h after transfection using 100 μl of 1 × RIPA buffer (Cell Signaling, Danvers, MA, USA). Protein concentrations were measured using BCA protein assay kit (Bio-Rad, Hercules, CA, USA). Cell extracts (30 μg) were separated via 10% sodium dodecyl sulfate polyacrylamide gel electrophoresis (SDS-PAGE) and then transferred onto polyvinylidene difluoride (PVDF) membranes (Millipore, MA, USA). The membranes were blocked with 5% skim milk in TBS/0.5% Tween-20 (TBS-T) for 1 h at room temperature. Then, the membranes were incubated with specific primary antibodies overnight at 4°C with gentle shaking. After three washes with PBS-Tween-20 (PBS-T, 0.05%), appropriate secondary horseradish peroxidase (HRP)-conjugated antibodies (Jackson ImmunoResearch, West Grove, PA, USA) were used at 1:2,000, and the membranes were incubated for 1 h at room temperature. Goat anti-rabbit monoclonal antibodies for GAPDH (1:1000, Santa Cruz, CA, USA) were used for normalization. The results were visualized using an enhanced chemiluminescence detection system (Amersham Biosciences, Piscataway, NJ, USA). All western blot results were scanned and semi-quantized using Image Pro-Plus 6.0 software (Media Cybernetics, Rockville, MD, USA).
Fluorescence microscopy analyses
To monitor the formation of green fluorescent protein (GFP-LC3) puncta, LX-2 and T-6 cells were seeded on glass cover slips and transient transfection was performed on 100-mm plates with 3 mg GFP-LC3 plasmid using Lipofectamine™ 2000 (Invitrogen) according to the manufacturer’s instructions. After treatment, the cells were rapidly washed three times with sterile PBS and fixed at room temperature for 15 min with a 4% paraformaldehyde solution. After two washes with PBS, the cells were blocked with 1% bovine serum albumin in TBS-T and then mounted. Cells with a mostly diffuse distribution of GFP-LC3 in the cytoplasm and nucleus were considered non-autophagic, whereas cells with intense GFP-LC3 aggregates in the cytosol but not in the nucleus were classified as autophagy. The number of GFP-LC3 puncta/cell was evaluated as the total number of puncta divided by the number of nuclei in each microscopic field. GFP-LC3 puncta formation was determined by capturing images on an Olympus FV1000 confocal microscope (Olympus). The number of GFP-LC3 puncta per cell was counted from at least 200 cells in at least 3 independent experiments.
Transmission electron microscope analysis
To morphologically demonstrate the induction of autophagy, an ultrastructural analysis was performed. LX-2 and T-6 cells were fixed for 1 h with a solution containing 2% paraformaldehyde, 2.5% glutaraldehyde, and 0.2 M sodium cacodylate buffer (pH 7.4) at room temperature. Fixed cells were suspended in a buffered solution containing 1% osmic acid for 1 h, dehydrated in a graded ethanol series (60, 70, 95, and 100% for 2 × 20 min), washed with acetone, and embedded into EPON epoxyresin. Ultrathin sections (60-80 nm) were prepared on an ultramicrotome and double-stained with uranyl acetate and lead citrate. The amount of autophagic vacuoles per cytoplasmic area was examined and photographed on a Hitachi H-600 transmission electron microscope (Hitachi 600; Hitachi, Tokyo).
Cell proliferation and apoptosis assay
The proliferation of LX-2 and T-6 cells was assessed using an MTT [3-(4, 5- dimethylthiazol-2-yl)-2, 5-dimethyl tetrazolium bromide] assay according to the manufacturer’s instructions (MTT reagent A, 5 mg/ml, Millipore). Briefly, LX-2 and T-6 cells were plated in 96-well plates at a density of 3 × 10⁵ cells/ml. Twenty microliters of reaction solution was added to the cultured cells in 100 ul of culture medium with a final concentration of 0.5 mg/ml and incubated at 37°C for 1.5 h. The optical density was measured at 490 nm using a spectrophotometry (PerkinElmer Inc., Boston, MA, USA).
The cells were seeded into 6-well plates and then transfected with the miR-148a mimic or the inhibitor or their negative controls. After 48 h, the cells were harvested, and the ratio of apoptosis was determined using the Annexin V Apoptosis Detection Kit (Invitrogen, Carlsbad, CA, USA). Apoptotic cells were examined and quantified using flow cytometry (BD Biosciences, Franklin Lakes, NJ, USA). For each experiment, measurements were carried out in triplicate.
Statistical analysis
All data are presented as the means ± standard deviation (means ± SD) from at least three independent experiments, and representative data are reported. Unpaired Student’s t test or one-way analysis of variation was used to determine the significance, using the GraphPad Prism version 6.0 software (GraphPad Software Inc., San Diego, CA, USA). P < 0.05 was considered statistically significant.
Results
Starvation induces miR-148a upregulation in a time-dependent manner
To investigate the role of miR-148a in starvation-induced autophagy, we first performed qRT-PCR to examine the expression levels of miR-148a in LX-2 and T-6 cells at different time in response to starvation conditions. As shown in Figure 1, the basal miR-148a expression levels was very low under normal culture conditions (DMEM, high glucose), whereas treatment with Earle’s balanced salt solution (EBSS) (starved cells) induced a sustained, time-dependent upregulation of miR-148a in both cell lines. At 4 h after starvation, miR-148a expression was increased by more than an approximately 8-fold compared with normal culture conditions.
Figure 1.
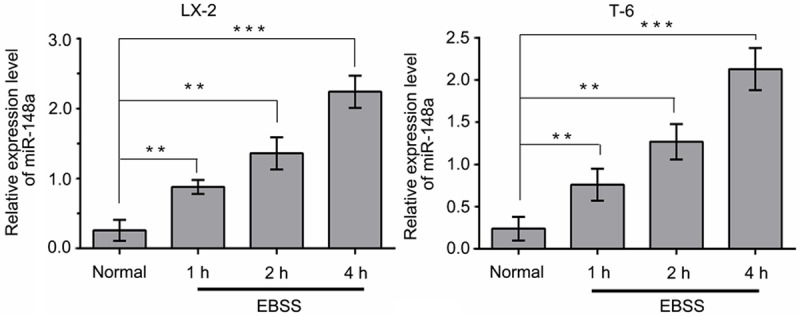
Starvation induces a sustained upregulation of endogenous miR-148a in a time-dependent manner. QRT-PCR was used to analyze endogenous miR-148a expression in LX-2 and T-6 cells incubated in EBSS for 1, 2, 4 h or under normal culture condition (Data shown as the means ± SD of three independent experiments. **P < 0.01, ***P < 0.001, unpaired Student’s t-test).
Gas1 is a direct target of miR-148a in HSCs
Bioinformatic prediction using Targetscan, miRTarBase and Miranda revealed a putative miR-148a binding site at position 781-787 (UGCACUG) in the 3’-UTRs of the Gas1 mRNA (Figure 2A). Therefore, to further validate the effect of miR-148a on Gas1 mRNA, the full-length 3’-UTRs from Gas1 mRNA, containing either wild-type or mutated miR-148a binding sites (Gas1-wt 3’-UTRs or Gas1-mut 3’-UTRs), was cloned and inserted downstream of the firefly luciferase gene in a luciferase reporter vector. These vectors were then transfected into 293T cells along with miR-148a or a negative control miRNA. Co-transfecting miR-148a and the wild-type luciferase vector into 293T cells resulted in a remarkable decrease in luciferase activity relative to the negative control miRNA. In contrast, miR-148a had no significant effect on the levels of luciferase activity in cells expressing the mutant construct (Figure 2B). These results demonstrate that miR-148a directly interacts with the 3’-UTRs of Gas1 mRNA with high specificity.
Figure 2.
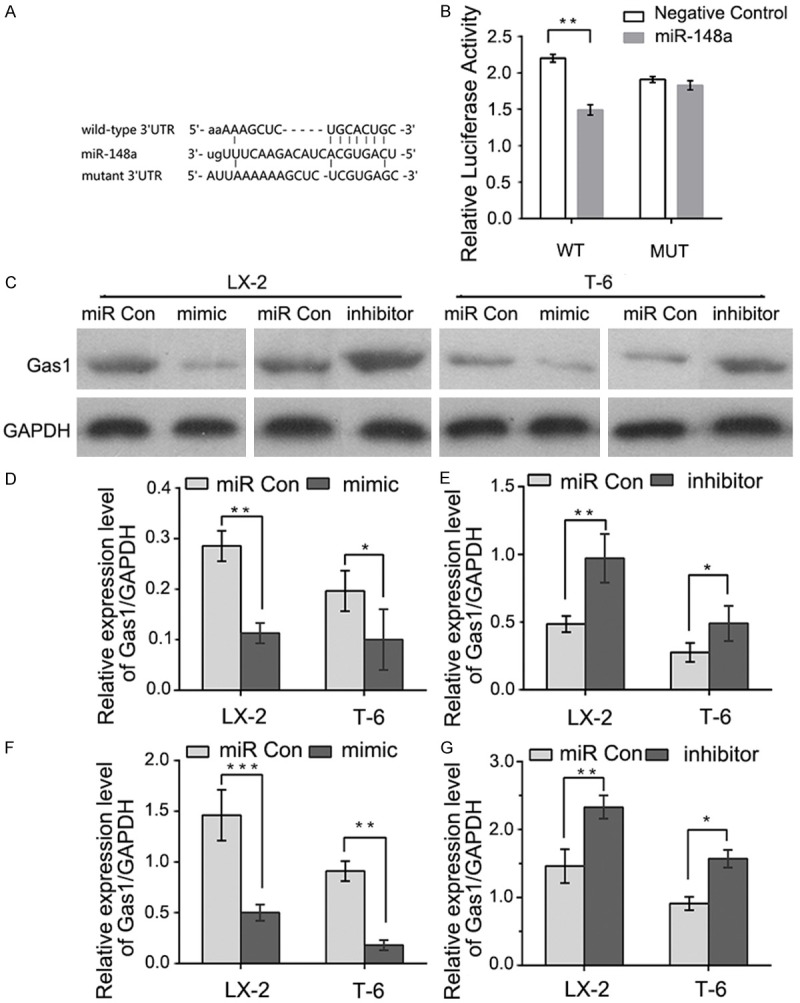
Gas1 is a direct target of miR-148a. A: A putative miR-148a binding site in the 3’-UTRs of Gas1 mRNA. Mutations were generated in the complementary domain that directly binds to the seed region of miR-148a. B: The miR-148a mimic suppressed the activity of a firefly luciferase that carried the wild-type Gas1 3’-UTRs but not the mutant 3’-UTRs. 293T cells were co-transfected with a firefly luciferase reporter plasmid that contained either the wild-type (WT) or mutant (MUT) 3’-UTRs from the Gas1 mRNA. Relative luciferase expression was normalized to Renilla activity. C and D: Gas1 protein levels decreased following miR-148a overexpression in LX-2 and T-6 cells. Immunoblots were used to analyze Gas1 protein levels in cells transfected with miR-148a mimic or scrambled (miR Con). GAPDH served as an internal control. C and E: Immunoblot analysis of LX-2 and T-6 cells treated with the miR-148a inhibitor showed recovery of Gas1 expression. F and G: qRT-PCR analysis of Gas1 mRNA levels in LX-2 and T-6 cells transfected with scrambled miRNA (miR Con), miR-148a mimic or inhibitor. The results represent means ± SD, *P < 0.05, **P < 0.01, ***P < 0.001. All experiments were repeated at least three times, unpaired Student’s t-test.
To further corroborate this hypothesis, we also examined whether miR-148a overexpression and anti-miR-148a could alter Gas1 protein levels in LX-2 and T-6 cells. As expected, compared with negative control miRNA, cells transfected with the miR-148a mimic showed significantly reduced Gas1 protein expression (Figure 2C and 2D). In contrast, transfection with the miR-148a inhibitor markedly increased Gas1 protein expression compared with the negative control group (Figure 2C and 2E). Consistent with the results of western blotting, qRT-PCR also confirmed that the miR-148a mimic significantly suppressed Gas1 mRNA expression, and Gas1 mRNA levels recovered after treatment with the miR-148a inhibitor in LX-2 and T-6 cells (Figure 2F and 2G). These results indicate that Gas1 is a direct functional target of miR-148a.
Gas1 inhibits autophagy in hepatic stellate cells
A gradual increase in the levels of the low-molecular-weight microtubule-associated protein light chain 3-II (LC3-II) and a decrease in SQSTM1/p62 protein levels are reliable hallmarks of autophagy and are directly relevant to an increase in the number of autophagosomes. To determine whether autophagic activity is altered with Gas1 treatment in HSCs lines, LX-2 and T-6 cells were cultured for 4 h in EBSS medium to induce autophagy, and the effect of Gas1 on the autophagy related proteins LC3-II and SQSTM1/p62 were examined. After LX-2 and T-6 cells were treated with different concentrations of Gas1 (0, 0.25 μg/μl, 0.5 μg/μl, 0.75 μg/μl) for 48 h, LC3-II protein expression was detected by western blot analysis. Gas1 caused a gradual, dose-dependent reduction in LC3-II levels. Meanwhile, the LC3-II/LC3-I ratio showed a decreasing trend in the presence of different concentrations of Gas1 (Figure 3A-C). Additionally, SQSTM1/p62, a polyubiquitin-binding protein and selective autophagic substrate that can act as a cargo receptor for the degradation of damaged or long-lived proteins and that is normally degraded during autophagy also exhibited a dramatic, dose-dependent increased following by Gas1 treatment compared with the negative control group (Figure 3A, 3B and 3D), indicating that Gas1 may inhibit autophagic flux in LX-2 and T-6 cells. Furthermore, transmission electron microscopy (TEM) was utilized to visualize autophagosomes in the cytoplasm of LX-2 and T-6 cells. A typical autophagosome was defined as a double-membraned structure containing intracellular organelles and cytoplasmic contents such as mitochondria, endoplasmic reticulum and ribosomes. As shown in Figure 3E, double-membraned autophagosomes could be easily observed in the cells that were cultured in the EBSS medium but were less prevalent in cells that had been treated with Gas1 (0.75 μg/μl). Finally, specific siRNAs were used to inhibit the endogenous expression of Gas1 in LX-2 and T-6 cells. At 72 h post-transfection, Gas1 protein expression was greatly decreased compared with cells treated with negative control siRNA (Figure 3F). The levels of LC3-II conversion and SQSTM1/p62 expression were determined by western blot analysis; the expression of LC3-II in cells cultured in EBSS medium was elevated by Gas1 siRNA, but no effect was observed with scrambled siRNA (si Con). Similarly, SQSTM1/p62 expression was decreased by Gas1 siRNA (Figure 3G and 3I). These results support a critical role for Gas1 in regulating of autophagy in LX-2 and T-6 cells.
Figure 3.
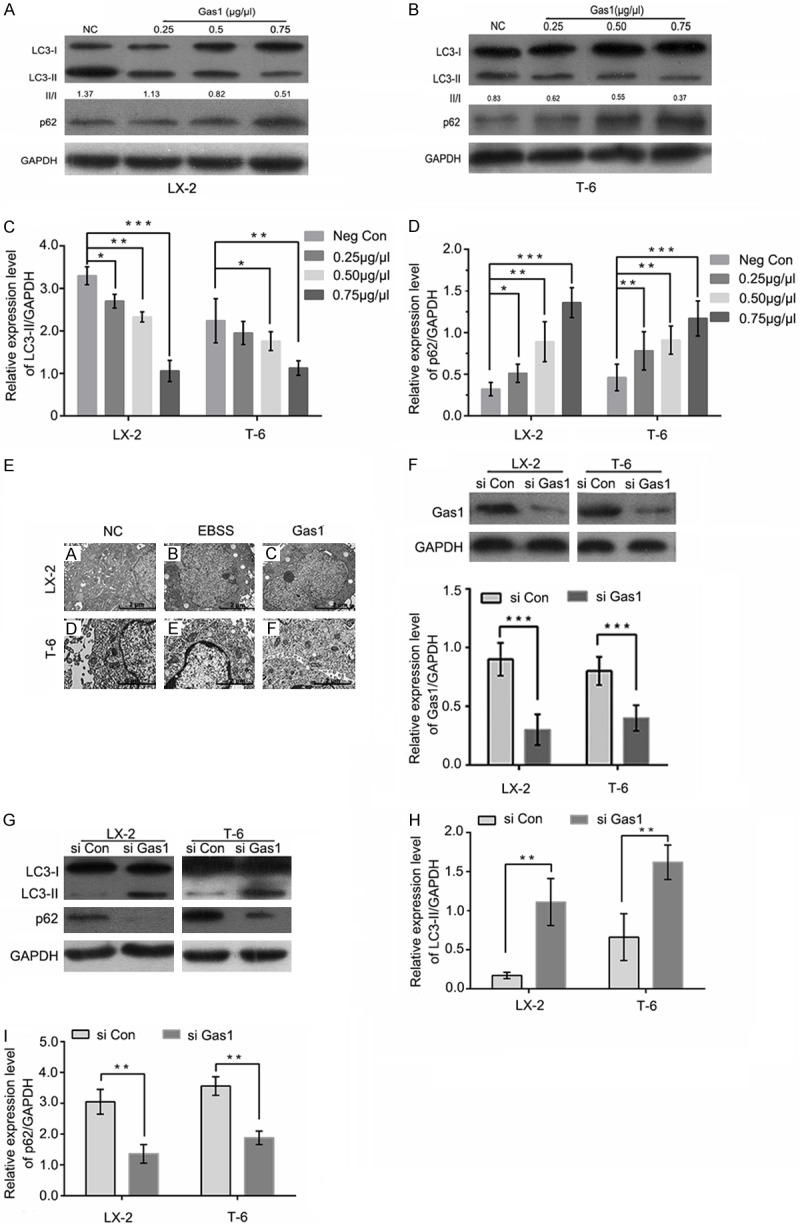
Gas1 inhibits autophagy in LX-2 and T-6 cells. (A and B) LX-2 and T-6 cells were pretreated with EBSS for 4 h. After 48 h of treatment with different concentrations of Gas1 or the negative control, western blotting was performed to detect LC3B and p62 levels, and the densitometry of LC3-II normalized to GAPDH is labeled under each lane. The changes in autophagic flux are shown in (C and D) respectively. Gas1 expression decreased starvation-induced LC3-I to LC3-II conversion and inhibited SQSTM1/p62 degradation in a dose-dependent manner. GAPDH was used as a loading control. (E) The ultrastructures of LX-2 and T-6 cells were analyzed by transmission electron microscopy (TEM). The cells were treated with EBSS for 4 h prior to the addition of 0.75 μg/μl Gas1. TEM images show autophagic vacuoles containing organelles and lamellar, vesicular structures. Control sample received no Gas1 treatment (Scale bars, 2 µm, and 10,000 × direct magnification). (F) LX-2 and T-6 cells were transfected with specific siRNAs for Gas1 and lysed after 72 h. Western blotting showed that Gas1 siRNA could knock down protein expression with high efficiency. (G and I) LX-2 and T-6 cells were treated in the absence or presence of Gas1 siRNA for 72 h. LC3-II and p62 expression levels were analyzed by western blotting. The data are presented as the means ± SD of at least three independent experiments. *P < 0.05, **P < 0.01, ***P < 0.001, unpaired Student’s t-test, versus control group.
The Hedgehog pathway is required for Gas1-inhibition of autophagy
The Hh signaling pathway is involved in many cellular processes such as cell proliferation, differentiation, survival and death, and is an important target in the diagnosis and treatment of hepatic fibrosis. Gas1 functions as an immediate upstream activator of the Hh pathway and extends the range of Hh action by facilitating its signaling. However, the signaling pathway by which autophagy is induced in response to Gas1 was previously unclear. To determine the impact of Gas1-Hh signaling on autophagy. We investigated the role of Hh signaling pathway in Gas1-mediated autophagy.
We first evaluated the expression of Patch1 and Gli1, which are essential components of the Hh signaling pathway. The expression of these proteins was reduced following Gas1 siRNA treatment in LX-2 and T-6 cells. The results presented in Figure 4 indicate that the depletion of Gas1 led to significant decreases in the expression levels of both Patch1 and Gli1 compared with the negative control siRNA in LX-2 and T-6 cells. Meanwhile, increased LC3-II expression and p62 degradation were detected by western blot analysis, suggesting that Gas1 may inhibit autophagy via the Hh signaling pathway. Next, LX-2 and T-6 cells were induced to undergo autophagy by starvation in EBSS for 4 h, followed by treatment with a specific Hh pathway inhibitor, Cyclopamine (Cyc, Smo antagonist, 5 µM), to knock down of Hh signaling prior to Gas1 siRNA treatment. Western blot analysis showed that treatment with Cyc decreased Patch1 and Gli1 expression, and also promoted LC3-II accumulation and p62 degradation in both HSCs lines (Figure 5), suggesting crosstalk between the Hh pathway and Gas1. Notably, treatment with a specific activator of the Hh pathway, Purmorphamine (an Hh agonist that directly targets Smo), increased Patch1 and Gli1 expression, but decreased Gas1-induced autophagy as evaluated by LC-3 conversion and SQSTM1/p62 expression (Figure 6). These findings suggest that the activation of Hh signaling blocks autophagy in LX-2 and T-6 cells. In contrast, inhibiting of the Hh pathway enhanced LC3-II accumulation in both HSCs lines. Collectively, these data indicate that Gas1 inhibits autophagy via Hh signaling pathway.
Figure 4.
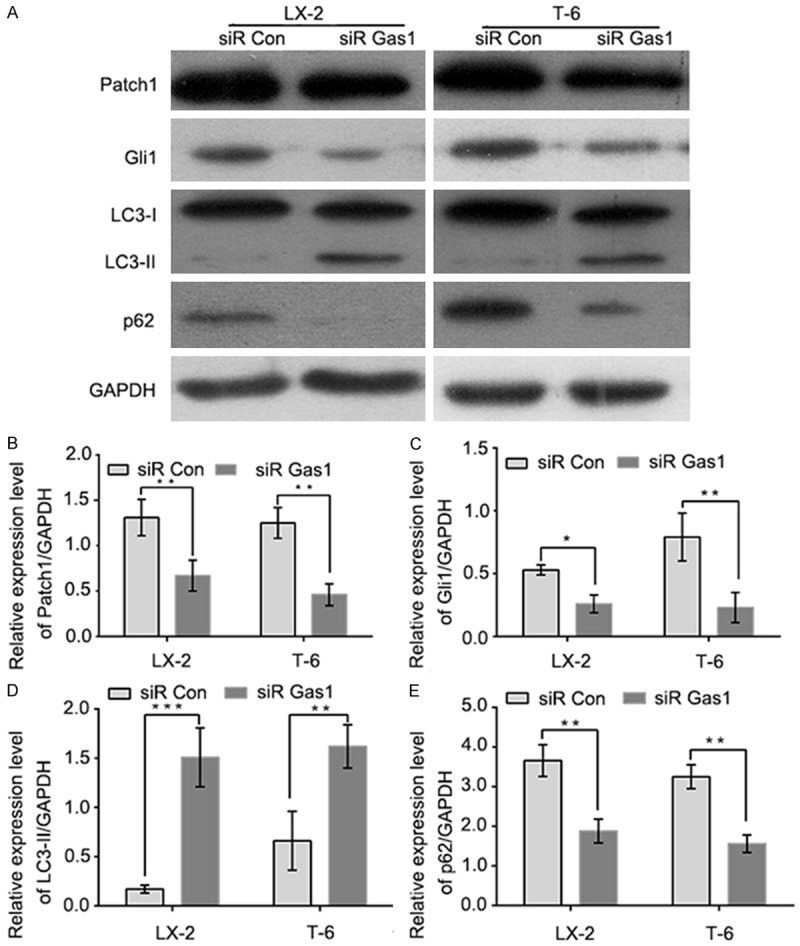
Specific siRNA knockdown of the Hedgehog signaling pathway and Gas1-mediated autophagy in LX-2 and T-6 cells. A: LX-2 and T-6 cells were transiently transfected with Gas1 siRNA or control siRNA (siR Con) for 72 h, and then the expression levels of key components of the Hedgehog signaling pathway (Patch1 and Gli1), LC3-II and p62 were measured by western blotting. B and C: The downregulation of Patch1 and Gli1 was measured by immunoblotting protein extracts derived from Gas1 siRNA-treated and control siRNA-treated LX-2 and T-6 cells. D and E: The autophagy markers, LC3-II and p62, were assessed after Gas1 siRNA transfected by immunoblotting. Gas1 siRNA promotes autophagic activity in LX-2 and T-6 cells. GAPDH was used as a loading control. The data are presented as the means ± SD for at least three independent experiments. *P < 0.05, **P < 0.01, ***P < 0.001, unpaired Student’s t-test.
Figure 5.
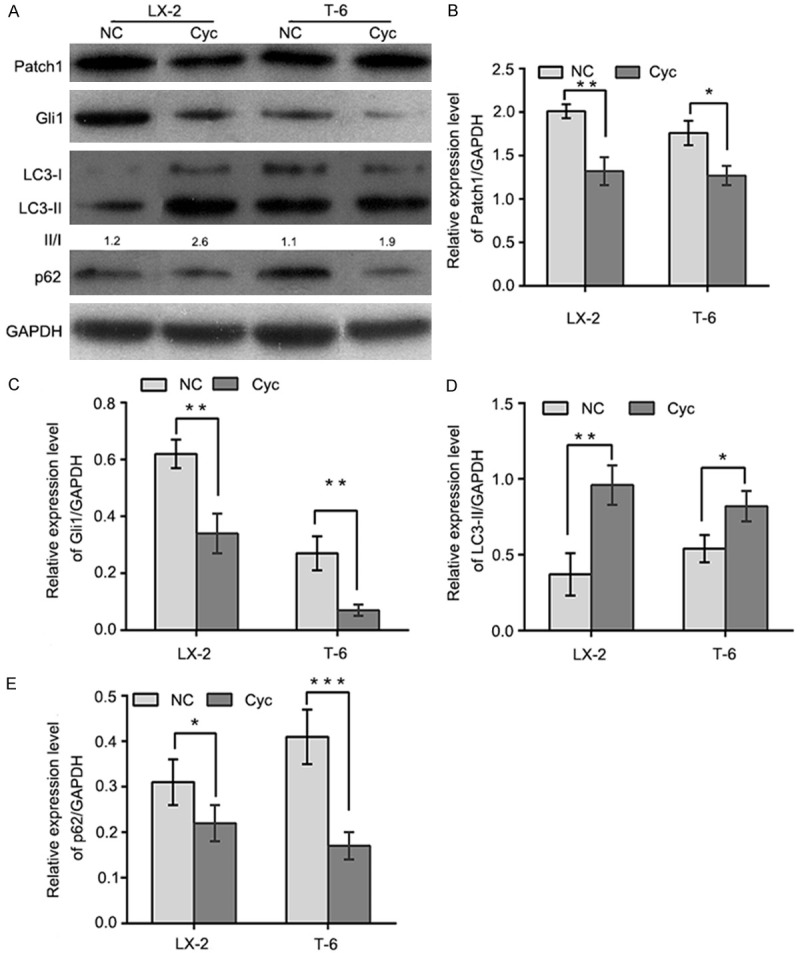
Gas1 elevates autophagic activity in the presence of Hedgehog pathway antagonists. A: Autophagy was induced in LX-2 and T-6 cells by culturing in EBSS for 4 h, cells were then were treated with cyclopamine (5 µM) for 72 h. Endogenous Patch1, Gli1, LC3B and p62 were detected by immunoblotting of total cell lysates, quantified by densitometric analysis and normalized to GAPDH. B and C: Patch1 and Gli1 expression levels were determined by western blotting. Patch1 and Gli1 were downregulated in LX-2 and T-6 cells treated with cyclopamine(Cyc, 5 µM), compared with the negative control group. D and E: Endogenous LC3-II and p62 were detected in cell lysates from cells treated with cyclopamine for 72 h. The results shows that Gas1 promotes the autophagic activity in LX-2 and T-6 cells. Quantification by densitometric analysis relative to GAPDH expression is shown on the graph. The results are representative of three independent experiments. Bars represent means ± SD. *P<0.05, **P<0.01, ***P<0.001 versus the negative control group, Unpaired student’s t-test.
Figure 6.
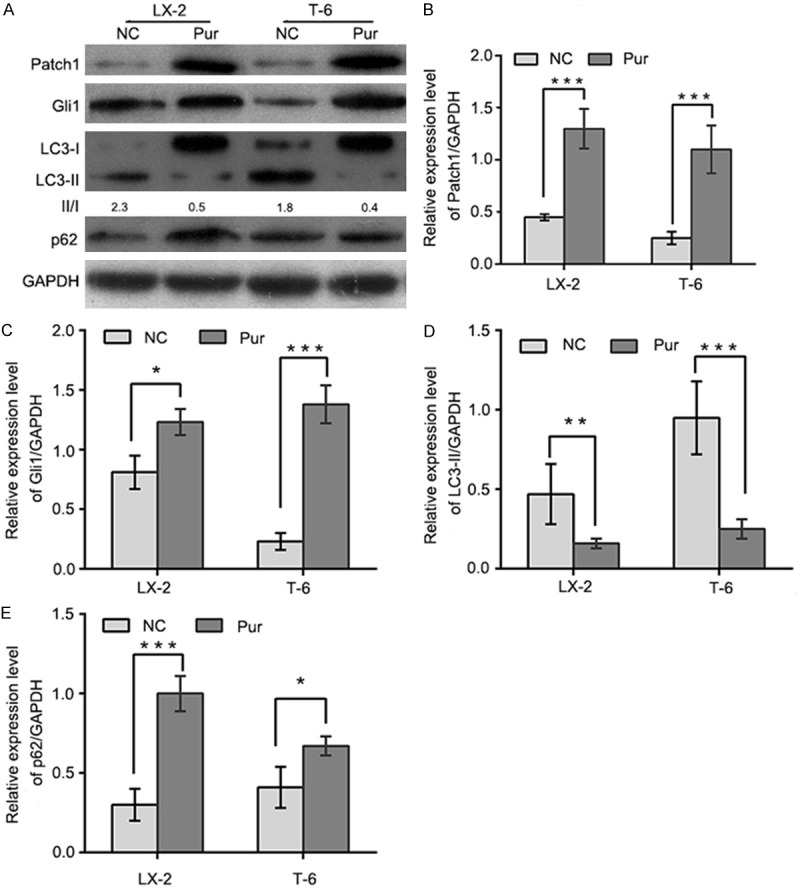
Gas1-regulated autophagy is inhibited in the presence of Hedgehog pathway agonists. A: Autophagy was induced in LX-2 and T-6 cells by culturing in EBSS for 4 h. Cells were then treated with Purmorphamine (Pur, 10 µm) for 72 h. Endogenous Patch1, Gli1, LC3B and p62 were detected by immunoblotting from total cell lysates, quantified by densitometric analysis and normalized to GAPDH. B and C: Purmorphamine increased the expression of the Patch1 reporter and the Hedgehog target gene Gli1 with respect to the negative control in LX-2 and T-6 cells. D and E: HSCs were cultured in the absence or presence of Purmorphamine (Pur, 10 µm). After a 72 h incubation, cell lysates were obtained for western blotting to detect LC3I/II and p62. For quantification, LC3-II and p62 levels from HSCs were normalized to GAPDH. The results are representative of three independent experiments. Bars represent means ± SD. *P < 0.05, **P < 0.01, ***P < 0.001 versus the negative control group, Unpaired, two-tail student’s t-test.
MiR-148a overexpression activates autophagy in hepatic stellate cells
Because Gas1 is a direct functional target of miR-148a and can inhibit autophagy in HSCs, we reasoned that miR-148a may influence autophagy.
To explore the role of miR-148a in regulating autophagic activation, we first performed LC3B conversion and GFP-LC3 puncta-formation assays. MiR-148a was sectopically expression in LX-2 and T-6 cells using a transfection mimic, and the conversion of LC3-I to LC3-II and the expression of p62 were detected. As shown in Figure 7A and 7B, endogenous LC3-II was significantly upregulated in miR-148a mimic transfected cells compared with the negative control group. Moreover, the LC3-II/LC3-I ratio was increased in the miR-148a mimic group compared with the control group. We then performed a GFP-LC3 puncta-formation assay; the miR-148a mimic was transfected into LX-2 and T-6 cells stably expressing a GFP-LC3 fusion protein, and the localization of GFP-LC3 was examined by fluorescence microscopy. The appearance of GFP-LC3 puncta in the cytoplasm reflects the recruitment of LC3 to autophagosomes. As shown in Figure 7D, there was a significant increase in GFP-LC3 puncta in miR-148a mimic transfected cells relative to mock-treated (non-transfected) HSCs. Consistently, the quantification of GFP-LC3 dots per cell confirmed that miR-148a overexpression induced autophagosome accumulation in both LX-2 and T-6 cells (Figure 7E). Thus, both assays suggested that miR-148a overexpression induces autophagosome accumulation.
Figure 7.
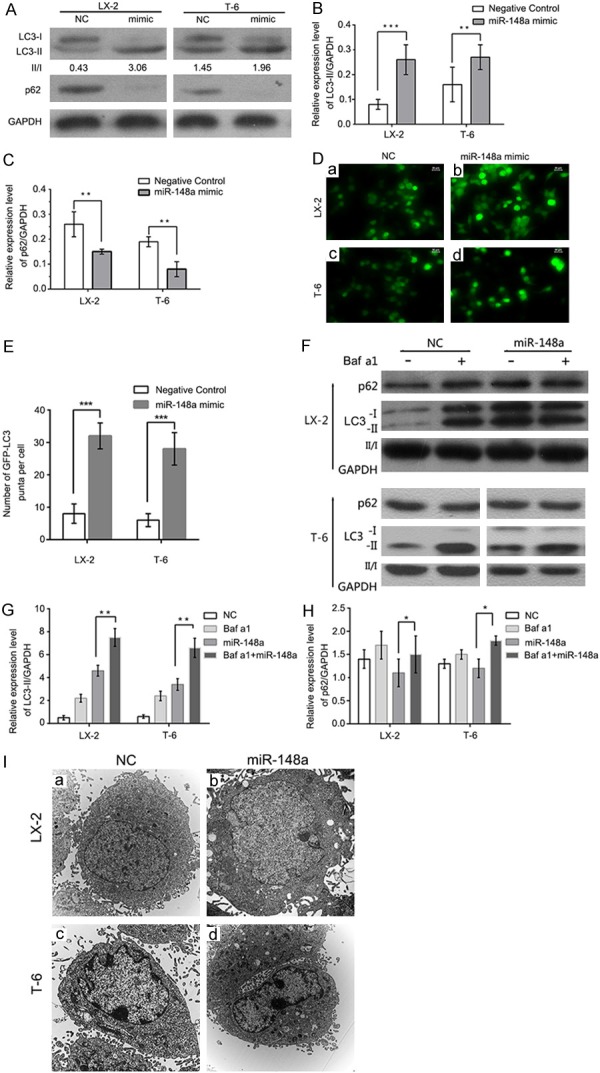
MiR-148a overexpression promotes autophagy. (A) The overexpression of miR-148a induces LC3 conversion and p62 degradation. Western blot of the miR-148a mimic and the scramble control (NC) in cells 48 h post-transfection are shown, and the fold changes in autophagic flux are shown in (B) and (C). (D) The miR-148a mimic or miR Con were transfected into LX-2 and T-6 cells stably expressing a GFP-LC3 fusion protein, and cells were fixed 72 h post-transfection. Representative images from the GFP-LC3 puncta-formation assay are shown. Scale bars represent 20 μM. (E) miR-148a overexpression promotes GFP-LC3 translocation. The percentage of GFP-LC3 puncta positive cells was quantified by automated image acquisition and analysis. (F) MiR-148a overexpression increases autophagic flux. LX-2 and T-6 cells were transfected with the miR-148a mimic or the scrambled control (NC) for 48 h, Baf a1 (50 mM) was applied to the medium for 1 h, and cells were harvested for immunoblotting. (G and H) Image J densitometric analysis of the LC3-II (G) or p62 (H) ratios. Unpaired, two-tailed student’s t-test. (I) Representative transmission electron micrographs depicting the ultrastructure of LX-2 and T-6 cells following 48 h treatment with the scrambled control (NC) or the miR-148a mimic. Scale bar = 2 µm (10,000 × direct magnification). Data are shown as the means ± SD of three independent experiments. *P < 0.05, **P < 0.01, ***P < 0.001. Unpaired, two-tail student’s t-test.
The increased detection of autophagic markers, such as LC3II accumulation and GFP-LC3 redistribution, can result from either increased autophagosome formation or the inhibition of ongoing autophagosomal maturation. To delineate these two possibilities, we performed autophagic flux assays. SQSTM1/p62, a polyubiquitin binding protein, is selectively incorporated into autophagosomes via direct binding to LC3, being rapidly degraded during autophagy; thus, the total cellular levels of SQSTM1/p62 reflect the autophagic activity. The intracellular amount of SQSTM1/p62 was therefore examined by western blotting. Transfection with the miR-148a mimic resulted in a 42-65% reduction in SQSTM1/p62 levels in LX-2 and T-6 cells (Figure 7A and 7C), suggesting that miR-148a overexpression promotes autophagic degradation. To further confirm that miR-148a induces autophagy in HSCs, we performed an LC3 turnover assay. LX-2 and T-6 cells were treated with the lysosomotropic reagent bafilomycin a1 (Baf a1, a vacuolar H+-ATPase antagonist that prevents luminal acidification and autophagosomal cargo degradation) to block autophagic degradation. In the presence of Baf a1, transfection with the miR-148a mimic caused a significant increase in LC3-II levels in both LX-2 and T-6 cells (Figure 7F-H). In addition, SQSTM1/p62 levels in miR-148a mimic transfected cells were also upregulated by Baf a1. Autophagy was also evaluated by observing changes in cell morphology. The accumulation of autophagosomes was significantly increased in miR-148a overexpressing cells (Figure 7I). Taken together, these findings demonstrate that miR-148a overexpression increases autophagosome accumulation.
Gas1 blocked miR-148a induced autophagy in Hepatic stellate cells
As miR-148a simultaneously induced autophagy and downregulated the expression in HSCs, we then wondered whether Gas1 plays a role in regulating autophagy induced by miR-148a. To this end, LX-2 and T-6 cells were transfected with miR-148a mimic to induce autophagy for 48 h, followed by treated with Gas1 (0.75 μg/μl), we determined the autophagic level triggered by miR-148a in the HSCs treated with Gas1 overexpression or negative control by western blotting. We found that over expressing Gas1 blocked miR-148a induced autophagic activity (Figure 8A), inhibited the conversion from LC3-I to LC3-II and upregulated the expression of SQSTM1/p62 protein (Figure 8B and 8C). Therefore, the results demonstrated that Gas1 regulated miR-148a-induced autophagy in HSCs. To further investigate the role of Gas1 in autophagy triggered by miR-148a, we performed knockdown experiment by transfecting the cells with Gas1 siRNA. Relative to random siRNA transfection and miR-148a mimic transfected group, blockage of Gas1 led to a remarkable promoting effect on the conversion of LC3-I to LC3-II (Figure 8D-F) and downregulated the expression of SQSTM1/p62 protein. All these results demonstrated that Gas1 knockdown dramatically blocked miR-148a induced autophagy and further indicated that miR-148a may modulate autophagy by targeting the essential protein, Gas1, which is required for transducing autophagy pathways.
Figure 8.
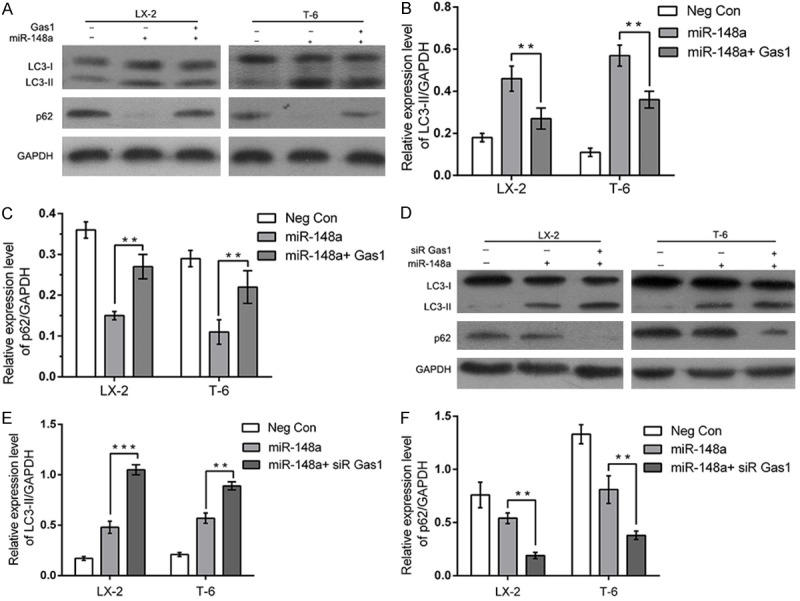
Gas1 blocks miR-148a induced autophagy in Hepatic stellate cells. (A-C) LX-2 and T-6 cells were transiently co-transfected with negative control, the miR-148a mimic or the miR-148a mimic together with Gas1. The protein expression of autophagy-related LC3-II and p62 were significantly blocked by Gas1 through immunoblotting (A). The bar graphs showed the fold change of the expression level of LC3-II and p62 (B and C). GAPDH was used as loading control. (D-F) LX-2 and T-6 cells were transfected with the miR-148a mimic to induce autophagy for 48 h, followed by treated with negative control, siRNA Control or Gas1 siRNA. The protein expression of LC3-II and p62 was increased by Gas1 siRNA remarkably by immunoblotting (D). Quantitative analysis of LC3-II and p62 was shown in histograms (E and F). Results are expressed as the means ± SD from three independent experiments. *P < 0.05, **P < 0.01, ***P < 0.001, Unpaired student’s t-test.
MiR-148a inhibits proliferation and promotes apoptosis in hepatic stellate cells
We also quantified the proliferation and apoptosis after ectopic expression of miR-148a in LX-2 and T-6 cells. To examine proliferation, MTT assays were performed in HSCs transfected with the miR-148a mimic or anti-miR-148a. Overexpressing miR-148a resulted in a significantly inhibited cellular proliferation compared with negative control miRNA (P < 0.05) (Figure 9A and 9B). After 3 days, the number of miR-148a mimic transfected LX-2 and T-6 cells were 65.7% and 50.2% of the negative controls, respectively. Conversely, knocking-down of miR-148a facilitated of cell proliferation. These results suggest that miR-148a inhibits HSCs proliferation.
Figure 9.
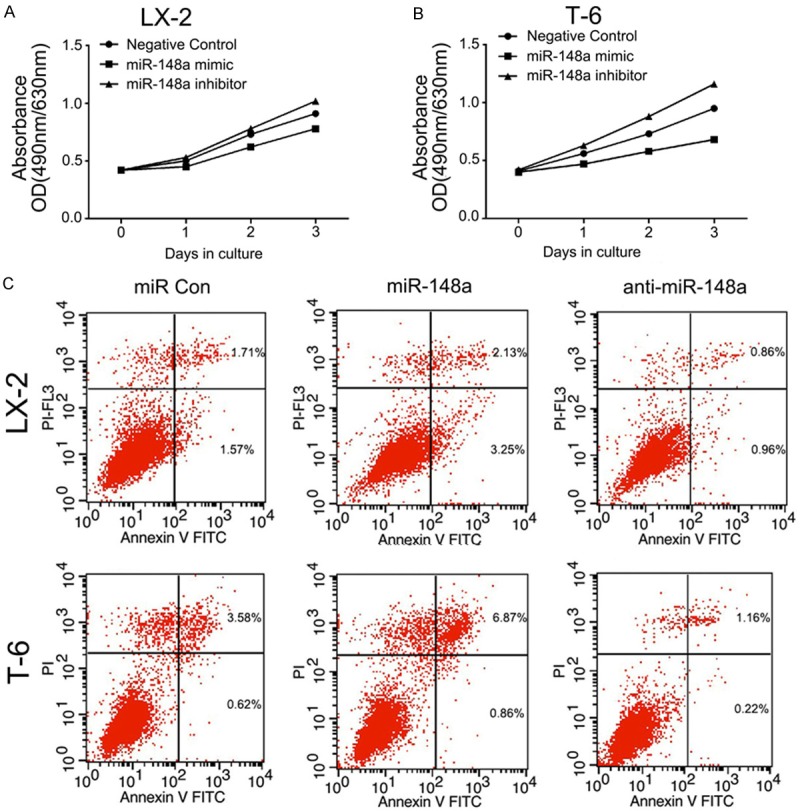
MiR-148a inhibits proliferation and promotes apoptosis in LX-2 and T-6 cells. A and B: MTT assay were performed on LX-2 and T-6 cells. Cells were transiently transfected with the miR-148a mimic or the inhibitor. The number of viable cells was evaluated as the value of the absorbance at 490 nm with a reference wavelength of 630 nm. Values of optical density (OD) are expressed as means ± SD (n = 3). C: Apoptosis in HSCs was determined by annexin V staining and detected by flow cytometry after 48 h of treatment. The miR-148a mimic induced early apoptosis (Lower Right region) and late apoptosis (Upper Right region) in LX-2 and T-6 cells lines. Images are representative of three independent experiments.
To confirm that the overexpression of miR-148a was associated with apoptosis, we examined the level of apoptosis by flow cytometry 48 h after transfection. The results clearly demonstrated significantly increased apoptosis in both LX-2 and T-6 cells transfected with the miR-148a mimic compared with the cells transfected with the negative control (P < 0.05). In contrast, LX-2 and T-6 cells transected with the miR-148a inhibitor showed the opposite effect (P < 0.05) (Figure 9C). These data gathered suggest that miR-148a promotes apoptosis in HSCs. In summary, these results demonstrate that miR-148a prevents proliferation and promotes apoptosis in LX-2 and T-6 cells.
Discussion
Hepatic fibrosis is orchestrated by a complex network of signaling pathways that regulate the deposition of extracellular matrix proteins during fibrogenesis. HSCs activation is caused by persistent liver damage and wound healing reactions included by chronic viral hepatitis, alcohol abuse, non-alcoholic steatohepatitis (NASH) and several other aetiologies [33]. Insights into the molecular mechanisms that regulate HSCs activation is critical for developing proper therapeutic strategies to improve the survival and prognosis of patients suffering from hepatic fibrosis, as well as prevention hepatocellular carcinoma. In recent years, a considerable number of miRNAs have been shown to be dysregulated in liver fibrosis, potentially contributing to the initial developmental stages of hepatic fibrosis, which consists of apoptosis and autophagy [34].
In the present study, we first confirmed that Gas1 is a novel direct target of miR-148a. We then demonstrated that Gas1, an upstream receptor in the Hh signaling pathway, can strengthen the activation of Hh signaling. Moreover, we discovered a new mechanism in which Gas1 interrupts autophagic activity in a dose-dependent manner via the Hh signaling pathway. More importantly, starvation-induced miR-148a expression was demonstrated as a potent inducer of autophagy, an inhibitor of cell proliferation and a promoter of apoptosis in HSCs. Altogether, these data reveal the importance of a novel microRNA, miR-148a, in mammalian autophagy regulation through the Hh signaling pathway.
Recently, numerous studies have demonstrated that various miRNAs, such as miR-21, miR-101, miR-122 and miR-221/222 [35-38], regulate liver fibrosis through different mechanisms. However, many of these have not been well characterized. Previous studies have found that miR-148a is downregulated in multiple diseases, including hepatic fibrosis, cirrhosis, and HCC [28,39,40], and miR-148a may be an attractive candidate for cancer therapy through its target genes. The known targets of miR-148a include DNMT1, IGF-IR, and ROCK1 [41-43]. In our study, we first demonstrated that the basal miR-148a expression levels are very low under normal culture conditions and starvation upregulates miR-148a expression in a time-dependent manner. In addition, we identified Gas1 as a direct target of miR-148a using a dual-luciferase reporter assay, western blotting and qRT-PCR in LX-2 and T-6 cells. Our results indicate that miR-148a represses Gas1 expression levels through directly binding to 3’-UTRs of the Gas1 mRNA. Given the observation that miR-148a was down-regulated in fibrotic liver tissues, we speculated that the upregulation of miR-148a is correlated with hepatic fibrogenesis.
Autophagy is involved in a variety of physiological and pathological events. Proper autophagy levels are required to maintain hepatic homeostasis and function. The disruption of autophagy has been demonstrated to contribute to hepatic remodeling [44]. We therefore also elucidated the effects of Gas1 on autophagic activity in LX-2 and T-6 cells. Gas1 is a GPI-anchored protein, whose function depends on p53 activity. Gas1 acts in conjunction with Patch1 in the sonic hedgehog signaling pathway by binding to the Hh protein and facilitating its signaling activity [45]. We found that Gas1 overexpression markedly inhibited the conversion of LC3-I to LC3-II and the degradation of SQSTM1/p62 in LX-2 and T-6 cells in a dose-dependent manner. To further support the essential role of Gas1 in autophagy, we used a specific siRNA approach to downregulate Gas1 and reverse the autophagy impairment caused by Gas1 overexpression. Furthermore, ultrastructural features of acidic autophagic vesicles with double or multiple membrane were observed by TEM in Gas1 siRNA transfected HSCs. Collectively, our results demonstrate that Gas1 inhibits autophagic activity in HSCs. Both autophagosome formation and the degradation of long-lived proteins were severely impaired in LX-2 and T-6 cells.
Several signaling pathways have been shown to regulate autophagy in response to stress and starvation. AKT and ERK activate mTOR to inhibit autophagy, whereas AMPK inhibits the activity of mTOR and thereby promotes autophagy [46,47]. On the other hand, studies have shown that Hh signaling inhibits autophagosome synthesis under both in basal and autophagy-induced conditions. Hh signaling acts in both a paracrine and an autocrine manner and regulates the proliferation of Hh-responsive cells, such as HSCs and hepatic progenitor cells [16,48,49].
Previous studies have shown that Gas1, which encodes a Hh surface binding receptor and is a pivotal upstream regulator of the Hh signaling pathway, acts cooperatively with Patch1 to form distinct shh receptor complexes, leading to the release of Smo, which in turn activates a series of signal transduction events that result in Gli1-mediated transcription and signal transduction [50,51]. Therefore, Gas1 is required to enhance Hh signaling activity and shh-mediated cell proliferation. Because Gas1 has been shown to both inhibit autophagic activation and activate the Hh pathway, we speculated that Gas1 inhibit pro-autophagic activities via the Hh pathway. Indeed, Gas1 overexpression led to increased levels of Patch1 and Gli1, and Gli1 activity has a direct inhibitory effect on autophagy. Meanwhile, the opposite effects were observed with Gas1 siRNA. Moreover, a common pharmacological approach was used to inhibit or active the Hh pathway in vitro. Purmorphamine was found to significantly inhibit LC3B conversion and increase SQSTM1/p62 levels relative to the negative control groups. In addition, Cyc, a steroidal alkaloid inhibitor of Hedgehog/Smoothened signaling, has been utilized to abrogate Hh signaling and induce prominent autophagic activity. These results suggest that HH activity is required for Gas1 modulated autophagy in HSCs.
The vital importance of miRNAs in the modulation of target genes involved in the autophagy pathway has been highlighted recently. Interestingly, autophagy has been reported to control miRNA biogenesis and activity, suggesting a feedback loop between miRNAs and autophagy [52]. For instance, MiR-376b controls autophagy by directly targeting the intracellular levels of two autophagy proteins, ATG4C and beclin-1, by targeting the 3’-UTRs of their corresponding mRNAs [53,54]. MiR-205 impairs autophagy by targeting the RAB27A and LAMP3, enhances cisplatin cytotoxicity in castration-resistant prostate cancer cells and restoring miR-205 expression may represent an effective approach to overcome resistance to platinum compounds [55]. Previous findings also suggested that miR-148a may function as a potential tumor suppressor through diverse mechanisms. However, its exact function in autophagy in HSCs remains controversial. In the present study, we introduced miR-148a as a novel autophagy-related miRNA. MiR-148a overexpression promoted GFP-LC3 puncta formation, LC3-I to LC3-II conversion and SQSTM/p62 degradation. In addition, we treated cells with lysosomal inhibitor Baf a1 in the presence of EBSS and the miR-148a mimic increased autophagic flux between the levels of LC3-II in the presence and absence of Baf a1. More importantly, this study clearly indicated that autophagy contributes to apoptosis in HSCs. These results were valid under starvation-induced conditions, which is a commonly used autophagy stimulus in at least two HSCs lines. Altogether, this evidence establishes that miR-148a as a key miRNAs in the regulation of autophagy, which functions by decreasing Gas1 levels in HSCs. These results are consistent with those reported by Gailhouste, et al. who demonstrated that miR-148a was critical for hepatic differentiation via the direct targeting of DNA methyltransferase (DNMT) 1 and that miR-148a had beneficial effects through the repression of HCC cell malignancy in hepatocyte maturation [27]. The role of autophagy in the development and progression of hepatic fibrogenesis is complex, and the role of autophagy in cell survival and death may depend on specific agents and cell types. Whereas a deficiency in autophagy can predispose cells to the initiation of fibrogenesis, excessive or prolonged activation of autophagy may promote HSCs death [56]. Our findings indicate that miR-148a inhibits proliferation and promotes apoptosis in HSCs and may therefore offer a therapeutic strategy for treating hepatic fibrosis.
In conclusion, the results of the present study demonstrate that miR-148a plays an important role in inducing autophagic activity by directly targeting Gas1 in the Hh signaling pathway, thereby inhibiting proliferation and promoting apoptosis in HSCs. This study may provide useful information for the development of potential therapeutic interventions against liver fibrosis and hepatocellular carcinoma. The results presented in this work combined with previously published data are summarized in a model (Figure 10). However, given the multiple target genes that are targeted by members of the miR-148a family, their regulation of autophagy and their underlying mechanisms need to be thoroughly assessed. Further transfection of miRNA-148a overexpression plasmids and knockout plasmids will be performed in vivo comprehensively explore the mechanisms of liver fibrosis.
Figure 10.
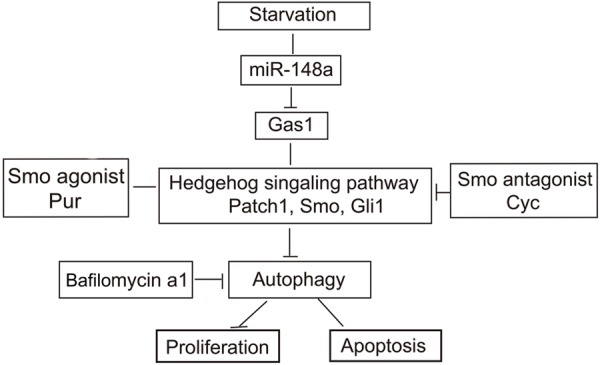
MiR-148a promotes starvation-induced autophagic activity in HSCs, at least in part, through suppressing the Hedgehog signaling pathway. Starvation stimulates the upregulation of miR-148a expression, miR-148a can directly interact with the 3’-UTRs of the Gas1 mRNA and followed by inhibit Hedgehog pathway activity, resulting in increased autophagosome accumulation. MiR-148a inhibits proliferation and promotes apoptosis by inducing autophagy in HSCs.
Disclosure of conflict of interest
None.
References
- 1.Pellicoro A, Ramachandran P, Iredale JP, Fallowfield JA. Liver fibrosis and repair: immune regulation of wound healing in a solid organ. Nat Rev Immunol. 2014;14:181–194. doi: 10.1038/nri3623. [DOI] [PubMed] [Google Scholar]
- 2.Ray K. Liver: hepatic stellate cells hold the key to liver fibrosis. Nat Rev Gastroenterol Hepatol. 2014;11:74. doi: 10.1038/nrgastro.2013.244. [DOI] [PubMed] [Google Scholar]
- 3.Hernandez-Gea V, Hilscher M, Rozenfeld R, Lim MP, Nieto N, Werner S, Devi LA, Friedman SL. Endoplasmic reticulum stress induces fibrogenic activity in hepatic stellate cells through autophagy. J Hepatol. 2013;59:98–104. doi: 10.1016/j.jhep.2013.02.016. [DOI] [PMC free article] [PubMed] [Google Scholar]
- 4.Wang XW, Heegaard NH, Orum H. MicroRNAs in liver disease. Gastroenterology. 2012;142:1431–1443. doi: 10.1053/j.gastro.2012.04.007. [DOI] [PMC free article] [PubMed] [Google Scholar]
- 5.Settembre C, Ballabio A. Cell metabolism: autophagy transcribed. Nature. 2014;516:40–41. doi: 10.1038/nature13939. [DOI] [PubMed] [Google Scholar]
- 6.Galluzzi L, Pietrocola F, Levine B, Kroemer G. Metabolic control of autophagy. Cell. 2014;159:1263–1276. doi: 10.1016/j.cell.2014.11.006. [DOI] [PMC free article] [PubMed] [Google Scholar]
- 7.Fang F, Wang L, Zhang S, Fang Q, Hao F, Sun Y, Zhao L, Chen S, Liao H, Wang L. CD147 modulates autophagy through the PI3K/Akt/mTOR pathway in human prostate cancer PC-3 cells. Oncol Lett. 2015;9:1439–1443. doi: 10.3892/ol.2015.2849. [DOI] [PMC free article] [PubMed] [Google Scholar]
- 8.Li HY, Zhang J, Sun LL, Li BH, Gao HL, Xie T, Zhang N, Ye ZM. Celastrol induces apoptosis and autophagy via the ROS/JNK signaling pathway in human osteosarcoma cells: an in vitro and in vivo study. Cell Death Dis. 2015;6:e1604. doi: 10.1038/cddis.2014.543. [DOI] [PMC free article] [PubMed] [Google Scholar]
- 9.Pampliega O, Orhon I, Patel B, Sridhar S, Diaz-Carretero A, Beau I, Codogno P, Satir BH, Satir P, Cuervo AM. Functional interaction between autophagy and ciliogenesis. Nature. 2013;502:194–200. doi: 10.1038/nature12639. [DOI] [PMC free article] [PubMed] [Google Scholar]
- 10.Thoen LF, Guimaraes EL, Dolle L, Mannaerts I, Najimi M, Sokal E, van Grunsven LA. A role for autophagy during hepatic stellate cell activation. J Hepatol. 2011;55:1353–1360. doi: 10.1016/j.jhep.2011.07.010. [DOI] [PubMed] [Google Scholar]
- 11.Chen Y, Choi SS, Michelotti GA, Chan IS, Swiderska-Syn M, Karaca GF, Xie G, Moylan CA, Garibaldi F, Premont R, Suliman HB, Piantadosi CA, Diehl AM. Hedgehog controls hepatic stellate cell fate by regulating metabolism. Gastroenterology. 2012;143:1319–1329. doi: 10.1053/j.gastro.2012.07.115. [DOI] [PMC free article] [PubMed] [Google Scholar]
- 12.Omenetti A, Choi S, Michelotti G, Diehl AM. Hedgehog signaling in the liver. J Hepatol. 2011;54:366–373. doi: 10.1016/j.jhep.2010.10.003. [DOI] [PMC free article] [PubMed] [Google Scholar]
- 13.Du Toit A. Cell signalling: hedgehog puts a damper on autophagy. Nat Rev Mol Cell Biol. 2013;14:3. doi: 10.1038/nrm3487. [DOI] [PubMed] [Google Scholar]
- 14.Zeng X, Zhao H, Li Y, Fan J, Sun Y, Wang S, Wang Z, Song P, Ju D. Targeting Hedgehog signaling pathway and autophagy overcomes drug resistance of BCR-ABL-positive chronic myeloid leukemia. Autophagy. 2015;11:355–72. doi: 10.4161/15548627.2014.994368. [DOI] [PMC free article] [PubMed] [Google Scholar]
- 15.Xu Y, An Y, Wang X, Zha W, Li X. Inhibition of the Hedgehog pathway induces autophagy in pancreatic ductal adenocarcinoma cells. Oncol Rep. 2014;31:707–712. doi: 10.3892/or.2013.2881. [DOI] [PubMed] [Google Scholar]
- 16.Steinway SN, Zanudo JG, Ding W, Rountree CB, Feith DJ, Loughran TP Jr, Albert R. Network modeling of TGFbeta signaling in hepatocellular carcinoma epithelial-to-mesenchymal transition reveals joint sonic hedgehog and Wnt pathway activation. Cancer Res. 2014;74:5963–5977. doi: 10.1158/0008-5472.CAN-14-0225. [DOI] [PMC free article] [PubMed] [Google Scholar]
- 17.Razumilava N, Gradilone SA, Smoot RL, Mertens JC, Bronk SF, Sirica AE, Gores GJ. Non-canonical Hedgehog signaling contributes to chemotaxis in cholangiocarcinoma. J Hepatol. 2014;60:599–605. doi: 10.1016/j.jhep.2013.11.005. [DOI] [PMC free article] [PubMed] [Google Scholar]
- 18.Schmiedel JM, Klemm SL, Zheng Y, Sahay A, Bluthgen N, Marks DS, van Oudenaarden A. Gene expression. MicroRNA control of protein expression noise. Science. 2015;348:128–132. doi: 10.1126/science.aaa1738. [DOI] [PubMed] [Google Scholar]
- 19.Szabo G, Bala S. MicroRNAs in liver disease. Nat Rev Gastroenterol Hepatol. 2013;10:542–552. doi: 10.1038/nrgastro.2013.87. [DOI] [PMC free article] [PubMed] [Google Scholar]
- 20.Jiang Z, Cushing L, Ai X, Lu J. miR-326 is downstream of Sonic hedgehog signaling and regulates the expression of Gli2 and smoothened. Am J Respir Cell Mol Biol. 2014;51:273–283. doi: 10.1165/rcmb.2013-0127OC. [DOI] [PMC free article] [PubMed] [Google Scholar]
- 21.Wen SY, Lin Y, Yu YQ, Cao SJ, Zhang R, Yang XM, Li J, Zhang YL, Wang YH, Ma MZ, Sun WW, Lou XL, Wang JH, Teng YC, Zhang ZG. miR-506 acts as a tumor suppressor by directly targeting the hedgehog pathway transcription factor Gli3 in human cervical cancer. Oncogene. 2015;34:717–725. doi: 10.1038/onc.2014.9. [DOI] [PubMed] [Google Scholar]
- 22.Zhai Z, Wu F, Dong F, Chuang AY, Messer JS, Boone DL, Kwon JH. Human autophagy gene ATG16L1 is post-transcriptionally regulated by MIR142-3p. Autophagy. 2014;10:468–479. doi: 10.4161/auto.27553. [DOI] [PMC free article] [PubMed] [Google Scholar]
- 23.Su M, Wang J, Wang C, Wang X, Dong W, Qiu W, Wang Y, Zhao X, Zou Y, Song L, Zhang L, Hui R. MicroRNA-221 inhibits autophagy and promotes heart failure by modulating the p27/CDK2/mTOR axis. Cell Death Differ. 2015;22:986–999. doi: 10.1038/cdd.2014.187. [DOI] [PMC free article] [PubMed] [Google Scholar]
- 24.Menghini R, Casagrande V, Marino A, Marchetti V, Cardellini M, Stoehr R, Rizza S, Martelli E, Greco S, Mauriello A, Ippoliti A, Martelli F, Lauro R, Federici M. MiR-216a: a link between endothelial dysfunction and autophagy. Cell Death Dis. 2014;5:e1029. doi: 10.1038/cddis.2013.556. [DOI] [PMC free article] [PubMed] [Google Scholar]
- 25.Lu C, Chen J, Xu HG, Zhou X, He Q, Li YL, Jiang G, Shan Y, Xue B, Zhao RX, Wang Y, Werle KD, Cui R, Liang J, Xu ZX. MIR106B and MIR93 Prevent Removal of Bacteria From Epithelial Cells by Disrupting ATG16L1-Mediated Autophagy. Gastroenterology. 2014;146:188–199. doi: 10.1053/j.gastro.2013.09.006. [DOI] [PMC free article] [PubMed] [Google Scholar]
- 26.Chen Z, Ma T, Huang C, Zhang L, Xu T, Hu T, Li J. MicroRNA-148a: a potential therapeutic target for cancer. Gene. 2014;533:456–457. doi: 10.1016/j.gene.2013.09.067. [DOI] [PubMed] [Google Scholar]
- 27.Gailhouste L, Gomez-Santos L, Hagiwara K, Hatada I, Kitagawa N, Kawaharada K, Thirion M, Kosaka N, Takahashi RU, Shibata T, Miyajima A, Ochiya T. miR-148a plays a pivotal role in the liver by promoting the hepatospecific phenotype and suppressing the invasiveness of transformed cells. Hepatology. 2013;58:1153–1165. doi: 10.1002/hep.26422. [DOI] [PubMed] [Google Scholar]
- 28.Zhang JP, Zeng C, Xu L, Gong J, Fang JH, Zhuang SM. MicroRNA-148a suppresses the epithelial-mesenchymal transition and metastasis of hepatoma cells by targeting Met/Snail signaling. Oncogene. 2014;33:4069–4076. doi: 10.1038/onc.2013.369. [DOI] [PubMed] [Google Scholar]
- 29.Jin S, Martinelli DC, Zheng X, Tessier-Lavigne M, Fan CM. Gas1 is a receptor for sonic hedgehog to repel enteric axons. Proc Natl Acad Sci U S A. 2015;112:E73–80. doi: 10.1073/pnas.1418629112. [DOI] [PMC free article] [PubMed] [Google Scholar]
- 30.Wang M, Shim JS, Li RJ, Dang Y, He Q, Das M, Liu JO. Identification of an old antibiotic clofoctol as a novel activator of unfolded protein response pathways and an inhibitor of prostate cancer. Br J Pharmacol. 2014;171:4478–4489. doi: 10.1111/bph.12800. [DOI] [PMC free article] [PubMed] [Google Scholar]
- 31.Haobam B, Nozawa T, Minowa-Nozawa A, Tanaka M, Oda S, Watanabe T, Aikawa C, Maruyama F, Nakagawa I. Rab17-mediated recycling endosomes contribute to autophagosome formation in response to Group A Streptococcus invasion. Cell Microbiol. 2014;16:1806–1821. doi: 10.1111/cmi.12329. [DOI] [PubMed] [Google Scholar]
- 32.Chapuis J, Vingtdeux V, Campagne F, Davies P, Marambaud P. Growth arrest-specific 1 binds to and controls the maturation and processing of the amyloid-beta precursor protein. Hum Mol Genet. 2011;20:2026–2036. doi: 10.1093/hmg/ddr085. [DOI] [PMC free article] [PubMed] [Google Scholar]
- 33.Seki E, Schwabe RF. Hepatic inflammation and fibrosis: functional links and key pathways. Hepatology. 2015;61:1066–1079. doi: 10.1002/hep.27332. [DOI] [PMC free article] [PubMed] [Google Scholar]
- 34.Chau BN, Brenner DA. What goes up must come down: the emerging role of microRNA in fibrosis. Hepatology. 2011;53:4–6. doi: 10.1002/hep.24071. [DOI] [PubMed] [Google Scholar]
- 35.Sombetzki M, Loebermann M, Reisinger EC. Vector-mediated microRNA-21 silencing ameliorates granulomatous liver fibrosis in Schistosoma japonicum infection. Hepatology. 2015;61:1787–1789. doi: 10.1002/hep.27748. [DOI] [PubMed] [Google Scholar]
- 36.Tu X, Zhang H, Zhang J, Zhao S, Zheng X, Zhang Z, Zhu J, Chen J, Dong L, Zang Y, Zhang J. MicroRNA-101 suppresses liver fibrosis by targeting the TGFbeta signalling pathway. J Pathol. 2014;234:46–59. doi: 10.1002/path.4373. [DOI] [PubMed] [Google Scholar]
- 37.Trebicka J, Anadol E, Elfimova N, Strack I, Roggendorf M, Viazov S, Wedemeyer I, Drebber U, Rockstroh J, Sauerbruch T, Dienes HP, Odenthal M. Hepatic and serum levels of miR-122 after chronic HCV-induced fibrosis. J Hepatol. 2013;58:234–239. doi: 10.1016/j.jhep.2012.10.015. [DOI] [PubMed] [Google Scholar]
- 38.Ogawa T, Enomoto M, Fujii H, Sekiya Y, Yoshizato K, Ikeda K, Kawada N. MicroRNA-221/222 upregulation indicates the activation of stellate cells and the progression of liver fibrosis. Gut. 2012;61:1600–1609. doi: 10.1136/gutjnl-2011-300717. [DOI] [PubMed] [Google Scholar]
- 39.Roderburg C, Urban GW, Bettermann K, Vucur M, Zimmermann H, Schmidt S, Janssen J, Koppe C, Knolle P, Castoldi M, Tacke F, Trautwein C, Luedde T. Micro-RNA profiling reveals a role for miR-29 in human and murine liver fibrosis. Hepatology. 2011;53:209–218. doi: 10.1002/hep.23922. [DOI] [PubMed] [Google Scholar]
- 40.Heo MJ, Kim YM, Koo JH, Yang YM, An J, Lee SK, Lee SJ, Kim KM, Park JW, Kim SG. microRNA-148a dysregulation discriminates poor prognosis of hepatocellular carcinoma in association with USP4 overexpression. Oncotarget. 2014;5:2792–2806. doi: 10.18632/oncotarget.1920. [DOI] [PMC free article] [PubMed] [Google Scholar]
- 41.Lombard AP, Mooso BA, Libertini SJ, Lim RM, Nakagawa RM, Vidallo KD, Costanzo NC, Ghosh PM, Mudryj M. miR-148a dependent apoptosis of bladder cancer cells is mediated in part by the epigenetic modifier DNMT1. Mol Carcinog. 2015;11:1–11. doi: 10.1002/mc.22319. [DOI] [PMC free article] [PubMed] [Google Scholar]
- 42.Xu Q, Jiang Y, Yin Y, Li Q, He J, Jing Y, Qi YT, Xu Q, Li W, Lu B, Peiper SS, Jiang BH, Liu LZ. A regulatory circuit of miR-148a/152 and DNMT1 in modulating cell transformation and tumor angiogenesis through IGF-IR and IRS1. J Mol Cell Biol. 2013;5:3–13. doi: 10.1093/jmcb/mjs049. [DOI] [PMC free article] [PubMed] [Google Scholar]
- 43.Zheng B, Liang L, Wang C, Huang S, Cao X, Zha R, Liu L, Jia D, Tian Q, Wu J, Ye Y, Wang Q, Long Z, Zhou Y, Du C, He X, Shi Y. MicroRNA-148a suppresses tumor cell invasion and metastasis by downregulating ROCK1 in gastric cancer. Clin Cancer Res. 2011;17:7574–7583. doi: 10.1158/1078-0432.CCR-11-1714. [DOI] [PubMed] [Google Scholar]
- 44.Puri P, Chandra A. Autophagy modulation as a potential therapeutic target for liver diseases. J Clin Exp Hepatol. 2014;4:51–59. doi: 10.1016/j.jceh.2014.04.001. [DOI] [PMC free article] [PubMed] [Google Scholar]
- 45.Martinelli DC, Fan CM. Gas1 extends the range of Hedgehog action by facilitating its signaling. Genes Dev. 2007;21:1231–1243. doi: 10.1101/gad.1546307. [DOI] [PMC free article] [PubMed] [Google Scholar]
- 46.Zhong W, Zhu H, Sheng F, Tian Y, Zhou J, Chen Y, Li S, Lin J. Activation of the MAPK11/12/13/14 (p38 MAPK) pathway regulates the transcription of autophagy genes in response to oxidative stress induced by a novel copper complex in HeLa cells. Autophagy. 2014;10:1285–1300. doi: 10.4161/auto.28789. [DOI] [PMC free article] [PubMed] [Google Scholar]
- 47.An HK, Kim KS, Lee JW, Park MH, Moon HI, Park SJ, Baik JS, Kim CH, Lee YC. Mimuloneinduced autophagy through p53-mediated AMPK/mTOR pathway increases caspase-mediated apoptotic cell death in A549 human lung cancer cells. PLoS One. 2014;9:e114607. doi: 10.1371/journal.pone.0114607. [DOI] [PMC free article] [PubMed] [Google Scholar]
- 48.Yang JJ, Tao H, Li J. Hedgehog signaling pathway as key player in liver fibrosis: new insights and perspectives. Expert Opin Ther Targets. 2014;18:1011–1021. doi: 10.1517/14728222.2014.927443. [DOI] [PubMed] [Google Scholar]
- 49.Guy CD, Suzuki A, Abdelmalek MF, Burchette JL, Diehl AM. Treatment response in the PIVENS trial is associated with decreased hedgehog pathway activity. Hepatology. 2015;61:98–107. doi: 10.1002/hep.27235. [DOI] [PMC free article] [PubMed] [Google Scholar]
- 50.Pineda-Alvarez DE, Roessler E, Hu P, Srivastava K, Solomon BD, Siple CE, Fan CM, Muenke M. Missense substitutions in the GAS1 protein present in holoprosencephaly patients reduce the affinity for its ligand, SHH. Hum Genet. 2012;131:301–310. doi: 10.1007/s00439-011-1078-6. [DOI] [PMC free article] [PubMed] [Google Scholar]
- 51.Seppala M, Depew MJ, Martinelli DC, Fan CM, Sharpe PT, Cobourne MT. Gas1 is a modifier for holoprosencephaly and genetically interacts with sonic hedgehog. J Clin Invest. 2007;117:1575–1584. doi: 10.1172/JCI32032. [DOI] [PMC free article] [PubMed] [Google Scholar]
- 52.Lan SH, Wu SY, Zuchini R, Lin XZ, Su IJ, Tsai TF, Lin YJ, Wu CT, Liu HS. Autophagy suppresses tumorigenesis of hepatitis B virus-associated hepatocellular carcinoma through degradation of microRNA-224. Hepatology. 2014;59:505–517. doi: 10.1002/hep.26659. [DOI] [PMC free article] [PubMed] [Google Scholar]
- 53.Korkmaz G, Tekirdag KA, Ozturk DG, Kosar A, Sezerman OU, Gozuacik D. MIR376A is a regulator of starvation-induced autophagy. PLoS One. 2013;8:e82556. doi: 10.1371/journal.pone.0082556. [DOI] [PMC free article] [PubMed] [Google Scholar]
- 54.Korkmaz G, le Sage C, Tekirdag KA, Agami R, Gozuacik D. miR-376b controls starvation and mTOR inhibition-related autophagy by targeting ATG4C and BECN1. Autophagy. 2012;8:165–176. doi: 10.4161/auto.8.2.18351. [DOI] [PubMed] [Google Scholar]
- 55.Pennati M, Lopergolo A, Profumo V, De Cesare M, Sbarra S, Valdagni R, Zaffaroni N, Gandellini P, Folini M. miR-205 impairs the autophagic flux and enhances cisplatin cytotoxicity in castration-resistant prostate cancer cells. Biochem Pharmacol. 2014;87:579–597. doi: 10.1016/j.bcp.2013.12.009. [DOI] [PubMed] [Google Scholar]
- 56.Thoen LF, Guimaraes EL, Grunsven LA. Autophagy: a new player in hepatic stellate cell activation. Autophagy. 2012;8:126–128. doi: 10.4161/auto.8.1.18105. [DOI] [PubMed] [Google Scholar]