Single-cell chromatin accessibility reveals principles of regulatory variation (original) (raw)
. Author manuscript; available in PMC: 2016 Jan 23.
Published in final edited form as: Nature. 2015 Jun 17;523(7561):486–490. doi: 10.1038/nature14590
Abstract
Cell-to-cell variation is a universal feature of life that impacts a wide range of biological phenomena, from developmental plasticity1,2 to tumor heterogeneity3. While recent advances have improved our ability to document cellular phenotypic variation4–8 the fundamental mechanisms that generate variability from identical DNA sequences remain elusive. Here we reveal the landscape and principles of cellular DNA regulatory variation by developing a robust method for mapping the accessible genome of individual cells via assay for transposase-accessible chromatin using sequencing (ATAC-seq). Single-cell ATAC-seq (scATAC-seq) maps from hundreds of single-cells in aggregate closely resemble accessibility profiles from tens of millions of cells and provides insights into cell-to-cell variation. Accessibility variance is systematically associated with specific _trans_-factors and _cis_-elements, and we discover combinations of _trans_-factors associated with either induction or suppression of cell-to-cell variability. We further identify sets of _trans_-factors associated with cell-type specific accessibility variance across 8 cell types. Targeted perturbations of cell cycle or transcription factor signaling evoke stimulus-specific changes in this observed variability. The pattern of accessibility variation in cis across the genome recapitulates chromosome topological domains9 de novo, linking single-cell accessibility variation to three-dimensional genome organization. All together, single-cell analysis of DNA accessibility provides new insight into cellular variation of the “regulome.”
Main
Heterogeneity within cellular populations has been evident since the first microscopic observations of individual cells. Recent proliferation of powerful methods for interrogating single cells4–8 has allowed detailed characterization of this molecular variation, and provided deep insight into characteristics underlying developmental plasticity1,2, cancer heterogeneity3, and drug resistance10. In parallel, genome-wide mapping of regulatory elements in large ensembles of cells have unveiled tremendous variation in chromatin structure across cell-types, particularly at distal regulatory regions11. Methods for probing genome-wide DNA accessibility, in particular, have proven extremely effective in identifying regulatory elements across a variety of cell types12 – quantifying changes that lead to both activation and repression of gene expression. Given this broad diversity of activity within regulatory elements when comparing phenotypically distinct cell populations, it is reasonable to hypothesize that heterogeneity at the single cell level extends to accessibility variability within cell types at regulatory elements. However, the lack of methods to probe DNA accessibility within individual cells has prevented quantitative dissection of this hypothesized regulatory variation.
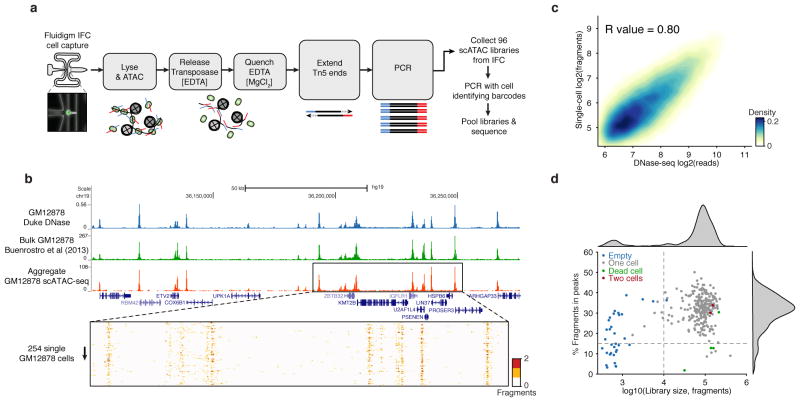
We have developed a single-cell Assay for Transposase-Accessible Chromatin (scATAC-seq), improving on the state-of-the-art13 sensitivity by >500-fold. ATAC-seq uses the prokaryotic Tn5 transposase14,15 to tag regulatory regions by inserting sequencing adapters into accessible regions of the genome. In scATAC-seq individual cells are captured and assayed using a programmable microfluidics platform (C1 single-cell Auto Prep System, Fluidigm) with methods optimized for this task (Fig. 1a and Extended Data Fig. 1 and Supplemental Discussion). After transposition and PCR on the Integrated Fluidics Circuit (IFC), libraries are collected and PCR amplified with cell-identifying barcoded primers. Single-cell libraries are then pooled and sequenced on a high-throughput sequencing instrument. Using single-cell ATAC-seq we generated DNA accessibility maps from 254 individual GM12878 lymphoblastoid cells. Aggregate profiles of scATAC-seq data closely reproduce ensemble measures of accessibility profiled by DNase-seq and ATAC-seq generated from 107 or 104 cells respectively (Fig. 1b,c and Extended Data Fig. 2a). Data from single cells recapitulate several characteristics of bulk ATAC-seq data, including fragment size periodicity corresponding to integer multiples of nucleosomes, and a strong enrichment of fragments within regions of accessible chromatin (Extended Data Fig. 2b,c). Microfluidic chambers generating low library diversity or poor measures of accessibility, which correlate with empty chambers or dead cells, were excluded from further analysis (Fig. 1d and Extended Data Fig. 2d–l). Chambers passing filter yielded an average of 7.3×10⁴ fragments mapping to the nuclear genome. We further validated the approach by measuring chromatin accessibility from a total of 1,632 IFC chambers representing 3 tier 1 ENCODE cell lines16 (H1 human embryonic stem cells [ESCs], K562 chronic myelogenous leukemia and GM12878 lymphoblastoid cells) as well as from V6.5 mouse ESCs, EML1 (mouse hematopoietic progenitor), TF-1 (human erythroblast), HL-60 (human promyeloblast) and BJ fibroblasts (human foreskin fibroblast).
Figure 1. Single-cell ATAC-seq provides an accurate measure of chromatin accessibility genome-wide.
(a) Workflow for measuring single epigenomes using scATAC-seq on a microfluidic device (Fluidigm). (b) Aggregate single-cell accessibility profiles closely recapitulate profiles of DNase-seq and ATAC-seq. (C) Genome-wide accessibility patterns observed by scATAC-seq are correlated with DNase-seq data (R = 0.80). (d) Library size versus percentage of fragments in open chromatin peaks (filtered as described in methods) within K562 cells (N=288). Dotted lines (15% and 10,000) represent cutoffs used for downstream analysis.
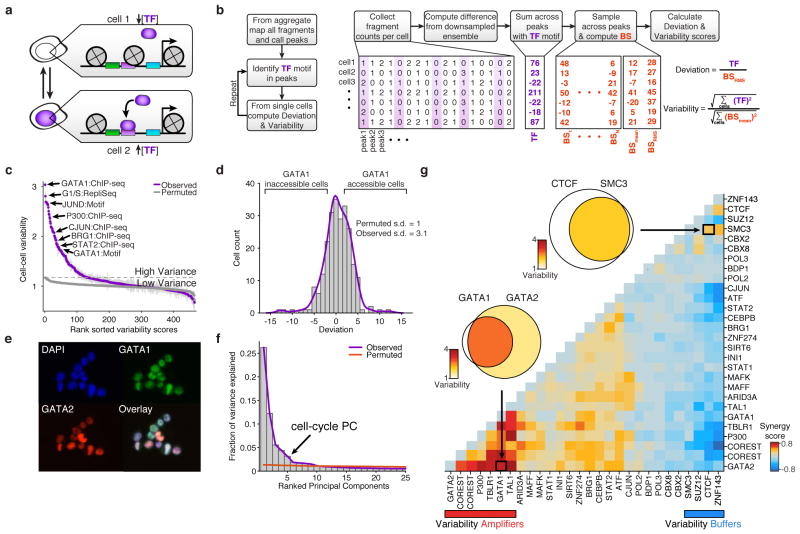
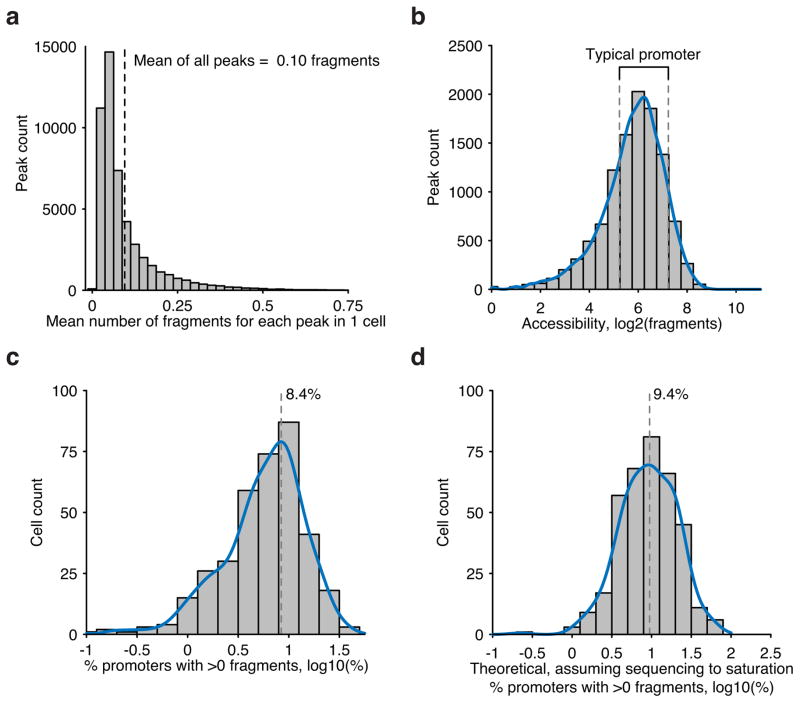
Because regulatory elements are generally present at two copies in a diploid genome, we observe a near digital (0 or 1) measurement of accessibility at individual elements within individual cells (Extended Data Fig. 3a). For example, within a typical single cell we estimate a total of 9.4% of promoters are represented in a typical scATAC-seq library (Extended Data Fig. 3). The sparse nature of scATAC-seq data makes analysis of cellular variation at individual regulatory elements impractical. We therefore developed an analysis infrastructure to measure regulatory variation using changes of accessibility across sets of genomic features (Fig. 2a,b). To quantify this variation we first choose a set of open chromatin peaks, identified using the aggregate accessibility track, which share a common characteristic (such as transcription factor binding motif, ChIP-seq peaks, cell cycle replication timing domains, etc.). We then calculate the observed fragments in these regions minus the expected fragments, down sampled from the aggregate profile, within individual cells. To correct for bias, we divide this by the root mean square of fragments expected from a background signal (BS) constructed to estimate technical and sampling error within single-cell data sets (Methods and Extended Data Fig. 4). Herein, we refer to this metric as “deviation”. Finally, for any set of features, we aggregate the deviation measurements across cells (Fig 2b) to obtain an overall “variability” score, a metric of excess variance over the background signal.
Figure 2. _Trans_-factors are associated with single-cell epigenomic variability.
(a) Schematic showing two cellular states (TF high and TF low) leading to differential chromatin accessibility. (b) Analysis infrastructure, which uses a calculated background signal (BS; see Supplemental Methods section 3.2) to calculate TF deviations and variability from scATAC-seq data. The TF value is calculated by subtracting the number of expected fragments from the observed fragments per cell (see Supplemental Methods section 3.1). (c) Observed cell-to-cell variability within sets of genomic features associated with ChIP-seq peaks, transcription factor motifs, and replication timing (error estimates shown in grey, see Methods for details). Variability measured from permuted background (see Methods) is shown in grey dots. (d) Distribution of normalized deviations from expected accessibility signal for GATA1 sites in individual cells, histogram of cells shown in grey, density profile shown in purple (see Methods). (e) Immunostaining of GATA1 (green) and GATA2 (red) shows protein expression in K562s. (f) Principal components ranked by fraction of variance explained from observed data (purple) and permuted data (orange). Bar plot of observed data shown in grey. (g) Calculated changes in associated variability of factors when present together versus independently, depicting a context-specific _trans_-factor variability landscape (see Methods). Venn-diagrams show variability associated with GATA1 and/or GATA2 and CTCF and/or SMC3 (co-) occurring ChIP-seq sites.
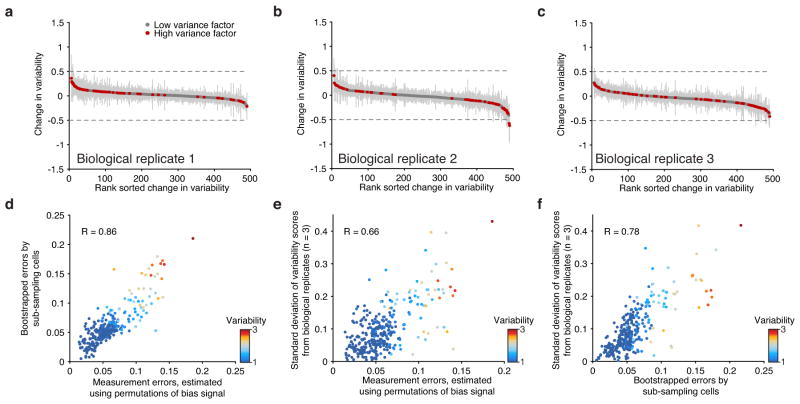
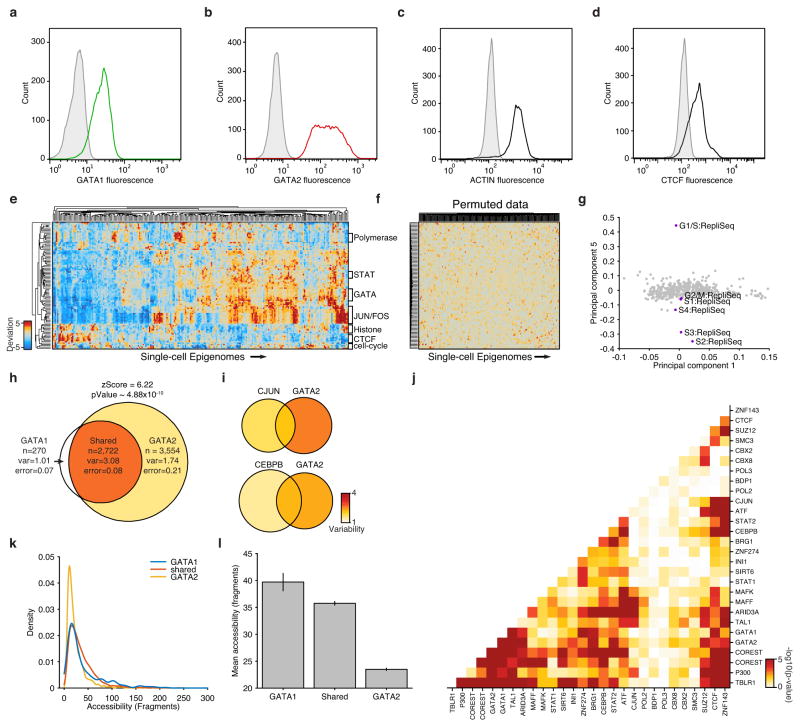
We first focused our analysis on K562 myeloid leukemia cells, a cell type with extensive epigenomic data sets17,18. To comprehensively characterize variability associated with _trans_-factors within individual K562 cells, we computed variability across all available ENCODE ChIP-seq, transcription factor motifs and regions that differed in replication timing (as determined from Repli-Seq data sets19) (Fig. 2c,d). We found measures of cell-to-cell variability were highly reproducible across biological replicates (Extended Data Fig 5). As expected from proliferating cells, we find increased variability within different replication timing domains, representing variable ATAC-seq signal associated with changes in DNA content across the cell cycle. In addition, we discover a set of _trans_-factors associated with high variability. These factors include sequence-specific transcription factors (TFs), such as GATA1/2, JUN, and STAT2, and chromatin effectors, such as BRG1 and P300. Immunostaining followed by microscopy or flow cytometry (Fig. 2e and Extended Data Fig. 6a–d) confirmed heterogeneous expression of GATA1 and GATA2. Principal component (PC) analysis of single-cell deviations across all _trans_-factors show seven significant PCs, with PC 5 describing changes in DNA abundance throughout the cell cycle. This analysis suggests that high-variance _trans_-factors are variable independent of the cell-cycle (Fig. 2f, Extended Data Fig. 6e–g). The remaining PCs show contributions from several TFs, suggesting that variance across sets of _trans_-factors represent distinct regulatory states in individual cells.
We hypothesized that variation associated with different _trans_-factors can synergize, either through cooperative or competitive binding, to induce or suppress site-to-site variability in chromatin accessibility. For example, the most variant factors in K562 cells – GATA1 and GATA2 – display expression heterogeneity and also bind an identical consensus sequence “GATA,” suggesting these factors may compete for access to DNA sequences. In support of this hypothesis, we find regulatory elements with both GATA1 and GATA2 ChIP-seq signals show increased variability in accessibility, whereas sites with only GATA1 or GATA2 show substantially less variability (Fig. 2g, Extended Data Fig. 6h). In contrast, we find no substantial change in variability of GATA1 binding sites that co-occur with JUN or CEBPB (Extended Data Fig. 6i). We also find peaks unique to GATA1 binding are significantly more accessible than peaks unique to GATA2 (Extended Data Fig. 6k–l) supporting the hypothesis that GATA1, an activator of accessibility, competes with GATA2 to induce single-cell variability. Extending this analysis to all TF ChIP-seq data sets revealed a _trans-_factor synergy landscape for accessibility variation (Fig. 2g and Extended Data Fig. 6j). For example, chromatin accessibility variance associated with GATA2 binding is significantly enhanced when the same region could also be bound by GATA1, TAL1 or P300. In contrast, CTCF, SUZ12, and ZNF143 appear to act as general suppressors of accessibility variance, unless associated with proximal binding of ZNF143 or SMC3, the latter a cohesin subunit involved in chromosome looping18,20. Thus, single cell accessibility profiles nominate distinct _trans_-factors that, in combination, induce or suppress cell-to-cell regulatory variation.
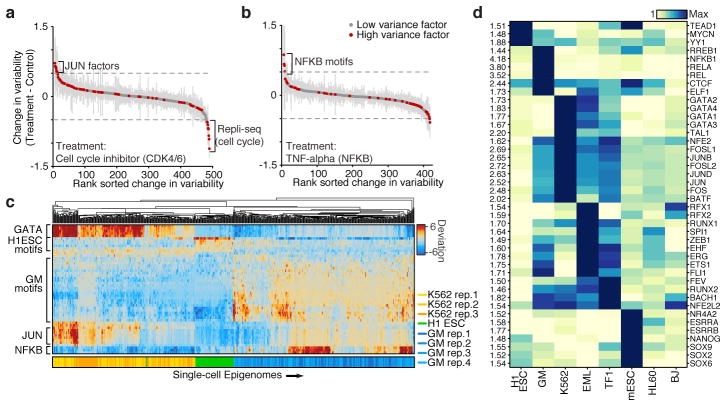
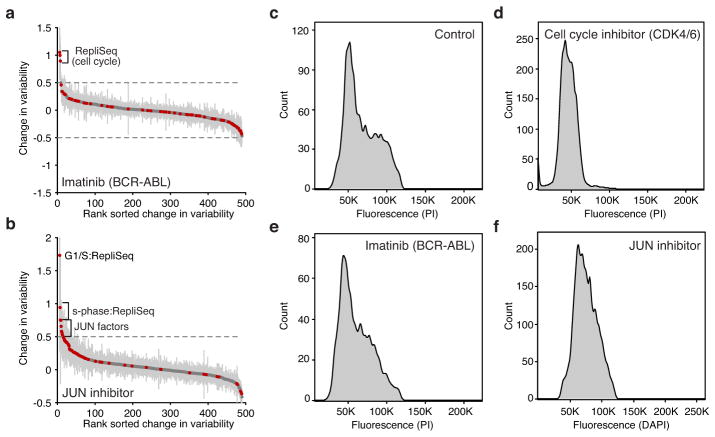
To validate our ability to detect changes in accessibility variance, we used chemical inhibitors to modulate potential sources of cell-cell variability. Inhibition of cyclin-dependent kinases 4 and 6 (CDK4/6), essential components of the cell cycle, caused a marked reduction of variability within peaks associated with DNA replication timing domains (Repli-seq) (Fig. 3a). The addition of inhibitors of JUN or BCR-ABL kinases (JNKi and Imatinib, respectively) increased G1/S-associated variability suggesting an increase in the subpopulation of G1/S cells, which was validated with flow cytometry (Extended Data Fig. 7). JUN variability was one of the top changes caused by JNKi but not Imatinib, suggesting that high-variance _trans-_factors can also be specifically and pharmacologically modulated. Tumor necrosis factor (TNF) treatment of GM12878 cells specifically modulated accessibility variability at NF-κB sites (Fig. 3b), consistent with the known stochastic and oscillatory property of nuclear shuttling in this system21. Together, these results show that variability can be experimentally modulated and further demonstrates that variability is not solely dependent on the cell-cycle.
Figure 3. Cell type specific epigenomic variability.
Change of cellular variability due to chemical perturbations using (a) CDK4/6 cell-cycle inhibitor (K562) or (b) TNF-alpha stimulation (GM12878), error bars (shown in grey) represent 1 standard deviation of bootstrapped cells across the two conditions. (c) Heat map of deviations from expected accessibility signal across _trans_-factors (rows) and of single cells (columns) from 3 cell types. Bottom color map represents assignment classification from hierarchical clustering. (d) Variability associated with _trans_-factor motifs across 7 cell types. Each row is normalized to the maximum variability for that motif across cell types (shown left).
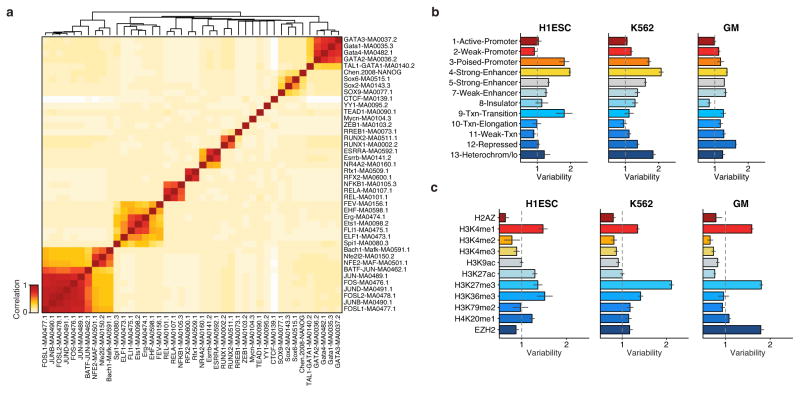
We observe that _trans_-factors associated with high variability are generally cell type specific. Hierarchical bi-clustering of single-cell deviations generated from three cell lines reveals cell-type specific sets of transcription factor motifs associated with high variability (Fig. 3c). This analysis also shows cells from different biological replicates cluster with their cell type of origin (with a single exception), suggesting scATAC-seq can also be used to deconvolve heterogeneous cellular mixtures. Systematic analysis of all assayed cell types identified high-variance _trans_-factor motifs that are generally unique to specific cell types (Fig. 3d and Extended Data Figure 8a). For example, regions associated with GATA TFs are most variant in K562s while regions associated with master pluripotency TFs Nanog and Sox2 are most variant in mouse embryonic stem cells (ESCs), consistent with previous observations of expression variation of these factors22,23. Importantly we also find high variability of GATA1 and PU.1 (SPI1) binding accessibility in EML cells, a cell type previously shown to have >200x GATA1 and >15x PU.1 expression differences within clonal cellular subpopulations1. Interestingly, the complete set of identified high-variance _trans_-factors contains a number of TFs previously reported to dynamically localize into the nucleus, including NF-κB, JUN, and ETS/ERG21,24,25, suggesting that temporal fluctuations in TF concentration may be driving observed chromatin accessibility heterogeneity. Finally, we find BJ fibroblasts and HL-60s exhibit less variance among this set of annotated _trans_-factor motifs, suggesting differences in the global levels of _trans_-factor variability across cell lines. Specific chromatin states and histone modifications26 are also sometimes associated with accessibility variation in single cells (Extended Data Fig. 8b,c). Overall these findings suggest that _trans_-factors promote cell-type specific chromatin accessibility variation genome-wide.
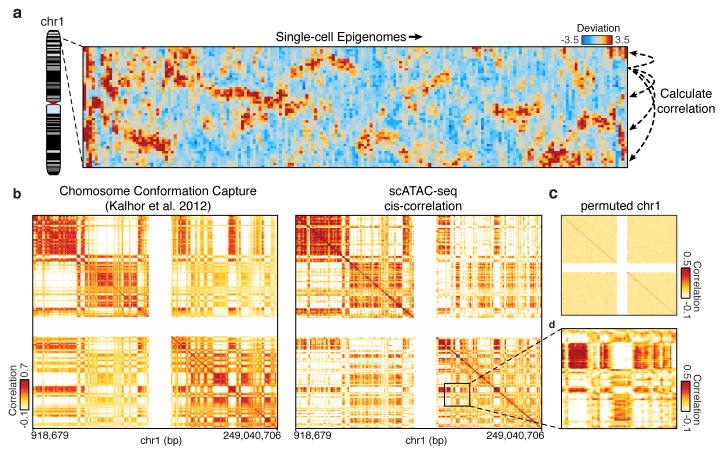
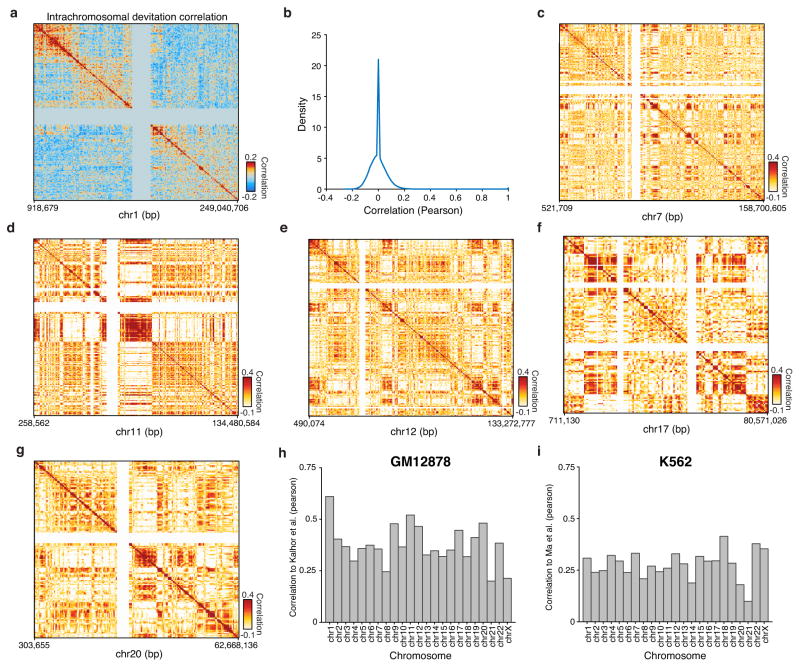
Patterns of variation in accessibility along the linear genome in individual cells reveal an unexpected connection to higher order chromosome folding. We calculated single cell deviations within sliding windows across the genome, each encompassing a fixed number of peaks (N=25) (Fig. 4a). We then determined which windows co-varied within individual cells by calculating the co-correlation of each window across all others within the same chromosome within individual cells (Extended Data Fig. 9a,b). We then further enhanced this co-correlation matrix using a secondary correlation analysis using methods similar to those employed in chromosome conformation studies9 (Methods). The resulting matrix, which identifies pairs of positions in the genome where accessibility co-varies within individual cells, yields Mb-scale correlation domains highly concordant with previously observed chromatin domains29 (Fig. 4b–d and Extended Data Fig. 9c–i) (R=0.61 for chromosome 1). These data provide independent biological validation of large-scale compartmentalization of higher-order chromatin structure9,29. Moreover, these results suggest that higher-order chromatin interactions may drive regulatory variability in cis (elements that are close together tend to be open together), and that ensemble chromosome conformation data may arise in part from the statistical properties of single cell variation in co-regulated accessibility, a hypothesis also supported by single-cell FISH measurements of interactions between DNA loci30.
Figure 4. Structured cis variability across single epigenomes.
(a) Per-cell deviations of expected fragments across a region within chromosome 1 (see Methods). For display, only large deviation cells are shown (N=186 cells). (b) Pearson correlation coefficient representing topological domain signal (see Methods) of interaction frequency from a chromatin conformation capture assay (left, data from Kalhor et al.29) or doubly correlated normalized deviations of scATAC-seq (right) from chromosome 1 (see Methods). Data in white represents masked regions due to highly repetitive regions. (c) Permuted _cis_-correlation map for chromosome 1 (analyzed identically to (b)). (d) Box highlights a representative region depicting long-range covariability.
Using scATAC-seq we dissected single-cell epigenomic heterogeneity and linked _cis_- and _trans_- effectors to variability in accessibility profiles within individual epigenomes. We identify _trans_-factors associated with increased accessibility variance, which we call high-variance _trans_-factors. Additionally, other _trans_-factors such as CTCF appear to buffer variability, perhaps by providing a stable anchor of chromatin accessibility or insulator function that dampens potential fluctuations. Conversely, co-occurance with other factors such as P300 appears to amplify variability, perhaps due to synergistic interactions. Lineage-specific master regulators are associated with cell-type specific single-cell epigenomic variability across several cell types, suggesting that control of single-cell variance is a fundamental characteristic of different biological states. Finally, variation of chromatin accessibility in cis is highly correlated with previously reported chromosome compartments, opening the intriguing possibility that this component of epigenomic noise has its roots in higher-order chromatin organization. All together these data provide exciting new hypothesis of regulatory mechanisms that give rise to single-cell heterogeneity.
We envision that future studies will enhance the utility of scATAC-seq by further improving the recovery of DNA fragments, increasing throughput, and refining methods of data analysis (Supplementary Discussion). Improvements to throughput and new statistical tools will enable single-cells to be partitioned by cell-state and analyzed in aggregate to find the individual peaks that drive variability (Extended Data Fig. 10). In addition, we anticipate scATAC-seq may be paired with existing approaches in microscopy and single-cell RNA-seq to provide opportunities for systems analysis of individual cells. Such an approach will link regulatory variation to details of phenotypic variation, promising new insight into the molecular underpinnings of cellular heterogeneity. We believe scATAC-seq will likewise enable the interrogation of the epigenomic landscape of small or rare biological samples allowing for detailed, and potentially de novo, reconstruction of cellular differentiation or disease at the fundamental unit of investigation – the single cell.
Extended Data
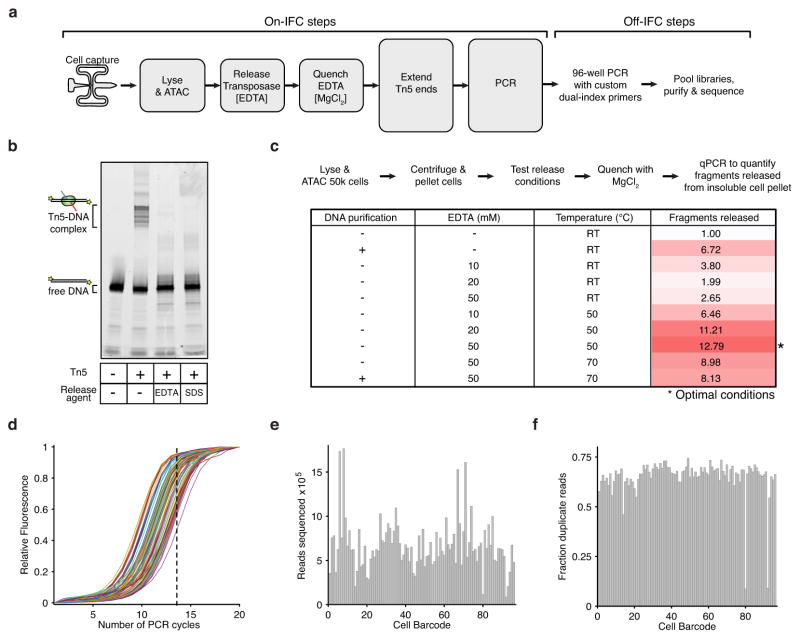
Extended Data Figure 1. Methods development for assaying single epigenomes.
(a) scATAC-seq workflow for steps performed both on and off Fluidigm’s integrated fluidics circuit (IFC). (b–c) The development of an efficient Tn5 release protocol designed to permit downstream enzymatic reactions without DNA purification. (b) An in vitro electrophoretic mobility gel shift assay using a fluorescently labeled PCR product (lane 1), showing a stable Tn5-DNA complex (lane 2) dissociated with 50 mM EDTA (lane 3) or 0.1% SDS (lane 4). (c) Workflow and associated table of conditions used to optimize release protocol, showing conditions that markedly improve fragment yield over no release conditions or purifying DNA (Qiagen MinElute). Fragments released represents the fold gain in library diversity, as measured by quantitative PCR (qPCR). (d) qPCR fluorescence traces of 96 libraries generated using scATAC-seq. For all subsequent libraries we used a total of 14 PCR cycles (dotted line). (e,f) A bar plot of per-cell library (e) sequencing depth and (f) fraction of duplicate reads, showing each library was sequenced to varying depths to a similar fraction of duplicate reads.
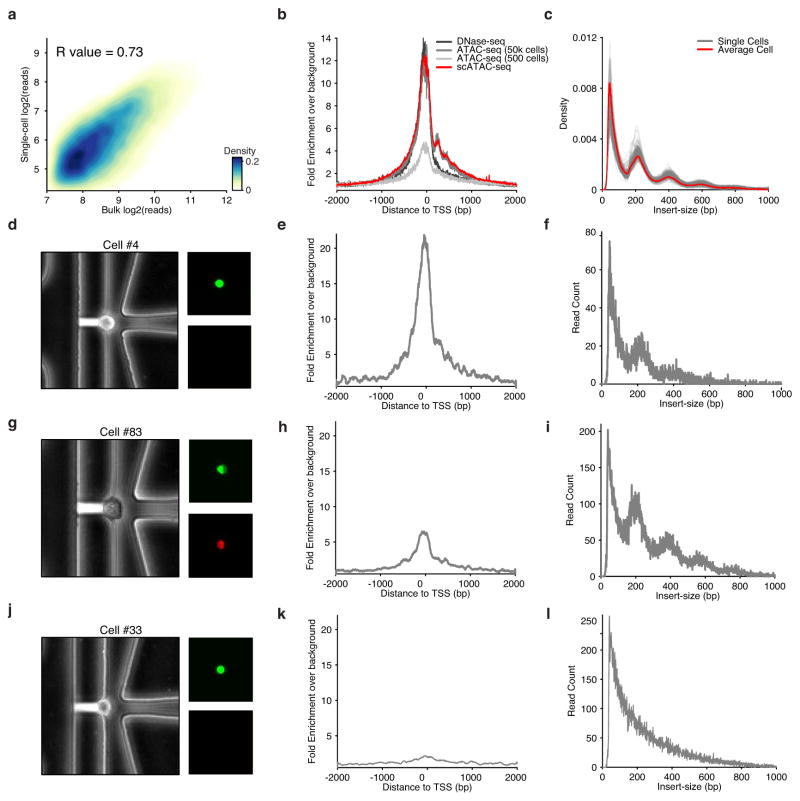
Extended Data Figure 2. scATAC-seq data recapitulate bulk ATAC-seq characteristics.
(a) Reads observed in open chromatin peaks identified from aggregate scATAC-seq data (N = 384 libraries) are highly correlated with reads observed from bulk ATAC-seq. (b) Histogram of aggregated read starts around all TSSs (in K562 cells) comparing ensemble approaches, including 500 cell ATAC-seq reported in a previous publication, to scATAC-seq shows high enrichment above background level of reads. (c) DNA fragment size distribution of ATAC-seq fragments from single cells (grey) and the average of all single cells (red) display characteristic nucleosome-associated periodicity. (d) Phase-contrast (left) and epifluorescence images (right) of captured cell #4 displaying characteristic live cell stain (Calcein) and exclusion of EtBr. (e) Histogram of read starts around TSSs for cell #4 shows high enrichment. (f) DNA fragment size distribution for cell #4 showing nucleosomal periodicity. (g) Images similar to (d) showing staining of cell #83, suggesting low viability due to EtBr staining. (h) Histogram of read starts around TSSs shows lower enrichment than cell #4. (i) DNA fragment size distribution for cell #83. (j) Images similar to (d) showing staining of cell #33 suggesting viability. (k) Histogram of read starts around TSSs of this cell shows low levels of enrichment. (l) DNA fragment size distribution showing no nucleosome-associated periodicity.
Extended Data Figure 3. Fragment recovery metrics within scATAC-seq libraries.
(a) Accessibility across all peaks (n=50,000) in GM12878 cells. (b) Accessibility across all annotated promoters in GM12878 cells. Typical promoters used for subsequent analysis are boxed with dotted lines. Recovery of typical promoters shown in (a) within single-cells within (c) observed data and (d) extrapolated data using measures of predicted library complexity.
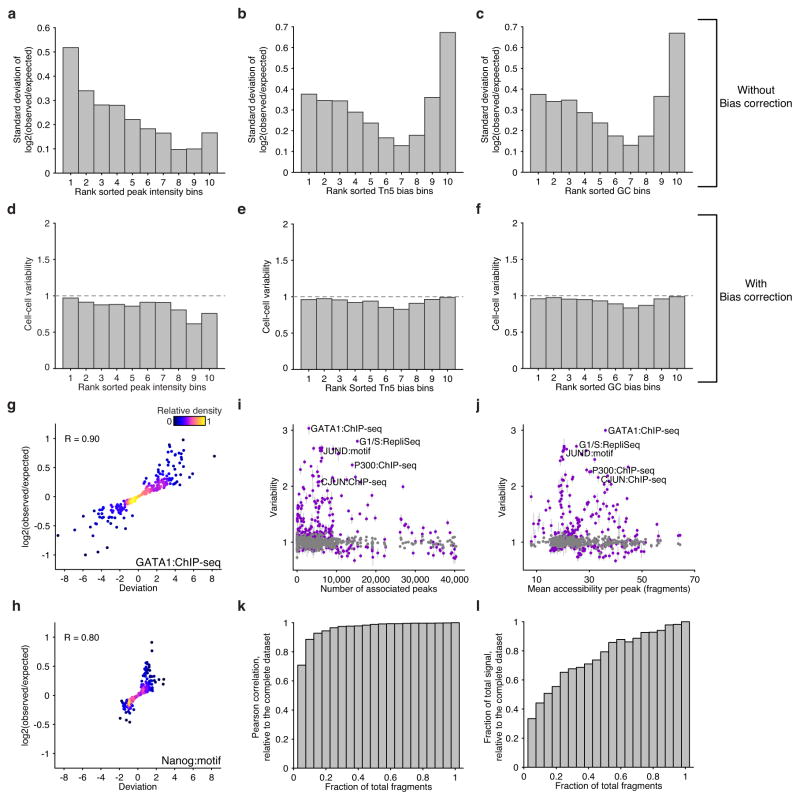
Extended Data Figure 4. scATAC-seq data analysis pipeline and validation of bias normalization.
Standard deviation of log fold change in reads across cells within peaks binned by deciles of (a) peak intensity, (b) Tn5 bias and (c) GC bias. Variability scores (incorporating bias normalization) within the same peaks shown in (a–c), peaks are binned by deciles of (d) peak intensity, (e) Tn5 bias and (f) GC bias. Log fold change versus deviation scores across single K562 cells for (g) GATA1 ChIP-seq target sites and (h) peaks containing a Nanog motif. Variability scores for factors (purple) and the permuted background (grey) ranked by (i) number of peak associations and (j) the mean accessibility per annotated peak. K562 single-cell data sets showing the effect on variability scores as a function of downsampling fragments. Fidelity after downsampling is measured with (k) correlation and (l) dynamic range relative to the complete data set.
Extended Data Figure 5. Biological replicates and measurement error analysis.
(a–c) Observed changes in variability comparing the merged set of replicates (K562) to each individual biological replicate. Error bars represent 1 standard deviation of the variability scores after bootstrapping cells from each replicate. (d–f) Correlation of errors computed using three distinct approaches.
Extended Data Figure 6. Characterization of high-variance _trans_-factors in K562 cells.
(a–d) Distribution of (a) GATA1, (b) GATA2, (c) actin and (d) CTCF fluorescence observed by flow cytometry. Distributions in grey depict isotype controls. (e) Bi-clustered heat map of single cell deviations as observed within K562 cells (N=239). Labels on right identify co-clustering of related factors. (f) Bi-clustered heat map of single-cell deviations observed from permuted data. (g) Projection of factor loadings onto principal component 1 versus 5 from principal component (PC) analysis of heatmap from Fig. 2d. Factor loadings do not vary along PC5, while peaks associated with regions with different replication timings (RepliSeq) have strong variation along this axis. Venn-diagrams showing variability of (h) GATA1 and/or GATA2, (i) CJUN and/or GATA2 and CEBPB and/or GATA2 (co-) occurring ChIP-seq sites. (j) -log10(p-values) of calculated changes in co-occurring ChIP-seq sites shown in Figure 2e. (k) Distribution of accessibility among GATA1 only, GATA2 only, and shared sites. (l) Mean accessibility from GATA1 only, GATA2 only, and shared sites in (k), error bars represent 1 standard deviation generated by bootstrapping ChIP-seq peaks.
Extended Data Figure 7. Drug treatments modulate factor variability.
(a–b) Change in variability of untreated K562 cells versus cells treated with (a) Imatinib and (b) JUN inhibitor show increase of variability in factors associated with the cell cycle or s-phase and JUN factors respectively. (c–f) Flow cytometry data depicting DNA content, using DAPI or PI, in (c) control K562 cells or cells showing altered cell-cycle status after treatment with (d) cell-cycle inhibitor, (e) Imatinib and (f) JUN inhibitor.
Extended Data Figure 8. TF motif correlation and variability across chromatin state.
(a) Hierarchical bi-clustering of high-variance TF motif annotations using Pearson correlation. Variability of regions associated with (b) chromatin states, as identified by Ernst et al.26, and (c) histone modifications.
Extended Data Figure 9. Cis variability analysis within single-cells.
(a) Interchromosomal chromosome 1 co-correlations of deviation scores within single cells calculated for bins of 25 peaks within GM12878 cells. (b) Distribution, using density estimation, of correlation values shown in (a). (c–g) Analysis of _cis_-correlation (identical to Fig. 4) for representative chromosomes 7, 11, 12, 17, and 20. Correlation between scATAC-seq _cis_-correlation and chromosome conformation capture methods for each chromosome in (h) GM12878 and (i) K562 cells.
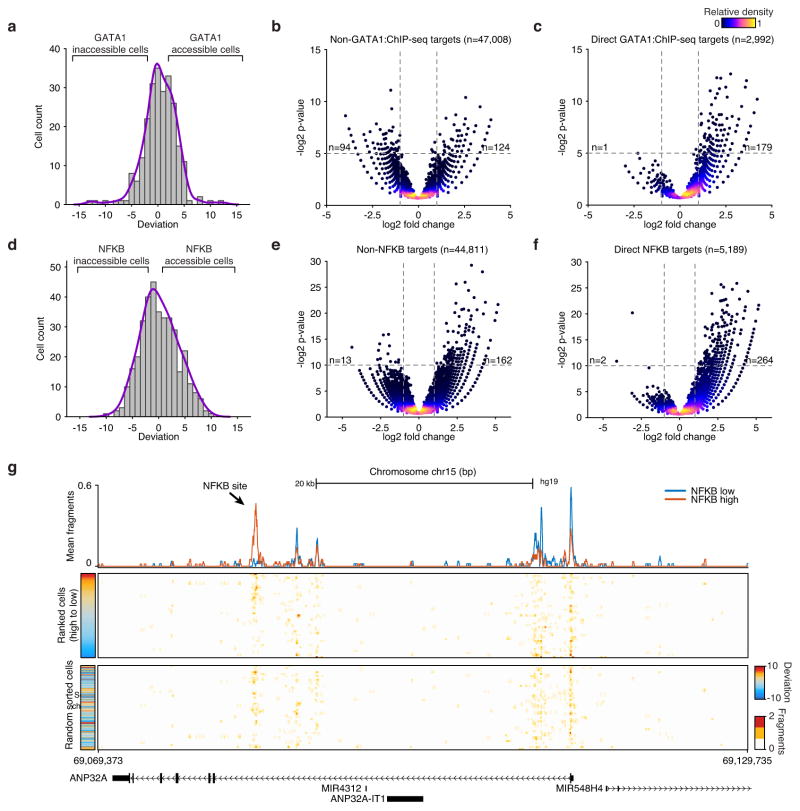
Extended Data Figure 10. Measurements of individual peaks within single-cells.
(a) The distribution of GATA1 deviation scores for single K562 cells. Volcano plots of (b) non-GATA1 peaks and (c) GATA1 peaks in K562 cells, p-values were calculated using a binomial test. (d) The distribution of NF-κB deviation scores for single GM12878 cells. Volcano plots of (e) non-NFKB peaks and (f) NF-κB peaks in GM12878 cells, p-values were calculated using a binomial test. Inset numbers show the number of points in upper left or upper right quadrants of the panel. (g) Accessibility at a genomic locus, showing (top) aggregate NFKB low (blue) and NFKB high (red) profiles, (middle) single GM12878 cells ranked by NFKB deviations scores and (bottom) unranked single-cells.
Supplementary Material
1
Supplemental Table 1: A list of oligonucleotides used in this study.
Supplemental Table 2: Calculated variability scores across all data sets collected.
2
Acknowledgments
This work was supported by National Institutes of Health (NIH) P50HG007735 (to H.Y.C. and W.J.G.), UH2 AR067676 and Lifespan Extension Foundation (H.Y.C.), U19AI057266 (to W.J.G.) and the Rita Allen Foundation (to W.J.G.) and the Baxter Foundation Faculty Scholar Grant (to W.J.G); H.Y.C. is an Early Career Scientist of the Howard Hughes Medical Institute. J.D.B. acknowledges support from the National Science Foundation Graduate Research Fellowships and NIH training grant T32HG000044 for support. M.P.S. acknowledges the NIH and the National Human Genome Research Institute (NHGRI) for funding through 5U54HG00455805. We thank members of Greenleaf and Chang labs, as well as the Fluidigm team, including Larry Xi for useful discussions. We acknowledge the S. Kim lab for assistance with FACS sorting and the C. Bustamante lab for help with sequencing. We also thank, Robert Nichols, Claire Mazumdar, Vittorio Sebastiano and Viviana Risca for cells.
Footnotes
Author Contributions
J.D.B., H.Y.C., and W.J.G. conceived of the method. J.D.B., B.W., M.G., and D.R. developed the Fluidigm C1 microfluidic protocols. B.W. performed all scATAC-seq experiments with supervision from J.D.B. U.M.L. conducted the flow analysis, immunostains and drug treatments. J.D.B. developed and implemented the analysis infrastructure with input from W.J.G. All authors interpreted the data and wrote the manuscript. W.J.G. and H.Y.C. supervised all aspects of this work.
Competing Interest.
Stanford University has filed a provisional patent application on the methods described, and J.D.B., H.Y.C., and W.J.G. are named as inventors. D.R. and M.L.G. declare competing financial interests as employees of Fluidigm Corp.
All data deposited in GEO under the accession number: GSE65360
References
- 1.Chang HH, Hemberg M, Barahona M, Ingber DE, Huang S. Transcriptome-wide noise controls lineage choice in mammalian progenitor cells. Nature. 2008;453:544–547. doi: 10.1038/nature06965. [DOI] [PMC free article] [PubMed] [Google Scholar]
- 2.Imayoshi I, et al. Oscillatory control of factors determining multipotency and fate in mouse neural progenitors. Science. 2013;342:1203–1208. doi: 10.1126/science.1242366. [DOI] [PubMed] [Google Scholar]
- 3.Patel AP, et al. Single-cell RNA-seq highlights intratumoral heterogeneity in primary glioblastoma. Science. 2014;344:1396–1401. doi: 10.1126/science.1254257. [DOI] [PMC free article] [PubMed] [Google Scholar]
- 4.Bendall SC, et al. Single-cell mass cytometry of differential immune and drug responses across a human hematopoietic continuum. Science. 2011;332:687–696. doi: 10.1126/science.1198704. [DOI] [PMC free article] [PubMed] [Google Scholar]
- 5.Raj A, Rifkin SA, Andersen E, van Oudenaarden A. Variability in gene expression underlies incomplete penetrance. Nature. 2010;463:913–918. doi: 10.1038/nature08781. [DOI] [PMC free article] [PubMed] [Google Scholar]
- 6.Jaitin DA, et al. Massively parallel single-cell RNA-seq for marker-free decomposition of tissues into cell types. Science. 2014;343:776–779. doi: 10.1126/science.1247651. [DOI] [PMC free article] [PubMed] [Google Scholar]
- 7.Smallwood SA, et al. Single-cell genome-wide bisulfite sequencing for assessing epigenetic heterogeneity. Nat Meth. 2014;11:817–820. doi: 10.1038/nmeth.3035. [DOI] [PMC free article] [PubMed] [Google Scholar]
- 8.Zong C, Lu S, Chapman AR, Xie XS. Genome-wide detection of single-nucleotide and copy-number variations of a single human cell. Science. 2012;338:1622–1626. doi: 10.1126/science.1229164. [DOI] [PMC free article] [PubMed] [Google Scholar]
- 9.Lieberman-Aiden E, et al. Comprehensive mapping of long-range interactions reveals folding principles of the human genome. Science. 2009;326:289–293. doi: 10.1126/science.1181369. [DOI] [PMC free article] [PubMed] [Google Scholar]
- 10.Michor F, et al. Dynamics of chronic myeloid leukaemia. Nature. 2005;435:1267–1270. doi: 10.1038/nature03669. [DOI] [PubMed] [Google Scholar]
- 11.Consortium TEP. An integrated encyclopedia of DNA elements in the human genome. Nature. 2012;489:57–74. doi: 10.1038/nature11247. [DOI] [PMC free article] [PubMed] [Google Scholar]
- 12.Thurman RE, et al. The accessible chromatin landscape of the human genome. Nature. 2012;489:75–82. doi: 10.1038/nature11232. [DOI] [PMC free article] [PubMed] [Google Scholar]
- 13.Buenrostro JD, Giresi PG, Zaba LC, Chang HY, Greenleaf WJ. Transposition of native chromatin for fast and sensitive epigenomic profiling of open chromatin, DNA-binding proteins and nucleosome position. Nat Meth. 2013;10:1213–1218. doi: 10.1038/nmeth.2688. [DOI] [PMC free article] [PubMed] [Google Scholar]
- 14.Goryshin IY, Reznikoff WS. Tn5 in vitro transposition. J Biol Chem. 1998;273:7367–7374. doi: 10.1074/jbc.273.13.7367. [DOI] [PubMed] [Google Scholar]
- 15.Adey A, et al. Rapid, low-input, low-bias construction of shotgun fragment libraries by high-density in vitro transposition. Genome Biol. 2010;11:R119. doi: 10.1186/gb-2010-11-12-r119. [DOI] [PMC free article] [PubMed] [Google Scholar]
- 16.Consortium TEP. A User’s Guide to the Encyclopedia of DNA Elements (ENCODE) PLoS Biol. 2011;9:e1001046. doi: 10.1371/journal.pbio.1001046. [DOI] [PMC free article] [PubMed] [Google Scholar]
- 17.Gerstein MB, et al. Architecture of the human regulatory network derived from ENCODE data. Nature. 2012;489:91–100. doi: 10.1038/nature11245. [DOI] [PMC free article] [PubMed] [Google Scholar]
- 18.Xie D, et al. Dynamic trans-Acting Factor Colocalization in Human Cells. Cell. 2013;155:713–724. doi: 10.1016/j.cell.2013.09.043. [DOI] [PMC free article] [PubMed] [Google Scholar]
- 19.Hansen RS, et al. Sequencing newly replicated DNA reveals widespread plasticity in human replication timing. Proceedings of the National Academy of Sciences. 2010;107:139–144. doi: 10.1073/pnas.0912402107. [DOI] [PMC free article] [PubMed] [Google Scholar]
- 20.Parelho V, et al. Cohesins Functionally Associate with CTCF on Mammalian Chromosome Arms. Cell. 2008;132:422–433. doi: 10.1016/j.cell.2008.01.011. [DOI] [PubMed] [Google Scholar]
- 21.Tay S, et al. Single-cell NF-kB dynamics reveal digital activation and analogue information processing. Nature. 2010;466:267–271. doi: 10.1038/nature09145. [DOI] [PMC free article] [PubMed] [Google Scholar]
- 22.Grün D, Kester L, van Oudenaarden A. Validation of noise models for single-cell transcriptomics. Nat Meth. 2014;11:637–640. doi: 10.1038/nmeth.2930. [DOI] [PubMed] [Google Scholar]
- 23.Singer ZS, et al. Dynamic Heterogeneity and DNA Methylation in Embryonic Stem Cells. Molecular Cell. 2014;55:319–331. doi: 10.1016/j.molcel.2014.06.029. [DOI] [PMC free article] [PubMed] [Google Scholar]
- 24.Cai L, Dalal CK, Elowitz MB. Frequency-modulated nuclear localization bursts coordinate gene regulation. Nature. 2008;455:485–490. doi: 10.1038/nature07292. [DOI] [PMC free article] [PubMed] [Google Scholar]
- 25.Levine JH, Lin Y, Elowitz MB. Functional roles of pulsing in genetic circuits. Science. 2013;342:1193–1200. doi: 10.1126/science.1239999. [DOI] [PMC free article] [PubMed] [Google Scholar]
- 26.Ernst J, et al. Mapping and analysis of chromatin state dynamics in nine human cell types. Nature. 2011;473:43–49. doi: 10.1038/nature09906. [DOI] [PMC free article] [PubMed] [Google Scholar]
- 27.Calo E, Wysocka J. Modification of Enhancer Chromatin: What, How, and Why? Molecular Cell. 2013;49:825–837. doi: 10.1016/j.molcel.2013.01.038. [DOI] [PMC free article] [PubMed] [Google Scholar]
- 28.Mikkelsen TS, et al. Genome-wide maps of chromatin state in pluripotent and lineage-committed cells. Nature. 2007;448:553–560. doi: 10.1038/nature06008. [DOI] [PMC free article] [PubMed] [Google Scholar]
- 29.Kalhor R, Tjong H, Jayathilaka N, Alber F, Chen L. Genome architectures revealed by tethered chromosome conformation capture and population-based modeling. Nat Biotechnol. 2012;30:90–98. doi: 10.1038/nbt.2057. [DOI] [PMC free article] [PubMed] [Google Scholar]
- 30.Giorgetti L, et al. Predictive Polymer Modeling Reveals Coupled Fluctuations in Chromosome Conformation and Transcription. Cell. 2014;157:950–963. doi: 10.1016/j.cell.2014.03.025. [DOI] [PMC free article] [PubMed] [Google Scholar]
Associated Data
This section collects any data citations, data availability statements, or supplementary materials included in this article.
Supplementary Materials
1
Supplemental Table 1: A list of oligonucleotides used in this study.
Supplemental Table 2: Calculated variability scores across all data sets collected.
2
