The C9ORF72 repeat expansion disrupts nucleocytoplasmic transport (original) (raw)
. Author manuscript; available in PMC: 2016 Mar 21.
Published in final edited form as: Nature. 2015 Aug 26;525(7567):56–61. doi: 10.1038/nature14973
Abstract
A GGGGCC (G4C2) hexanucleotide repeat expansion (HRE) in C9ORF72 is the most common cause of amyotrophic lateral sclerosis (ALS) and frontotemporal dementia (FTD). Recent studies support an HRE RNA gain-of-function mechanism of neurotoxicity, and we previously identified protein interactors for the G4C2 RNA including RanGAP1. A candidate-based genetic screen in Drosophila expressing 30 G4C2 repeats identified RanGAP (Drosophila ortholog of human RanGAP1), a key regulator of nucleocytoplasmic transport, as a potent suppressor of neurodegeneration. Enhancing nuclear import or suppressing nuclear export of proteins also suppresses neurodegeneration. RanGAP physically interacts with HRE RNA and is mislocalized in HRE-expressing flies, neurons from C9ORF72 ALS patient-derived induced pluripotent stem cells (iPSNs), and in C9ORF72 patient brain tissue. Nuclear import is impaired as a result of HRE expression in the fly model and in C9ORF72 iPSNs, and these deficits are rescued by small molecules and antisense oligonucleotides targeting the HRE G-quadruplexes. Nucleocytoplasmic transport defects may be a fundamental pathway for ALS and FTD amenable to pharmacotherapeutic intervention.
Introduction
The G4C2 HRE in the C9ORF72 gene is found in as much as 40% of familial ALS and FTD with additional reports in other neurodegenerative diseases1-3. C9ORF72 HRE-induced cytotoxicity has been proposed to be caused through loss and gain-of-function mechanisms which include: 1) transcribed sense GGGGCCexp or antisense (CCCCGGexp) RNAs that sequester proteins thus altering their normal function2; or 2) the sense or antisense expanded RNAs are translated via repeat-associated non-AUG translation to form toxic dipeptide repeat proteins (DPRs)4-7. We and others have demonstrated that HRE RNA forms hairpin and G-quadruplex structures that bind and sequester RNA binding proteins (RBPs) 8, 9.
Results
RanGAP is a strong suppressor of C9ORF72 HRE–mediated toxicity in Drosophila.
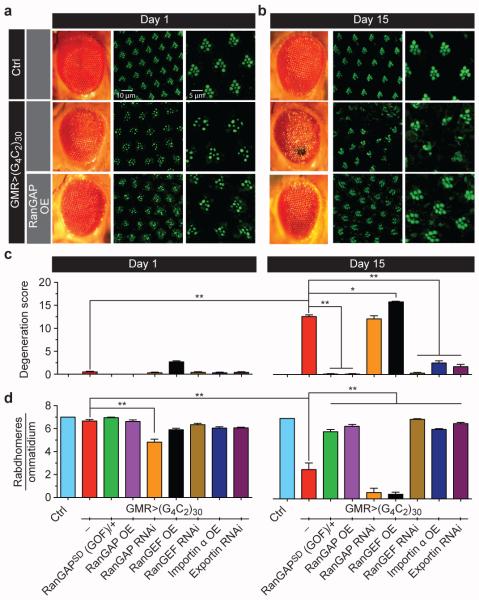
We previously identified 19 proteins that exhibit high affinity to G4C2 relative to a G:C scrambled RNA along with ~400 additional proteins that bind with a moderate affinity to G4C2 and/or bind both G4C2 and G:C scrambled RNA 8, 9. To determine which of these candidate RBPs genetically modifies G4C2-mediated neurodegeneration, we performed a screen in an established Drosophila model that expresses 30 G4C2 repeats [(G4C2)30] in the fly eye10 (Supplemental Table 1). One of the strongest suppressors is a dominant, gain-of-function (GOF) allele of RanGAP, called RanGAPSD(GOF), that functions similarly to overexpression of wild type RanGAP11-13. As shown in Fig. 1a, 1-day-old flies expressing (G4C2)30 display subtle ommatidial disorganization defects in the eye that worsen when aged for 15 days (Fig. 1b). However, flies expressing the same repeats in the heterozygous RanGAPSD(GOF) mutant background or with RanGAP overexpression appear normal (Fig. 1a-c, and Extended Data Fig. 1), indicating that RanGAP is a suppressor of G4C2 repeat toxicity.
Fig. 1. Genetic interaction between G4C2 repeats and nucleocytoplasmic transport machinery.
External eye morphology of 1-day-old (a, left panels) and 15-day-old (b, left panels) flies. Phalloidin staining of the retina of 1-day-old (a, mid panels, magnified in right panels) and 15-day-old (b, mid panels, magnified in right panels) flies. Wild type control (top row); flies expressing 30 G4C2 repeats (mid row); flies expressing 30 G4C2 repeats and overexpressing RanGAP (bottom row). Genotypes: (top row) GMR-GAL4/+; (mid row) GMR-GAL4, UAS-(G4C2)30/+; (bottom row) GMR-GAL4, UAS-(G4C2)30/+; UAS-RanGAP/+. Quantification of external morphology (c) and rhabdomere number (d). (*, p<0.05; **, p<0.01)
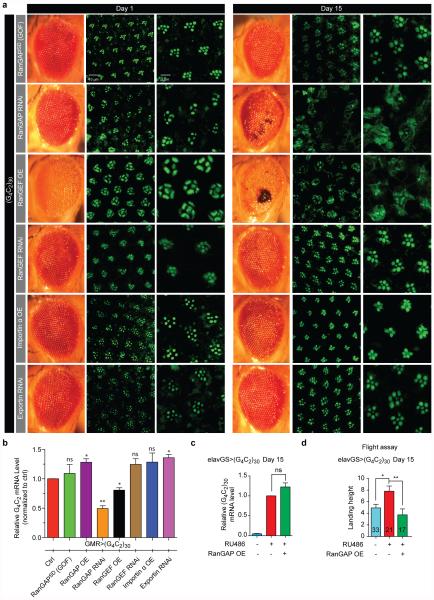
As shown in Fig. 1a-b, wild type fly eyes have seven photoreceptor neuron (PRN) rhabdomeres per ommatidium. In contrast, the PRNs expressing 30 G4C2 repeats show a loss of integrity and/or organization of rhabodmeres at day 15 (Fig. 1a-b, d), suggesting age-dependent degeneration. These phenotypes are rescued by either heterozygous RanGAPSD(GOF) mutant or RanGAP overexpression. Conversely, knockdown of RanGAP by RNAi significantly enhances the PRN defects (Fig. 1d and Extended Data Fig. 1a). Moreover, RanGAP knockdown-mediated enhancement of (G4C2)30-mediated degeneration worsens with age, with an almost complete loss of rhabdomeres in aged flies which is not due to alterations in G4C2 mRNA level (Extended Data, Fig.1b). These data indicate that RanGAP is a potent suppressor of G4C2-mediated neurodegeneration in the Drosophila eye.
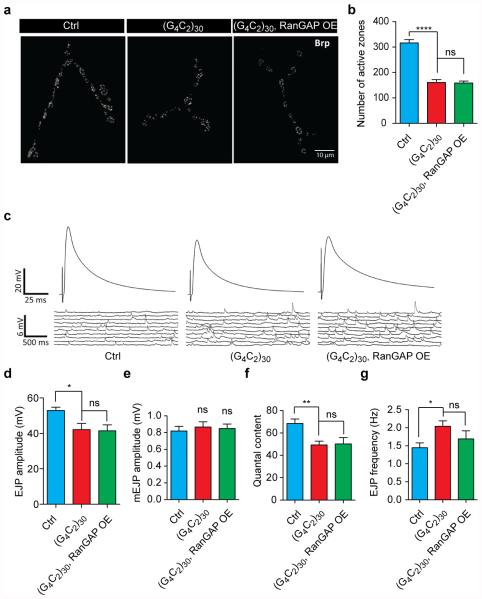
To determine whether RanGAP also suppresses G4C2-mediated toxicity in Drosophila motor neurons, we next analyzed the effect of RanGAP overexpression on the locomotor function of adult flies. Neuronal expression of (G4C2)30 throughout adulthood causes flight defects in 15-day-old flies that are rescued with simultaneous overexpression of RanGAP (Extended Data Fig. 1c-d). Interestingly, when expressed in motor neurons throughout larval development using OK371-GAL4, (G4C2)30 causes severe NMJ defects including an ~50% reduction in active zone number and impaired evoked neurotransmitter release that is not rescued by RanGAP overexpression (Extended Data Fig. 2). Together, these data suggest that RanGAP suppresses G4C2-mediated neurodegeneration during adulthood, whereas (G4C2)30 expression during development causes neurotoxicity that is independent of RanGAP.
Modulating nucleocytoplasmic transport affects G4C2-mediated neurodegeneration
RanGAP functions in the cytoplasm to stimulate Ran GTPase (hereafter referred to as Ran) to hydrolyze GTP to GDP, a process required for efficient nucleocytoplasmic transport12, 14, 15. Proteins larger than 40 kD require active transport to cross the NPC, in which their nuclear localization sequence (NLS) and/or nuclear export signal (NES) are recognized by carrier protein importins and/or exportins, respectively16-18. In the nucleus, exportins bind Ran[GTP]and cargo proteins for export. Nuclear Ran guanine nucleotide exchange factor (RanGEF) converts Ran[GDP] back to Ran[GTP]19.
As shown in Fig. 1c-d and Extended Data Fig. 1a-b, overexpression of RanGEF enhances G4C2 repeat-mediated degeneration, resulting in large necrotic patches and severe rhabdomere degeneration. In contrast, knockdown of RanGEF rescues both these phenotypes. These data suggest that RanGEF plays an opposite role when compared with RanGAP in G4C2-mediated neurodegeneration, consistent with their opposing biochemical functions. Overexpression of Importin α or knockdown of Exportin rescues these phenotypes. Thus genetically enhancing nuclear import or inhibiting export of NLS/NES-containing proteins suppresses G4C2-mediated neurodegeneration.
Expression of arginine-containing DPRs in Drosophila causes severe toxicity, and polyGR DPRs are detected in flies expressing 36 G4C2 repeats under control of heat shock-inducible GAL4 (hs-GAL4)7. Although we are also able to detect polyGR DPRs in hs-GAL4, UAS-(G4C2)30 flies when heat-shocked, we are not able to detect polyGR or polyGP DPRs when (G4C2)30 is expressed in the eye with GMR-GAL4 at the time of PRN degeneration or in adult neurons with elavGS (Extended Data Fig. 3a and b). Nonetheless, we can not exclude the possibility that DPRs are expressed at undetectable levels and contribute to degeneration in the eye.
Human and fly RanGAP bind G4C2 repeats and are associated with nuclear pore pathology
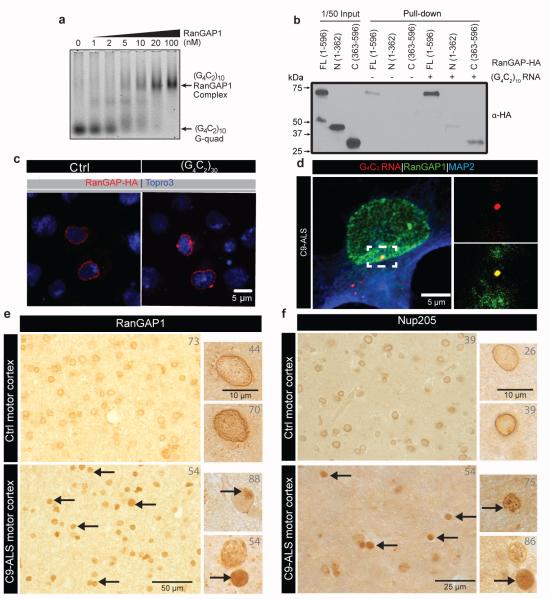
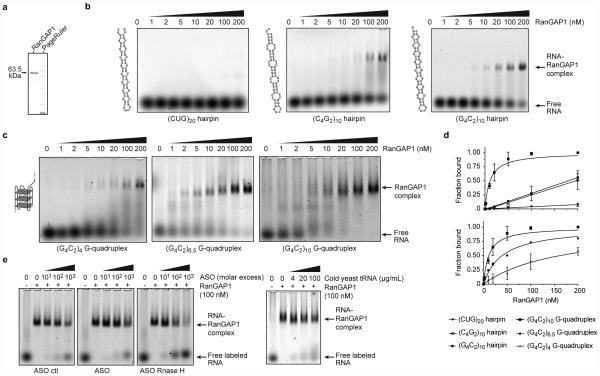
To determine the relative affinity of RanGAP for G4C2 RNA, we performed an electrophoretic gel mobility shift assay (EMSA) with (G4C2)10 RNA and recombinant human RanGAP1 (Extended Data Fig. 4a). The sense (G4C2)10 RNA G-quadruplex shows a concentration- and length-dependent shift of free RNA to a lower mobility RNA•RanGAP1 complex with increasing concentrations of RanGAP1 (Fig. 2a and Extended Data Fig. 4b-d). Additionally, RanGAP1 demonstrates a higher binding affinity to the sense strand G-quadruplex compared to hairpins (Extended Data Fig. 4b-d), and very little interaction was observed between RanGAP1 and (CUG)20. Furthermore, the RanGAP1•(G4C2)10 complex is resistant to antisense oligonucleotides (ASOs) against the G4C2 repeat and nonspecific RNA competitor even at 1000 fold RNA molar excess (Extended Data Fig. 4e). These in vitro results indicate that RanGAP1 preferentially binds the sense RNA G-quadruplex from the C9ORF72 HRE.
Fig. 2. RanGAP binds to G4C2 repeats and is mislocalized along with NPC components.
(a) EMSA of human RanGAP1 and repeat RNA in the G-quadruplex conformation. (b) RanGAP-HA pull-down in the absence (lane 4-6) or presence (lane 7-9) of biotinylated G4C2 RNA repeats, immunoblotted with a HA antibody. Lane 1-3: 1/50 input. (c) Wild type control (left) and G4C2 -HRE (right) S2 cells expressing RanGAP-HA co-stained with an antibody against HA (red) and TO-PRO3 (blue). (d) RanGAP1 co-localization with G4C2 RNA foci (dotted box; projected view, single plane, high magnification) in a C9-ALS iPS neuron in confocal single plane image.(e) RanGAP1 immunostaining in non-neurological control and C9ORF72 ALS motor cortex and cerebellum showing intense nuclear localization and aberrant nuclear aggregates, (individual patient identifier in upper right corner, Supplemental Table 2). (f) Abnormal nuclear localization of nup205 in C9ORF72 human motor cortex cells.
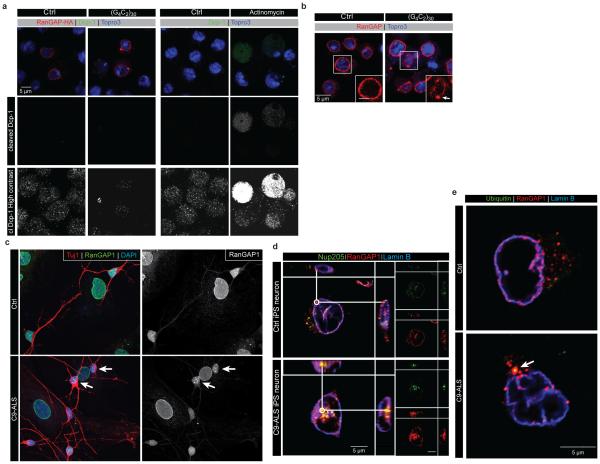
To confirm that RanGAP interacts with G4C2 RNA in cells, we expressed carboxy-terminal HA-tagged Drosophila RanGAP protein in S2 cells and performed RNA pull-down. As shown in Fig. 2b, Western blot analysis demonstrates that the full length and carboxy-terminal domain of RanGAP physically interact with G4C2-repeat RNA in Drosophila cells. Both endogenous and transfected RanGAP-HA uniformly surrounds the nuclei of control cells (Fig. 2c and Extended Data Fig. 5a-b). In contrast, expression of (G4C2)30 leads to formation of large RanGAP perinuclear puncta, which is not due to induction of apoptosis (Extended Data Fig. 5a).
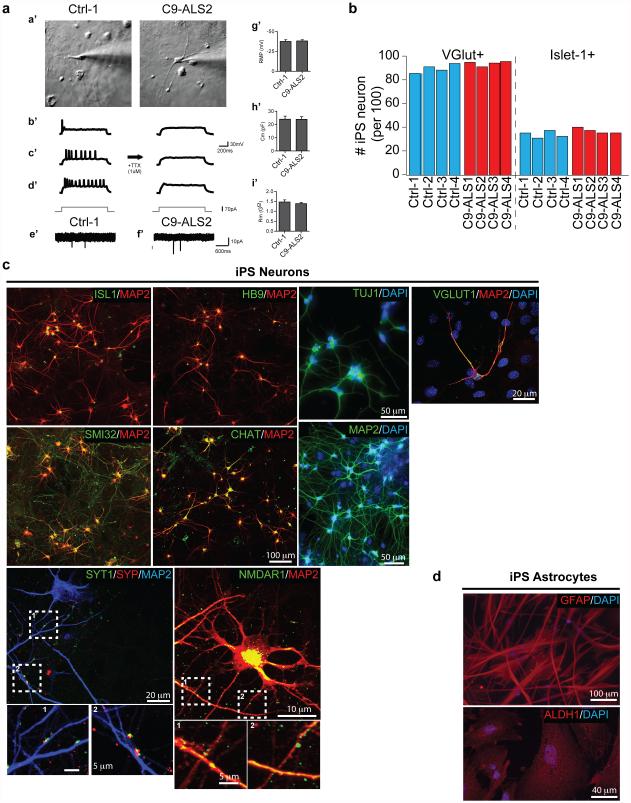
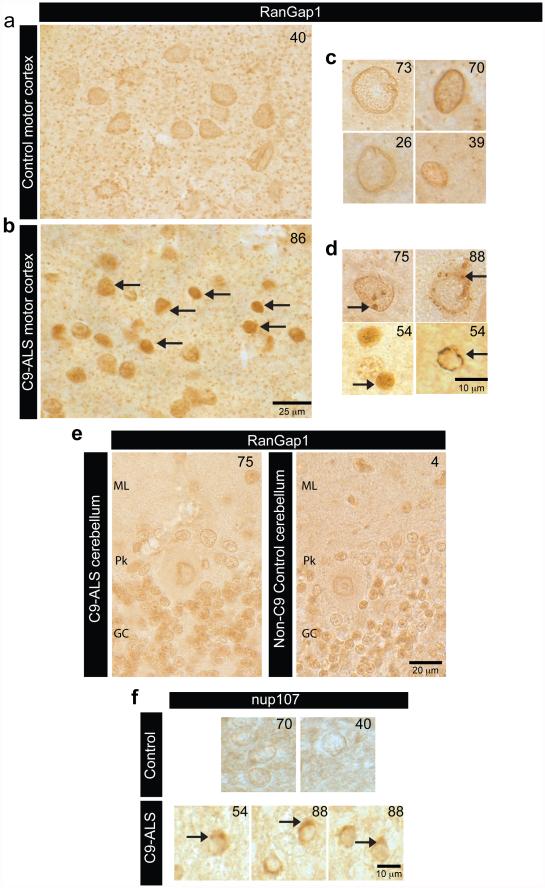
In parallel with studies in Drosophila, we investigated RanGAP1 in iPS neurons derived from multiple C9-ALS patients (Extended Data Fig. 6, Supplemental Table 3 & 4). Our iPS cultures are comprised of 30-40% motor neurons (Islet-1 positive) and predominantly excitatory neurons (vGLUT positive) and express additional motor neuron markers, neural-specific cytoskeletal proteins and synaptic proteins (Supplemental Table 3; Extended Data Fig. 6b-c). Consistent with our observations in S2 cells, iPSNs from C9-ALS patients variably exhibit RanGAP1 puncta (Extended Data Fig. 5c), and RanGAP1 can colocalize with G4C2 RNA (Fig. 2d). Importantly, to determine whether RanGAP1 mislocalization occurs in human disease, we analyzed brain tissue of C9-ALS patients. Cells in C9-ALS motor cortex commonly exhibit mislocalized, discontinuous, and large punctate RanGAP1 signals compared to smooth perinuclear staining observed in controls (Fig. 2e; Extended Data Fig. 7a-d; Supplemental Table 2). Similar pathology was not readily observed in C9-ALS cerebellar cortex (Extended Data Fig 7e). Perinuclear cytoplasmic RanGAP1 puncta occasionally colocalize with ubiquitin (Extended Data Fig. 5e). We next asked whether RanGAP1 puncta contain other protein components of the NPC and stained for Nucleoporin 205 (Nup205), an extremely long-lived NPC scaffold protein20, 21. We find that RanGAP1 and Nup205 colocalize and are predominantly perinuclear in control iPS neurons and brain tissue (Fig 2f). Interestingly, Nup205 colocalizes with some RanGAP1 aggregates in C9-ALS iPS neurons (Extended Data Fig 5d). Consistent with this observation, Nup205 and Nup107 exhibit similar motor cortex pathology as RanGAP1 in multiple C9-ALS patients (Fig. 2f; Extended Data Fig 7f ; Supplemental Table 2). These data suggest that RanGAP1 and additional components of the NPC are disrupted in C9-ALS patients.
The nucleocytoplasmic Ran gradient is disrupted by the C9ORF72 HRE
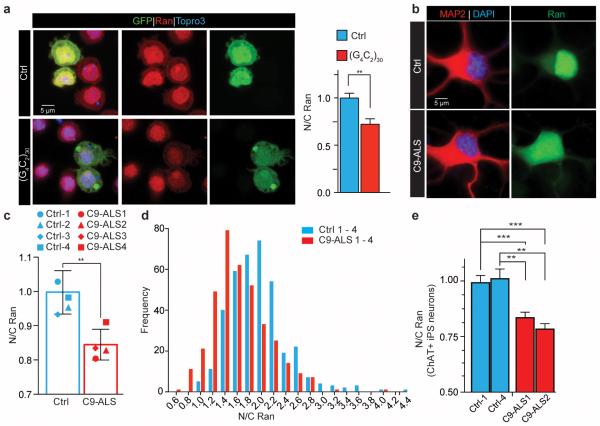
We then tested whether sequestration of RanGAP by the G4C2 RNA leads to its loss of function. Most Ran protein is imported into the nucleus, a process that requires its binding to GDP, but not GTP22-24. Hence, defects in RanGAP1 activity might affect the nuclear-cytoplasmic (N/C) distribution of Ran. Indeed, we observed a significant reduction in the N/C ratio of Ran in S2 cells expressing (G4C2)30 (Fig. 3a), suggesting that RanGAP function is impaired.
Fig. 3. C9ORF72 HRE disrupts the nuclear/cytoplasmic Ran gradient.
(a) S2 cells co-transfected with GFP and (G4C2)30 (bottom row) or control (top row) and stained with a Ran antibody (red) and TO-PRO3 (blue). (b) iPSNs from control and C9-ALS patients showing mislocalization of Ran to the cytoplasm in C9-ALS. (c) Quantification of N/C Ran gradient in neurons from four control and four C9-ALS iPS lines when normalized to control. N/C Ran ratio is reduced in C9-ALS neurons. Each symbol represent mean of up to 228 neurons per line (see Supplemental Table 4). Bar indicates mean N/C Ran of four control or C9-ALS lines; error bars indicate SEM (d) N/C Ran histogram shows higher frequency of lower N/C ratios in four C9-ALS lines as compared to the four control lines. N/C ratios are presented as raw values. (e) C9-ALS ChAT+ neurons show similar reduction of N/C Ran. N/C Ran is normalized to controls and up to 60 neurons were tested per line (see Supplemental Table 4), (**, p<0.01****, p<0.0001).
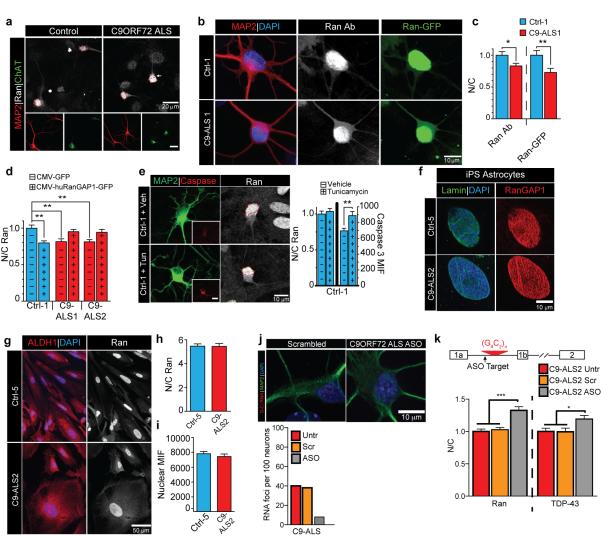
Next, we quantified nuclear and cytoplasmic Ran in C9-ALS iPS neurons via IF (Fig. 3b-d; Extended Data Fig. 8b-c). We observed a significant reduction in the N/C ratio of endogenous Ran in the C9-ALS lines tested in mature MAP2+ iPS neurons at 50-70 DIV (Fig. 3c-d). Ran gradient abnormalities were also detected in mature ChAT positive neurons within the same cultures (Fig. 3e; Extended Data Fig. 8a). Overexpression of a functional Ran-GFP fusion protein in C9-ALS iPS neurons also showed reduced N/C Ran gradients in C9-ALS iPS neurons (Extended Data Fig. 8b-c).
RanGAP1-GFP overexpression in C9-ALS iPS neurons rescued the disrupted N/C Ran gradient to control levels (Extended Data Fig. 8d), demonstrating that altered RanGAP1 function contributes to the disrupted N/C Ran ratio. The disrupted Ran gradient is not due to apoptosis since treatment of control iPS neurons with tunicamycin does not alter N/C Ran despite elevating activated Caspase 3 levels (Extended Data Fig. 8e), RanGAP1 and Ran mislocalization were not observed in iPS astrocytes derived from C9-ALS patients (Extended Data Fig. 6d; 8f-i). Taken together, our fly and human iPS data indicate that the G4C2 HRE impairs neuronal RanGAP1 function resulting in higher levels of cytoplasmic Ran protein.
Reduced nuclear import in Drosophila cells and C9ORF72 ALS iPS neurons
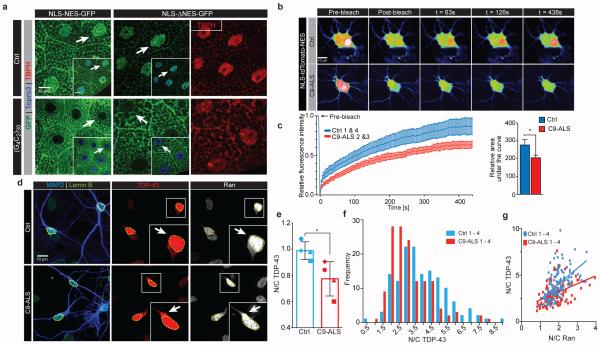
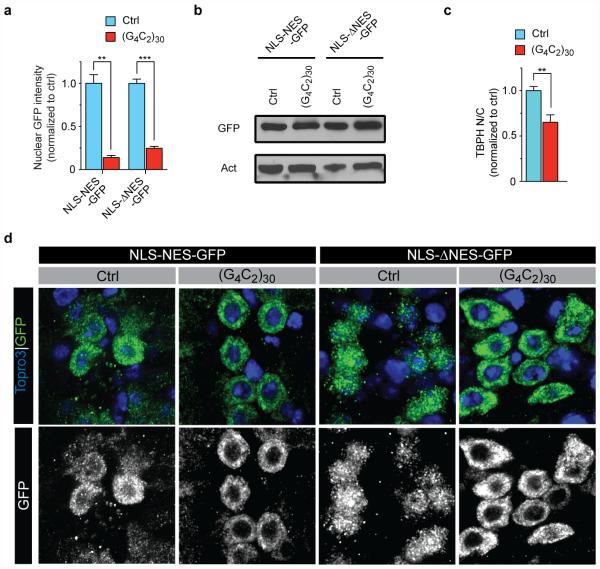
To determine if the HRE significantly impairs nuclear import, we overexpressed a GFP protein tagged with both a classical NLS and a NES (NLS-NES-GFP)12 in the Drosophila salivary gland where the cytoplasm and nucleus are large and distinct. NLS-NES-GFP is localized to both nuclei and cytoplasm of wild type salivary gland cells (Fig. 4a). However, in cells expressing (G4C2)30, the N/C ratio of NLS-NES-GFP is severely reduced (Fig. 4a, Extended Data Fig. 9a), suggesting that nuclear import is inhibited and/or that nuclear export is enhanced.
Fig. 4. C9ORF72 HRE causes nucleocytoplasmic transport defects.
(a) Salivary glands expressing NLS-NES-GFP or NLS-ΔNES-GFP are co-stained for GFP , TBPH (red), and nuclei (blue, insets). (b) Representative images of NLS-tdTomato-NES FRAP analysis in control and C9-ALS iPS neurons (control, n=34; C9-ALS n=29). (c) Quantification of nuclear recovery (FRAP) of two C9-ALS and control iPS lines. Error bars indicate SEM. (d) Representative images of control and C9-ALS iPS neurons. Arrows indicate higher cytoplasmic Ran and TDP-43 signals. (e) Quantification of mean N/C ratio of TDP-43 of four control and four C9-ALS lines when normalized to controls. Each symbol represents up to 49 neurons per line (see Supplemental Table 4). Error bars indicate SD. (f) Histogram shows higher frequency of lower N/C TDP-43 ratio. N/C ratios are presented as raw values. (g) N/C TDP-43 directly correlates with N/C Ran ratio across all lines tested. N/C TDP-43 vs. N/C Ran - Control: p<0.0001, r2= 0.2980; C9-ALS: p<0.0001, r2=0.1657. (*, p<0.05; **, p<0.01; ***, p<0.001)
Next, we expressed a GFP protein tagged with an NLS and a mutated NES, which severely impairs its export activity (ΔNES)12. In control cells, NLS-ΔNES-GFP localizes primarily to the nucleus (Fig. 4a), whereas in cells expressing (G4C2)30, it localizes predominantly to the cytoplasm (Fig. 4a), supporting an impairment of nuclear import in these cells. Using immunoblot, we confirmed that the levels of GFP protein are similar in control and (G4C2)30-expressing salivary glands (Extended Data Fig. 9b). We also detect cytoplasmic mislocalization of NLS-NES- and NLS-ΔNES-GFP in glutamatergic neurons of the ventral nerve cord in (G4C2)30-expressing flies (Extended Data Fig. 9d), indicating that the G4C2 HRE also affects nucleocytoplasmic transport in Drosophila motor neurons. Therefore, expression of the G4C2 HRE decreases nuclear import in Drosophila cells in vivo.
We next investigated the effects of nuclear import deficits on candidate nuclear NLS or NES-containing proteins. TDP-43 (TBPH in Drosophila), a predominantly nuclear protein, contains both a classical NLS and NES, and it is depleted from the nucleus of some CNS neurons and glia in most ALS patients and ~45% of FTD patients25. Therefore, we hypothesize that its nuclear localization will be affected if nuclear import is disrupted. Indeed, loss of nuclear Ran correlates with depletion of nuclear TDP-43 in an FTD mouse model26. As shown in Fig. 4a and Extended Data Fig. 9c, the N/C ratio of endogenous TBPH is significantly reduced in (G4C2)30-expressing salivary gland cells..
To validate our observations in human neurons, we investigated nucleocytoplasmic transport in iPSNs by expressing a tdTomato reporter with a classical NLS and NES and performing fluorescence recovery after photobleaching (FRAP) of neuronal nuclei27. We observed reduced nuclear recovery of NLS-tdTomato-NES in C9-ALS iPSNs when compared with control lines (Fig. 4b-c). This defect was associated with disruption of TDP-43 localization as C9-ALS iPSNs exhibit variable, but significantly reduced N/C ratio of TDP-43 levels (Fig. 4d-e). N/C ratios of Ran and TDP-43 correlate in control and C9-ALS iPS neurons (Fig. 4g), consistent with previous findings that the nuclear import of TDP-43 is Ran dependent28. These data indicate that the C9-ALS HRE leads to impaired nuclear import of proteins that contain a classical NLS.
Pharmacologic rescue of HRE-mediated neurodegeneration
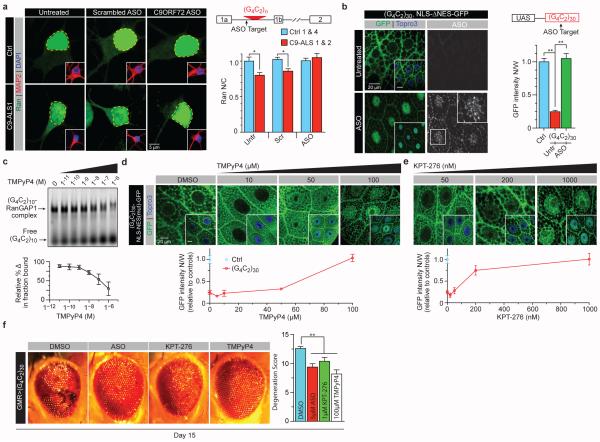
To determine if ASOs targeting the C9ORF72 RNA rescue the disrupted N/C Ran ratio observed in C9-ALS iPS neurons, we treated these cells with C9 sense or scrambled ASOs used previously8, 29, 30. The sense strand ASO treatment reduced RNA foci in C9-ALS iPS neurons (Extended Data Fig. 8j) and fully rescued the disrupted N/C Ran gradient (Fig. 5a), suggesting that the nucleocytoplasmic transport deficits are due to C9ORF72 sense-strand toxicity. Notably, when C9-iPSNs are treated with these ASOs, both the N/C Ran and TDP-43 gradients are increased (Extended Data fig. 8k). The ASO also suppressed nuclear import defects caused by G4C2 repeats in vivo. Drosophila larvae co-expressing (G4C2)30 and NLS-ΔNES-GFP were raised on food supplemented with an ASO throughout larval stages, mitigating nuclear mislocalization of NLS-ΔNES-GFP in salivary glands (Fig. 5b).
Fig. 5. Pharmacological rescue of nucleocytoplasmic transport defects.
(a) Neuronal N/C Ran ratio in control and two C9-ALS iPS lines show increased cytoplasmic Ran levels in untreated and scrambled ASO-treated C9-ALS iPS neurons (n=50 neurons/line; see Supplemental Table 4). (b) Salivary glands of larvae expressing G4C2 HRE and NLS-ΔNES-GFP are untreated (top row) or treated with 5μM ASO and are co-stained for GFP (green), TO-PRO3 (blue) and ASO (white). (c) EMSA of RanGAP1 and repeat RNA in the presence of TMPyP4 (top panel) and relative change in fraction bound (bottom panel). (d-e) salivary glands of larvae expressing G4C2 HRE and NLS-ΔNES-GFP are treated with (d) different concentrations of TMPyP4 or (e) KPT-276 versus vehicle control and are co-stained for GFP (green) and TO-PRO3 (blue). (f) The effects of ASO, KPT-276, and TMPyP4 on the external morphology of eyes expressing G4C2 repeats. (*, p<0.05; **, p<0.01)
RanGAP1 binds the G4C2 RNA G-quadruplex in vitro (Fig. 2a). Therefore, we then tested whether this interaction can be perturbed by a porphyrin compound, TMPyP4 that destabilizes RNA G-quadruplex tertiary structures31. Indeed, TMPyP4 reduces the affinity of RanGAP1 for the (G4C2)10 G-quadruplex in a dose-dependent manner (Fig. 5c). TMPyP4 also rescues nuclear import defects in the fly model in a dose-dependent manner (Fig. 5d). Thus inhibition of the G4C2 G-quadruplex structure significantly suppresses HRE-mediated nuclear import deficits. Interestingly, these phenotypes are also suppressed using an exportin 1 inhibitor, KPT-276 (Fig. 5e)32, suggesting that inhibiting nuclear export may compensate for disrupted import. Importantly ASO, KPT-276, or TMPyP4 treatments all significantly suppress G4C2-mediated neurodegeneration in the eye (Fig. 5f). Hence, our data suggest that modulation of nucleocytoplasmic transport presents a potential therapeutic strategy for neurodegenerative diseases characterized by the C9ORF72 HRE.
Discussion
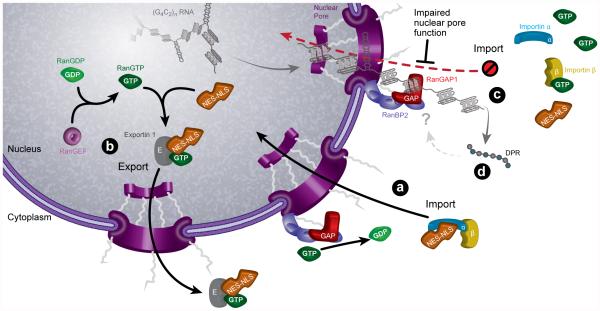
Our data demonstrate that the G4C2 repeat expansion disrupts nucleocytoplasmic transport in a fly model and in human cells (Extended Data Fig. 10). While our data suggest that RanGAP is a key target of the G4C2 repeat expansion, other members of the NPC may also interact directly or indirectly with G4C2. Several human genetic studies have implicated nuclear transport deficits as the cause of a rare fetal motor neuron disease and infrequent cases of ALS, including studies on the role of the nucleoporin GLE1 implicated in mRNA export33, 34. In addition, irregularities of the nuclear membrane and distribution of nuclear pore proteins were recently noted in sporadic ALS tissue35. Our colleagues (Freibaum et al.; co-submitted manuscript) independently identified additional components of the NPC and nucleocytoplasmic trafficking pathways as dominant modifiers of G4C2 HRE toxicity in another C9-ALS fly model. Importantly, the observed NPC and nucleocytoplasmic trafficking defects in both iPSC-derived neurons and motor neurons in our study are relevant to both ALS and FTD. Taken together, these studies suggest that products of the C9ORF72 HRE disrupt nucleocytoplasmic transport at the NPC and are a fundamental mechanism for inducing cellular injury in ALS/FTD. These defects may account for the nuclear depletion and cytoplasmic accumulation of TDP-43 widely seen in C9-ALS and FTD.
Although our data only demonstrate a role for disruption of nuclear import in C9-ALS pathogenesis, the robust nuclear pore pathology that we detect suggests that both nuclear import and export may be affected. It is enticing to speculate that NPC dysfunction leads to age-related neurodegeneration since many of the NPC components, including Nup205, are extremely long-lived20, and NPC integrity is lost during normal aging36.
The sense strand appears to be the cause of the described nucleocytoplasmic trafficking deficits in our human and fly model systems as small molecules targeting the sense RNA suppress the nuclear import phenotypes, and neurodegeneration is caused by expression of G4C2 repeat RNA in C9ORF72 iPS neurons or Drosophila. While we cannot exclude DPRs as a contributor to nucleocytoplasmic trafficking defects, our data in multiple model systems are most consistent with an RNA-mediated mechanism. Future studies will be required to determine the contribution of RanGAP disruption in C9-ALS pathogenesis compared with other pathomechanisms implicated in C9-ALS such as nucleolar stress, which could act independently, or in conjunction with nucleocytoplasmic disruption9.
Methods
Drosophila Genetics
To identify genetic modifiers of G4C2 HRE, the candidate-based screen is performed as follows: if a candidate RBP8 is conserved between human and Drosophila, we obtained the RNAi lines against the Drosophila homolog(s) from the TRiP collection (Supplemental Table 1)37. In addition, if the RBP consistently exhibited high affinity to G4C2 RNA, we also obtained published mutant alleles of their homologs. RanGAPSD(GOF) referes to the RanGAPSD “segregation distortion” gain-of-function allele11-13. We recombined GMR-GAL4 and UAS-(G4C2)3010 and crossed the balanced line, GMR-GAL4, UAS-(G4C2)30/CyO, twiGFP, to RNAi or mutant lines. We selected progeny that either co-express both the repeats and the RNAi (GMR-GAL4, UAS-(G4C2)30/+; UAS-RNAi/+, where the UAS-RNAi can be on any chromosome, or express the repeats in a heterozygous mutant background (GMR-GAL4, UAS-(G4C2)30/+; mut/+, where mut can be on any chromosome. We aged flies for 15 days and compared the morphology of their eyes with 15-day-old control flies expressing only the repeats. We use a “modification index” ranging from −4 to 4 to describe the relative severity of the morphological defects (Supplemental Table 1), where 0 is the repeat-expressing control. A positive number indicates enhancement of the phenotype, whereas a negative number indicates rescue. A number of “4” was given if the flies have no eyes, whereas a number of “−4” was given if eyes appear indistinguishable from that of the wild type control. If the flies fail to eclose, we indicate the phenotype as “Lethal”.
In our genetic interaction analyses, we used a previously described method38 to quantify disruption in the external morphology of the eye, i.e. “Degeneration Score”. Briefly, points were added if there was complete loss of interommatidial bristles, necrotic patches, retinal collapse, loss of ommatidial structure, and/or depigmentation of the eye.
For the subcellular localization of GFP, OK371-GAL4; UAS-(G4C2)30/TM6b, Tb, tub::GAL80 was crossed to UAS-NLS-NES(P12)/TM6b, Tb (III) and non-Tb offspring were selected for analysis. OK371-GAL4/UAS-NLS-NES-GFP flies were used as a negative control. We did not observe any GFP signals in the third instar salivary glands of OK371-GAL4; UAS-(G4C2)30/+ animals. All other fly stocks are from Bloomington Drosophila Stock Center, except for the UAS-RanGAP lines generated in this study.
To induce G4C2 RNA expression using elavGS39, flies were raised at 29ºC on regular food supplemented with 300 μM RU486. Flies were transferred to freshly-made food every 2-3 days.
Quantitative RT-PCR
For each genotype, mRNA was collected from 30 fly heads using the TRIzol reagent (Life Technologies) following the manufacturer’s protocol. Reverse transcription was performed using SuperScript III First-Strand synthesis Kit (Life Technologies) following the manufacturer’s protocol. Quantitative PCR was performed using SYBR Green PCR system (Applied Biosystem) on a 7900 HT fast Real-Time PCR system (Applied Biosystem). The following primers were used:
For actin:
forward: 5’-GCGCGGTTACTCTTTCACCA-3’
reverse: 5’-ATGTCACGGACGATTTCACG-3’
For G4C2 repeats:
forward: 5’-GGGATCTAGCCACCATGGAG-3’
reverse: 5’- TACCGTCGACTGCAGAGATTC-3’
The primers for G4C2 repeats were designed to amplify a 3’ region immediately following the repeats in the UAS construct.
Flight Assay
The flight assay was performed as described40. Briefly, individual 15-day-old female flies were dropped into a graduated cylinder through a hole in its lid. The cylinder was graduated into 12 zones of 25 mm each (top: 0, bottom: 12). The landing height was noted as the zone number in which the fly landed.
Electrophysiological Recording
For fly third instar larvae, neuromuscular (NMJ) recordings were performed from muscle 6 in segments A3 and A4 at room temperature in 1.5 mM Ca2+ containing HL3 as described41.
For iPS cells, whole-cell patch-clamp recordings were performed to assess the functionality of iPSC-derived neurons. Neurons were perfused in HEPES-buffered extracellular solution (143mM NaCl, 5mM KCl, 2mM CaCl2, 1mM MgCl2, 10mM HEPES, 10mM glucose, pH 7.2, 300-310 mOsm) in the presence of 1μM TTX and 20μM Bicuculline. Whole cell recording pipettes (4-8 MOhm) were filled with a Cs-based internal solution (115mM Cs-MeSO4, 0.4mM EGTA, 5mM TEA-Cl, 2.8mM NaCl, 20mM HEPES, 3mM MgATP, 0.5mM Na2GTP, pH 7.2, 290-300 mOsm) for voltage-clamp mEPSC recordings or with a K+-based internal solution (2.7mM KCl, 120mM KMeSO4, 9mM HEPES, 0.18mM EGTA, 4mM MgATP, 0.3mM Na2GTP, 20mM phosphocreatine(Na), pH 7.3, 295 mOsm) for current-clamp experiments. Cells were held at −70mV holding potential and recording was performed at room temperature. Signals were measured with MultiClamp 700B amplifier and digitized using a Digidata 1440A analog-to-digital board (Molecular Devices). Data acquisition was performed with pClamp 10.3 software and digitized at 5 or 20kHz.
iPS Generation and Differentiation to Neurons
Patient fibroblasts were collected at Johns Hopkins Hospital with patient’s consent (IRB protocol: NA_00021979) as described previously8. iPS lines were created and initially characterized with an NIH-sponsored commercial agreement with iPierian (USA) using the 4 vector method. Sox2, Oct4, Klf4 and c-Myc encoding vectors were transduced into human fibroblasts using retrovirus delivery. Selected colonies were evaluated for expression of multiple pluripotent markers by quantitative PCR (qPCR) and/or immunocytochemistry. In vitro pluripotency was further determined by three germ layer differentiation via embryoid body formation. iPSCs were maintained in mTeSR1 (StemCell Technology) and passed once a week using dispase (StemCell Technology) following the manufacturer’s instructions. Partially differentiated colonies were removed manually before differentiation analyses. The iPSCs were differentiated to neuroprogenitor cells (NPCs), neurons and motor neurons via embryoid body (EB) formation by following the methods described previously (Supplemental Table 3)42. At day 32 of differentiation, iPS neurons were treated with 20 μM Ara-C (Sigma) for 48 hr to remove iPS glial progenitors cells and enrich for iPS neurons. iPS neuronal differentiation was confirmed by class-III Tubulin (Tuj1) immunostaining (Chemicon AB9354, 1:1000), and cultures used for subsequent experiments were plated onto a confluent layer of mouse astrocytes, and analyses were performed at 55 - 69 DIV. Differentiation was assessed by immunofluorescence for the presence of MAP2-positive cells (SySy 188 004; 1:1000) and neuronal morphology. Approximately 85 - 90% of cells were VGlut 1+ (SySy 135 303; 1:500), ~10% were VGat+ (SySy 131 002; 1:500) , ~40% of neuronal cultures were Islet-1+ (DSHB, 40.3A4; 1:50), ~90% were ChAT+ (Millipore, AB144P, 1:300). All lines were analyzed at 50 - 70 DIV.
Molecular Cloning
RanGAP full-length and/or truncated cDNAs were retrieved from cDNA clone LD1635643 and subcloned into pUASt-attB vector44 using Bgl II and Not I sites. An HA tag was added at the C terminus. The NLS-tdTomato-NES construct was generously provided by the Hetzer lab (Salk Institute) and was subcloned into PrecisionShuttle Lenti vector with C-terminal Myc-DDk tag (OriGen, cat # PS100064) using Mlu I and Xho I cloning sites.
Transgenic Flies
Transgenic flies containing RanGAP cDNA constructs were generated by injecting the plasmid into y w;; PBac{yellow[+]-attP-3B}VK00033 (chromosome III) embryos (BestGene, Inc)45.
Collection of Human Autopsied Tissue
Human autopsied tissue used for these data are described in detail in Supplemental Table 2. The use of human tissue and associated decedents’ demographic information was approved by the Johns Hopkins University Institutional Review Board and ethics committee (HIPAA Form 5 exemption, Application #11-02-10-01RD) and from the Ravitz Lab (UCSD) through the Target ALS Consortium.
Antisense Oligonucleotide Treatment for iPS neuronal cultures
Modified 2’-methoxyethyl (MOE)/DNA ASOs were generated by Isis Pharmaceuticals. For ASO treatment, ASOs were incubated in neural differentiation media (NDM) at 3 μM then added to the iPS neuronal cultures and replenished every 3 days for a total of 10 DIV with ASOs. Sequence for the ASO-577061 targeted upstream of the G4C2 repeat is ‘TACAGGCTGCGGTTGTTTCC’ and the scrambled non-targeting control ASO-141923 sequence is ‘CCTTCCCTGAAGGTTCCTCC’.
RNA Fluorescent in situ Hybridization (FISH) and Immunofluorescence
RNA FISH of iPSNs was performed as previously described8. Briefly, 5’ digoxigenin (DIG) labeled locked nucleic acid FISH probes used were generated by Exiqon and targeted the GGGGCC repeat (CCCCGG2.5) (Batch # 611635) or a non-targeting scrambled probe (300514-04) as a control. Cell cultures were fixed in buffered 4% PFA, equilibrated in 1× SSC with 40% formamide, incubated at 37 °C for 10 min, then incubated with preheated probes (90 – 95 °C) at 75 °C for 35 min in 50% formamide and hybridization buffer containing 20 nM of probe. Following hybridization, cells were washed with 2× with 50% formamide at 55 °C for 15 min each and then washed with 2× SSC 5 times for 5 min each.
Cells processed for RNA-FISH and protein immunofluorescence for RanGAP1 were treated once with Tris-Glycine, and processed for standard protein immunofluorescence. Blocking buffer and IF buffer consisted of 10% and 5% protease and heat shocked BSA fraction V (Roche) in RNase free 1× Tris buffered Saline, respectively. To detect the DIG-labeled probe, an unconjugated mouse anti-DIG antibody (Jackson Immunoresearch 200-002-156; 1:400) and RanGAP1 antibody (Santa Cruz sc-25630; 1:500) was used followed by the appropriate secondary antibody (Jackson). Cells then underwent a series of 5 min washes with IF buffer, Tris buffered saline, Tris-glycine, PBS with MgCl2, and PBS, respectively. Cells were mounted onto slides with ProLong Antifade Gold mounting media with DAPI (Invitrogen).
Drosophila Cell Culture
S2 cells were cultured in Schneider’s media supplemented with fetal bovine serum and antibiotics at 25ºC. The transfections were performed using Lipofectamine LTX (Life Technologies) following the manufacturer’s instructions. G4C2 repeats mRNA was transcribed using the UAS/GAL4 system46, driven by Act-GAL4. For immunofluorescent staining, cells were fixed 48 h after transfection. For actinomycin treatment to induce apoptosis, cells were treated with 0.7 μM actinomycin D for 20 h.
Immunofluorescence, Phalloidin Staining and Immunohistochemistry
For immunofluorescence staining in Drosophila, tissues or S2 cells were fixed in 3.7% formaldehyde for 30 min, followed by incubation in PBX solution (PBS with 0.4% Triton X-100) for 1 h. The tissues or cells were then incubated with primary antibodies and 10% normal goat serum (NGS) in PBX for 16 h at 4ºC. Primary antibodies were used at the following concentrations: mouse anti-Brp (DSHB), 1:100; mouse anti-GFP (Life technologies), 1:200; rat anti-HA (Roche), 1:200; rabbit anti-RanGAP (a gift from Cindi Staber, Stowers Institute), 1:500; mouse anti-Ran (BD Biosciences), 1:200; rabbit anti-TBPH (a gift from Frank Hirth, King’s College) 47, 1:200; and rabbit anti-ASO (provided by F. Rigo, Isis Pharmaceuticals), 1:1000. Next, samples were washed in PBX for 8 h at room temperature (RT) and then incubated with secondary antibodies conjugated to Alexa Fluor 546 or 488 (Life Technologies) in PBX+10% NGS at 4ºC for 16 h. The secondary antibodies were used at a dilution of 1:200. After that, samples are washed in PBX for 6 h and then stained with 1μM TO-PRO3 (Life Technologies) for 10 min at RT.
For phalloidin staining, fixed eyes were incubated in PBX with Alexa Fluor® 488 Phalloidin (Life Technologies) at 1:20 for 16 h at 4 °C. The eyes were then washed in PBX for 1 h at RT before mounting.
For immunostaining of iPSNs, cells were grown on 12 mm coverglass on top of a confluent monolayer of mouse astrocytes fixed in 4% PFA, permeabilized in 0.3% triton x-100/1× PBS and blocked in 10% normal donkey serum prior to incubation with primary antibody. For human autopsied tissue, paraffin motor cortex tissue (see Supplemental Table 2) was washed in xylene (3× 5 min), then a series of 100% ethanol (2× 5 min), 90% ethanol (1× 5 min), 70% ethanol (1× 5 min) and washed with water (2× 5 min). Antigen retrieval was performed using a steamer for 1 hour in epitope retrieval solution (IHC world) then washed with water (3× 5 min). Slides were treated with 50:50 methanol:acetone solution for 10 min and then washed with 1× PBS (2× 5 min). Permeabilization was performed with 0.4% triton x-100/1× PBS (8 min) and were then washed (1× PBS) and blocked overnight in 10% normal goat serum/1× PBS. Primary antibodies were added and incubated for 24 hours at 4 °C (RanGAP1 Santa Cruz, sc-25630, 1:50; Nup205 Novus NBP1-91247, 1:50). For DAB staining, tissues were incubated with biotinylated goat-anti-rabbit secondary antibody (Jackson Immunoresearch) at 1:200 for 1 hour at room temperature and then processed using the Vectastain Kit (Vector Labs) following the manufacturer’s instruction. Cells and tissue were then washed 5 times for 5 min with 1× PBS and then 1 time with water and mounted using ProLong Antifade Gold with DAPI.
Microscopy and Image Analysis
For fly experiments, samples were mounted in Vectashield (Vector Laboratories) and analyzed under a confocal microscope (model LSM510; Carl Zeiss) with its accompanying software using Plan Apochromat 63×, NA 1.4 objectives (Carl Zeiss) at RT. Images were captured by AxioCam HRc camera (Carl Zeiss) or Hamamatsu Flash 4.0 (Hamamatsu). Images are processed using ImageJ (National Institutes of Health). Deconvolution was performed using the Tikhonov–Miller method.
For iPSN experiments, Z-stack images taken on a Zeiss Axioimager with the Apotome tool or a Zeiss LSM700 (NIH Grant S10 OD016374) laser scanning confocal microscope, all images were taken at matched exposure times or laser settings and normalized within their respective experiment. All comparative images were processed using identical settings.
Nuclear/cytoplasmic ratios were quantified using Z-stacks of iPS neuronal cultures on the Zeiss Axioimager with the Apotome tool. Full Z-stacks were taken at 0.5 μm intervals and the individual planes were then projected into maximum intensity images removing any lower layers that contain the astrocyte monolayer. The nuclear region was determined using either DAPI or Lamin-B (Santa cruz sc-6217; 1:300) and the cytoplasmic fraction was determined using MAP2 (SySy 188 004; 1:1000). Ran was visualized using a Ran antibody (BD Biosciences 610341; 1:100) or Ran-GFP (OriGene, RC204223L2). Images were quantified using ImageJ (NIH) and the mean pixel intensity/μm2 was determined to generate the nuclear/cytoplasmic ratios. All iPS lines were imaged at 50 - 70 DIV.
FRAP Analysis
FRAP analysis was performed as previously described27 with modifications. Ctrl or C9-ALS iPS neurons were transduced with a lenti-CMV-NLS-tdTomato-NES construct generously provided by the Hetzer Lab (Salk Institute) at 51 DIV. Cells expressing the tdTomato reporter were then imaged on an LSM700 and processed with Zen software (Carl Zeiss). Three images were taken of the tdTomato-expressing iPS neurons at which point the nucleus was bleached for 30 iterations of 40-60% laser power and recovery was monitored every 3 seconds for 150 intervals. Recovery was normalized to the average of the pre-bleached signals. To account for global bleaching, all post-bleach signals were also normalized by a “bleach factor” at each time point, which was determined by the percent of signal lost post-bleach in an unbleached area.
Purification of Recombinant RanGAP1 and Ran from E. Coli
RanGAP1 cDNA was generously provided by Seth Blackshaw, and Ran cDNA was purchased from OriGene. The cDNA was cloned into a SspI digested linear pET28a vector in frame with a 6×His-EGFP n-terminal fusion using Gibson assembly cloning strategies (NEB). A 50 mL LB starter culture of RanGAP1 or Ran with Amp/Champ was grown overnight at 37°C. Then 25 mL of the overnight starter culture was added to 1 L of pre-warmed LB with Amp/Champ and incubated at 37°C until OD600 = 0.7-1 abs. The temperature was then dropped down to 16°C and protein expression was induced with 1mM IPTG and induced overnight at 16°C. The cell culture was then centrifuged at 4000×g for 20 minutes. The cell pellet was resuspended in 50 mL of resuspension buffer (20mM HEPES, 200mM NaCl, 10mM imidazole, 1mM TCEP, pH 7.4) containing EDTA-free protease inhibitor (Roche). Cells were lysed via French press while on ice, and were then centrifuged at 30,000×g for 30 minutes. The lysed cell supernatant was collected and filtered through a 0.45μm membrane (Millex®-HV Filter Unit) and then loaded onto an ÄKTApurifier™ 10 superloop at 4°C. A 5ml HisTrap™ HP Ni Sepharose™ (GE) column was pre-equilibrated with resuspension buffer before the supernatant was passed through. The protein was eluted off the column in elution buffer (20mM HEPES, 200mM NaCl, 500mM Imidazole, 1mM TCEP, pH 7.4). Imidazole was removed by passing the protein solution through a HiTrap™ Desalting column (Sephadex™ G-25 Superfine, GE) pre-equilibrated in Desalting buffer (20mM HEPES, 200mM NaCl, 1mM TCEP, pH 7.4). Removal of the His-GFP-TEV tag was facilitated by incubating the protein solution with 75 units of ProTEV Plus (5u/μl, Promega) per 2ml of protein solution overnight while gently rocking at 4°C. ProTEV Plus and the cleaved His-GFP-TEV tag were removed by reverse-Ni IMAC chromatography. The column flow through was collected and flash frozen in liquid nitrogen before storage at −80°C. The flow through was then checked via SDS-page gel and Coomassie stain to determine the purity of RanGAP1.
Electrophoretic Mobility Shift Assays
A 24mer, 39mer or 60mer RNA (4 μM) containing the sequences (G4C2), (C4G2), or (CUG) with a 5' Cy5 label (IDT) was denatured at 95°C for 5 m and then annealed in the presence or absence of 100 mM KCl in 10 mM Tris-HCl ph 7.4 to induce the respective formation of RNA G-quadruplexes or haripins. The RNA was diluted to 2 nM in binding buffer (HEPES pH 7.5 with 100 mM KCl, 5 mM MgCl2, 50 μM ZnCl2, 1 mM TCEP, and 0.01 % IGEPAL) and then incubated for 30 m at room temperature with varying concentrations of recombinant RanGAP1 (0, 1, 2, 10, 20, 50, 100, and 200 nM) in binding buffer. Samples were then loaded onto a 0.8% agarose gel in 1XTAE (pH 8.0) and electrophoresed for 45 m at 60 V. Bands were visualized using a Typhoon Image for Cy5 excitation and emissions. The image was analyzed and quantified in ImageJ and then plotted in Graphpad prism. RanGAP1 binding was fit to a hyperbolic and linear regression, and based on the fit of the curve the k1/2 calculated with Bmax set to 1 for nonlinear regression.
Competition experiments were performed by incubating a final concentration of 2 nM of RNA with 100 nM of RanGAP1 for 30 m at room temperature as above. Then unlabeled competitor, ASO control, ASO, RNaseH-depednent ASO, or yeast tRNA was added to the sample at increasing concentrations, and allowed to incubate at room temperature for an additional 30 m. Samples were then analyzed as above.
The effects of the porphyrin, TMPyP4, on RanGAP1 binding to the RNA was performed essentially as above. RNA (2 nM) was incubated with varying concentrations of TMPyP4 that was serially diluted 10-fold starting from a 1 μM final concentration in binding buffer. After 30 m incubation 10 nM RanGAP1 was added and allowed to incubate an additional 30 m binding was analyzed as described above.
Protein extraction, Protein/RNA Pull-down, and Immunoblot
Tissues or cells were homogenized and/or lysed in RIPA buffer (50mM Tris-HCl pH 7.4, 150mM NaCl, 0.1% SDS, 0.5% sodium deoxycholate, and 1% Triton X-100) supplemented with protease inhibitor cocktail (cOmplete, Roche). For pull-down, cells are lysed in lysis buffer (50mM Tris pH7.4, 150mM NaCl, 1% NP-40, and 5mM MgCl2) for 30 min on ice. The lysate was then pre-cleared using avidin-agarose beads (Life Technologies) for 30 min before incubated with biotinylated G4C2-repeat RNA with 10mM TCEP and RNase inhibitor RNaseOUT (Life Technologies)9. Protein/RNA mixture was then incubated with avidin-agarose beads overnight at 4ºC. The beads were subsequently precipitated by centrifuge at 1,500_g_ for 3 min and washed three times in lysis buffer at 4ºC for a total time of 1 h. The beads were then resuspended in 50μL lysis buffer and subjected to immunoblot analysis.
For immunoblot, the sample was mixed with Laemmli buffer and heated at 98ºC for 10 min. The protein samples were run on 4-15% SDS Mini-PROTEAN® TGX Precast Gels (Bio-Rad) and transferred to nitrocellulose membrane. For dot blot, 2 μL of sample was blotted on nitrocellulose membrane and air-dried for 15 min. TBST with 5% milk was used for blocking. Primary antibodies were used as below: rat anti-HA (Roche), 1:1,000; chicken anti-GFP (abcam), 1:1,000; mouse anti-Actin (Millipore), 1:5,000; rabbit anti-GP (a gift from Leonard Petrucelli, Mayo Clinic), 1:1,000; and rabbit anti-GR (Proteintech), 1:1,000. The HRP-conjugated secondary antibody (Jackson ImmunoResearch) was used at 1:5,000 dilution.
Drug Feeding Assay
Melt cornmeal-molasses-yeast fly food was mixed with certain concentrations of ASO573674 ‘CCGGCCCCGGCCCCGGCCCC’ (Isis Pharmaceuticals), TMPyP4 (a porphyrin derivative) (Sigma), or KPT-276 (Selleckchem) at high temperature and cooled to RT. PBS was used as the vehicle control for ASO and DMSO was used as the vehicle control for TMPyP4 and KPT-276. Parent flies were crossed on food supplemented with drugs and the offspring were raised on the same food. Wandering third instars of the offspring were selected and subjected to GFP staining. ASOs were detected using the anti-ASO (13545) antibody (Isis Pharmaceuticals), which detects the MOE modification. Adult flies were aged on the drug-containing food for 15 days before analyzing their eye morphology.
Statistics
For quantification of outer eye morphological defects, ten flies were quantified. For quantifications of rhabdomeres defects, 20 ommatidia from three or four flies were quantified for each genotype except RanGAP overexpression. For RanGAP overexpression, 24 ommatidia from four flies were quantified. For active zone quantifications, eight NMJs from four animals are quantified. For NMJ recording, the following numbers of animals are used for quantification: 18 for control, 10 for G4C2-expressing, 6 for RanGAP overexpression. For S2 cell quantifications, ten cells were quantified for each genotype. For image quantification of iPS neurons, 50 neurons were quantified for all analyses and each cell line was differentiated and analyzed at least two times at 55 or 69 DIV (as indicated)(see Supplemental Data Table 4). For qRT-PCR, six biological repeats, each containing three technical replicates in parallel, were used for quantification. For salivary gland quantifications, eight or nine salivary gland cells from three or four flies were quantified for each genotype. The numbers of flies used in the flight assay were labeled individually on the bar graph in ED Fig. 1. Error bars are presented as s.e.m. For analyses of datasets with 2 variables, we employed a two-tailed Student’s _t_-test. For analyses of datasets with 3 or more variables, we employed a one-way ANOVA assuming Gaussian distribution with a Tukey’s post hoc test for multiple comparisons. To assess correlation between N/C ratios, a correlation analysis with Pearson’s coefficient was applied. To obtain r2 values, a non-linear regression curve fit assuming one-phase association was performed. A _p_-value of <0.05 was considered statistically significant for all tests (GraphPad Prism, Ver. 6.0b).
Extended Data
Extended Data Fig. 1. Genetic interaction between G4C2 repeats and components of the nucleocytoplasmic transport machinery.
External eye morphology of 1-day-old (a, left column) and 15-day-old (b, left column) flies. Phalloidin staining of the retina of newly eclosed (a, mid column, magnified in right column) and 15-day-old (b, mid column, magnified in right column) flies. Flies expressing 30 G4C2 repeats together with (from top row) RanGAP(GOF), RanGAP RNAi, RanGEF overexpression, RanGEF RNAi, importin α overexpression, or Exportin RNAi. Genotypes (from top row): 1) GMR-GAL4, UAS-(G4C2)30/RanGAPSD; 2) GMR-GAL4, UAS-(G4C2)30/+; UAS-RanGAP RNAi/+; 3) GMR-GAL4, UAS-(G4C2)30/+; UAS-RanGEF/+; 4) GMR-GAL4, UAS-(G4C2)30/UAS-RanGEF RNAi; 5) GMR-GAL4, UAS-(G4C2)30/UAS-imp-α2; 6) GMR-GAL4, UAS-(G4C2)30/+; UAS-Exportin RNAi/+ (BL31353). (c) Quantification of G4C2 mRNA levels by qRT-PCR. (d) Flight assay. The top of the graduated cylinder is “0”, and thus decreased landing height represents better flight ability. Genotypes (from left lane): 1 and 2) UAS-(G4C2)30/+; elavGS-GAL4/+; 3) UAS-(G4C2)30/+; elavGS-GAL4/UAS-RanGAP. (*p<0.05, **p<0.01)
Extended Data Fig. 2. RanGAP does not rescue developmental defects caused by G4C2 repeats.
(a) Staining of the active zone component Bruchpilot (Brp) was used to identify active zones in the Type Ib NMJ of muscle 4 in abdominal segments 3 and 4. (b) Quantification of active zone number. (c) Electrophysiology recording of NMJ in muscle 6/7 of abdominal segments 3 and 4. Evoked junctional potential (EJP) (d), miniature EJP (mEJP) amplitude (e), quantal content (f), and mEJP frequencies (g) are shown. Genotypes: 1) Ctrl: OK371-GAL4/+; 2) (G4C2)30: OK371-GAL4/+; UAS-(G4C2)30/+; 3) (G4C2)30 RanGAP OE: OK371-GAL4/+; UAS-(G4C2)30/UAS-RanGAP. (*p<0.05, **p<0.01, ****p<0.0001)
Extended Data Fig. 3. Dot blot of GR and GP dipeptide proteins.
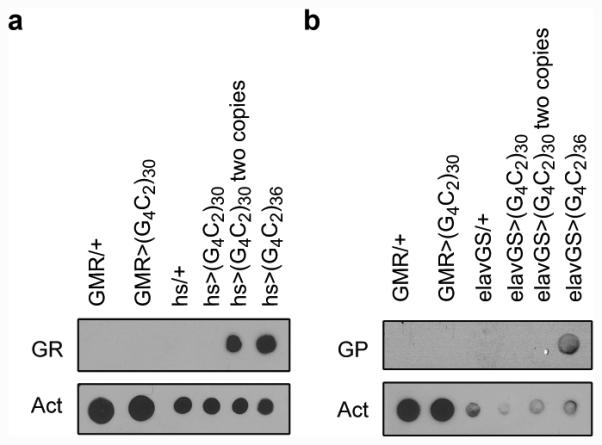
Dot blot of GR (a) and GP (b) compared with Actin control. “hs” indicates heat-shock GAL4, and a heat-shock was required to induce detectable polyGR as described7. A transgenic line UAS-(G4C2)36 previously shown to generate polyGR and polyGP DPRs under certain conditions was used as a positive control7.
Extended Data Fig. 4. RanGAP/RanGAP1 binds to G4C2 repeats.
(a) SDS PAGE showing purified human RanGAP1. (b) EMSA for RanGAP1 with (CUG)20, (C4G2)10, or (G4C2)10 RNA hairpins. (c) EMSA for RanGAP1 with increasing length of repeats that were annealed in the presence of K+ to promote RNA G-quadruplex formation. (d) Plot of the fraction bound from the EMSAs performed with RanGAP1 and RNA repeats shown in (b) and (c). Similar RNA nucleotide lengths but different binding preferences indicate RanGAP1 has a structure- and sequence-dependent RNA binding mode (top panel). All data was fit using a hyperbolic and linear regression, then the RanGAP1 binding model determine based on the r2 values for the best fit (_n_=2). The length-dependent binding of RanGAP1 fits best to a hyperbolic regression, which demonstrates specific binding to the (G4C2)n G-quadruplex conformation, and the fraction bound increases with increasing nucleotide length (bottom panel). The fraction bound for the RNA hairpins fit best to a linear regression, which indicates nonspecific or less specific binding to RanGAP1. The k1/2s for specific binding of RanGAP1 to the G-quadruplex RNA conformation are 162, 39, and 11 nM for (G4C2)4, (G4C2)6.5, and (G4C2)10, respectively. (e) The RanGAP1•(G4C2)10 RNA G-quadruplex complex is resistant to nonspecific RNA competitors and ASOs (_n_=1).
Extended Data Fig. 5. RanGAP/RanGAP1 is mislocalized in C9-ALS S2 and iPS cells.
(a) S2 cells transfected with RanGAP-HA (first column) or RanGAP-HA and (G4C2)30 (second column) are co-stained with HA (red), cleaved Dcp-1 (green), TO-PRO3 (blue). As a control, S2 cells treated with DMSO (third column) or actinomycin (right column) are co-stained with cleaved Dcp-1 (green) and TO-PRO3 (blue). (b) S2 cells transfected with G4C2 were co-stained with a Ran antibody (red) and TO-PRO3 (blue). (c) Abnormal aggregated RanGAP1varibaly observed in C9-ALS iPS neurons that is largely absent from control iPS neurons. Arrows, abnormal RanGAP1 staining. (d) Single microscopic plane of aggregated RanGAP1 colocalized with Nup205 at the nuclear membrane (Lamin B) in C9-ALS iPS neurons. Single immuno-label view in right panels for nup205, RanGap1 and Lamin B, with x-y and x-z projections. (e) Cytoplasmic RanGAP1 aggregates can colocalize with ubiquitin in C9-ALS iPS neurons.
Extended Data Fig. 6. Electrophysiological and immunocytochemical characterization of iPS neurons and astroglia.
(a) (a’), IR-DIC images of iPSC neurons from control (left panel) and C9ORF72 (right panel) patient cells. b’-d’, Representative action potentials in response to somatic current injections (70pA) in iPSC neurons. The majority of cells from both groups displayed either single, adaptive or repetitive responses as demonstrated previously48. These action potentials were blocked by TTX treatment. (b) Quantification of iPSNs markers showing glutamatergic and islet1+ iPS neurons. (c) iPS cells differentiated into neurons include phenotypic markers such as islet-1, HB9, ChAT (choline acetyl transferase, motor neuron); Tuj1, MAP2, SMI32 (cytoskeletal), VGLUT1 (vesicular glutamate transporter 1), NMDAR1 (NMDA receptor), SYT1, SYP (synaptophysin, synaptotagmin, synaptic markers). (d) Astroglia markers include ALDH1 (universal astroglial marker) and GFAP (reactive astroglia). (e,f) Normal (e’) and C9ORF72 (f’) patient cells displayed mEPSCs that were sensitive to NBQX treatment, suggesting functional synaptic input. (g’-i’), Resting membrane potential, membrane capacitance, and membrane resistance were comparable in both groups.
Extended Data Fig. 7. Additional human RanGAP1 and nup 107 pathology in C9-ALS brain.
(a) High power images of motor cortex reveals aberrant nuclear localization of RanGAP1 ,compared to non C9 control tissue, including various nuclear aggregate pathologies (right panels) (b) Aberrant RanGAP1 nuclear aggregates were not readily observed in C9-ALS cerebellar cortex molecular layer (ML), Purkinje cells (PK) or granule cell (GL) layer when compared to non C9-ALS control cerebellum. Number in upper right of each panel identifies autopsy specimen (Supplemental Table 2). (c) Nup107 was also aggregated at the nuclear membrane in C9-ALS motor cortex cells when compared to non C9-control tissues.
Extended Data Fig. 8. C9ORF72 HRE disrupts the cytoplasmic/nuclear Ran gradient.
(a) Representative images of disrupted N/C Ran gradient in C9-ALS ChAT+ iPS neurons. (b-c) Representative images and quantification of control (top row) or C9-ALS iPS neurons (bottom row) expressing Ran-GFP that are co-stained with Ran and MAP2. Both Ran antibody and Ran-GFP indicate a reduced N/C Ran ratio. (d) Overexpression of RanGAP1-GFP rescues the N/C Ran ratio in C9-ALS iPS neurons. (e) Control iPS neurons treated with Tunicamycin show enhanced level of activated Caspase 3 in the soma but no change in N/C Ran localization compared to controls with vehicle treatment. (f) RanGAP1 is not aggregated in Ctrl and C9-ALS iPS astroglia. (g) Representative image of N/C Ran in C9-ALS astrocytes when identified using the pan astroglial ALDH1 marker. (h) N/C Ran is not altered in C9-ALS astroglia when comparing astrocytes of a similar size. (i) Mean intensity fluorescence (MIF) of nuclear Ran does not differ in ctrl or C9-ALS astroglia. (j) Representative image of C9-ALS iPS neuron with G4C2 RNA foci in approximately 40% of MAP2+ neurons at 50 - 70 DIV. Number of C9-ALS iPS neurons with RNA foci is reduced with C9ORF72 RNA targeting ASOs compared to scrambled/non-targeting ASOs to <10% of iPS neurons. (k) ASOs that reduce G4C2 RNA foci also enhance N/C Ran and N/C TDP-43 ratios. (*, p<0.05; **, p<0.01; ****, p<0.0001).
Extended Data Fig. 9. C9orf72 HRE causes nucleocytoplasmic transport defects.
(a) Quantification of the nuclear GFP intensity in Fig. 4a. (b) Immunoblot of the GFP levels in Fig. 4a. (c) Quantification of the TBPH N/C ratio in Fig. 4a. (d) Wild type control and (G4C2)30 -expressing motor neurons expressing NLS-NES-GFP (left two columns) or NLS-ΔNES-GFP (right two columns) are co-stained with a GFP antibody (green) and TO-PRO3 (blue) (top row). The GFP signal is shown separately in the bottom row. Genotypes (from left): 1) OK371-GAL4/UAS-NLS-NES-GFP (II); 2) OK371-GAL4/UAS-NLS-NES-GFP; UAS-(G4C2)30/+; 3) OK371-GAL4/+; UAS-NLS-NES(P12)-GFP/+; 4) OK371-GAL4/+; UAS-NLS-NES(P12)-GFP/UAS-(G4C2)30. (e) The N/C TDP-43 ratio directly correlates with the N/C Ran GTPase ratio in both control and C9-ALS iPS neurons over two differentiations. N/C TDP-43 vs. N/C Ran - Ctrl #2: p<0.0001, r2= 0.58; C9-ALS #3 Dif #1: p<0.0001, r2=0.55; C9-ALS #3 Dif #2: p<0.0001, r2=0.69.
Extended Data Fig. 10. Model.
(a) In normal cases, RanGAP is tethered onto the NPC via RanBP2, where it activates Ran[GTP] hydrolysis to produce Ran[GDP]. Ran[GDP] dissociates from and activates Importin αβ complex to import NLS-NES containing protein cargos such as TDP-43. (b) In the nucleus, RanGEF converts Ran[GDP] to Ran[GTP] that is required for the dissociation of the NLS-Importin αβ complex and the export of NES protein cargos. (c) In C9-ALS, G4C2 HRE binds and sequesters RanGAP1, leading to an increase in cytoplasmic Ran[GTP]. High cytoplasmic Ran[GTP] prevents the formation of the NLS-Importin αβ complex thereby disrupting the N/C Ran gradient and impairing nuclear import of NLS-containing proteins. (d) Dipeptide repeat proteins translated from the G4C2 RNA can be toxic when expressed at high levels but it is unclear whether they contribute to nucleocytoplasmic trafficking deficits in the Drosophila since they are not detected at the time of degeneration. The C9ORF72 HRE sense strand appears to be contributing to nucleocytoplasmic trafficking deficits in human iPS neurons and fly model systems as small molecules and antisense oligonucleotides targeting the sense RNA substantially suppress the nuclear import phenotypes and neurodegeneration as a result of the G4C2 repeat RNA expression. Overall, the data are most consistent with an RNA-mediated mechanism with evidence that includes: 1) RanGAP1 was identified as one of 19 sequence-specific interactors of G4C2 RNA; 2) RanGAP1 is a strong genetic modifier of G4C2 RNA-mediated degeneration in Drosophila under conditions in which polyGR and polyGP are not detected; 3) RanGAP1 directly and potently interacts with HRE RNA and 4) G4C2 RNA foci can colocalize with RanGAP1.
Supplementary Material
SMT1
SMT2
SMT3
SMT4
Acknowledgements
We thank Susan Michaelis (JHU) for helpful discussions; Katelyn Russell (JHU), Matthew Elrick (JHU) and John Ravits (UCSD) for human tissue and/or human histological studies. We also thank the Hetzer Lab (Salk Institute) for the CMV-NLS-tdTomato-NES construct; Barry Ganetzky (UW-M) and Cindi Staber (Stowers) for the Drosophila RanGAP antibody; Peng Jin (Emory) for the UAS-(G4C2)30 fly stock; C. Svendsen (Cedars Sinai) for some control iPS cell lines; Leonard Petrucelli (Mayo Clinic) for the GP antibody; Frank Hirth (King’s College, UK) for the TBPH antibody. We thank the TRiP at Harvard Medical School (NIH/NIGMS R01-GM084947) for providing transgenic RNAi fly stocks used in this study. Stocks obtained from the Bloomington Drosophila Stock Center (NIH P40OD018537) were used in this study. Support by grants from NIH (R01 NS085207 and NS091046 to JDR , RS, R01 NS082563 to TEL, R01 NS074324 and NS089616 to JW), Brain Science Institute, Robert Packard Center for ALS Research at Johns Hopkins, Muscular Dystrophy Association (JDR), Alzheimer’s Drug Discovery Foundation (JDR, RS), Judith and Jean Pape Adams Charitable Foundation (JW and RS), Alzheimer’s Disease Research Center-Johns Hopkins (RS), Maryland TEDCO (CJD and JW), Target ALS Springboard Fellowship (CJD), William and Ella Owens Foundation (RS), ALS Association (TEL, RS, and JDR). KZ is a Milton Safenowitz fellow in the ALS Association. ARH is a fellow on an NIH training grant (CA009110) and a recipient of an NIH K99 award (NS091486). JCG and SJM are recipients of a National Science Foundation Graduate Research Fellowship Award and JCG is a recipient of the Thomas Shortman Training Fund Graduate Scholarship.
Footnotes
Supplementary Information is linked to the online version of the paper at www.nature.com/nature.
Author contributions. KZ, CJD, RS, TEL, and JDR conceived the project. KZ, CJD, ARH, JW, RS, TEL, and JDR designed the experiments. KZ performed most studies related to Drosophila, with assistance from JBM, KMC, and SG. CJD performed studies employing iPS neuronal cultures and human tissue with help from SJM, LWO and JG. ARH performed the EMSA analysis. JBM performed the fly NMJ and ephys analyses; IH, SLC and RLH performed and/or interpreted the human iPS electrophysiological analyses. JCG, ELD, SV, MAT, PS provided technical support. ARH, KZ, and CJD developed the figures. KZ, CJD, ARH, MJM, JW, RS, TEL and JDR interpreted data and prepared the manuscript. KZ and CJD contributed equally to this work. TEL and JDR contributed equally to this work. All authors discussed the results and commented on the manuscript.
Author information. Reprints and permissions information is available at www.nature.com/reprints. The authors declare no relevant competing financial interests.
Reference List
- 1.Majounie E, et al. Frequency of the C9orf72 hexanucleotide repeat expansion in patients with amyotrophic lateral sclerosis and frontotemporal dementia: a cross-sectional study. Lancet Neurol. 2012;11:323–330. doi: 10.1016/S1474-4422(12)70043-1. [DOI] [PMC free article] [PubMed] [Google Scholar]
- 2.Dejesus-Hernandez M, et al. Expanded GGGGCC hexanucleotide repeat in noncoding region of C9ORF72 causes chromosome 9p-linked FTD and ALS. Neuron. 2011;72:245–256. doi: 10.1016/j.neuron.2011.09.011. [DOI] [PMC free article] [PubMed] [Google Scholar]
- 3.Renton AE, et al. A hexanucleotide repeat expansion in C9ORF72 is the cause of chromosome 9p21-linked ALS-FTD. Neuron. 2011;72:257–268. doi: 10.1016/j.neuron.2011.09.010. [DOI] [PMC free article] [PubMed] [Google Scholar]
- 4.Ash PE, et al. Unconventional translation of C9ORF72 GGGGCC expansion generates insoluble polypeptides specific to c9FTD/ALS. Neuron. 2013;77:639–646. doi: 10.1016/j.neuron.2013.02.004. [DOI] [PMC free article] [PubMed] [Google Scholar]
- 5.Mori K, et al. The C9orf72 GGGGCC repeat is translated into aggregating dipeptide-repeat proteins in FTLD/ALS. Science. 2013;339:1335–1338. doi: 10.1126/science.1232927. [DOI] [PubMed] [Google Scholar]
- 6.Kwon I, et al. Poly-dipeptides encoded by the C9orf72 repeats bind nucleoli, impede RNA biogenesis, and kill cells. Science. 2014;345:1139–1145. doi: 10.1126/science.1254917. [DOI] [PMC free article] [PubMed] [Google Scholar]
- 7.Mizielinska S, et al. C9orf72 repeat expansions cause neurodegeneration in Drosophila through arginine-rich proteins. Science. 2014;345:1192–1194. doi: 10.1126/science.1256800. [DOI] [PMC free article] [PubMed] [Google Scholar]
- 8.Donnelly CJ, et al. RNA toxicity from the ALS/FTD C9ORF72 expansion is mitigated by antisense intervention. Neuron. 2013;80:415–428. doi: 10.1016/j.neuron.2013.10.015. [DOI] [PMC free article] [PubMed] [Google Scholar]
- 9.Haeusler AR, et al. C9orf72 nucleotide repeat structures initiate molecular cascades of disease. Nature. 2014 doi: 10.1038/nature13124. [DOI] [PMC free article] [PubMed] [Google Scholar]
- 10.Xu Z, et al. Expanded GGGGCC repeat RNA associated with amyotrophic lateral sclerosis and frontotemporal dementia causes neurodegeneration. Proc. Natl. Acad. Sci. U. S. A. 2013;110:7778–7783. doi: 10.1073/pnas.1219643110. [DOI] [PMC free article] [PubMed] [Google Scholar]
- 11.Kusano A, Staber C, Ganetzky B. Segregation distortion induced by wild-type RanGAP in Drosophila. Proc. Natl. Acad. Sci. U. S. A. 2002;99:6866–6870. doi: 10.1073/pnas.102165099. [DOI] [PMC free article] [PubMed] [Google Scholar]
- 12.Kusano A, Staber C, Ganetzky B. Nuclear mislocalization of enzymatically active RanGAP causes segregation distortion in Drosophila. Dev. Cell. 2001;1:351–361. doi: 10.1016/s1534-5807(01)00042-9. [DOI] [PubMed] [Google Scholar]
- 13.Merrill C, Bayraktaroglu L, Kusano A, Ganetzky B. Truncated RanGAP encoded by the Segregation Distorter locus of Drosophila. Science. 1999;283:1742–1745. doi: 10.1126/science.283.5408.1742. [DOI] [PubMed] [Google Scholar]
- 14.Bischoff FR, Krebber H, Kempf T, Hermes I, Ponstingl H. Human RanGTPase-activating protein RanGAP1 is a homologue of yeast Rna1p involved in mRNA processing and transport. Proc. Natl. Acad. Sci. U. S. A. 1995;92:1749–1753. doi: 10.1073/pnas.92.5.1749. [DOI] [PMC free article] [PubMed] [Google Scholar]
- 15.Bischoff FR, Klebe C, Kretschmer J, Wittinghofer A, Ponstingl H. RanGAP1 induces GTPase activity of nuclear Ras-related Ran. Proc. Natl. Acad. Sci. U. S. A. 1994;91:2587–2591. doi: 10.1073/pnas.91.7.2587. [DOI] [PMC free article] [PubMed] [Google Scholar]
- 16.Steggerda SM, Paschal BM. Regulation of nuclear import and export by the GTPase Ran. Int. Rev. Cytol. 2002;217:41–91. doi: 10.1016/s0074-7696(02)17012-4. [DOI] [PubMed] [Google Scholar]
- 17.Mor A, White MA, Fontoura BM. Nuclear Trafficking in Health and Disease. Curr. Opin. Cell Biol. 2014;28C:28–35. doi: 10.1016/j.ceb.2014.01.007. [DOI] [PMC free article] [PubMed] [Google Scholar]
- 18.Corbett AH, Krebber H. Hot trends erupting in the nuclear transport field. Workshop on mechanisms of nuclear transport. EMBO Rep. 2004;5:453–458. doi: 10.1038/sj.embor.7400155. [DOI] [PMC free article] [PubMed] [Google Scholar]
- 19.Frasch M. The maternally expressed Drosophila gene encoding the chromatin-binding protein BJ1 is a homolog of the vertebrate gene Regulator of Chromatin Condensation, RCC1. EMBO J. 1991;10:1225–1236. doi: 10.1002/j.1460-2075.1991.tb08064.x. [DOI] [PMC free article] [PubMed] [Google Scholar]
- 20.Toyama BH, et al. Identification of long-lived proteins reveals exceptional stability of essential cellular structures. Cell. 2013;154:971–982. doi: 10.1016/j.cell.2013.07.037. [DOI] [PMC free article] [PubMed] [Google Scholar]
- 21.Galy V, Mattaj IW, Askjaer P. Caenorhabditis elegans nucleoporins Nup93 and Nup205 determine the limit of nuclear pore complex size exclusion in vivo. Mol. Biol. Cell. 2003;14:5104–5115. doi: 10.1091/mbc.E03-04-0237. [DOI] [PMC free article] [PubMed] [Google Scholar]
- 22.Ribbeck K, Lipowsky G, Kent HM, Stewart M, Gorlich D. NTF2 mediates nuclear import of Ran. EMBO J. 1998;17:6587–6598. doi: 10.1093/emboj/17.22.6587. [DOI] [PMC free article] [PubMed] [Google Scholar]
- 23.Smith AE, Slepchenko BM, Schaff JC, Loew LM, Macara IG. Systems analysis of Ran transport. Science. 2002;295:488–491. doi: 10.1126/science.1064732. [DOI] [PubMed] [Google Scholar]
- 24.Smith A, Brownawell A, Macara IG. Nuclear import of Ran is mediated by the transport factor NTF2. Curr. Biol. 1998;8:1403–1406. doi: 10.1016/s0960-9822(98)00023-2. [DOI] [PubMed] [Google Scholar]
- 25.Neumann M, et al. Ubiquitinated TDP-43 in frontotemporal lobar degeneration and amyotrophic lateral sclerosis. Science. 2006;314:130–133. doi: 10.1126/science.1134108. [DOI] [PubMed] [Google Scholar]
- 26.Ward ME, et al. Early retinal neurodegeneration and impaired Ran-mediated nuclear import of TDP-43 in progranulin-deficient FTLD. J. Exp. Med. 2014;211:1937–1945. doi: 10.1084/jem.20140214. [DOI] [PMC free article] [PubMed] [Google Scholar]
- 27.D'Angelo MA, Gomez-Cavazos JS, Mei A, Lackner DH, Hetzer MW. A change in nuclear pore complex composition regulates cell differentiation. Dev. Cell. 2012;22:446–458. doi: 10.1016/j.devcel.2011.11.021. [DOI] [PMC free article] [PubMed] [Google Scholar]
- 28.Nishimura AL, et al. Nuclear import impairment causes cytoplasmic trans-activation response DNA-binding protein accumulation and is associated with frontotemporal lobar degeneration. Brain. 2010;133:1763–1771. doi: 10.1093/brain/awq111. [DOI] [PubMed] [Google Scholar]
- 29.Sareen D, et al. Targeting RNA foci in iPSC-derived motor neurons from ALS patients with a C9ORF72 repeat expansion. Sci. Transl. Med. 2013;5:208ra149. doi: 10.1126/scitranslmed.3007529. [DOI] [PMC free article] [PubMed] [Google Scholar]
- 30.Lagier-Tourenne C, et al. Targeted degradation of sense and antisense C9orf72 RNA foci as therapy for ALS and frontotemporal degeneration. Proc. Natl. Acad. Sci. U. S. A. 2013;110:E4530–E4539. doi: 10.1073/pnas.1318835110. [DOI] [PMC free article] [PubMed] [Google Scholar]
- 31.Zamiri B, Reddy K, Macgregor RB, Jr., Pearson CE. TMPyP4 porphyrin distorts RNA G-quadruplex structures of the disease-associated r(GGGGCC)n repeat of the C9orf72 gene and blocks interaction of RNA-binding proteins. J. Biol. Chem. 2014;289:4653–4659. doi: 10.1074/jbc.C113.502336. [DOI] [PMC free article] [PubMed] [Google Scholar]
- 32.Schmidt J, et al. Genome-wide studies in multiple myeloma identify XPO1/CRM1 as a critical target validated using the selective nuclear export inhibitor KPT-276. Leukemia. 2013;27:2357–2365. doi: 10.1038/leu.2013.172. [DOI] [PMC free article] [PubMed] [Google Scholar]
- 33.Nousiainen HO, et al. Mutations in mRNA export mediator GLE1 result in a fetal motoneuron disease. Nat. Genet. 2008;40:155–157. doi: 10.1038/ng.2007.65. [DOI] [PMC free article] [PubMed] [Google Scholar]
- 34.Kaneb HM, et al. Deleterious mutations in the essential mRNA metabolism factor, hGle1, in amyotrophic lateral sclerosis. Hum. Mol. Genet. 2014 doi: 10.1093/hmg/ddu545. [DOI] [PMC free article] [PubMed] [Google Scholar]
- 35.Kinoshita Y, et al. Nuclear contour irregularity and abnormal transporter protein distribution in anterior horn cells in amyotrophic lateral sclerosis. J. Neuropathol. Exp. Neurol. 2009;68:1184–1192. doi: 10.1097/NEN.0b013e3181bc3bec. [DOI] [PubMed] [Google Scholar]
- 36.D'Angelo MA, Raices M, Panowski SH, Hetzer MW. Age-dependent deterioration of nuclear pore complexes causes a loss of nuclear integrity in postmitotic cells. Cell. 2009;136:284–295. doi: 10.1016/j.cell.2008.11.037. [DOI] [PMC free article] [PubMed] [Google Scholar]
- 37.Ni JQ, et al. A Drosophila resource of transgenic RNAi lines for neurogenetics. Genetics. 2009;182:1089–1100. doi: 10.1534/genetics.109.103630. [DOI] [PMC free article] [PubMed] [Google Scholar]
- 38.Ritson GP, et al. TDP-43 mediates degeneration in a novel Drosophila model of disease caused by mutations in VCP/p97. J. Neurosci. 2010;30:7729–7739. doi: 10.1523/JNEUROSCI.5894-09.2010. [DOI] [PMC free article] [PubMed] [Google Scholar]
- 39.Osterwalder T, Yoon KS, White BH, Keshishian H. A conditional tissue-specific transgene expression system using inducible GAL4. Proc. Natl. Acad. Sci. U. S. A. 2001;98:12596–12601. doi: 10.1073/pnas.221303298. [DOI] [PMC free article] [PubMed] [Google Scholar]
- 40.Nelson HB, et al. Calmodulin point mutations affect Drosophila development and behavior. Genetics. 1997;147:1783–1798. doi: 10.1093/genetics/147.4.1783. [DOI] [PMC free article] [PubMed] [Google Scholar]
- 41.Machamer JB, Collins SE, Lloyd TE. The ALS gene FUS regulates synaptic transmission at the Drosophila neuromuscular junction. Hum. Mol. Genet. 2014;23:3810–3822. doi: 10.1093/hmg/ddu094. [DOI] [PMC free article] [PubMed] [Google Scholar]
- 42.Son EY, et al. Conversion of mouse and human fibroblasts into functional spinal motor neurons. Cell Stem Cell. 2011;9:205–218. doi: 10.1016/j.stem.2011.07.014. [DOI] [PMC free article] [PubMed] [Google Scholar]
- 43.Rubin GM, et al. A Drosophila complementary DNA resource. Science. 2000;287:2222–2224. doi: 10.1126/science.287.5461.2222. [DOI] [PubMed] [Google Scholar]
- 44.Bischof J, Maeda RK, Hediger M, Karch F, Basler K. An optimized transgenesis system for Drosophila using germ-line-specific phiC31 integrases. Proc. Natl. Acad. Sci. U. S. A. 2007;104:3312–3317. doi: 10.1073/pnas.0611511104. [DOI] [PMC free article] [PubMed] [Google Scholar]
- 45.Venken KJ, He Y, Hoskins RA, Bellen HJ. P[acman]: a BAC transgenic platform for targeted insertion of large DNA fragments in D. melanogaster. Science. 2006;314:1747–1751. doi: 10.1126/science.1134426. [DOI] [PubMed] [Google Scholar]
- 46.Brand AH, Perrimon N. Targeted gene expression as a means of altering cell fates and generating dominant phenotypes. Development. 1993;118:401–415. doi: 10.1242/dev.118.2.401. [DOI] [PubMed] [Google Scholar]
- 47.Diaper DC, et al. Loss and gain of Drosophila TDP-43 impair synaptic efficacy and motor control leading to age-related neurodegeneration by loss-of-function phenotypes. Hum. Mol. Genet. 2013;22:1539–1557. doi: 10.1093/hmg/ddt005. [DOI] [PMC free article] [PubMed] [Google Scholar]
- 48.Devlin AC, et al. Human iPSC-derived motoneurons harbouring TARDBP or C9ORF72 ALS mutations are dysfunctional despite maintaining viability. Nat. Commun. 2015;6:5999. doi: 10.1038/ncomms6999. [DOI] [PMC free article] [PubMed] [Google Scholar]
Associated Data
This section collects any data citations, data availability statements, or supplementary materials included in this article.
Supplementary Materials
SMT1
SMT2
SMT3
SMT4
