Comprehensive genomic profiles of small cell lung cancer (original) (raw)
. Author manuscript; available in PMC: 2016 May 9.
Published in final edited form as: Nature. 2015 Jul 13;524(7563):47–53. doi: 10.1038/nature14664
Abstract
We have sequenced the genomes of 110 small cell lung cancers (SCLC), one of the deadliest human cancers. In nearly all the tumours analysed we found bi-allelic inactivation of TP53 and RB1, sometimes by complex genomic rearrangements. Two tumours with wild-type RB1 had evidence of chromothripsis leading to overexpression of cyclin D1 (encoded by the CCND1 gene), revealing an alternative mechanism of Rb1 deregulation. Thus, loss of the tumour suppressors TP53 and RB1 is obligatory in SCLC. We discovered somatic genomic rearrangements of TP73 that create an oncogenic version of this gene, TP73Δex2/3. In rare cases, SCLC tumours exhibited kinase gene mutations, providing a possible therapeutic opportunity for individual patients. Finally, we observed inactivating mutations in NOTCH family genes in 25% of human SCLC. Accordingly, activation of Notch signalling in a pre-clinical SCLC mouse model strikingly reduced the number of tumours and extended the survival of the mutant mice. Furthermore, neuroendocrine gene expression was abrogated by Notch activity in SCLC cells. This first comprehensive study of somatic genome alterations in SCLC uncovers several key biological processes and identifies candidate therapeutic targets in this highly lethal form of cancer.
Small cell lung cancer (SCLC) accounts for approximately 15% of all lung cancers, arises in heavy smokers, and the tumour cells express neuroendocrine markers. Although chemotherapy is initially effective in the treatment of SCLC, recurrence arises rapidly in the vast majority of cases, usually killing the patient within only a few months1. SCLC is rarely treated by surgery and few specimens are available for genomic characterization. Previous studies applying mostly exome sequencing in a limited number of tumour specimens have revealed only a few recurrently mutated genes2,3.
We hypothesized that complex genomic rearrangements, which are undetectable by exome sequencing, might further contribute to the pathogenesis of SCLC and thus performed whole-genome sequencing of 110 human SCLC specimens (Supplementary Tables 1–4). One of the hallmarks of SCLC is the high frequency of mutations in TP53 and RB1 (refs 2–7). As mice lacking Trp53 and Rb1 in the lung develop SCLC8,9, we also sequenced 8 of these murine SCLC tumours in order to identify mutations that may promote SCLC development following loss of Trp53 and Rb1 and that may overlap with such accessory genes in human SCLC10 (Supplementary Table 5).
Samples and clinical data
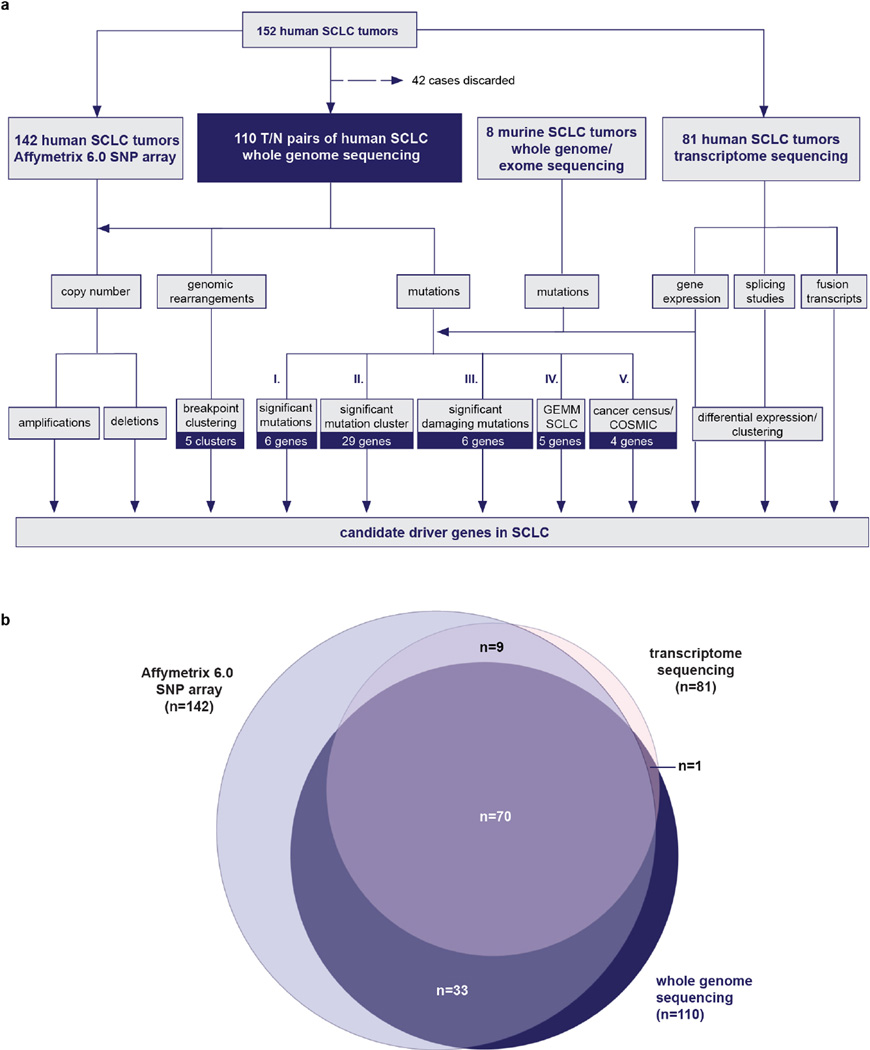
We collected 152 fresh-frozen clinical tumour specimens obtained from patients diagnosed with stage I–IV SCLC under institutional review board approval (Supplementary Table 1 and Extended Data Fig. 1). The tumour samples were enriched for earlier stages and consisted of primary lung (n = 148) and metastatic tumours (n = 4) obtained by surgical resection (n = 132), biopsy (n = 4), pleural effusion (n = 1) or through autopsy (n = 15). We performed whole-genome sequencing on 110 of these tumours and their matched normal DNA. A total of 42 cases were excluded from the analysis because of insufficient quality or amount of DNA. Most of these 110 tumours were treatment-naive, with only five cases obtained at the time of relapse. We analysed transcriptome sequencing data in 71 of the 110 specimens that had undergone genome sequencing and in 10 additional specimens. Finally, 103 of the 110 genome-sequenced specimens and 39 additional specimens were analysed by Affymetrix 6.0 SNP arrays (Supplementary Table 1 and Extended Data Fig. 1). Eight tumour samples from preclinical SCLC mouse models were analysed by whole-exome sequencing (n = 6) or whole-genome sequencing (n = 2) (Supplementary Table 5).
Recurrent somatic alterations in SCLC
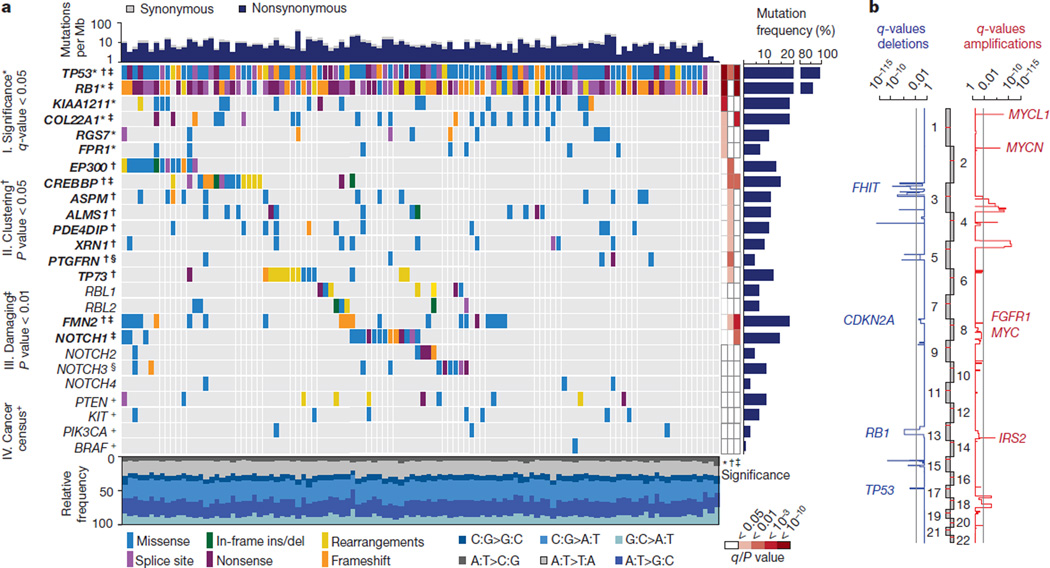
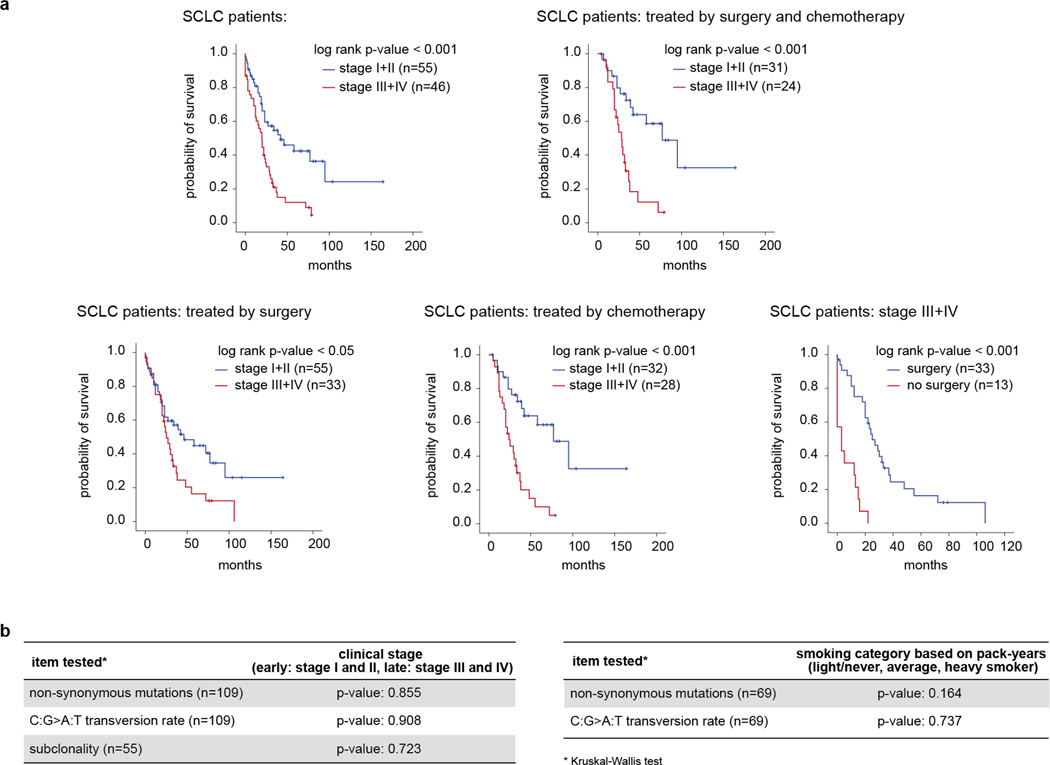
SCLC genomes exhibited extremely high mutation rates2,3 of 8.62 nonsynonomous mutations per million base pairs (Mb). C:G>A:T transversions were found in 28% of all mutations on average, a pattern indicative of heavy smoking (Fig. 1a and Supplementary Tables 2 and 3). The smoking history or clinical stage of the tumours did not correlate with the type and number of mutations (Extended Data Fig. 2). The median tumour content was 84% (Extended Data Fig. 3a and Supplementary Table 2). By contrast, murine SCLC tumours showed a low number of somatic alterations (on average 28.5 protein-altering mutations per sample on average)10 (Supplementary Table 5).
Figure 1. Genomic alterations in small cell lung cancer.
a, Tumour samples are arranged from left to right. Alterations of SCLC candidate genes are annotated for each sample according to the colour panel below the image. The somatic mutation frequencies for each candidate gene are plotted on the right panel. Mutation rates and type of base-pair substitution are displayed in the top and bottom panel, respectively. Significant candidate genes are highlighted in bold (*corrected q_-values < 0.05, †_P < 0.05, ‡P < 0.01). The respective level of significance is displayed as a heatmap on the right panel. Genes that are also mutated in murine SCLC tumours are denoted with a § symbol. Mutated cancer census genes of therapeutic relevance are denoted with a + symbol. b, Somatic copy number alterations determined for 142 human SCLC tumours by single nucleotide polymorphism (SNP) arrays. Significant amplifications (red) and deletions (blue) were determined for the chromosomal regions and are plotted as _q_-values (significance < 0.05).
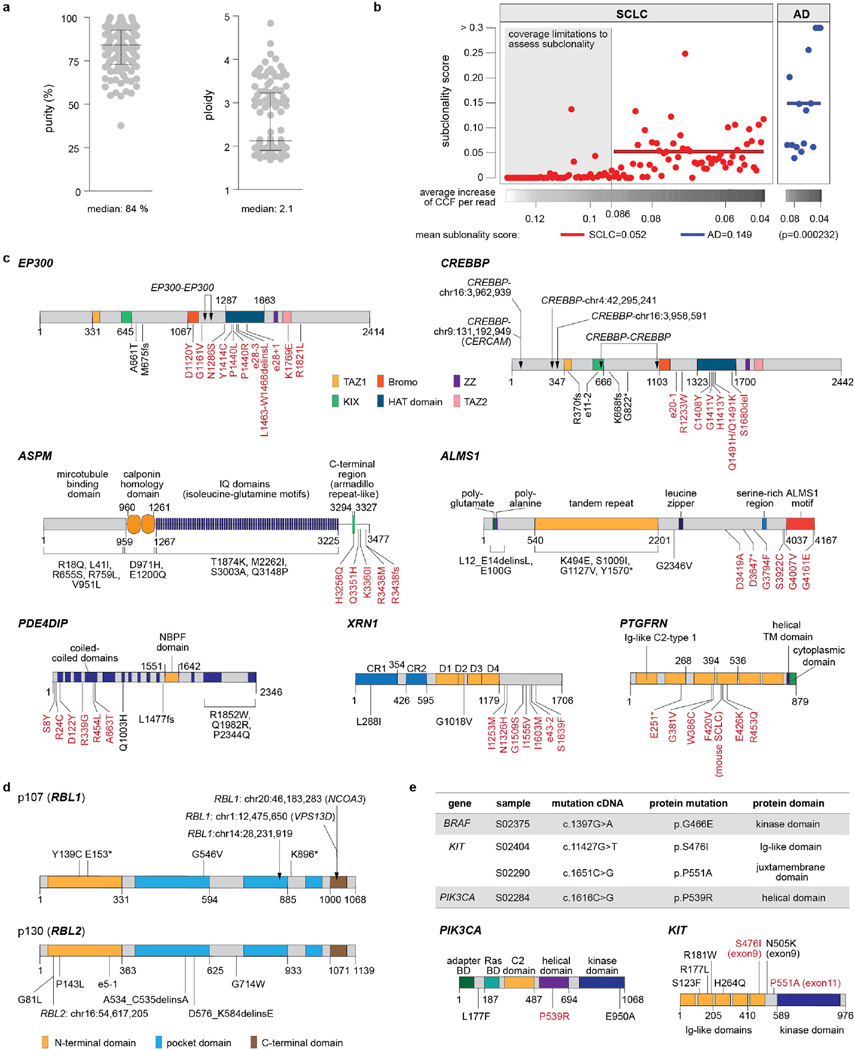
In order to assess the amount of genetic heterogeneity of SCLC, we developed a subclonality score, which can be interpreted as the probability that an arbitrary point mutation in a randomly selected cancer cell is subclonal throughout the entire tumour (Methods). A reliable reconstruction of the subclonal architecture was possible in 55 of the cases (Extended Data Fig. 3b). A comparison to lung adenocarcinoma11 indicated a threefold lower subclonal diversity in SCLC (P = 0.00023, Extended Data Fig. 3b), pointing to pronounced differences in the evolution of SCLC and lung adenocarcinoma12,13. In contrast to adenocarcinomas, the level of heterogeneity in SCLC did not correlate with clinical stage (Extended Data Fig. 2b).
We applied several analytical filters in order to identify mutations with a probable relevance in SCLC biology in the context of the high load of background mutations2 (Extended Data Fig. 1, Supplementary Table 6 and Methods). They include (I) analyses of significance determined by a comparison of observed and expected mutation rates followed by a correction for expressed genes, (II) a survey of regional clustering of mutations that may indicate mutational targeting of functionally enriched areas in tumour suppressors or proto-oncogenes, (III) determination of genes that are enriched for likely damaging mutations, (IV) a comparison with genes whose biological relevance has been established in SCLC mouse models, and (V) a listing of genes with a likely therapeutic relevance or that are otherwise frequently affected by genetic alterations in human cancers (that is, genes in the Cancer Gene Census14 and COSMIC15 database).
Among the significantly mutated genes (I), (_q_-values < 0.05, Methods) were TP53 and RB1 (refs 4–7), KIAA1211 and COL22A1, as well as RGS7 and FPR1, both of which are involved in G-protein-coupled receptor signalling (Fig. 1a).
Locally clustered mutations (II) are indicative of functional selection (P < 0.05, Supplementary Table 6, Methods)2,16. Of all genes, Fig. 1a lists those alterations that occurred in more than 8% of the samples, were otherwise affected by recurrent genomic rearrangements (Supplementary Table 4), or were mutated in _Trp53_−/−, _Rb1_−/− or _Trp53_−/−, _Rb1_−/−, _Rbl2_−/− SCLC tumours arising in mice8,9 (Supplementary Table 5). Confirming previous results and our analytical strategy, the histone acetyltransferase genes CREBBP and EP300 exhibited significantly clustered mutations and recurrent inactivating translocations (Fig. 1a and Extended Data Fig. 3c)2,3. Furthermore, significant mutation clustering occurred in genes with functional roles in the centrosome (ASPM, ALMS1 and PDE4DIP), in the RNA-regulating gene XRN1 and the tetraspanin gene PTGFRN; the latter was also mutated in murine SCLC (Extended Data Fig. 3c). The TP53 homologue TP73, which was also affected by recurrent somatic rearrangements (Fig. 1a), also showed clustered mutations.
In the group of significantly damaged genes (III) we also found TP53, RB1, CREBBP and COL22A1, further highlighting their likely biological relevance in SCLC. Additional inactivating mutations occurred in FMN2 and NOTCH1 (P < 0.01). NOTCH family genes were recurrently mutated with a pattern of frequent inactivation. Notch3 was also mutated in a _Trp53_−/−,_Rb1_−/−,_Rbl2_−/− mouse tumour (Fig. 1a, Supplementary Table 5 and Methods).
Of the genes with an established role in murine SCLC (IV), we confirmed PTEN10,17. RBL1 and RBL2, which are closely related to RB1 (ref. 9), similarly exhibited inactivating translocations and mutations (Fig. 1a, Extended Data Fig. 3d and Supplementary Table 4). Mice with inactivation of Trp53, Rb1 and Rbl2 develop SCLC with shorter latency than mice lacking Trp53 and Rb1 alone9, thus validating RBL2 as another accessory tumour suppressor in SCLC.
Given the lack of therapeutic options in SCLC, we sought mutations that are known oncogenic drivers in other cancers and sometimes associated with response to targeted drugs (V)14,15. Of these, we found mutations in four tumours with a potential therapeutic implication, including mutations in BRAF18, KIT19,20 and PIK3CA21 (Extended Data Fig. 3e). Thus, genotyping of SCLC patients may reveal individual patients who might have a possible benefit from targeted therapeutic intervention.
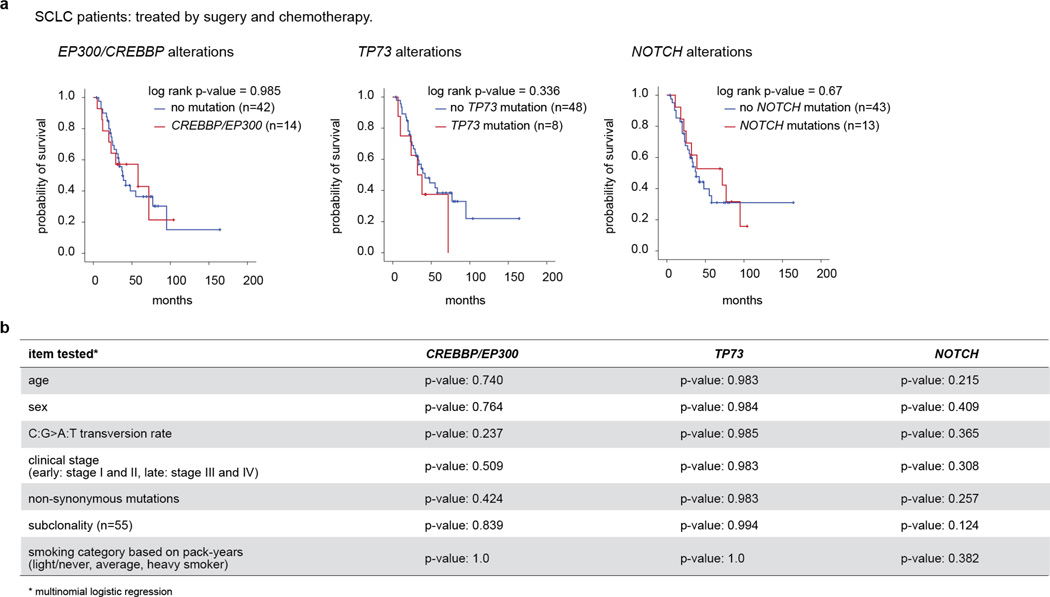
Across these five categories, mutations in CREBBP, EP300, TP73, RBL1, RBL2 and NOTCH family genes were largely mutually exclusive (Fig. 1a), suggesting that they may exert similar pro-tumorigenic functions in the development of SCLC. We did not observe significant correlations of global mutational signatures (for example, predominance of C:G>A:T transversions) with the mutational status of these genes (Extended Data Fig. 2b). Furthermore, mutations in these genes were not significantly associated with the total number of mutations, overall survival or other clinical parameters (Extended Data Fig. 4). The mutation status of 22 of the most frequently mutated genes was confirmed in an independent data set (Methods and Supplementary Table 7).
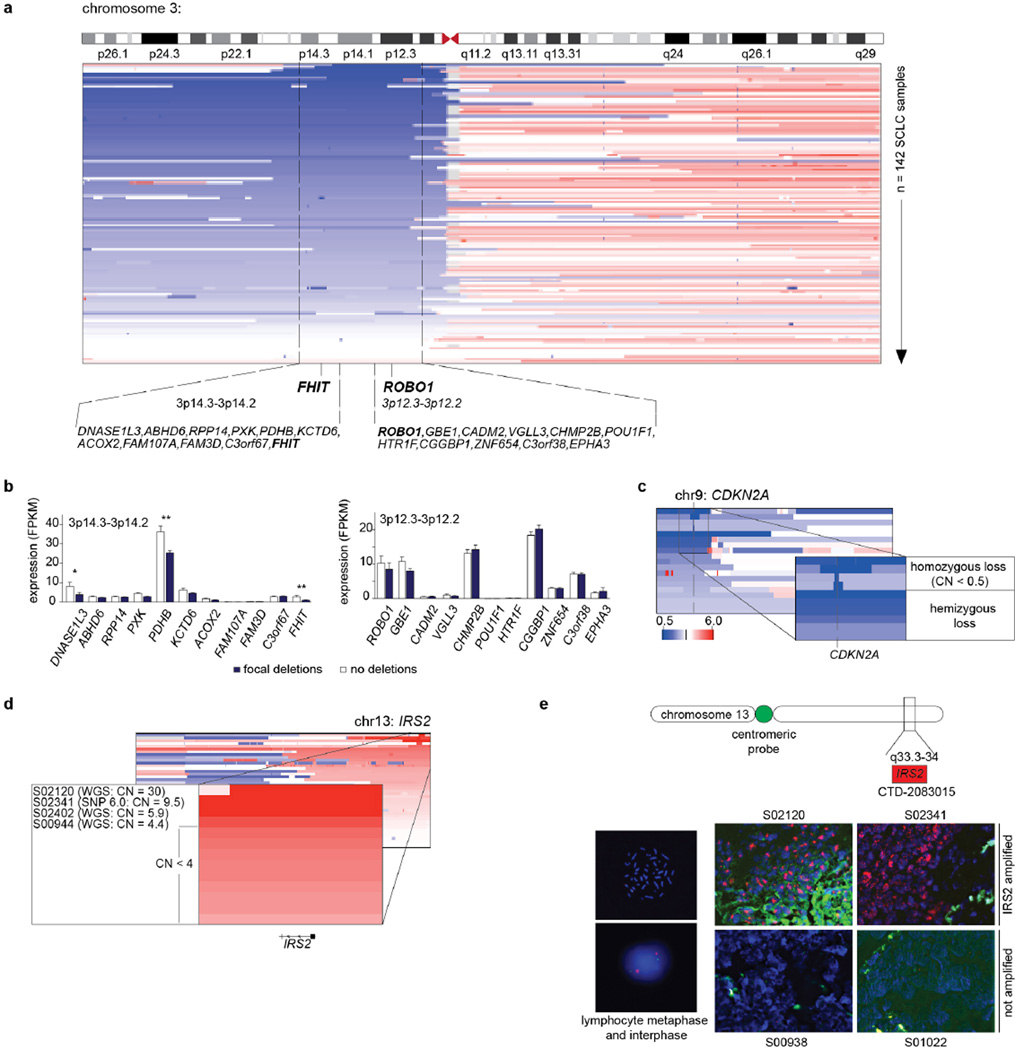
By analysing somatic copy number alterations, we confirmed previously known genomic losses within 3p pointing to focal events on 3p14.3–3p14.2 (harbouring FHIT5) and 3p12.3–3p12.2 (harbouring ROBO1 (ref. 22)) (Fig. 1b, Extended Data Fig. 5a and Supplementary Table 8)5,22,23. FHIT expression was also reduced in cases with focal deletions (Extended Data Fig. 5b). In addition to homozygous losses in the CDKN2A locus (Extended Data Fig. 5c), amplification of the MYC family genes5, MYCL1, MYCN and MYC, as well as of the tyrosine kinase gene, FGFR1 (refs 2, 24), and IRS2 were recurrent genomic events (Fig. 1b). Focal IRS2 amplifications occurred in 2% of the cases (Extended Data Fig. 5d, e).
Universal inactivation of TP53 and RB1
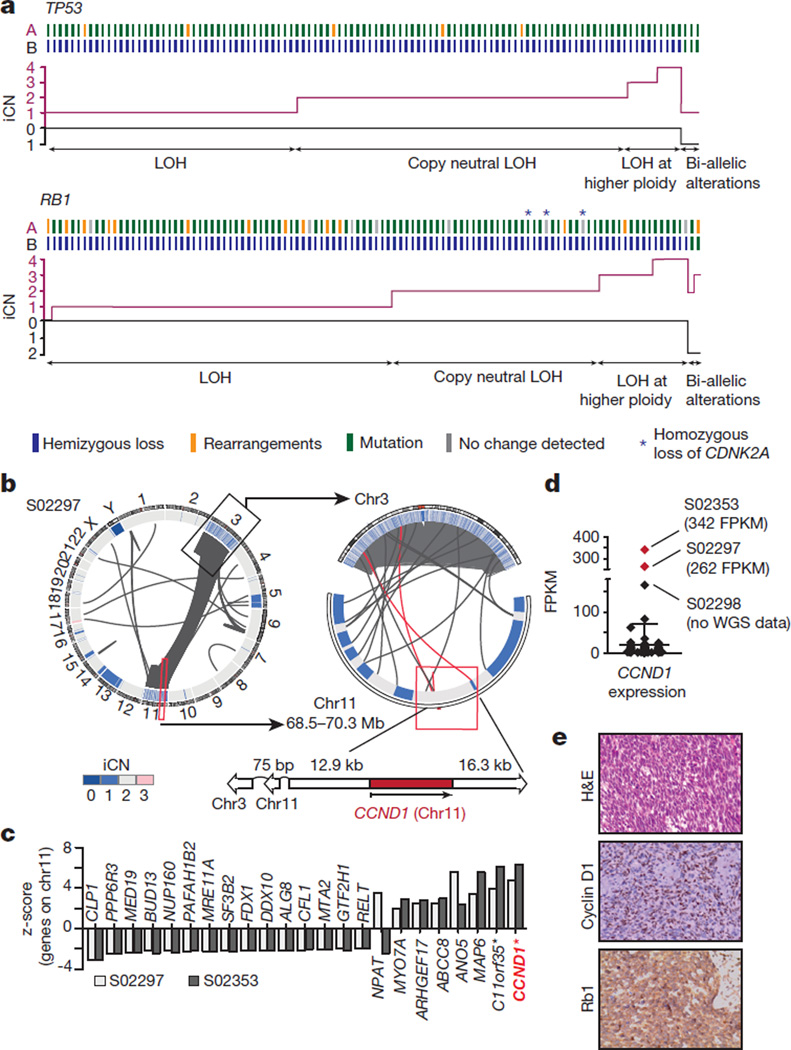
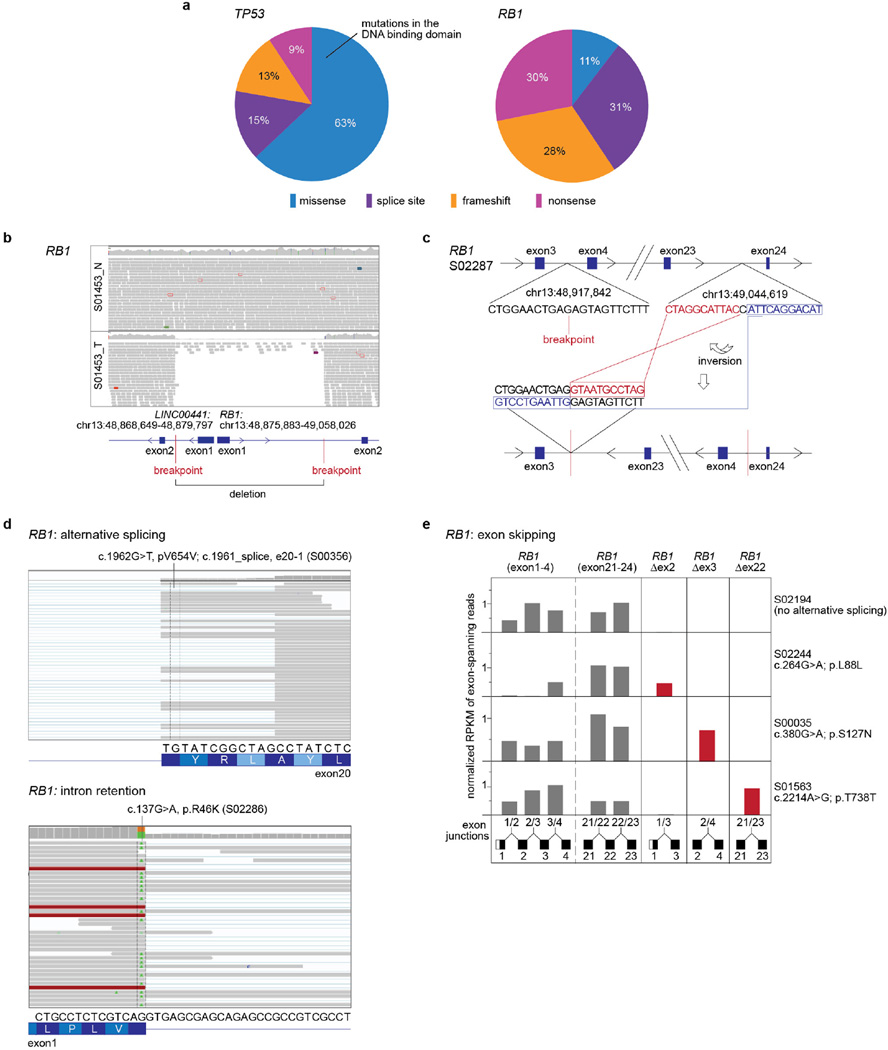
Inactivating mutations in TP53 and RB1 have been shown to affect up to 90% and up to 65% of SCLC, respectively2–7. By contrast, our whole-genome sequencing analyses revealed that both genes were altered in all but two cases that exhibited signs of chromothripsis25 (Figs 1 and 2). TP53 and RB1 alterations were mostly inactivating (Supplementary Table 9 and Extended Data Fig. 6a). Missense mutations in TP53 affected the functionally critical DNA binding domain, while RB1 was frequently altered by complex genomic translocations. Many mutations in RB1 occurred at exon–intron junctions, which caused protein-damaging splice events as confirmed by transcriptome sequencing (Extended Data Fig. 6b–e and Supplementary Tables 10 and 11). In the 108 tumours without chromothripsis, TP53 and RB1 had bi-allelic losses in 100% and 93% of the cases, respectively. Inactivating events included mutations, translocations, homozygous deletions, hemizygous losses, copy-neutral losses of heterozygosity (LOH) and LOH at higher ploidy (Fig. 2a, Extended Data Fig. 6 and Supplementary Table 9). Loss of CDKN2A occurred in cases with both bi-allelic inactivation of TP53 and RB1 and hemizygous loss of RB1 (Fig. 2a). Although emerging data supports a continuum model of inactivation of tumour suppressors across multiple cancers, TP53 and RB1 follow the classical discrete ‘two-hit paradigm’ pattern of Knudson-type tumour suppressors in SCLC26,27.
Figure 2. Universal bi-allelic inactivation of TP53 and RB1 in human SCLC.
a, Alterations of TP53 and RB1 were determined based on whole-genome sequencing data of 108 SCLC cases. Samples are plotted from left to right. Alleles A and B are represented for each case and colour-coded according to the somatic alteration. The integral copy number (iCN) state of each allele is plotted; hemizygous losses are annotated as loss of heterozygosity (LOH), copy-neutral LOH or LOH at higher ploidy. Samples retaining allele A and B show alterations on both alleles (bi-allelic alterations). b, Circos plot of case S02297 showing intra- and interchromosomal translocations between chromosome 3 and 11. The copy number state of the respective chromosomal regions (iCN) is plotted as a heatmap. The genomic context of CCND1 (on chromosome 11) is highlighted. c, Significantly differentially expressed genes encoded on chromosome 11 are analysed in both chromothripsis cases in comparison to all other tumours. Positive and negative _z_-scores show upregulation and downregulation of genes, respectively (P < 0.05; *_q_-value < 0.05). d, Distribution of CCND1 expression over 81 SCLC samples. Chromothripsis cases are highlighted in red. e, Haematoxylin and eosin (H&E) and immunohistochemistry staining for cyclin D1 and Rb1 for sample S02297. Original magnification, ×400.
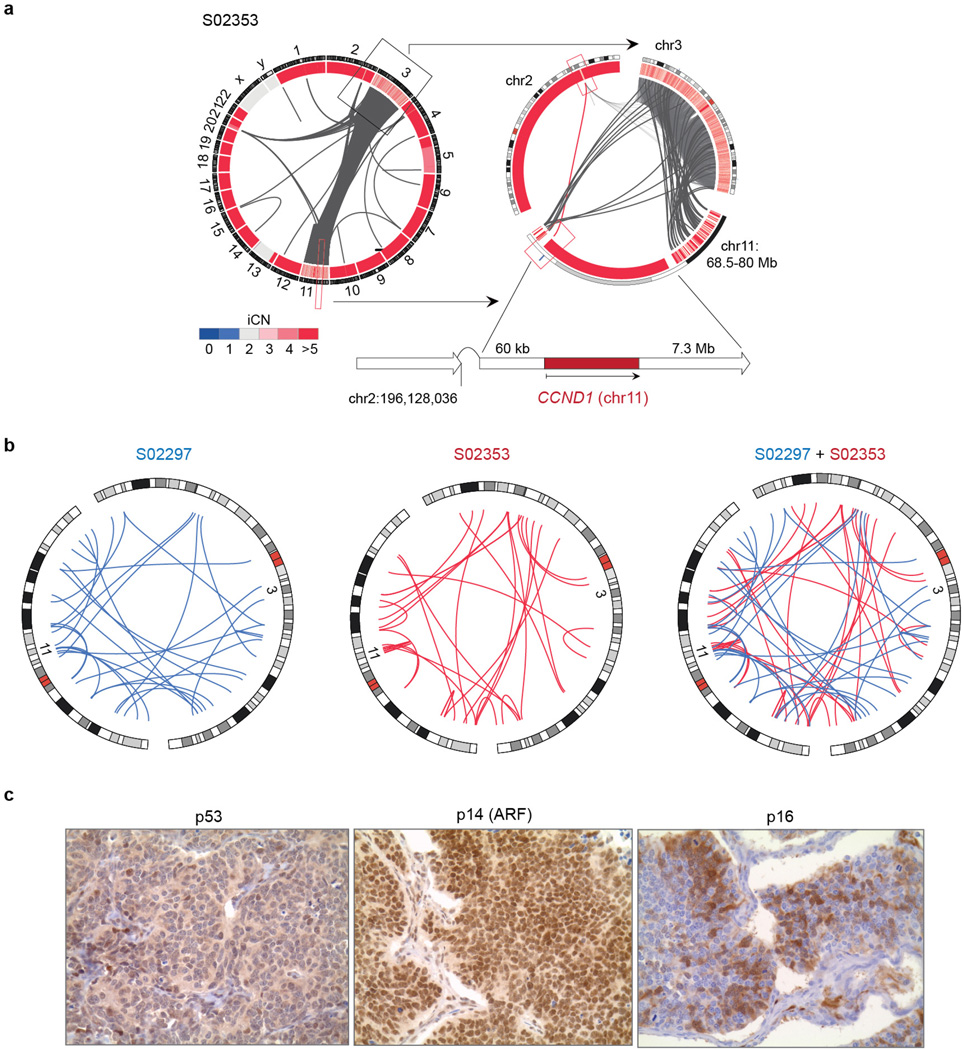
The two tumours affected by chromothripsis displayed a similar pattern of massive genomic rearrangements between chromosomes 3 and 11 (Fig. 2b and Extended Data Fig. 7a), but lacked shared fusion transcripts in the transcriptome sequencing data, suggesting that a particular fusion is not a common target (Extended Data Fig. 7b and Supplementary Table 12). Of the genes on chromosomes 3 and 11, CCND1 (encoding cyclin D1) was retained (Fig. 2b and Extended Data Fig. 7a) resulting in significant CCND1 overexpression in both tumours, but not in the other SCLC specimens (Fig. 2c, d and Supplementary Table 13). Immunohistochemistry confirmed high expression of cyclin D1 and a lack of nuclear Rb1 (Fig. 2e, Extended Data Fig. 7c). There were fewer proliferating Ki67-positive cells in these two cases. As cyclin D1 negatively regulates Rb family proteins28, these findings suggest that chromothripsis in cases with wild-type RB1 may compensate for genomic loss of RB1.
Together, our findings provide evidence for the notion that complete genomic loss of both TP53 and RB1 function is obligatory in the pathogenesis of SCLC.
Oncogenic genomic events affecting TP73
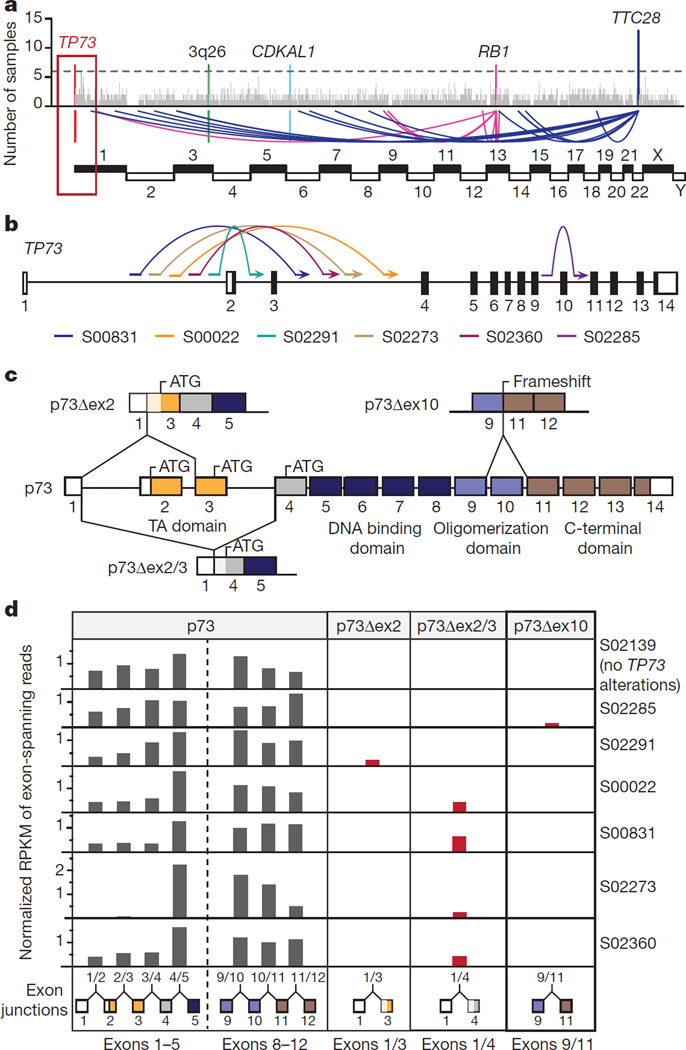
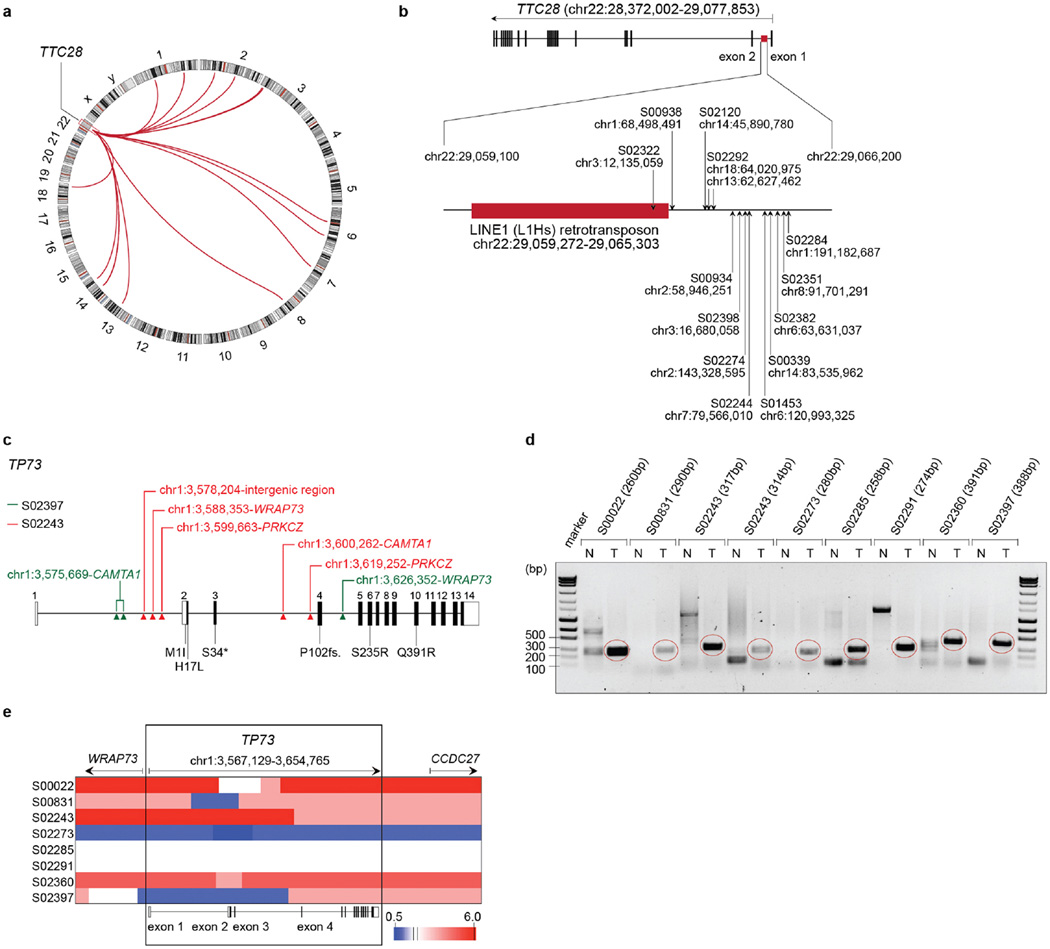
We analysed the genome sequencing data for the presence of clustered chromosomal breakpoints that may indicate a common biological target (Supplementary Table 14)29 and found 5 major clusters affecting RB1, as well as regions on chromosomes 1, 3 (3q26), 6 (affecting CDKAL1) and 22 (Fig. 3a). Breakpoints in chromosome 22 caused inactivating translocations of TTC28 (Extended Data Fig. 8a)30. Breakpoints also clustered downstream of the L1HS retrotransposon in SCLC, further supporting a role for this element in cancer31,32, (Extended Data Fig. 8b). Breakpoints on chromosomes 3, 6 and 22 did not result in changes of expression of the affected genes (Supplementary Table 10).
Figure 3. Recurrent rearrangements generating oncogenic variants of TP73.
a, Genomic breakpoints identified by whole-genome sequencing were mapped to their chromosomal locations. Recurrent breakpoints (n > 6 samples) are highlighted in colours. b, Schematic representation of the TP73 locus (hg19) illustrating intragenic translocations. Coding and non-coding regions of the annotated exons are shown as black and white boxes, respectively. c, Schematic representation of exons encoding p73, p73Δex2, p73Δex2/3 and p73Δex10. d, Exon skipping events were assessed in the transcriptome data of samples with genomic translocations resulting in p73Δex2, p73Δex2/3 and p73Δex10 transcript variants. S02139 served as a reference sample without TP73 alterations. The expression of uncommon exon combinations is highlighted in red.
By contrast, genomic breakpoints affecting chromosome 1 clustered precisely in the TP73 locus in 7% of the cases (n = 8). To our surprise, several breakpoints were recurrently located in introns 1, 2 and 3 of TP73. In two cases, breakpoints led to complex intrachromosomal rearrangements (Extended Data Fig. 8c and Supplementary Table 4), while the majority of breaks caused intragenic fusions and, thus, exclusion of either exon 2, or exons 2 and 3, which were all somatic (Fig. 3b and Extended Data Fig. 8d). Some rearrangements were copy-neutral events, while others occurred on the background of copy number gains (Extended Data Fig. 8e). One tumour sample revealed genomic exclusion of exon 10 (Fig. 3b). Analyses of transcriptome sequencing data confirmed that these rearrangements created the N-terminally truncated transcript variants p73Δex2 and p73Δex2/3, as well as p73Δex10 (ref. 33) (Fig. 3c, d and Supplementary Table 11). Genomic validation and comparative profiling of transcript variants confirmed that p73Δex2/3 were not naturally occurring splice variants in SCLC and were only found in cases with genomic rearrangements (Fig. 3d and Supplementary Table 11). Some tumours expressed p73Δex2, in which we failed to identify genomic rearrangements (Supplementary Table 11).
p73Δex2 and p73Δex2/3 lack a fully competent transactivation domain and are known tumour-derived variants of TP73 (ref. 33). p73 with N-terminal truncations has dominant negative functions on wild-type p73 and p53, and is a confirmed oncogene in vivo34,35. p73Δex10 results in an early stop codon; C-terminal truncations can similarly exert dominant-negative effects on wild-type p73 (ref. 33).
Altogether, TP73 was somatically altered by mutations and genomic rearrangements in 13% of the cases (Fig. 1 and Extended Data Fig. 8c–e). To our knowledge, this is the first study describing p73Δex2/3 variants to emerge as a consequence of precise genomic rearrangements.
Tumour suppressive roles of Notch in SCLC
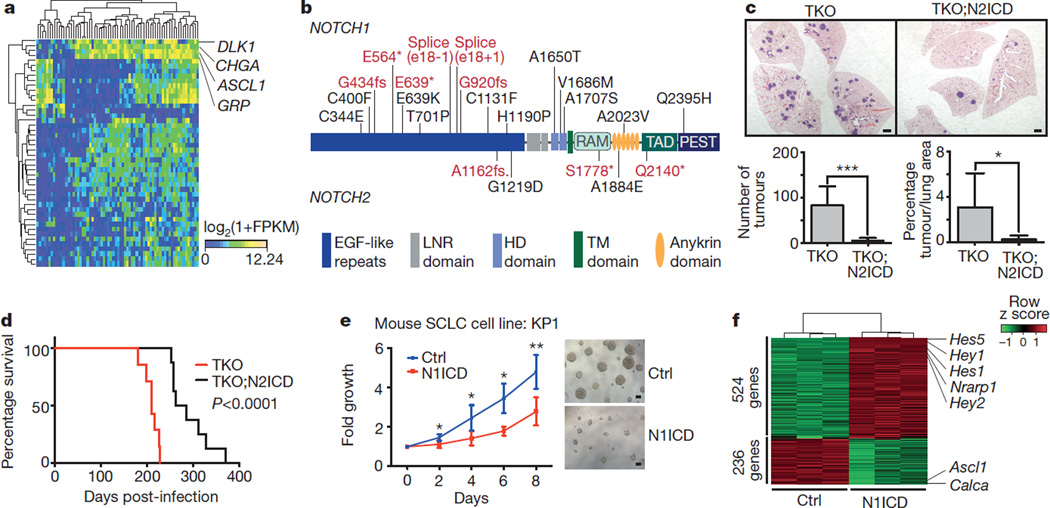
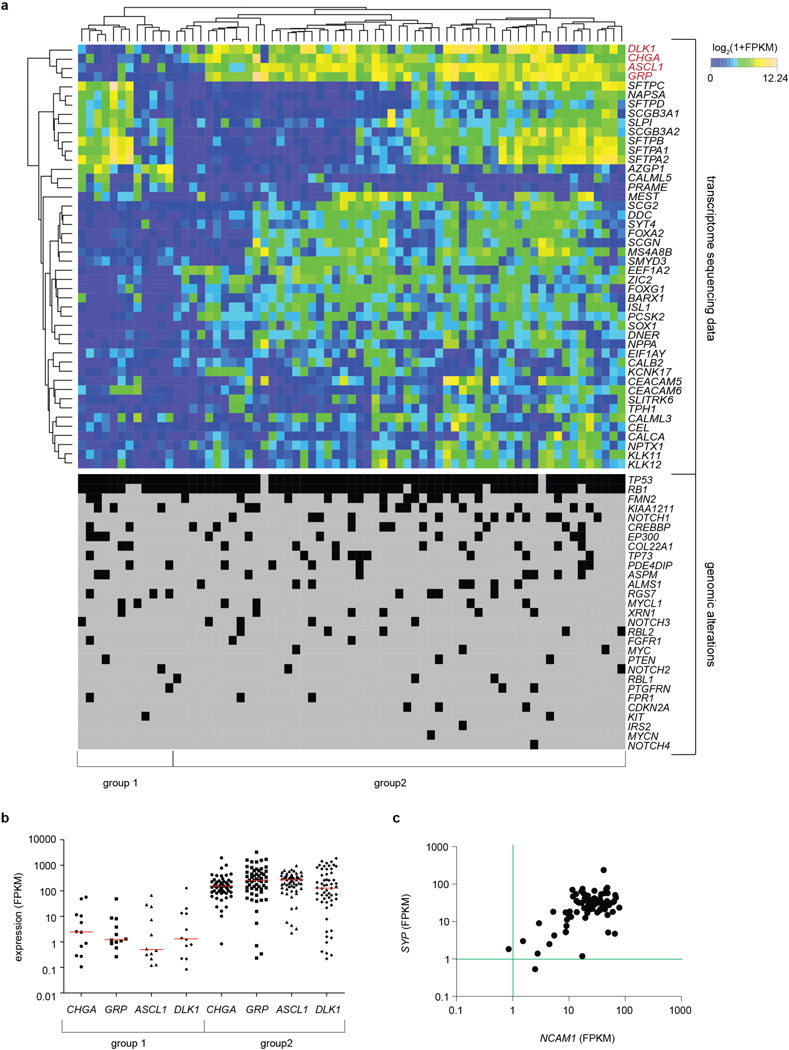
In an unsupervised hierarchical clustering analysis of transcriptome sequencing data (Methods), we observed two major clusters of SCLC tumours (Fig. 4a and Extended Data Fig. 9a). The majority (77%, n = 53/69) of tumours exhibited high expression of the neuroendocrine markers CHGA (chromogranin A)1 and GRP (gastrin releasing peptide)5, had high levels of DLK1 (ref. 36), a non-canonical inhibitor of Notch signalling36, and ASCL1, a lineage oncogene of neuroendocrine cells whose expression is inhibited by active Notch signalling (Extended Data Fig. 9b)37,38. The remaining cases (23%, n = 16/69) also expressed SYP (synaptophysin) or NCAM1 (CD56), thus confirming that all tumours were of the typical SCLC subtype1 (Extended Data Fig. 9c). Furthermore, no significant difference in the distribution of the major known SCLC mutations (for example, TP53, RB1 or CREBBP) existed between the two transcriptional subtypes (Extended Data Fig. 9a). Thus, although all SCLC tumours shared the most frequent mutations as well as key neuroendocrine markers, the majority had a gene expression pattern suggestive of low Notch pathway activity (high levels of ASCL1 and DLK1).
Figure 4. Notch is a tumour suppressor and a key regulator of neuroendocrine differentiation in SCLC.
a, Unsupervised expression analysis of human SCLC tumours. Tumour samples are arranged in columns and grouped by the expression of differentially expressed genes (rows). Expression values are represented as a heatmap; yellow and blue indicate high and low expression, respectively. b, Schematic representation of NOTCH1 and NOTCH2. Somatic mutations are mapped to the respective protein domains. Damaging and missense mutations are highlighted in red and black, respectively. c, Representative H&E images of lungs from Trp53;Rb1;Rbl2 triple-knockout (TKO) or TKO;N2ICD (Notch2) mice collected 3 months after Ad-Cre instillation. Scale bar, 1 mm. Tumours were quantified for each genotype (n = 8). Statistical significance was determined by two-tailed unpaired Student’s _t_-test. d, Survival analysis of TKO (n = 7, median survival = 210 days) and TKO;N2ICD (n = 8, median survival = 274 days) mice. Statistical significance was determined by log-rank test. e, Cell viability assay of the murine SCLC cell line KP1 transfected with a N1ICD (Notch1) expression plasmid or empty vector control (Ctrl) (3 independent biological replicas with 3 technical replicas each). Fold growth is normalized to day 0; representative images were taken on day 8. Scale bar, 50 µm. Statistical significance was determined by two-tailed paired Student’s _t_-test. f, Mouse SCLC cells were transfected with control or N1ICD and analysed 48 h after transfection by gene expression microarrays. The heatmap describes differentially expressed genes in control or N1ICD-transfected cells (n = 3, each); red and green indicate high and low expression, respectively. *P < 0.05; **P < 0.01; ***P < 0.001. Data are represented as mean ± s.d.
Mutations affected NOTCH family genes in both human and murine SCLC (Fig. 1a and Supplementary Table 5). The mutations did not cluster significantly in any individual domains, but frequent damaging mutations occurred in the extracellular domain (Fig. 4b and Extended Data Fig. 10a), suggesting that NOTCH may be a tumour suppressor in SCLC. Overall, the NOTCH family was affected by genomic alterations in 25% of human SCLC (Fig. 1).
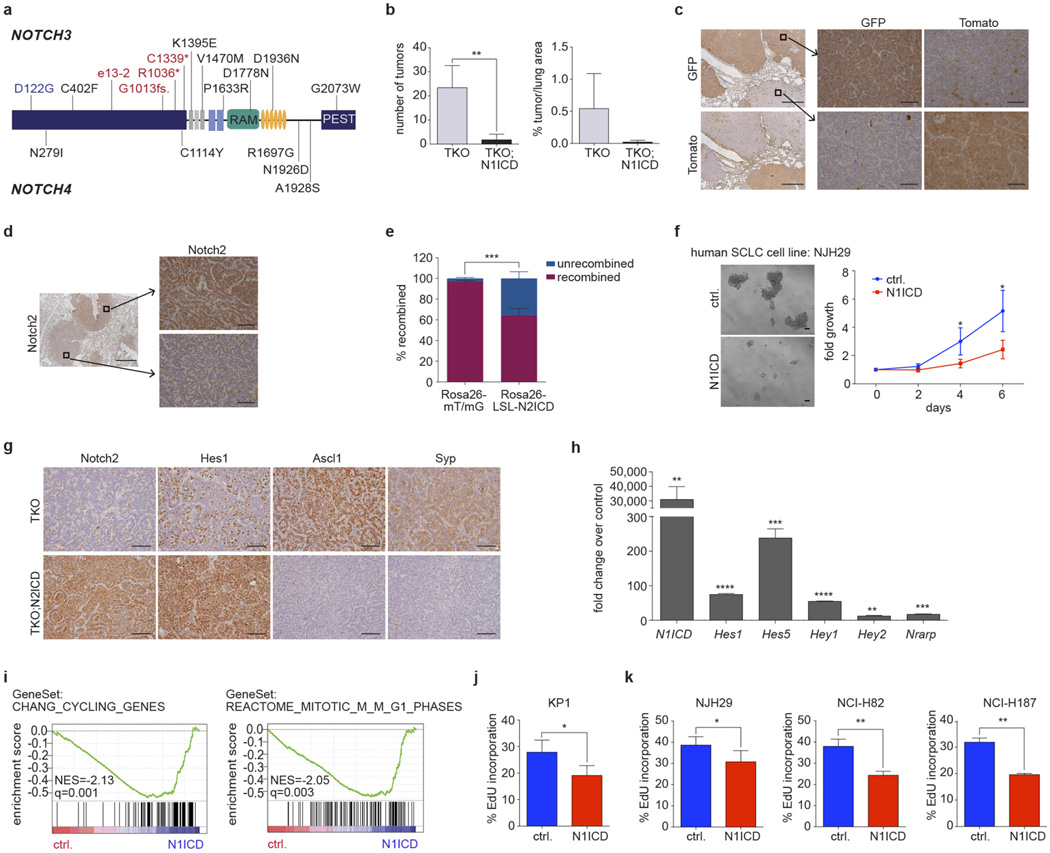
Based on these observations and emerging evidence that activation of Notch signalling may inhibit the expansion of neuroendocrine tumour cells39,40, we examined the consequences of Notch pathway activation in Trp53;Rb1;Rbl2 conditional triple-knockout (TKO) mice9.We crossed Rosa26Lox-stop-Lox-Notch2ICD (LSL-N2ICD) mice that conditionally express an activated form of Notch2 (Notch2 intracellular domain, N2ICD) to TKO mice and found a significant reduction in the number of tumours that arose in the presence of N2ICD (P < 0.001; Fig. 4c). Similar results were obtained upon activation of Notch1, reflecting a general inhibition of SCLC initiation by active Notch signalling (Extended Data Fig. 10b). The recombination efficiency of an innocuous inducible reporter allele (Rosa26mT/mG) by Cre was much greater than that of the N2ICD allele, providing further support for a strong negative selection against active Notch signalling during SCLC development (Extended Data Fig. 10c–e). Importantly, the inhibitory effects of Notch observed in the early stages of tumorigenesis correlated with a prolongation of survival of the mutant mice expressing N2ICD (Fig. 4d). Similarly, ectopic expression of N1ICD in both mouse and human SCLC cell lines significantly inhibited their growth (Fig. 4e and Extended Data Fig. 10f).
SCLC tumours in TKO mice showed typical patterns of neuroendocrine differentiation with high expression of synaptophysin and Ascl1. Consistent with the notion that Notch regulates neuroendocrine differentiation in SCLC, overexpression of N2ICD resulted in the upregulation of Hes1 and abrogated expression of neuroendocrine markers (Extended Data Fig. 10g). Similarly, N1ICD induced upregulation of Notch targets (for example, Hes1, Hey1, Hey2) in murine SCLC cells (Fig. 4f, Extended Data Fig. 10h and Supplementary Table 15), as well as gene expression signatures consistent with cell cycle inhibition (Extended Data Fig. 10i). Ectopic expression of N1ICD inhibited cell cycle progression in murine and human SCLC cell lines (Extended Data Fig. 10j, k). This cell cycle inhibition is reminiscent of what has been seen in other contexts where Notch activation acts as a tumour suppressor41,42.
Altogether, our analyses involving genome and transcriptome sequencing of human and murine SCLC tumours, as well as studies in genetically manipulated mice, identify and validate Notch as a tumour suppressor and master regulator of neuroendocrine differentiation in SCLC.
Discussion
Here we provide a comprehensive analysis of somatic genome alterations in SCLC, identifying many novel candidate genes, some of which may have therapeutic implications. Such alterations with immediate therapeutic consequences are rare but present in SCLC (for example, in BRAF or KIT), suggesting that individual patients may benefit from genotyping and subsequent targeted kinase inhibitor therapy. We further discovered recurrent expression of p73Δex2/3 in SCLC and established a genetic mechanistic basis for this oncogenic variant. _TP73_Δex2/3 has recently been demonstrated to function as an oncogene34,35 and therapeutic options were identified to restrict p73-dependent tumour growth in vivo, including in _Trp53_-deficient tumours35. Given the frequent occurrence of genomic TP73 alterations in SCLC, such approaches may potentially be promising in SCLC tumours. Our results furthermore provide proof for universal bi-allelic inactivation of TP53 and RB1, thereby establishing these two genes as obligatory tumour suppressors in SCLC.
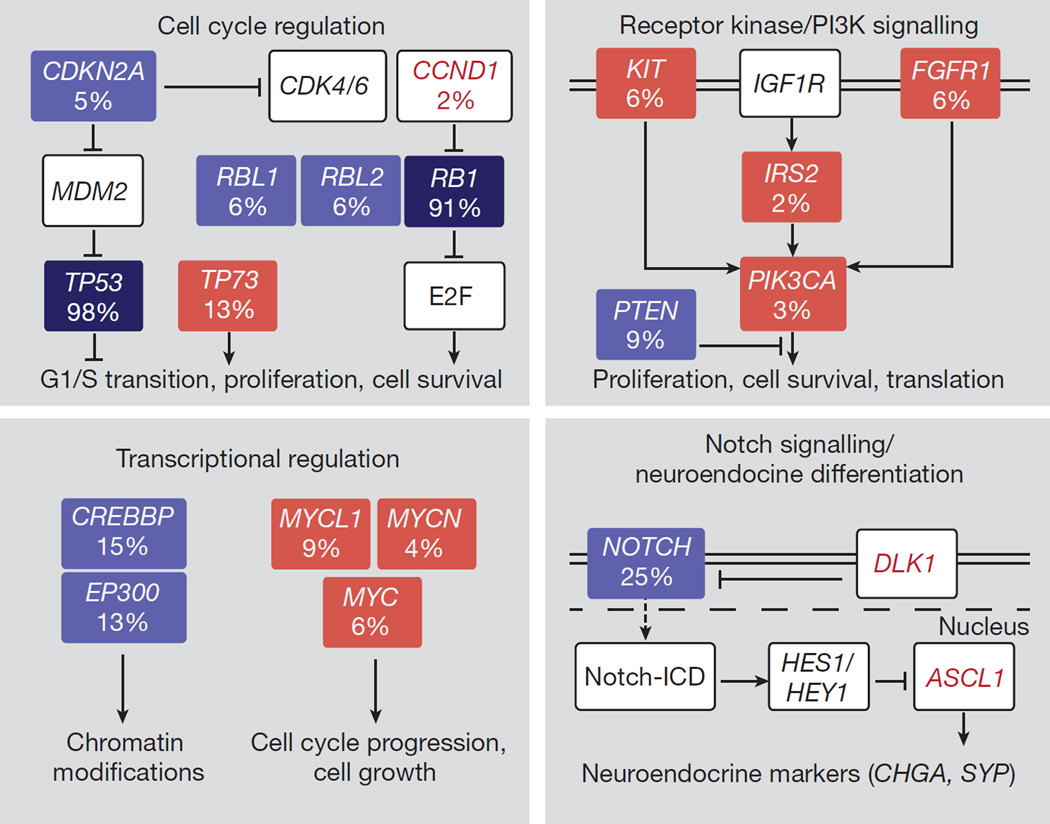
Our genomic analyses also identified NOTCH family genes as tumour suppressors and master regulators of neuroendocrine differentiation in SCLC, and we validated this finding in vivo in a pre-clinical mouse model of this disease. Our observations may thus provide an initial link between Notch and the neuroendocrine phenotype in SCLC. In contrast to the involvement of TP73 and NOTCH family genes (Fig. 5), the functional role of most of the other newly discovered genes (for example, KIAA1211, COL22A1, ASPM, PDE4DIP or PTGFRN) is much less clear. Although our analytical filters support their involvement in the tumour pathogenesis, functional experiments will be required to clarify their biological role.
Figure 5. Signalling pathways recurrently affected in SCLC.
Red and blue boxes denote genes with activating and inactivating alterations, respectively. Deep blue boxes highlight the bi-allelic inactivation of TP53 and RB1. Genes found expressed at high levels are shown in red font.
In summary, we have provided the first, to our knowledge, comprehensive genomic analysis of SCLC, implicating several previously unknown genes and biological processes (Fig. 5) in the pathogenesis of this disease as possible targets for more efficacious targeted therapeutic intervention against this deadly cancer.
Online Content Methods, along with any additional Extended Data display items and Source Data, are available in the online version of the paper; references unique to these sections appear only in the online paper.
METHODS
Human lung tumour specimens
The institutional review board of the University of Cologne approved this study. We collected and analysed fresh-frozen tumour samples of 152 SCLC patients, which were provided by multiple collaborating institutions as fresh-frozen tissue specimen, frozen sections or as genomic DNA extracted from fresh-frozen material (Extended Data Fig. 1). Human tumour samples were obtained from patients under IRB-approved protocols following written informed consent.
The fresh-frozen SCLC samples were primary tumours diagnosed as stage I–IV tumours, and snap-frozen after tissue sampling. All tumour samples were pathologically assessed to have a purity of at least 60% and no extensive signs of necrosis. Additionally, these tumour samples were reviewed by at least two independent expert pathologists and the diagnosis of SCLC was histomorphologically confirmed by H&E staining and immunohistochemistry for chromogranin A, synaptophysin, CD56 and Ki67. Matching normal material was provided in the form of EDTA-anticoagulated blood or adjacent non-tumorigenic lung tissue (Supplementary Table 1). The matched normal tissue was confirmed to be free of tumour contaminants by pathological assessment. Furthermore, tumour and matching normal material were confirmed to be acquired from the same patient by short tandem repeat (STR) analysis conducted at the Institute of Legal Medicine at the University of Cologne (Germany), or confirmed by subsequent SNP 6.0 array and sequencing analyses. Patient material was stored at −80 °C.
Whole-genome sequencing was performed on 110 SCLC fresh-frozen tumour samples and matched normal material. Additionally, we analysed RNA-seq data of 81 SCLC primary tumours (Extended Data Fig. 1 and Supplementary Table 1), among which 20 cases were previously published2,43. Furthermore, we studied the copy-number alterations of a total of 142 fresh-frozen tumour specimen by Affymetrix SNP 6.0, among which 74 cases were described before44.
Clinical correlation studies were performed with the study cohort of 110 SCLC patients considering age of diagnosis, gender, tumour stage, surgery, treatment with chemotherapeutics, smoking status, smoking history and overall survival (Extended Data Figs 2 and 4 and Supplementary Table 1). The median follow-up time for this cohort of 110 SCLC patients was 69 months, and 31% of the patients were alive at the time of last follow-up (Extended Data Fig. 2a and Supplementary Table 1). Smoking status was available for 88% (n = 97) of the patients; 63% (n = 69) reported a smoking history amounting to a median of 45 pack-years. Patients with a known smoking history were further subcategorized to heavy smokers (>30 pack-years), average smokers (10–30 pack-years) and light/never smokers (<10 pack-years).
Primary findings on somatic mutations were further studied in a second independent cohort consisting of 112 SCLC cases. This validation cohort refers to the exome sequencing data of 28 fresh-frozen SCLC primary tumours and 9 SCLC cell lines2,3 which were re-analysed in this present study (Supplementary Table 7). Additionally, we performed targeted sequencing on 8 fresh-frozen and 67 formalin fixed paraffin embedded (FFPE) samples from SCLC patients (Supplementary Table 1).
Mouse SCLC models and tumour samples
Mice were maintained according to practices prescribed by the NIH (Bethesda, MD) at Stanford’s Research Animal Facility, accredited by the Association for the Assessment and Accreditation of Laboratory Animal Care (AAALAC). The Trp53;Rb1 double-knockout (DKO) and the Trp53;Rb1;Rbl2 triple-knockout (TKO) mouse models for SCLC have been previously described8,9. Mice were bred onto a mixed genetic background composed of C57BL/6, 129/SvJ and 129/SvOla. SCLC tumours were induced in 8-week-old mice by intratracheal instillation with 4 × 10⁷ plaque-forming units (p.f.u.) of adenovirus expressing the Cre recombinase (Ad-Cre, Baylor College of Medicine, Houston, TX).
Whole-genome and whole-exome sequencing was performed on 8 murine SCLC tumours isolated from DKO and TKO mice. Primary tumours and metastases were dissected, snap-frozen, and stored at −80 °C. The material was pathologically confirmed to have a tumour content of at least 90%. The respective tail tissue was similarly processed and served as a normal reference for 6 tumour samples (Supplementary Table 5). Average mutation rates were calculated for cases with tumour-normal pairs (n = 6).
SCLC tumours expressing the activated intracellular domain (ICD) of Notch1 (Notch1 ICD, N1ICD) and Notch2 (Notch2 ICD, N2ICD) were analysed in mouse models. Rosa26Lox-stop-Lox-Notch1ICD (LSL-N1ICD) or Rosa26Lox-stop-Lox-Notch2ICD (LSL-N2ICD) mice were obtained from Spyros Artavanis-Tsakonas and Exelixis. These mice are similar to recently published Rosa26+/LSL-Notch3ICD mice45. Rosa26+/LSL-N1ICD or Rosa26+/LSL-N2ICD mice were crossed with TKO mice. TKO or TKO;Rosa26+/LSL-NICD mice were infected with Ad-Cre at week 8 and their survival was monitored. The sample size was chosen based on our experience with these mouse models of cancer (a minimum of 3–5 mice usually ensures statistical significance if the phenotypes are robust). We used both males and females in these experiments, littermates served as controls. Tumour initiation was studied three months after Ad-Cre instillation. The lungs were fixed and tumour burden was quantified using ImageJ software. To control for the efficiency of deletion, we also crossed TKO mice to Rosa26mT/mG reporter mice46. For all tumour quantifications, the investigator was blinded to the genotypes when the H&E pictures were taken, and during the quantification of tumour number and area. No samples or animals were excluded from the analyses, and no randomization was performed.
DNA and RNA extractions
Nucleic acids were extracted from fresh-frozen tissue specimen which were processed to 15–30 sections each of 20 µm thickness at a cryostat maintaining a temperature of −20 °C (Leica). In the case of FFPE samples, 6–10 sections of 10 µm thickness were prepared.
DNA was extracted from fresh-frozen tissues, EDTA blood, or FFPE samples using the Gentra Puregene DNA extraction kit (Qiagen) following the protocol of the manufacturer. DNA isolates were hydrated in TE-buffer and confirmed to be of high molecular weight (>10 kb) by agarose gel electrophoresis. Genomic DNA from fresh-frozen samples with evident signs of degradation were excluded from further sequencing studies.
For RNA extractions, tissue sections were first lysed and homogenized with the Tissue Lyzer (Qiagen). Subsequent RNA extractions were performed with the Qiagen RNAeasy Mini Kit according to the instructions of the manufacturer. The RNA quality was assessed at the Bioanalyzer 2100 DNA Chip 7500 (Agilent Technologies) and samples with a RNA integrity number (RIN) of over 7 were further analysed by RNA-seq.
Next-generation sequencing
All sequencing reactions were performed on an Illumina HiSeq 2000 instrument (Illumina, San Diego, CA, USA).
Whole-genome sequencing
Whole-genome sequencing was performed with DNA extracted from fresh-frozen tumour and normal material. Short insert DNA libraries were prepared with the TruSeq DNA PCRfree sample preparation kit (Illumina) for paired-end sequencing at a minimum read length of 2 × 100 bp. Human DNA libraries were sequenced with the aim to obtain a coverage of minimum 30× for both tumour and matched normal. Murine DNA libraries of tumour and matched normal were both sequenced to a coverage of 25×.
Whole-exome sequencing
Whole-exome sequencing was performed on fresh-frozen tissue specimen from mice. The enrichment for the exome was performed with the SureSelectXT Mouse All Exon kit (Agilent) following the protocol of the manufacturer. The exon-enriched libraries were subjected to paired-end sequencing with a read-length of 2 × 100 bp. Both tumour and normal material was sequenced to a minimum coverage of 60×
RNA-sequencing
RNA-sequencing (RNA-seq) was performed with RNA extracted from fresh-frozen human tumour tissue samples. cDNA libraries were prepared from poly(A) selected RNA applying the Illumina TruSeq protocol for mRNA. The libraries were then sequenced with a 2 × 100 bp paired-end protocol to a minimum mean coverage of 30× of the annotated transcriptome.
Targeted enrichment sequencing
Targeted enrichment sequencing was performed on human FFPE and fresh-frozen tumour and normal specimen for the purpose of validating genome alterations in an independent cohort. The custom probe design was constructed with SureDesign (Agilent Technologies) enriching for the exons of 22 genes of interest. DNA libraries were prepared with the SureSelect XT reagent kit according to the manufacturer’s instructions (Agilent Technologies) and sequenced with the aim to obtain a coverage of at least 200×.
Dideoxy sequencing for validation of somatic alterations
If available, RNA-seq or exome sequencing was used to validate somatic mutations determined by genome sequencing. Alternatively, dideoxynucleotide chain termination sequencing (Sanger sequencing) was performed to validate mutations, genomic rearrangements, and chimaeric fusion transcripts. Primer pairs were designed to amplify the target region encompassing the somatic alteration. The PCR reactions were performed either with genomic DNA, whole-genome amplified DNA or cDNA. The amplified products were subjected to Sanger sequencing and the respective electropherogram was analysed with Geneious (http://www.geneious.com).
Copy number analysis by Affymetrix SNP 6.0 arrays
Human DNA extracted from fresh-frozen tumour specimen was hybridized to Affymetrix Genome-Wide Human SNP array 6.0 following the manufacturer’s instructions. The signal intensities were processed to analyse for chromosomal gene copy number data. Raw copy number signals and segmented copy number data were computed following the procedure described previously24.
The raw, unsegmented copy number signals were used to analyse for significant copy number alterations applying the method CGARS47. Significant amplifications were determined with the upper quantiles 0.25, 0.15, 0.1, and 0.05; deletions were computed in reference to the 0.25 lower quantile. The significance threshold was set at a _q_-value of 0.05 (Supplementary Table 8).
Data processing
The raw sequencing reads of human and mouse samples acquired from whole-genome, whole-exome or targeted enrichment sequencing were aligned to the respective human (NCBI37/hg19) or mouse reference genome (NCBI37/mm9). The alignment was performed with the BWA aligner48 (version 0.6.1-r104). Concordant read-pairs were identified as potential PCR duplicates and were subsequently masked in the alignment file. The quality of the sequencing data was determined and is summarized in Supplementary Table 2.
The whole-genome sequencing data of human samples was analysed for purity and ploidy with methods previously described2 (Extended Data Fig. 3a and Supplementary Table 2).
Somatic mutations and copy number alterations were determined with our in-house analysis pipeline2,49. The calling of somatic mutations in human samples was further improved by filtering the identified variant against the sequencing data of more than 500 normal samples (including exome or genome sequencing data). Additionally, an estimation of human DNA library contamination was implemented to enhance sensitivity and specificity of mutation calling.
Analysis of significantly mutated and biologically relevant genes
The significance of recurrently mutated genes was analysed for the whole-genome sequencing data set of 110 human SCLC samples (Extended Data Fig. 1a).
As previously described2, the analysis first estimated the background mutation rate for each gene and corrected for its expression by referring to the RNA-seq data of 81 human primary SCLC tumour specimen analysed in the present study. The analysis included those genes which had FPKM values (fragments per kilobase of exon per million fragments mapped) of over 1 in at least 50 samples. Following corrections for the occurrence of synonymous mutations, significantly mutated genes were determined with _q_-values of < 0.05 (Fig. 1a, Extended Data Fig. 1a (filter I) and Supplementary Table 6).
Mutations that cluster within a gene are defined as a mutational hotspot similar to our previously described method2. Here we used an analytical derivation of the test statistics, rather than resampling. To this end, the mutated positions are rescaled to lie within zero and one (using the protein length). Under the null hypothesis of having no particular mutational hotspot, the rescaled mutated positions are uniformly distributed between zero and one, thus its expected value is 0.5. We therefore chose the final statistics as sum over the modulus of the rescaled position minus 0.5. This allows that the distribution under the null hypothesis can analytically be calculated; hence, also the P values. The analysis was calculated for genes that were significantly mutated in at least 5% of the samples with P < 0.05 (Fig. 1a, Extended Data Fig. 1a (filter II) and Supplementary Table 6). In order to further filter for the genes of relevance, subsequent analysis considered those genes recurrently mutated in more than 8% (_n_ > 8) samples. The called genes were scored for their relevance by either analysing recurrent translocations affecting these genes (Supplementary Table 4) or by comparison with the mouse SCLC mutation data to identify alterations in common genes (Supplementary Table 5).
Additionally, recurrent mutations were scored for the accumulation of clearly damaging mutations in which splice site, frameshift and nonsense mutations were considered as damaging mutations. Here, we restricted the aforementioned significance analysis only to this class of mutations (by restricting the background mutation rate only to damaging mutations) and determined significance at P < 0.01 (Fig. 1a, Extended Data Fig. 1a (filter III) and Supplementary Table 6).
Genetic alterations were further scored for their relevance by comparison with genes that were functionally characterized in genetically engineered mouse models (GEMM) for SCLC9,10, or by comparing somatic mutations in SCLC with mutations in other cancer types reported in the Cancer Gene Census14 and in COSMIC (catalogue of somatic mutations in cancer)15 (Fig. 1a, Extended Data Fig. 1a (filter IV and V) and Supplementary Table 6). Additionally, the sequencing data of mouse SCLC specimen was used to identify alterations in common genes.
Analysis of subclonal architecture
To determine the subclonal architecture from genome sequencing data, we first computed the cancer cell fraction (CCF; that is, the fraction of cancer cells carrying a particular mutation) of each called somatic point mutation. To this end, we first estimated the tumour purity, absolute copy numbers, and subclonal copy number changes using our previously described method2 and computed for each mutation the expected allelic fraction under clonality assumption. The quotient between the observed allelic fraction of a mutation with its corresponding expected allelic fraction then yields the CCF. To assess the clonal and subclonal populations we next identified distinct clusters in the CCF profile and assigned each mutation to the cluster of highest probability. In order to provide a measure for the subclonal architecture, we proposed the following score:
Subclonality score=∑i=1ncϕimi∑i=0ncϕimi
where i = 0 represents the clonal population, i = 1,…,nc the subclonal populations; φ_i_ is the CCF of each population (thus, φ0 ≈ 1), and mi is the number of mutations assigned to cluster i. This subclonality score can be interpreted as the probability that a randomly selected mutation present in a single cancer cell is subclonal throughout the entire tumour.
As a low sequencing depth limits the robust identification of subclonal populations, we computed the genome-wide average contribution of a single mutated read to the CCF. For a given tumour purity p, average ploidy π, and mean coverage c, this measure is given by:
Average increase of CCF per read=2(1−p)+pπpc
The smaller the average increase of CCF per read, the more accurately the subclonality score can be determined since more subclonal mutations can be called from the sequencing data. In this study, the most limiting factor for assessing the subclonal diversity is the relatively low sequencing depth (35× on average). We therefore used this measure to select the samples that are suitable for a reliable calculation of the subclonality score. To this end, we systematically scanned from the average increase of CCF per read form large to small values and detected the point of the most prominent change in the distribution of the subclonality score (Supplementary Table 2).
Analysis of genomic breakpoints
Genomic rearrangements were reconstructed from the whole-genome sequencing data of 110 human SCLC samples following the procedure as previously described2,49. The genomic rearrangements called from each tumour sample were further filtered against a library of 110 normal genomes to thus minimize the detection of false-positive rearrangements. Genomic breakpoints of SCLC candidate driver genes are listed in Supplementary Table 4.
The genomic breakpoints of all samples were mapped to their chromosomal locations and recurrent breakpoints clustering within the range of 100 kb were identified with a similar approach described previously29 (Supplementary Table 14).
Processing and analysis of RNA-seq data
RNA-seq data was processed as previously described2,49 to detect chimaeric transcripts and to determine the transcriptional abundance of annotated transcript variants. In brief, paired-end RNA-seq reads were mapped to the human reference genome (NCBI37/hg19) using GSNAP. Potential chimaeric fusion transcripts were identified by discordant read pairs and by individual reads mapping to distinct chromosomal locations. The sequence context of rearranged transcripts was reconstructed around the identified breakpoint and the assembled fusion transcript was then aligned to the human reference genome to determine the genes involved in the fusion.
Cufflinks was used to determine the expression levels of annotated transcripts referring to unique paired-end reads which align within the expected mapping distance. The expression is represented as FPKM values (Supplementary Table 10).
Transcript splicing analysis
RNA-seq data was used to analyse for alternative splicing events of TP53, RB1 and TP73 caused by exon skipping or intron retention (Supplementary Table 11). The paired-end reads were mapped to the reference genome (hg19) using STAR mapper. In reference to the annotation of exon junctions provided from UCSC genes and RefSeq the following parameters were applied: ref 1, options:–alignIntronMin 20,–alignIntronMax 500000,–outFilterMismatchNmax 10, and–chimSegmentMin 10. The coordinates of reads potentially crossing exon boundaries were derived from the respective “SJ.out.tab” file and compared to the reference annotation. Subsequently, junction read counts were assigned to all transcripts containing the respective exon combination. If the exon combination is novel, read counts were assigned to those transcripts sharing one of the exons contributing to the novel junction. For subsequent analyses the transcript with the highest number of junction read counts was used as a reference. Additionally, for exon combinations unique to alternative transcripts a representative transcript was selected based on total read counts. The read counts of each exon junction were normalized to the reads per kilobase per million mapped reads (RPKM) per sample. These expression values were further normalized per gene by dividing by the average expression of the exons of the reference transcript. Potentially novel exon combinations were rejected if the average expression of the reference transcript was <2 or if their expression were <10% of the reference transcript expression.
Differential expression for outlier studies
Differential gene expression analysis was performed to compare the transcriptional profile of the two chromothripsis cases (S02297 and S02353) with other non-chromothripsis SCLC cases and to thus identify outliers in the expression profile. The expression was analysed by computing _z_-scores for all samples referring to the RPKM values and using the R function ‘scale’; RPKM values smaller than 3 were set to 0. In order to prioritize for genes differentially expressed in the two samples S02297 and S02353, genes were ranked by their respective _z_-scores. Statistical testing was performed for genes on Chr 3 and Chr 11, respectively. The P values were then combined from the two samples using Fisher’s method and corrected for multiple hypothesis testing by using the Benjamini–Hochberg approach. Differentially expressed genes with a P < 0.05 and _q_-values <0.01 are provided in Supplementary Table 13.
Unsupervised expression clustering
Unsupervised clustering was performed with RNA-seq data of 69 SCLC cases for which matching genome sequencing data was available (Fig. 4a and Extended Data Fig. 9a). As expression values are approximately following log-normal distribution, we transformed raw FPKM of each transcript by log2(1 + FPKM). The resulting expression scores were then searched for a high and low expression characteristic over the samples. To this end, expression scores of each transcript were divided into two states using _k_-means clustering. To prevent an accumulation of artificial signals, only transcripts with at least 6 samples in each state and having a state-averaged fold change larger than 3 are considered for further analysis. A _t_-test is then computed between the two states of the remaining transcripts and corrected for multiple hypothesis testing using the false discovery rate framework. Next, transcripts having a _q_-value smaller than 0.01 were selected. For genes with multiple transcript variants, the transcript with the smallest _q_-value was chosen as representative transcript. Then, invariant genes were removed (having a standard deviation across all samples <2). To improve clustering, only genes that share a similar pattern of the two states in at least 6 other genes are finally selected (using a Fisher’s exact test with a significance threshold of 10−6). Using the determined list of transcripts/genes, hierarchical clustering (Euclidean distance, complete linkage) was performed on the raw expression scores.
IRS2 amplification FISH assay
A fluorescence in situ hybridization (FISH) assay was used to detect and confirm IRS2 amplifications at the chromosomal level. We performed a signal detection approach, with two probes on chromosome 13: the reference probe is located on the centromeric region of chromosome 13 (Empire Genomics, Art.Nr.: CHR13-10-GR) and was labelled with green 5-fluorescein dUTP to produce a green signal; the target probe is located on the IRS2 locus spanning 13q33.3–34 and was labelled with biotin to produce a red signal using the CTD-2083015 BAC clone (Life Technologies, CA, USA). As previously described24, slides of FFPE and fresh-frozen samples of tumour tissues were prepared, stained and analysed at a fluorescence microscope (Zeiss, Jena, Germany) with a 63× oil immersion objective. A non-amplified nucleus showed one red target signal for every corresponding green reference signal, with a red/green ratio of 1:1 (Extended Data Fig. 5e). High-level amplifications were determined for at least 10 red signals. In some cases the red signals were observed as clusters in the cells. At least 100 nuclei per case were evaluated.
Immunohistochemistry
Immunohistochemistry was performed on human tumour FFPE samples to analyse for the protein expression of Rb, cyclin D1, p53, p14 (ARF), and p16. The staining was performed with the BenchMark XT automated immunohistochemistry slide staining system (Roche). The following antibodies and conditions were applied: Rb (C-15) rabbit polyclonal (Santa Cruz; FFPE retrieving conditions: 60 min at pH 6.0; dilution: 1:500; incubation: 60 min, 37 °C); Cyclin D1 clone SP4 rabbit monoclonal (Microm France; FFPE retrieving conditions: 90 min at pH 8.4; dilution: 1:200; incubation: 60 min, 37 °C); p53 clone DO7 mouse monoclonal (Dako; FFPE retrieving conditions: 60 min at pH 8.4; dilution: 1:25; incubation: 60 min, 37 °C); p14ARF clone 4C6/4 mouse monoclonal (Cell Signaling; FFPE retrieving conditions: 60 min, water-bath 98 °C at pH 6.0; manual immunohistochemistry staining with Novolink Max polymer detection system (Leica); dilution: 1:4,000; incubation: overnight, 4 °C); p16 INK4 Ab-7 clone PO7 mouse monoclonal (Neomarkers; FFPE retrieving conditions: 60 min at pH 8.4; dilution: 1:800; incubation: 60 min, room temperature).
For immunohistochemistry on mouse tumour FFPE samples, sections were permeabilized for antigen retrieval by microwaving in a citrate-based antigen unmasking solution (Vector Laboratories). The following antibodies were used: GFP (Invitrogen; A11122; dilution: 1:400), RFP/Tomato (Rockland Immunochemicals; 600-401-379; dilution: 1:500), Notch2 (Cell Signaling; 5732; dilution: 1:200), Hes1 (Cell Signaling; 11988; dilution: 1:200), Ascl1 (BD Biosciences; 556604; dilution: 1:200) and Synaptophysin (Neuromics; MO20000; dilution: 1:200). Sections were developed with DAB (Vector Labs) and counterstained with haematoxylin.
Cell lines, tissue culture and transfections
Mouse (KP1) and human (NJH29, NCI-H82 and NCI-H187) SCLC cell lines were grown in RPMI-1640 media supplemented with 10% bovine growth serum (BGS) (Fisher Scientific) and penicillin-streptomycin-glutamine (Gibco), as described before50. KP1, NJH29 were generated at Stanford. NCI-H82 and NCI-H187 were purchased from ATCC. These cells grow as suspension spheres or aggregates in culture. All cell lines were maintained at 37 °C in a humidified chamber with 5% CO2. All cell lines tested negative for mycoplasma infection. For transient expression of Notch ICD, cells were trypsinized and transfected with either MigR1-IRES-GFP (Ctrl) or MigR1-Notch1-ICD-IRES-GFP (NICD) using Lipofectamine 2000 (Life Technologies). The plasmids were gifts from W.S. Pear (University of Pennsylvania, Philadelphia). Then 48 h after transfection, cells were trypsinized and resuspended in phosphate-buffered saline (PBS) containing 10% BGS and 1 µg ml−1 7-aminoactinomycin D (Life Technologies) that labels dead cells. Live GFP+ cells were then sorted for subsequent experiments using a BD FACSAria fluorescence-activated cell sorting (FACS) machine.
Gene expression and microarray analysis
Gene expression and microarray analyses were performed with the mouse cell line KP1 transiently transfected with MigR1-IRES-GFP (Ctrl) or MigR1-Notch1-ICD-IRES-GFP (N1ICD).
Then 1 × 10⁵ GFP+ cells were sorted and the RNA isolated using the AllPrep DNA/RNA micro kit (Qiagen). RNA quality assessment using the 2100 Bioanalyzer (Agilent) as well as the subsequent cDNA preparation steps for microarray analysis were performed at the Stanford Protein and Nucleic Acid (PAN) facility using the GeneChip Mouse Gene 2.0 ST Array (Affymetrix). For gene expression analysis, the Robust Multichip Average (RMA) Express 1.0.4 program was used for background adjustment and quantile RMA normalization of the 41,345 probe sets encoding mouse genome transcripts. Linear models for microarray data (LIMMA) was used to compare Ctrl or N1ICD samples on RMA normalized signal intensities. Only genes with an adjusted P value of 0.05 or less were considered as significantly differentially expressed. A total of 769 probes accounting for 760 genes were significant, and the expression levels of these genes were represented as a heatmap using the heatmap.2 function in R. The analysis was performed in triplicates. A list of significant genes is provided in Supplementary Table 15.
MTT cell viability assay
Sorted GFP+ cells were seeded at 1 × 10⁴ per well in 96-well plates. The MTT reagents (Roche) were added on days 0, 2, 4, 6 and 8 for mouse SCLC cell lines or on days 0, 2, 4 and 6 for the human SCLC cell line NJH29. The absorbance wavelength was 570 nm with a reference wavelength of 650 nm.
EdU incorporation assay
Transfected cells were treated with 10 µM EdU (5-ethynyl-2′-deoxyuridine) (Life Technologies) for 3 h before trypsinization for FACS. 1 × 10⁵ live, GFP+ cells were sorted and labelled with EdU using the Click-iT EdU Pacific Blue flow cytometry assay kit (Life Technologies). Cells were then run through the BD FACSAria to analyse for per cent EdU incorporation.
Data reporting
No statistical methods were used to predetermine sample size.
Extended Data
Extended Data Figure 1. Genomic analyses in SCLC tumours.
a, Schematic detailing the genomic study and number of samples as well as various steps of analyses for the identification of candidate genes in SCLC. b, Illustration of the number of samples analysed in this study.
Extended Data Figure 2. Clinical molecular-correlation analyses.
a, Survival analysis of SCLC patients based on clinical stage and treatment options (surgery and/or chemotherapy). Statistical significance was determined by log-rank test. b, Analyses of clinical stage and smoking status and the respective effect on number and type of mutations, as well as mutational subclonality in tumours. Statistical significance was determined by Kruskal–Wallis analysis.
Extended Data Figure 3. Genomic characterization of SCLC tumours.
a, Purity and ploidy determined in SCLC tumours by whole-genome sequencing presented as dot density plots showing median and the interquartile range (IQR) b, Subclonal architecture of SCLC in comparison to lung adenocarcinoma (AD). Whole-genome sequencing data of SCLC and of adenocarcinoma (n = 15)11 was analysed for the presence of subclonal populations using clustering of the derived cancer cell fraction (CCF) of all single nucleotide mutations. To compare the emerging subclonal structure, we derived a subclonality score that takes into account the CCF of each subpopulation as well as its mutational burden (see Methods). In order to prevent the low sequencing coverage (35 × for SCLC and 63 × for AD) from causing a systematic underrepresentation of the subclonal diversity in the mutation calls, we computed the contribution of a single read to the CCF on genome-wide average. After systematically determining a threshold within the average increase of CCF per read values (see Methods for details), we determined the group of samples for which a reliable estimation of the subclonality score is not possible (grey area). The subclonality scores of the remaining SCLC cases were then compared to those of the adenocarcinoma cases (P = 0.000232; Mann–Whitney test). c, Schematic representation of candidate genes with significant clustering of mutations in respective protein domains. Somatic mutations and genomic translocations are mapped to the respective protein regions. Hotspot mutations are highlighted in red. d, e, Genomic alterations in the RB1 family proteins p107 (RBL1) and p130 (RBL2) (d), and in KIT and PIK3CA (e). Somatic mutations in therapeutic target genes are listed and mapped to the protein domains of KIT and PIK3CA. Mutations with potential therapeutic implications are highlighted in red.
Extended Data Figure 4. Clinical molecular-correlations of significantly mutated genes.
a, Survival analysis of SCLC patients based on the status of CREBBP/EP300, TP73 or NOTCH alterations. Statistical significance was determined by log-rank test. b, Analysis of CREBBP/EP300, TP73 and NOTCH alterations and their effect on clinical and genetic parameters. Statistical significance was analysed by multinomial logistic regression.
Extended Data Figure 5. Significant somatic copy number alterations in SCLC.
a, Deletions of the chromosomal arm 3p point to the 3p14 (FHIT) and 3p12 (ROBO1) locus. b, Expression analyses of genes encoded on the 3p14.3–3p14.2 and 3p12.2–3p12.2 locus. Histogram displaying the expression of samples with focal deletions (blue) and samples without any copy number alterations (white). Mean and standard error of the mean is plotted for each gene in each group. Significant differences were determined by Mann–Whitney test; *P < 0.05; **P < 0.01. c, d, Focal deletions of the CDKN2A (c) and focal amplifications of IRS2 (d) were found on chromosome 9 and 13, respectively. The copy number (CN) states were computed from SNP array (SNP 6.0) and from whole-genome sequencing (WGS) data. The samples are sorted according to their amplitude of deletions or amplifications. e, Amplifications of IRS2 were determined by FISH analysis. IRS amplifications were quantified based on the ratio of red signals (_IRS2_-specific probe) to green signals (centromere probe for chromosome 13). Lymphocyte spreads and SCLC tumours without detectable IRS2 amplifications served as negative controls. Scale bar, 100 µm.
Extended Data Figure 6. TP53 and RB1 alterations in SCLC.
a, Distribution of somatic mutations in TP53 and RB1 according to the colour panel provided. b, c, Complex genomic rearrangements in RB1 showing homozygous deletions of exon 1 (b) or inversions within the RB1 gene (c). d, e, Annotated silent or missense mutations in RB1 occur at intron-exon junctions resulting in alternative splicing, intron retention (d) or exon skipping events (e). The coverage at the respective exon junctions is quantified as RPKM values. Sample S02194 is not holding any mutations at intron–exon junctions and is displayed as an example for unaltered splicing of RB1.
Extended Data Figure 7. Chromothripsis in human SCLC.
a, Circos plot of the chromothripsis sample S02353 showing intra- and interchromosomal rearrangements between chromosome 3 and 11. The integral copy number state (iCN) is plotted as a heatmap and assigned to the respective chromosomal regions. The chromosomal context of CCND1 (on chromosome 11) is highlighted. b, Circos plots displaying fusion transcripts identified in the SCLC chromothripsis cases (Supplementary Table 12) are represented as blue (S02297) or red (S02353) lines for genes located on chromosome 3 and 11. c, Immunohistochemistry staining for p53, p14 (ARF) and p16 on FFPE material of the chromothripsis sample S02297. Original magnification, ×400.
Extended Data Figure 8. Recurrent genomic translocations in SCLC.
a, Recurrent genomic translocations (n = 14) affecting chromosome 22 are illustrated as a Circos plot highlighting the respective rearrangements as red connecting lines. b, Breakpoints in chromosome 22 map to intron 1 of TTC28 and cluster downstream of the LINE1 (L1Hs) retrotransposon. Each arrow indicates the sample and the respective chromosomal position the segment translocates to. c, Schematic representation of the TP73 locus (hg19) describing complex intrachromosomal rearrangements of TP73 identified for S02397 and S02243. Recurrent somatic mutations identified in Fig. 1a are mapped to the respective exons. d, Validation of somatic TP73 translocations. Genomic regions involved in the TP73 rearrangements were amplified in matched normal (N) and tumour (T) samples. The expected band size is indicated in brackets. The respective PCR products were subjected to Sanger sequencing to confirm the genomic breakpoint. e, Copy-number state of the TP73 gene in samples involved in genomic translocations.
Extended Data Figure 9. Transcriptome profile of human SCLC tumours.
a, Unsupervised hierarchical clustering of transcriptome sequencing data of 69 SCLC specimens as described in Fig. 4a. Each sample is annotated for the genomic alterations described in Fig. 1. Black filled boxes describe the presence of a genomic event. b, Expression values of CHGA, GRP, ASCL1 and DLK1 (FPKM) are represented as dot density plots for the subgroups identified in (a). Red lines highlight the median value for each group. c, Expression values of the neuroendocrine markers SYP (synaptophysin) and NCAM1 (CD56) plotted as scatter plots for all SCLC samples. Green lines indicate thresholds for no expression (FPKM<1).
Extended Data Figure 10. Notch is a tumour suppressor in SCLC regulating neuroendocrine differentiation.
a, Somatic mutations identified in NOTCH3 and NOTCH4 are mapped to the protein domains. Damaging mutations are highlighted in red. Mutations found in murine SCLC tumours are highlighted in blue. b, Quantification of tumour lesions and per cent tumour area to lung in TKO (n = 5) and TKO;N1ICD (n = 4) mice 3 months after Ad-Cre instillation. Statistical significance was determined by two-tailed unpaired Student’s _t_-test. c, Representative immunohistochemistry for GFP or tdTomato in lungs from TKO;Rosa26mT/mG mice approximately 6 months after tumour induction. Left scale bar, 500 µm; right and middle: scale bar, 50 µm. d, Representative immunostaining for Notch2 in lungs from TKO;Rosa26N2ICD mice approximately 6 months after tumour induction. Left scale bar, 500 µm; right scale bar, 50 µm. e, Quantification of the per cent recombination at the Rosa26 locus in TKO;Rosa26mT/mG (n = 6) and TKO;Rosa26N2ICD mice (n = 10; two-tailed unpaired Student’s _t_-test). f, Cell viability assay of the human SCLC cell line NJH29 transfected with a N1ICD (Notch1) expression plasmid or empty vector control (Ctrl) (3 independent biological replicas with 3 technical replicas each). Fold growth was normalized to day 0; representative images were taken on day 6. Scale bar, 50 µm. g, Immunohistochemistry staining in FFPE embedded tissues of TKO and TKO;N2ICD mice. Scale bar, 50 µm. h, Quantitative RT–PCR validation of Notch1 induction and the expression of common Notch target genes after N1ICD transfection in murine SCLC cells (three biological replicas; two-tailed paired Student’s _t_-test). i, Mouse SCLC cells transfected with control or N1ICD (Notch1) were analysed 48 h later by gene expression microarrays. Gene Set Enrichment Analysis (GSEA) was performed on these data; selected significant gene sets are displayed. j, k, EdU analysis of mouse (j) and human (k) SCLC cells (three independent biological replicas with three technical replicas each; two-tailed paired Student’s _t_-test). *P < 0.05; **P < 0.01; ***P < 0.001. Data are represented as mean ± s.d.
Supplementary Material
Tables
Acknowledgments
We are grateful to all the patients who contributed their tumour specimens. We thank the computing center of the University of Cologne (RRZK) for providing the CPU time on the DFG-funded supercomputer ‘CHEOPS’, as well as for the support. We thank S. Artavanis-Tsakonas and S. Fre for the gift of the mice with inducible NICD expression. We thank C. Nguyen, J. Berg, J. Heuckmann, F. Malchers, C. Lovely and A. Bernschein for scientific discussions and advice. We thank Genentech/gRED for providing raw sequencing data from a previously published study3. Some tumors in these studies were provided by the LungBiobank Heidelberg, member of the NCT-Tissue bank, the biomaterial bank Heidelberg and the biobank platform of the German Center for Lung Research, Heidelberg, Germany. This work was supported by the German Cancer Aid (Deutsche Krebshilfe) as part of the small cell lung cancer genome sequencing consortium (grant ID: 109679 to R.K.T., M.P., R.B., P.N., M.V. and S.A.H.). Further support was provided by the Korea Research Foundation (KRF 2011-0030105; grant to S.J.J.). Additional funding was provided by the NIH (5R01CA114102-08 to J.S.), the German Ministry of Science and Education (BMBF) as part of the NGFNplus program (grant 01GS08101 to R.K.T., J.W. and P.N.) and as part of the e:Med program (grant no. 01ZX1303A to R.K.T., J.W., C.R., R.B. and M.P. and grant no. 01ZX1406 to M.P.), by the Deutsche Forschungsgemeinschaft (DFG; through TH1386/3-1 to R.K.T and KFO-286 to P.N.), by the German federal state North Rhine Westphalia (NRW), by the European Union (European Regional Development Fund: Investing In Your Future) as part of the PerMed NRW initiative (grant 005-1111-0025 to R.K.T., J.W. and R.B.), by SFB832 (TP6 to R.K.T., TP5 to L.C.H.), by the Deutsche Krebshilfe as part of the Oncology Centers of Excellence funding program (to R.B., R.K.T. and M.S.), by the EU-Framework program CURELUNG (HEALTH-F2-2010-258677 to R.K.T., J.W., J.K.F., L.R., M.S.C. and E.B.), by Stand Up To Cancer—American Association of Cancer Research Innovative Research Grant (SU2C-AACR-IR60109 to R.K.T.), by the German Consortium for Translational Cancer Research (DKTK) Joint Funding program, by the National Cancer Center Research and Development Fund (NCC Biobank: 23A-1, to T.K., J.Y. and R.I.), by the Italian Ministry of Health (Ricerca Corrente RC1303LO57 and GR program 2010-2316264 to L.A.M.), by the Roy Castle Lung Cancer Foundation UK (to J.K.F.), by the AIRC/MGAF grant 12983 (to L.A.M.) and by A*STAR in Singapore (scholarship to J.S.L.). J.S. is the Harriet and Mary Zelencik Scientist in Children’s Cancer and Blood Diseases.
Footnotes
Supplementary Information is available in the online version of the paper.
Author Contributions J.G., J.S.L., M.P., J.S. and R.K.T. conceived the project, analysed and interpreted the data, and wrote the manuscript. J.G., J.S.L., J.S., F.L., R.M., S.P., D.E., B.Pü, M.S.W., J.O.K., J.A., C.B., M.B. and P.S. designed experiments. J.G., J.S.L., I.D., C.M., A.T., R.M., S.-M.C., D.K., D.E., I.V., D.S., B.Pi, P.S., C.B., P.M.S. and M.Bog performed experiments. J.G., M.P., J.S.L., S.A.H., M.V., M.S.W., J.O.K., Y.C., X.L., D.V., M.W., N.H. and M.Bos performed data analysis. E.B., W.D.T., R.B., L.H., L.O., S.P., S.J.J. and G.K. performed pathology review. E.B., W.D.T., L.O., A.N.K., Y.Y. and V.T. conducted further immunohistochemistry studies. F.L., L.F.-C., G.B., S.M., D.S., V.A., U.L., T.Z., S.A., M.H., J.W., P.N. and C.R. helped with logistics. S.J.J., N.S.J., K.-S.P., D.Y., J.Y., T.K., R.I., K.T., M.N., T.M., H.H., P.A.S., I.P., Y.C., A.S., C.-M.C., Y.-H.K., P.P.M., Y.Z., D.J., M.K., G.M.W., P.A.R., B.S., I.K., M.L., L.A.M, A.l.T., J.K.F., M.J., J.Kn., E.C.-V., L.R., U.P., O.-T.B., M.L.-I., E.T., J.Kö., M.Sc, J.B., M.Sa, M.S.-C., H.B.S., Y.Y., S.P., L.H., R.B. and E.B. contributed with murine and human tissue samples.
Affymetrix SNP 6.0, whole-genome, and transcriptome sequencing on human specimen have been deposited at the European Genome-phenome Archive under the accession code EGAS00001000925. Whole-exome and whole-genome sequencing data of murine SCLC tumors can be accessed through (http://www.translational-genomics.uni-koeln.de/scientific-resources/). Microarray data on mouse cell lines is accessible through Gene Expression Omnibus (GEO) accession number GSE69091.
The authors declare competing financial interests: details are available in the online version of the paper. Readers are welcome to comment on the online version of the paper.
References
- 1.van Meerbeeck JP, Fennell DA, De Ruysscher DK. Small-cell lung cancer. Lancet. 2011;378:1741–1755. doi: 10.1016/S0140-6736(11)60165-7. [DOI] [PubMed] [Google Scholar]
- 2.Peifer M, et al. Integrative genome analyses identify key somatic driver mutations of small-cell lung cancer. Nature Genet. 2012;44:1104–1110. doi: 10.1038/ng.2396. [DOI] [PMC free article] [PubMed] [Google Scholar]
- 3.Rudin CM, et al. Comprehensive genomic analysis identifies SOX2 as a frequently amplified gene in small-cell lung cancer. Nature Genet. 2012;44:1111–1116. doi: 10.1038/ng.2405. [DOI] [PMC free article] [PubMed] [Google Scholar]
- 4.Takahashi T, et al. p53: a frequent target for genetic abnormalities in lung cancer. Science. 1989;246:491–494. doi: 10.1126/science.2554494. [DOI] [PubMed] [Google Scholar]
- 5.Wistuba II, Gazdar AF, Minna JD. Molecular genetics of small cell lung carcinoma. Semin. Oncol. 2001;28:3–13. [PubMed] [Google Scholar]
- 6.Horowitz JM, et al. Frequent inactivation of the retinoblastoma anti-oncogene is restricted to a subset of human tumor cells. Proc. Natl Acad. Sci. USA. 1990;87:2775–2779. doi: 10.1073/pnas.87.7.2775. [DOI] [PMC free article] [PubMed] [Google Scholar]
- 7.Mori N, et al. Variable mutations of the RB gene in small-cell lung carcinoma. Oncogene. 1990;5:1713–1717. [PubMed] [Google Scholar]
- 8.Meuwissen R, et al. Induction of small cell lung cancer by somatic inactivation of both Trp53 and Rb1 in a conditional mouse model. Cancer Cell. 2003;4:181–189. doi: 10.1016/s1535-6108(03)00220-4. [DOI] [PubMed] [Google Scholar]
- 9.Schaffer BE, et al. Loss of p130 accelerates tumor development in a mouse model for human small-cell lung carcinoma. Cancer Res. 2010;70:3877–3883. doi: 10.1158/0008-5472.CAN-09-4228. [DOI] [PMC free article] [PubMed] [Google Scholar]
- 10.McFadden DG, et al. Genetic and clonal dissection of murine small cell lung carcinoma progression by genome sequencing. Cell. 2014;156:1298–1311. doi: 10.1016/j.cell.2014.02.031. [DOI] [PMC free article] [PubMed] [Google Scholar]
- 11.Imielinski M, et al. Mapping the hallmarks of lung adenocarcinoma with massively parallel sequencing. Cell. 2012;150:1107–1120. doi: 10.1016/j.cell.2012.08.029. [DOI] [PMC free article] [PubMed] [Google Scholar]
- 12.Zhang J, et al. Intratumor heterogeneity in localized lung adenocarcinomas delineated by multiregion sequencing. Science. 2014;346:256–259. doi: 10.1126/science.1256930. [DOI] [PMC free article] [PubMed] [Google Scholar]
- 13.de Bruin EC, et al. Spatial and temporal diversity in genomic instability processes defines lung cancer evolution. Science. 2014;346:251–256. doi: 10.1126/science.1253462. [DOI] [PMC free article] [PubMed] [Google Scholar]
- 14.Futreal PA, et al. A census of human cancer genes. Nature Rev. Cancer. 2004;4:177–183. doi: 10.1038/nrc1299. [DOI] [PMC free article] [PubMed] [Google Scholar]
- 15.Forbes SA, et al. COSMIC: exploring the world’s knowledge of somatic mutations in human cancer. Nucleic Acids Res. 2015;43:D805–D811. doi: 10.1093/nar/gku1075. [DOI] [PMC free article] [PubMed] [Google Scholar]
- 16.Lawrence MS, et al. Mutational heterogeneity in cancer and the search for new cancer-associated genes. Nature. 2013;499:214–218. doi: 10.1038/nature12213. [DOI] [PMC free article] [PubMed] [Google Scholar]
- 17.Yokomizo A, et al. PTEN/MMAC1 mutations identified in small cell, but not in non-small cell lung cancers. Oncogene. 1998;17:475–479. doi: 10.1038/sj.onc.1201956. [DOI] [PubMed] [Google Scholar]
- 18.Holderfield M, Deuker MM, McCormick F, McMahon M. Targeting RAF kinases for cancer therapy: BRAF-mutated melanoma and beyond. Nature Rev. Cancer. 2014;14:455–467. doi: 10.1038/nrc3760. [DOI] [PMC free article] [PubMed] [Google Scholar]
- 19.Hibi K, et al. Coexpression of the stem cell factor and the c-kit genes in small-cell lung cancer. Oncogene. 1991;6:2291–2296. [PubMed] [Google Scholar]
- 20.Hirota S, et al. Gain-of-function mutations of c-kit in human gastrointestinal stromal tumors. Science. 1998;279:577–580. doi: 10.1126/science.279.5350.577. [DOI] [PubMed] [Google Scholar]
- 21.Shibata T, Kokubu A, Tsuta K, Hirohashi S. Oncogenic mutation of PIK3CA in small cell lung carcinoma: a potential therapeutic target pathway for chemotherapy-resistant lung cancer. Cancer Lett. 2009;283:203–211. doi: 10.1016/j.canlet.2009.03.038. [DOI] [PubMed] [Google Scholar]
- 22.Angeloni D, et al. Analysis of a new homozygous deletion in the tumor suppressor region at 3p12.3 reveals two novel intronic noncoding RNA genes. Genes Chromosom. Cancer. 2006;45:676–691. doi: 10.1002/gcc.20332. [DOI] [PubMed] [Google Scholar]
- 23.Kovatich A, et al. Molecular alterations to human chromosome 3p loci in neuroendocrine lung tumors. Cancer. 1998;83:1109–1117. doi: 10.1002/(sici)1097-0142(19980915)83:6<1109::aid-cncr9>3.0.co;2-2. [DOI] [PubMed] [Google Scholar]
- 24.Weiss J, et al. Frequent and focal FGFR1 amplification associates with therapeutically tractable FGFR1 dependency in squamous cell lung cancer. Sci. Transl. Med. 2010;2:62ra93. doi: 10.1126/scitranslmed.3001451. [DOI] [PMC free article] [PubMed] [Google Scholar]
- 25.Korbel JO, Campbell PJ. Criteria for inference of chromothripsis in cancer genomes. Cell. 2013;152:1226–1236. doi: 10.1016/j.cell.2013.02.023. [DOI] [PubMed] [Google Scholar]
- 26.Knudson AG. Two genetic hits (more or less) to cancer. 1 . Nature Rev. Genet. 2001;1:157–162. doi: 10.1038/35101031. [DOI] [PubMed] [Google Scholar]
- 27.Berger AH, Knudson AG, Pandolfi PP. A continuum model for tumour suppression. Nature. 2011;476:163–169. doi: 10.1038/nature10275. [DOI] [PMC free article] [PubMed] [Google Scholar]
- 28.Beasley MB, et al. The P16/cyclin D1/Rb pathway in neuroendocrine tumors of the lung. Hum. Pathol. 2003;34:136–142. doi: 10.1053/hupa.2003.8. [DOI] [PubMed] [Google Scholar]
- 29.Northcott PA, et al. Enhancer hijacking activates GFI1 family oncogenes in medulloblastoma. Nature. 2014;511:428–434. doi: 10.1038/nature13379. [DOI] [PMC free article] [PubMed] [Google Scholar]
- 30.The Cancer Genome Atlas Network. Comprehensive molecular characterization of human colon and rectal cancer. Nature. 2012;487:330–337. doi: 10.1038/nature11252. [DOI] [PMC free article] [PubMed] [Google Scholar]
- 31.Pitkänen E, Cajuso T, Katainen R, Kaasinen E, Välimäki N. Frequent L1 retrotranspositions originating from TTC28 in colorectal cancer. Oncotarget. 2014;5:853–859. doi: 10.18632/oncotarget.1781. [DOI] [PMC free article] [PubMed] [Google Scholar]
- 32.Helman E, Lawrence ML, Stewart C. Somatic retrotransposition in human cancer revealed by whole-genome and exome sequencing. Genome Res. 2014;24:1053–1063. doi: 10.1101/gr.163659.113. [DOI] [PMC free article] [PubMed] [Google Scholar]
- 33.Jancalek R. The role of the TP73 gene and its transcripts in neuro-oncology. Br. J. Neurosurg. 2014;28:598–605. doi: 10.3109/02688697.2014.908162. [DOI] [PubMed] [Google Scholar]
- 34.Tannapfel A, et al. Autonomous growth and hepatocarcinogenesis in transgenic mice expressing the p53 family inhibitor DNp73. Carcinogenesis. 2008;29:211–218. doi: 10.1093/carcin/bgm236. [DOI] [PubMed] [Google Scholar]
- 35.Venkatanarayan A, et al. IAPP-driven metabolic reprogramming induces regression of p53-deficient tumours in vivo. Nature. 2015;517:626–630. doi: 10.1038/nature13910. [DOI] [PMC free article] [PubMed] [Google Scholar]
- 36.Falix FA, Aronson DC, Lamers WH, Gaemers IC. Possible roles of DLK1 in the Notch pathway during development and disease. Biochim. Biophys. Acta. 2012;1822:988–995. doi: 10.1016/j.bbadis.2012.02.003. [DOI] [PubMed] [Google Scholar]
- 37.Ball DW. Achaete-scute homolog-1 and Notch in lung neuroendocrine development and cancer. Cancer Lett. 2004;204:159–169. doi: 10.1016/S0304-3835(03)00452-X. [DOI] [PubMed] [Google Scholar]
- 38.Augustyn A, et al. ASCL1 is a lineage oncogene providing therapeutic targets for high-grade neuroendocrine lung cancers. Proc. Natl Acad. Sci. USA. 2014;111:14788–14793. doi: 10.1073/pnas.1410419111. [DOI] [PMC free article] [PubMed] [Google Scholar]
- 39.Sriuranpong V, et al. Notch signaling induces cell cycle arrest in small cell lung cancer cells. Cancer Res. 2001;1:3200–3205. [PubMed] [Google Scholar]
- 40.Wael H, et al. Notch1 signaling controls cell proliferation, apoptosis and differentiation in lung carcinoma. Lung Cancer. 2014;85:131–140. doi: 10.1016/j.lungcan.2014.05.001. [DOI] [PubMed] [Google Scholar]
- 41.Rangarajan A, et al. Notch signaling is a direct determinant of keratinocyte growth arrest and entry into differentiation. EMBO J. 2001;20:3427–3436. doi: 10.1093/emboj/20.13.3427. [DOI] [PMC free article] [PubMed] [Google Scholar]
- 42.Qi R, et al. Notch1 signaling inhibits growth of human hepatocellular carcinoma through induction of cell cycle arrest and apoptosis. Cancer Res. 2003;63:8323–8329. [PubMed] [Google Scholar]
References
- 43.Iwakawa R, et al. Genome-wide identification of genes with amplification and/or fusion in small cell lung cancer. Genes Chromosomes Cancer. 2013;52:802–816. doi: 10.1002/gcc.22076. [DOI] [PMC free article] [PubMed] [Google Scholar]
- 44.Seidel D. A genomics-based classification of human lung tumors. Sci. Transl. Med. 2013;5:209ra153. doi: 10.1126/scitranslmed.3006802. [DOI] [PMC free article] [PubMed] [Google Scholar]
- 45.Lafkas D, et al. Notch3 marks clonogenic mammary luminal progenitor cells in vivo. J. Cell Biol. 2013;203:47–56. doi: 10.1083/jcb.201307046. [DOI] [PMC free article] [PubMed] [Google Scholar]
- 46.Muzumdar MD, Tasic B, Miyamichi K, Li L, Luo L. A global double-fluorescent Cre reporter mouse. Genesis. 2007;45:593–605. doi: 10.1002/dvg.20335. [DOI] [PubMed] [Google Scholar]
- 47.Lu X, Thomas RK, Peifer M. CGARS: cancer genome analysis by rank sums. Bioinformatics. 2014;30:1295–1296. doi: 10.1093/bioinformatics/btu011. [DOI] [PubMed] [Google Scholar]
- 48.Li H, Durbin R. Fast and accurate short read alignment with Burrows–Wheeler transform. Bioinformatics. 2009;25:1754–1760. doi: 10.1093/bioinformatics/btp324. [DOI] [PMC free article] [PubMed] [Google Scholar]
- 49.Fernandez-Cuesta L, et al. Frequent mutations in chromatin-remodelling genes in pulmonary carcinoids. Nat. Commun. 2014;5:3518. doi: 10.1038/ncomms4518. [DOI] [PMC free article] [PubMed] [Google Scholar]
- 50.Jahchan NS, et al. A drug repositioning approach identifies tricyclic antidepressants as inhibitors of small cell lung cancer and other neuroendocrine tumors. Cancer Discov. 2013;3:1364–1377. doi: 10.1158/2159-8290.CD-13-0183. [DOI] [PMC free article] [PubMed] [Google Scholar]
Associated Data
This section collects any data citations, data availability statements, or supplementary materials included in this article.
Supplementary Materials
Tables
