Nucleolin-Mediated RNA Localization Regulates Neuron Growth and Cycling Cell Size (original) (raw)
Summary
How can cells sense their own size to coordinate biosynthesis and metabolism with their growth needs? We recently proposed a motor-dependent bidirectional transport mechanism for axon length and cell size sensing, but the nature of the motor-transported size signals remained elusive. Here, we show that motor-dependent mRNA localization regulates neuronal growth and cycling cell size. We found that the RNA-binding protein nucleolin is associated with importin β1 mRNA in axons. Perturbation of nucleolin association with kinesins reduces its levels in axons, with a concomitant reduction in axonal importin β1 mRNA and protein levels. Strikingly, subcellular sequestration of nucleolin or importin β1 enhances axonal growth and causes a subcellular shift in protein synthesis. Similar findings were obtained in fibroblasts. Thus, subcellular mRNA localization regulates size and growth in both neurons and cycling cells.
Graphical Abstract
Highlights
- •
A kinesin-nucleolin complex transports size-regulating mRNAs to the cell periphery - •
Importin β1 mRNA MAIL motif associates with nucleolin to regulate growth and size - •
Sequestration of nucleolin or importin β1 enhances growth and shifts protein synthesis - •
Subcellular mRNA localization regulates size and growth in neurons and cycling cells
Perry et al. show that motor-dependent mRNA localization regulates neuronal growth and cycling cell size. They implicate the RNA-binding protein nucleolin in importin β1 mRNA transport to neuronal axons and to the cellular periphery in fibroblasts. Perturbation of this mechanism affects growth and shifts protein synthesis, regulating axon length and cell size.
Introduction
Cell size homeostasis is one of the most fundamental aspects of biology, with distinct size ranges for individual cell types (Ginzberg et al., 2015). Growing cells must match transcriptional and translational output to their size change needs, but the mechanisms underlying such coordination are largely unknown (Marguerat and Bähler, 2012). Neurons exhibit the greatest size differences of any class of cells, having process lengths ranging from a few microns in central interneurons to meters in large mammals. Embryonic neuron growth rates vary according to the distances they must travel at different stages of elongating growth in the embryo (Lallemend et al., 2012). Moreover, axonal lengths impose a significant delay between transcription and biosynthesis in the cell body and delivery of the components necessary for growth and maintenance to the axon. How then can large cells such as neurons coordinate between their transcriptional and metabolic output to the growth and maintenance needs of differently sized axonal arbors?
Most studies of neuronal growth have focused on extrinsic influences, such as neurotrophic factors secreted by adjacent or target cells (Harrington and Ginty, 2013). Intrinsic regulation of neuronal growth has been reported in different neuronal subtypes (Albus et al., 2013), but the underlying mechanisms are largely unknown. The large dimensions of a growing neuron require active transport by molecular motors for transfer of signals between neurites and cell body. In previous work, we examined the possibility that molecular motor-based signaling might allow distance sensing between cell center and axon endings on a continuous basis, enabling regulation of axon growth rates. Computational modeling directed our attention to a bilateral mechanism with regulatory feedback (Rishal et al., 2012).
In this model, a cell body signal is anterogradely transported by kinesin motors to the neurite end, where it activates dynein-mediated retrograde transport of another cargo to the cell center. The retrograde signal then represses the original anterograde entity, thus periodically resetting the system and generating an oscillating retrograde signal, with frequencies that decrease as a function of increasing cell length. Simulations show that reductions in anterograde or retrograde signals in this model cause a slowing in the rate of frequency decrease with time in the system. If growth rates are correlated with retrograde signal frequency, this leads to the counter-intuitive prediction that reducing either anterograde or retrograde signals should lead to increased axon lengths in both cases. We confirmed this prediction for specific kinesins and for dynein heavy chain 1 in adult sensory neurons and in mouse embryonic fibroblasts (Rishal et al., 2012), demonstrating a role for microtubule-bound motors in cell size sensing and growth control. However, the nature of the motor-transported size signals remained unknown. Here we identify RNA localization and localized protein translation as critical aspects of motor-dependent size sensing. We show that depletion of the nuclear import factor importin β1 from axons by a 3′ UTR knockout (KO) or by sequestration of nucleolin, an RNA-binding protein (RBP) involved in importin β1 axonal localization, enhances neuronal outgrowth, concomitantly with a subcellular shift in protein synthesis. Similar perturbations affect the morphology and size of fibroblasts in culture. Thus, the subcellular localization of nucleolin-associated mRNAs regulates cell size and growth control mechanisms.
Results
Increased Axonal Growth Rates in Sensory Neurons Lacking Axonal Importin β1
To identify participants in motor-dependent cell length sensing, we screened a number of mouse mutants for increased axonal outgrowth of adult sensory neurons in culture. We crossed candidate mouse lines to Thy1/yellow fluorescent protein (YFP) mice (Feng et al., 2000) to allow live imaging of growing neurons. Calculation of ongoing growth rates from such experiments confirmed previous observations (Rishal et al., 2012) that the Loa point mutation in dynein heavy chain 1 (Dync1h1) induces a significantly higher axonal growth rate in heterozygous sensory neurons (Figures S1A and S1B). A similar result was observed for sensory neuron cultures from a mouse with a 3′ UTR deletion in importin β1. The importin β1 3′ UTR−/− mouse revealed subcellular depletion of importin β1 protein from sensory axons with no change in neuronal cell bodies (Perry et al., 2012). Strikingly, YFP-labeled importin β1 3′ UTR−/− neurons revealed significantly higher axon growth rates than neurons from wild-type (WT) littermates (Figures 1A and 1B). Moreover, quantification of axon lengths in vivo during the normal elongating phase of development revealed ∼35% more axon growth in the mutants than in WT littermates at embryonic day (E11.5) (Figures 1C and 1D). We further confirmed specific axonal reduction of importin β1 in growing sensory axons from adult KO mice (Figures 1E–1G). These findings suggest that the subcellular localization of importin β1 plays a role in setting neuronal growth rates both in vitro and in vivo.
Figure 1.

Increased Axonal Growth Rates in Importin β1 Mutant Sensory Neurons
(A) Fluorescent images show cultured YFP-expressing DRG neurons from WT versus importin β1 3′ UTR-null mice at 48 hr in vitro. Scale bar, 100 μm.
(B) Quantification of time-lapse imaging of YFP-expressing DRG neurons in culture. Images were taken every hour in a Fluoview FV10i incubator microscope. 3 × 3 montages of neighboring acquisition sites were analyzed using ImageJ. Longest neurite growth rates in these experiments were 6.9 ± 0.6 μm/hr for WT versus 11.5 ± 0.9 μm/hr for importin β1 3′ UTR−/− mice. Mean ± SEM; n ≥ 30 cells per experimental group; ∗p < 0.05 for comparison of growth rates, one-way ANOVA.
(C) Whole-mount neurofilament staining in E11.5 limbs in WT and importin β1 3′ UTR−/− mice is shown. Scale bar, 200 μm.
(D) Quantification reveals significantly longer total neurite lengths at E11.5 in importin β1 3′ UTR−/− embryos than in WT littermates (n ≥ 7; ∗p < 0.05, Student’s t test).
(E) Western blot quantifications for importin β1 in axon versus cell body compartments of sensory neurons cultured for 48 hr in compartmentalized Boyden chambers. A representative blot with the same loading order is shown above the graph. WT versus importin β1 3′ UTR−/− neurons are shown. Mean ± SEM; n = 3; ∗p < 0.05, Student’s t test.
(F) Electron micrographs show immunogold labeling for importin β1 on ultrathin monolayer sections of cultured DRG neurons from WT and importin β1 3′ UTR−/− mice. Scale bar, 200 nm; gold particle diameter, 10 nm.
(G) Quantification of immunogold labeling confirms reduced levels of importin β1 protein in growing sensory axons of importin β1 3′ UTR−/− mice. Mean ± SEM; n ≥ 50; ∗∗∗p < 0.001, Student’s t test.
(H) DRG neuron cultures from Islet-Cre RiboTag mice were immunostained for the tagged ribosome epitope (HA), ribosomal RNA (Y10B), and axonal tubulin (Tubb3). A representative axon tip is shown. Scale bar, 5 μm. For additional images see Figure S1C.
(I) Quantification of ribosomal 18S RNA (left) and importin β1 mRNA (right) in HA-RiboTag pull-downs from axonal and cell body compartments from Islet-Cre RiboTag DRG neurons cultured for 96 hr in compartmentalized Boyden chambers. RNA levels are quantified as fold change of levels in control pull-downs from WT cultures. Mean ± SEM; n = 4; ∗p < 0.05 and ∗∗p < 0.005, Student’s t test.
(J) Representative PLA images to identify importin β1-dynein complexes in DRG neurons grown for 48 hr in culture. After 48 hr the neurons were fixed and stained for dynein and importin β1, followed by the PLA probes. Scale bar, 50 μm. See also Figures S1D and S1E.
(K) Co-immunoprecipation (coIP) of importin β1 with dynein from axoplasm. Immunoprecipitations were carried out with dynein IC74.1 intermediate-chain antibody versus non-immunized mouse IgG.
See also Figure S1.
Previous work had demonstrated local translation of importin β1 in sensory axons upon nerve injury (Hanz et al., 2003, Yudin et al., 2008). To test whether importin β1 also might be locally translated in the axons of actively growing neurons, we took advantage of the RiboTag transgenic mouse model (Sanz et al., 2009) to examine endogenous mRNA interaction with ribosomes. We crossed RiboTag and Islet1-Cre mice to generate HA-tagged ribosomes in sensory neurons, and we verified neuron-specific expression of the HA tag in dorsal root ganglia (DRG) cultures (Figure S1C). HA-tagged ribosomes were present in axons and axon tips of growing sensory neurons (Figures 1H and S1C). Axon and cell body extracts from compartmentalized cultures were subjected to HA immunoprecipitation followed by qPCR for ribosome-associated RNAs. Ribosome immunoprecipitation was confirmed by qPCR for 18S RNA (Figure 1I). Importin β1 mRNA was found to be associated with ribosomes in both cell body and axonal compartments (Figure 1I), supporting its local translation in growing axons.
Locally translated importin β1 is retrogradely transported from axon to soma by dynein in injured sensory neurons (Hanz et al., 2003, Perry et al., 2012). To determine whether importin β1 also is associated with dynein in growing axons, we used in situ proximity ligation assay (PLA) (Söderberg et al., 2006) for direct visualization of the association of endogenous proteins within growing axons. Robust colocalization of importin β1 and dynein was observed in growing axons (Figure 1J), with little or no background in single-antibody controls (Figure S1D). Association of importin β1 and dynein also was confirmed by co-immunoprecipitation from axoplasm (Figure 1K). The influence of dynein depletion on the subcellular distribution of importin β1 was further assessed by capillary electrophoresis immuno-quantification (Harris, 2015), showing reduced axonal and increased soma importin β1 in Loa dynein mutant neurons (Figure S1E). The small interfering RNA (siRNA)-mediated knockdowns of Kif5A and Kif5B had a similar effect on importin β1 mRNA levels in axons versus soma of compartmentalized neuron cultures (data not shown). In this context, it is noteworthy that siRNA knockdown of these two kinesins previously was shown to induce axon lengthening in sensory neuron cultures (Rishal et al., 2012).
Delineation of an Axon-Localizing Stem-Loop Motif in Importin β1 3′ UTR
Taken together, the above data show that importin β1 is present in growing axons as mRNA in association with ribosomes and as protein in association with dynein and that its subcellular removal from axons enhances their growth. We therefore set out to identify the molecular determinants of axonal localization of importin β1 mRNA. We used Mfold (Zuker, 2003) to predict secondary structures between 793 and 1,148 nt of the importin β1 3′ UTR, which we previously had shown harbors the axon-localizing element (Perry et al., 2012). Based on these predictions, we then generated a series of deletion mutants within this region as shown in Figure 2A, and we tested their capacity to localize a destabilized GFP reporter construct upon transfection of sensory neurons. Fluorescence recovery after photobleaching (FRAP) experiments with these constructs showed a loss of axon-localizing activity upon deletion of the motif between 916 and 994 nt in the 3′ UTR (Figures 2B–2D, S2A, and S2B).
Figure 2.

MAIL, A Localization Motif for Importin β1 mRNA
(A) Schematic diagram of segments from the importin β1 3′ UTR (GenBank: JX096837.1) evaluated for axon-localizing activity. Regions predicted to contain stem-loop secondary structures are highlighted in red. The region between 1 and 134 nt encompasses the short form of importin β1 3′ UTR, which is restricted to the cell body. The motif for axonal importin localization (MAIL) is shown as a red stem-loop structure at 991–1,024 nt.
(B) Sequences and schematic structure predictions of the MAIL motif and two derived mutants, GMAIL, with four U-G mutations in the loop region as shown, and IMAIL, which carries the GMAIL mutations together with additional mutations in the stem region, are shown.
(C) Constructs containing deletions or fusions of the MAIL motif as indicated were fused with a destabilized myr-EGFP reporter and transfected to sensory neurons for FRAP analyses, with recovery monitored over 20 min. Representative images from time-lapse sequences before (−2 min) and after photobleaching (0 and 20 min) in the boxed region of interest are shown. For data from additional constructs, see Figure S2A. Scale bar, 25 μm.
(D) Quantification of the FRAP analyses shown in (C). Average recoveries are shown (percentage of pre-bleach levels ± SEM). Anisomycin-treated neurons were exposed to 50 μM inhibitor prior to the imaging sequence. Time points with significant differences in axonal fluorescence compared to that observed in anisomycin-treated cultures are indicated (∗∗∗p < 0.001 and ∗∗p < 0.01, two-way ANOVA). For results with additional deletion constructs and anisomycin controls, see Figure S2B.
(E) In situ hybridization on neurons transfected with the indicated constructs. Exposure-matched images show that only GFP mRNA with the MAIL element localizes into axons (right panel), while all reporter mRNAs are clearly expressed in corresponding cell body images (left panel). Scale bars, 25 μm (cell body) and 10 μm (axons). See also Figure S2C.
See also Figure S2.
Secondary structure analyses for this region and adjacent segments identified a predicted stem-loop motif of 34 nt spanning positions 991–1,024 (Figure 2B). This motif is hereby designated as motif for axonal importin localization (MAIL). Fluorescence in situ hybridization (FISH) showed that deletion of MAIL removed axonal localization capacity of the importin β1 3′ UTR, while fusion of two MAIL sequences to the short 1–134 non-localizing variant of importin β1 3′ UTR (Perry et al., 2012) conveyed axon-localizing capacity (Figures 2E and S2C). U-G mutations in the loop region of MAIL were used to generate a mutant termed GMAIL (Figure 2B) that revealed reduced axon-localizing activity (Figures S2D and S2E). A combination of the GMAIL mutations with additional mutations in the stem region generated a stem-and-loop mutant completely devoid of localizing activity termed inactive MAIL (IMAIL; Figure 2B). FISH and FRAP assays with reporter constructs comparing MAIL with these mutated motifs confirmed specific MAIL-dependent axon localization in sensory neurons (Figures 2E, S2D, and S2E). Comparisons of importin β1 sequence from a diversity of mammalian species revealed high conservation of the MAIL motif, especially in the loop region (Figure S2F).
Identification of Nucleolin as a Binding Protein for the Importin β1 3′ UTR MAIL Motif
We then sought to identify RBPs that interact with the MAIL motif. Pull-downs of bovine sciatic nerve axoplasm with biotinylated RNA motifs revealed clear differences in the interacting protein profile between MAIL and GMAIL (Figures 3A, S3A, and S3B). Tryptic digest and mass spectrometric analyses identified the RBP nucleolin as a major MAIL-bound component (Figures S3A–S3C). Nucleolin is a multifunctional protein that contains four RNA-binding domains, and it is found in cells both within the nucleus and at the plasma membrane (Abdelmohsen and Gorospe, 2012); hence, it is well placed to play a role in signaling systems linking the cell center with its periphery.
Figure 3.

Axonal Nucleolin Interacts with the Importin β1 MAIL Motif
(A) Bovine axoplasm (10 mg/lane) was precipitated on immobilized MAIL or GMAIL RNA motifs, and eluted proteins were separated by 10% SDS-PAGE. The gel region containing the major differential band is shown here and the complete gel is shown in Figure S3A. Mass spectrometry analyses identified nucleolin as the major unique MAIL-bound component (Figures S3A–S3C).
(B) Western blot of nucleolin precipitated from rat sciatic nerve axoplasm with MAIL, GMAIL, or β-actin Zipcode RNA motifs. Precipitates were separated on 10% SDS-PAGE, blotted onto nitrocellulose, and probed with antibody against nucleolin.
(C) Immunoprecipitation of 200 μg rat sciatic nerve axoplasm samples with control IgG or anti-nucleolin antibodies followed by RT-PCR for importin β1 or β-actin mRNAs.
(D) Western blot of recombinant nucleolin precipitated with MAIL, IMAIL, or β-actin Zipcode RNA motifs. Input was 1 μg recombinant nucleolin per lane.
(E) Primary cultured rat sensory neurons immunostained with antibodies against nucleolin (red) and NFH (green), revealing nucleolin in both neuronal cell bodies and axons. Scale bar, 20 μm; right overlay panel scale bar, 10 μm.
(F) Sciatic nerve cross-sections immunostained with antibodies against nucleolin (red) and NFH (green), revealing nucleolin within sensory axons in vivo. Scale bar, 20 μm.
(G) Electron micrographs showing immunogold labeling for nucleolin in axons on ultrathin monolayer sections of cultured mouse DRG neurons (left) or of sciatic nerve (right). Nucleolin is present in axons in vitro and in vivo. Scale bars, 200 nm; gold particle diameter, 10 nm.
(H) Colocalization of nucleolin protein (immunostaining, green) and importin β1 mRNA (FISH, red) in sensory axons. Importin β1 mRNA colocalized with nucleolin protein (yellow) is shown in a single optical plane (scale bar, 5 μm). For cell body signal and scrambled probe control, see Figure S3D. Pearson’s correlation coefficient for importin β1 colocalization with nucleolin 0.37 ± 0.04 (n = 29) differs significantly from Pearson’s for β-actin or GAP43 (see below) (p value for importin β1 versus β-actin < 0.004, p value for importin β1 versus GAP43 < 0.0001; ANOVA with Bonferroni post hoc correction in both cases).
(I) Colocalization of nucleolin protein (immunostaining, green) and β-actin mRNA (FISH, red) in sensory axons. Colocalization is shown in yellow in a single optical plane (scale bar, 5 μm). For cell body signal and scrambled probe control, see Figure S3D. Pearson’s correlation coefficient for β-actin colocalization with nucleolin 0.19 ± 0.03 (n = 20).
(J) Colocalization of nucleolin protein (immunostaining, green) and GAP43 mRNA (FISH, red) in sensory axons. Colocalization is shown in yellow in a single optical plane (scale bar, 5 μm). For cell body signal and scrambled probe control, see Figure S3D. Pearson’s correlation coefficient for GAP43 colocalization with nucleolin 0.05 ± 0.01 (n = 48).
See also Figure S3.
We verified the nucleolin-MAIL interaction by pull-down of rat sciatic nerve axoplasm with RNA probes encoding MAIL, GMAIL, or the Zipcode motif of β-actin mRNA (Kim et al., 2015) (Figure 3B). A reverse pull-down by immunoprecipitation of axoplasm with anti-nucleolin antibody followed by RT-PCR for importin β1 or β-actin as a control likewise confirmed specific association of neuronal importin β1 transcript with nucleolin (Figure 3C). To test for a direct interaction of importin β1 mRNA with nucleolin, we incubated purified recombinant nucleolin with biotinylated MAIL, IMAIL, or β-actin Zipcode RNA motifs, before precipitating the complexes over immobilized streptavidin. Immunoblotting confirmed a direct and specific interaction of nucleolin with the importin β1 MAIL motif (Figure 3D).
We next asked if nucleolin localizes to sensory axons. Immunofluorescence revealed nucleolin in both cell bodies and axons of proprioceptive sensory neurons in culture (Figure 3E) and in axons of myelinated sensory neurons in vivo (Figure 3F). Both these observations were confirmed by electron microscopy (EM) immunogold labeling (Figure 3G). Immunostaining for nucleolin protein concomitantly with FISH for importin β1 mRNA revealed extensive axonal colocalization (Figures 3H and S3D), as compared to similar analyses for β-actin (Figures 3I and S3D) or GAP43 mRNAs (Figures 3J and S3D). Pearson’s coefficient calculations showed significantly more colocalization of axonal importin β1 mRNA with nucleolin than either β-actin or GAP43 mRNAs with nucleolin (Figures 3H–3J). Thus, nucleolin is localized to the axons of sensory neurons both in vivo and in culture and is associated with importin β1 mRNA in axons.
Restriction of Nucleolin to Neuronal Cell Bodies Enhances Axon Growth
We then examined the effects of a nucleolin-targeting aptamer on proprioceptive neurons. The AS1411 aptamer is a quadruplex-forming oligodeoxynucleotide that internalizes to cells and binds nucleolin with high affinity and specificity (Bates et al., 2009). AS1411 induces death of a variety of tumor cells and has undergone evaluation in clinical trials for leukemia and breast cancer (Berger et al., 2015). Fluorescently labeled AS1411 was internalized at both axons and cell bodies of proprioceptive neurons in culture, but over time in culture the aptamer was concentrated in cell bodies only, leaving the axons clear (Figures 4A and S4A). AS1411 treatment caused a decrease in nucleolin levels in axons without affecting cell body levels (Figure 4B). Similar findings were obtained by quantification of aptamer fluorescence in cell bodies versus axons (Figures S4A and S4B) and by immunogold labeling on EM sections of aptamer-treated sensory neurons (Figure 4C). AS1411 treatment also significantly reduced importin β1 mRNA in axons, concomitantly with an apparent increase in neuronal cell bodies (Figure 4D).
Figure 4.

Depletion of Axonal Nucleolin Reduces Importin β1 Transcript in Sensory Axons
(A) Cy3-labeled AS1411 and control aptamers were added to sensory neuron cultures to a final concentration of 20 μM. Neurons were fixed at the indicated time points. Scale bar, 10 μm. See also Figures S4A and S4B.
(B) Western blots for nucleolin on axon versus cell body extracts from sensory neurons in compartmentalized Boyden chambers treated with AS1411 or control aptamers for 48 hr before transfer to aptamer-free medium for another 24 hr. Quantifications of blots are shown below. Mean ± SEM; n = 4; ∗∗p < 0.01, Student’s t test.
(C) Electron micrographs of cultured DRG neuron processes show immunogold labeling for nucleolin after AS1411 treatment. Scale bar, 200 nm; gold particle, 10 nm. Mean ± SEM; n ≥ 25; ∗∗∗p < 0.001, Student’s t test.
(D) Quantification of relative importin β1 transcript levels by qPCR on cell bodies and axons of cells treated with AS1411 or control DNAs. β-actin served as an internal control and did not change. Mean ± SEM; n = 3; ∗∗p < 0.01, Student’s t test.
(E) CoIP of Kif5A with nucleolin from sciatic nerve axoplasm. The control immunoprecipitation is in the presence of a blocking peptide for the nucleolin antibody. A supporting experiment is shown in Figure S4C. Quantification of the Kif5A-nucleolin coIP is shown above. Mean ± SEM; n = 5; ∗p < 0.05, paired Student’s t test.
(F) Importin β1 transcript levels co-precipitated with Kif5A. Mean ± SEM; n = 5; ∗∗p < 0.01, ratio-paired Student’s t test.
(G) Quantification of Kif5A on fluorescent Li-COR western blots of nucleolin immunoprecipitations from sciatic nerve axoplasm, after pre-incubation with AS1411 or control aptamer. Representative blots are shown below the graph. Mean ± SEM; n = 3; ∗p < 0.05, paired Student’s t test. Similar results were obtained from neuronal cultures (Figure S4D).
(H) Automated capillary electrophoresis quantification of kinesin heavy-chain (KHC) immunoreactivity co-precipitated with nucleolin from sciatic nerve axoplasm, after pre-incubation with AS1411 or control aptamer. Representative traces of the KHC immunoreactive peaks are shown on the left and quantifications are shown on the right. Mean ± SEM; n = 3; ∗p < 0.05, paired Student’s t test.
(I) Quantification of Kif5A protein pulled down by a MAIL RNA probe from sciatic nerve axoplasm pre-incubated with AS1411 or control DNA. Protein levels were quantified by automated capillary electrophoresis. Data are shown as percentage from control. Mean ± SEM; n = 9; ∗∗p < 0.01, paired Student’s t test.
See also Figure S4.
We surmised that AS1411-induced sequestration of nucleolin and associated importin β1 transcript from axons might be due to perturbation of transport of the RBP complex from the cell soma. We therefore examined whether nucleolin interacts with kinesin motors, and we observed specific co-immunoprecipitation of nucleolin with the kinesin Kif5A (Figure 4E). This interaction was further confirmed by co-precipitation of kinesin heavy chain with nucleolin (Figure S4C). Importin β1 transcript also co-precipitated with Kif5A (Figure 4F), indicating that kinesins transport nucleolin and associated mRNAs into sensory axons. Strikingly, pre-incubation with the AS1411 aptamer significantly reduced co-precipitation of Kif5A or of kinesin heavy chains with nucleolin from axoplasm (Figures 4G and 4H) or from neuronal cultures (Figure S4D). Moreover, Kif5A pull-down from axoplasm by a MAIL RNA probe was significantly reduced after pre-incubation with the AS1411 aptamer (Figure 4I). Hence, AS1411-induced restriction of nucleolin and its mRNA cargo to the neuronal soma is most likely due to the perturbation of nucleolin association with kinesins, thereby preventing transport of the complex from soma to axon.
To evaluate the effects of nucleolin restriction to the soma on axon outgrowth, we pretreated proprioceptive sensory neurons with AS1411 or control aptamer for 48 hr in culture, and then we replated them in fresh medium without aptamer. Under these conditions, AS1411 significantly enhanced total axonal outgrowth (Figures 5A and 5B) without any observable effect on cell viability. To test whether such effects also could be observed in other neuronal subtypes, we treated cultures of nociceptor neurons in the same manner. As shown in Figure S5, nociceptor neurons pretreated with AS1411 also exhibited significantly more axon growth than cultures pretreated with control aptamer. Finally, we examined whether these aptamer effects were mediated by importin β1 mislocalization. Axon growth after AS1411 pretreatment was increased in WT proprioceptive neurons to levels similar to those seen in importin β1 3′ UTR−/− neurons not exposed to the aptamer. Moreover, AS1411 had no growth-promoting effect on 3′ UTR−/− neurons as compared to control aptamer (Figures 5C and 5D). These experiments were quantified at 24 hr after replating of the neurons, and, since it is possible to monitor continuing growth over 96 hr in culture, the lack of effect of AS1411 on 3′ UTR−/− neurons is not due to saturation of their growth capacity. Taken together, these results indicate that nucleolin restriction to neuronal cell bodies enhances neurite outgrowth by a mechanism dependent on the axonal localization of importin β1 mRNA.
Figure 5.

AS1411 Enhances Sensory Axon Growth Rates in WT, but Not in Importin β1 3′ UTR−/− Neurons
(A) Cultured DRG neurons from adult YFP/WT mice were treated with 10 μM control or AS1411 aptamer for 48 hr, and then they were replated in fresh medium without aptamer and allowed to re-grow. Representative images at three time points following replating are shown. Scale bar, 100 μm.
(B) Quantification of total neurite outgrowth of sensory neurons in culture from the experiment described in (A). Total neurite growth rates in these experiments were 45.7 ± 11.2 μm/hr for control versus 90.1 ± 16.1 μm/hr for AS1411 treatment. Mean ± SEM; n ≥ 60 cells per experimental group; ∗∗∗p < 0.001 for comparison of growth rates, one-way ANOVA.
(C) Representative images of cultured WT or importin β1 3′ UTR−/− sensory neurons treated with 10 μM control or AS1411 aptamer for 48 hr and then replated and cultured for an additional 24 hr in fresh medium without aptamer. Neurons were finally fixed, immunostained for NFH (green), and imaged. Scale bar, 200 μm.
(D) Quantification of total neurite outgrowth in the experiment described in (C) reveals a significant increase in axon growth in WT neurons pretreated with AS1411, but not in importin β1 3′ UTR−/− neurons. Mean ± SEM; n ≥ 300 cells per experimental group; ∗∗∗p < 0.001, Student’s t test.
See also Figure S5.
Perturbation of Nucleolin Affects Size in Non-neuronal Cells
The above data suggest that nucleolin-dependent importin β1 mRNA transport regulates neuronal growth. Since nucleolin is widely expressed in different cell types, we wished to test whether such a mechanism also might function in non-neuronal cells, using 3T3 fibroblasts as a model. We first asked whether importin β1 and nucleolin interact with molecular motors in 3T3 cells. As shown in Figure 6A, importin β1 readily co-precipitated with dynein from 3T3 cell lysate and likewise nucleolin with Kif5B. Moreover, importin β1 mRNA was co-precipitated with both nucleolin and Kif5B (Figure 6B). These data indicate that importin β1 mRNA is transported by a nucleolin-kinesin complex in 3T3 cells and that importin β1 protein is transported by dynein, similar to the findings in neurons. We therefore set out to test the effects of the AS1411 aptamer in 3T3 cells. Since AS1411 can induce death in various types of cycling cells, we first determined the effects of different concentrations of aptamer on 3T3 cell survival and size (Figures S6A and S6B). Exposure to 10 μM AS1411 for 48 hr induced efficient uptake into 3T3 cells (Figure 6C), with concomitant increase in cell area without affecting cell survival (Figures S6A and S6B). Nuclear area and shape were not perturbed (Figures S6C–S6E). This application regimen was therefore used in all subsequent experiments.
Figure 6.

AS1411 Treatment Increases 3T3 Fibroblast Cell Size
(A) Western blots showing coIP of importin β1 with dynein heavy chain 1 and nucleolin with Kif5B from confluent 3T3 cell cultures. Control immunoprecipitations were with non-immune IgG for the dynein immunoprecipitation and with blocking peptide for the precipitating antibody in the nucleolin immunoprecipitation.
(B) Quantification of relative importin β1 transcript levels after pull-down for Kif5A or nucleolin is shown. Mean ± SEM; n = 4; ∗∗∗p < 0.001, ratio-paired Student’s t test.
(C) Representative images for uptake of AS1411-Cy3 into 3T3 cells are shown. Blue, DAPI; red, AS1411. Scale bar, 10 μm.
(D) Representative PLA images of importin β1-dynein complexes in 3T3 cells incubated for 48 hr with AS1411 or control aptamers. After 48 hr the cells were fixed and stained with phalloidin-Cy3 and for dynein and importin β1, followed by the PLA probes. Scale bar, 50 μm.
(E) Quantification of the assay shown in (D). PLA signal per cell body area was quantified using Cellprofiler software, revealing a significant reduction in signal density in 3T3 cells incubated with the AS1411 aptamer. Mean ± SEM; n = 3; ∗∗p < 0.01, Student’s t test.
(F) Representative western blots of importin β1 co-precipitated with dynein from 3T3 cells after 48 hr in culture in the presence of AS1411 or control aptamers. The quantification below shows a significant decrease in coIP of importin β1 with dynein after AS1411 treatment. Mean ± SEM; n = 3; ∗p < 0.05, paired Student’s t test.
(G) 3T3 cells were incubated with 10 μM AS1411 or control aptamer for 48 hr, after which 20,000 cells were replated for another 24 hr in fresh medium without aptamer before fixing and staining with rhodamine-phalloidin. Representative images are shown. Scale bar, 100 μm. See also Figure S6 for higher magnification images of nuclear morphology.
(H) Quantification of 3T3 cell area from the experiment described in (G) reveals a significant increase upon AS1411 treatment. Mean ± SEM; n > 1,000; ∗∗∗p < 0.001, Student’s t test. The experiment was replicated on three independent cultures.
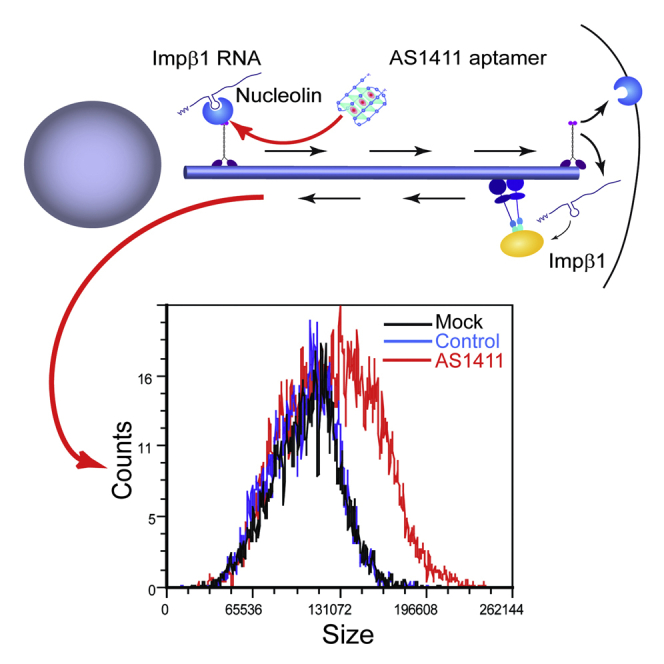
(I) 3T3 cell size at different stages of the cell cycle after 48 hr incubation with AS1411 or control aptamers at 10 μM, followed by harvesting and incubation with 10 μg/ml Hoechst 33342 and 5 μg/ml propidium iodide for live cell cycle analyses by FACS. 30,000 events were collected per sample. AS1411 treatment causes a marked increase in cell size, as shown by the right shift in population distribution in comparison to mock and control at all stages of the cell cycle.
(J) Quantification of the FACS described in (I) for three independent experiments reveals a significant increase of cell size upon AS1411 treatment in all cell cycle phases. Mean ± SEM; n = 3; ∗∗p < 0.01, Student’s t test.
See also Figure S6.
If translation of nucleolin-transported importin β1 mRNA in the distal region of the cytoplasm is indeed the source of retrogradely transported importin β1 protein, one would expect to observe reduced levels of importin β1 interacting with dynein in AS1411-treated cells. Indeed, AS1411-treated cells revealed reduced association of importin β1 with dynein by PLA analyses (Figures 6D and 6E) and co-immunoprecipitation (Figure 6F). Furthermore, we observed a decrease in MAIL motif association with kinesin heavy-chain complexes upon AS1411 treatment (Figure S6F), in a manner similar to that previously observed in axoplasm. MAIL-associated nucleolin levels were not changed following AS1411 treatment (data not shown), indicating that, in 3T3 cells similar to neurons, AS1411 reduces the association of nucleolin and its cargo mRNAs with kinesins, therefore reducing their transport to the cell periphery.
We then tested the effects of aptamer treatment on the size of the cells. AS1411 caused a significant increase in cell body area compared to cells exposed to control aptamer (Figures 6G and 6H). To discriminate between overall size increase versus enhanced cell spreading on the substrate, we assessed 3T3 cell size by fluorescence-activated cell sorting (FACS). In this case, cells were exposed to AS1411 or control aptamer for 48 hr, and then they were harvested and labeled with Hoechst and propidium iodide dyes for live cell cycle analysis by flow cytometry. This analysis showed that AS1411 causes a significant increase in cell size at all stages of the cell cycle (Figures 6I and 6J). The latter result suggests that AS1411’s effect on cell size is due to a general change in cell metabolism and physiology and not by a single change in a cell cycle checkpoint. Thus, motor-dependent nucleolin-mediated RNA transport regulates size in both cycling fibroblasts and post-mitotic neurons.
Nucleolin and Importin Localization Regulates Cellular Protein Synthesis
To obtain further insights on how nucleolin might modulate cell size, we examined the effect of its localization on mRNA translation rates. We quantified overall protein synthesis levels by puromycin incorporation (Schmidt et al., 2009), and we observed a significant and marked overall increase in protein synthesis levels in AS1411-treated neurons (Figures S7A and S7B). A less prominent but still significant increase in protein synthesis levels also was observed in importin β1 3′ UTR−/− neurons as compared to WT (Figures S7C and S7D). We then examined the effect of nucleolin or importin β1 sequestration on subcellular levels of protein synthesis at axon tips by puromycin labeling and immunostaining. AS1411 treatment reduced protein synthesis levels at axon tips of cultured neurons (Figures 7A, 7B, S7E, and S7F). A similar reduction in axon tip protein synthesis was observed in importin β1 3′ UTR−/− neurons as compared to WT, and AS1411 treatment did not have any further effect in the 3′ UTR−/− neurons (Figures 7A and 7B). These results suggest that nucleolin sequestration by the AS1411 aptamer and importin β1 mislocalization in the 3′ UTR−/− both impact on protein synthesis at axon tips. To examine whether a similar effect is found in cycling cells, we visualized puromycin incorporation in the cytoplasm of aptamer-treated 3T3 fibroblasts (Figure 7C). Quantification of puromycin incorporation levels in peripheral versus total cytoplasm revealed a reduction in the peripheral region of AS1411-treated fibroblast cells as compared to mock or control aptamer-treated cells (Figure 7D). Taken together, these findings show that AS1411 treatment or importin β1 3′ UTR KO causes a subcellular shift in protein synthesis, concomitantly with their effects on axon length or fibroblast cell size.
Figure 7.

Nucleolin and Importin β1 Localization Regulate Protein Synthesis
(A) The translational activity of DRG neurons in culture was assessed by puromycin incorporation. Cultures were grown in the presence of AS1411 or control aptamer for 48 hr, and then they were replated and cultured for an additional 24 hr in fresh medium without aptamer. Neurons were then pulsed with 5 mM puromycin for 10 min at 37°C or preincubated with 40 mM anisomycin for 30 min followed by the 5 mM puromycin pulse, and then they were fixed. Fixed cultures were immunostained for NFH (green) and α-puromycin (red). Scale bar, 100 μm. For anisomycin control, see Figures S7E and S7F.
(B) Representative high-sensitivity zoom images of the boxed regions in (A) reveal protein synthesis in axon tips. Scale bar, 20 μm. Quantification reveals a significant decrease in protein synthesis in axon tips of AS1411-treated WT neurons, as well as in importin β1 3′ UTR−/− neurons. Axon tip synthesis was quantified as ratios of cell body values and then normalized to WT control. Mean ± SEM; n ≥ 80 cells from three independent cultures; ∗∗p < 0.01 and ∗∗∗p < 0.001, Student’s t test.
(C) Representative images of cultured 3T3 cells treated with 10 μM control or AS1411 aptamer for 48 hr and then replated and cultured for an additional 24 hr in fresh medium without aptamer. The cells subsequently were incubated with puromycin with or without anisomycin as described above, and then they were fixed and stained for F-Actin, DAPI, and α-puromycin. Scale bar, 50 μm.
(D) Quantification of puromycin labeling in the cytoplasm of 3T3 cells from the experiment described in (C) reveals a significant decrease in protein synthesis at the cell periphery in AS1411-treated cells. Mean ± SEM; n ≥ 200 cells from five independent cultures; ∗p < 0.05, one-way ANOVA with Bonferroni post hoc test.
(E) Schematic model of the mechanism proposed in this study. Nucleolin binds importin β1 and likely other mRNAs, and the complex is transported by a kinesin motor to the axon in a neuron or the cell cortex in cycling cells. Upon arrival at the end of the microtubules, the complex is dissassembled, with nucleolin likely docking to the plasma membrane. Local translation of the cargo RNAs generates proteins that are retrogradely transported with dynein to influence protein synthesis in the soma. The dashed line indicates a negative feedback loop postulated in the original model (Rishal et al., 2012), the details of which are still unknown.
See also Figure S7.
Discussion
Cell size homeostasis is a ubiquitous feature of biological systems, but a comprehensive answer to the question of how cellular dimensions are encoded or sensed by molecular networks is still lacking (Ginzberg et al., 2015). We recently proposed that growing neurons might sense their axon lengths by bidirectional signaling via molecular motors (Rishal et al., 2012). Experimental testing of model predictions supported a role of kinesin and dynein motors in such a mechanism (Rishal et al., 2012), and others have implicated myosin and kinesin motors in size and growth control in neurons (van Diepen et al., 2009, Watt et al., 2015). However, the nature of the signals involved in motor-dependent size sensing remained elusive. In this paper, we provide evidence that nucleolin-mediated RNA localization affects cell growth and size in both neurons and cycling cells, suggesting that subcellular RNA localization is a key mechanism for cell size regulation (Figure 7E).
The initial observation implicating importin β1 in size regulation was increased growth of importin β1 3′ UTR−/− sensory axons, analogous to the results we had reported previously from dynein-mutant mice (Rishal et al., 2012). The identification of nucleolin as an RBP for importin β1 mRNA, and the length and size effects observed upon perturbation of nucleolin with AS1411, shed additional light on the mechanism proposed by Rishal et al. (2012). Sequestration of importin β1 by direct targeting of its 3′ UTR or by perturbation of nucleolin localization with a specific aptamer induces changes in growth rates and cell size. In essence these findings suggest that local translation of nucleolin cargo mRNAs provides the positive feedback arm of the proposed mechanism and that the retrograde signals are dependent on de-novo-translated proteins trafficked by dynein and importins. RNA localization and local protein translation are ubiquitous features of all eukaryotic cells, and they play critical roles in defining localized proteome specialization (Jung et al., 2014). Previous work had shown that local translation enables communication between distal axonal sites and the nucleus upon injury (Perry et al., 2012), and our current findings expand the scope of such mechanisms to size regulation in growing cells.
Nucleolin seems well suited for a pivotal role in size regulation by nucleus-periphery communication, since it shuttles among nucleus, cytosol, and the cell surface (Hovanessian et al., 2010) and it has a broad phylogenetic distribution, including yeast, plant, and animal cells (Riordan et al., 2011, Abdelmohsen and Gorospe, 2012). Nucleolin contains four RNA-binding domains that may interact with diverse target RNAs via a number of short RNA motifs (Abdelmohsen et al., 2011, Ginisty et al., 2001, Ishimaru et al., 2010, Riordan et al., 2011). None of these motifs is similar in sequence to the importin β1 MAIL element, but, since functional localization motifs in RNA are structure and not sequence based (Andreassi and Riccio, 2009), this is not surprising. A comprehensive characterization of the nucleolin cargo RNA ensemble may reveal additional components of the size-sensing mechanism.
We found that the nucleolin-specific AS1411 aptamer (Bates et al., 2009) attenuates nucleolin association with kinesin motors, thereby enabling its sequestration from distal regions of the cell without affecting overall expression levels of the protein. This is consistent with a previous study that demonstrated continuous and rapid turnover of cell surface nucleolin in parallel with stability of the nuclear pool (Hovanessian et al., 2010). Interestingly, calcium is required for nucleolin internalization (Hovanessian et al., 2010) and also for importin β1 local translation (Yudin et al., 2008), suggesting that nucleolin-membrane interactions might trigger RNA cargo dissociation and local translation. Perturbation of this process by nucleolin sequestration causes a size increase in both neurons and fibroblasts. These findings raise the intriguing possibility that sequestration of critical components of the pathway, for example, as done here by AS1411 treatment, might open new avenues for accelerating axonal growth. In essence such treatments would cause the size-sensing mechanism to sense a shorter axon than is actually present, inducing the cell to generate the metabolic output required to sustain rapid growth.
The increased growth observed in importin β1 3′ UTR−/− neurons or upon sequestration of nucleolin from axons or in 3T3 cells is correlated with subcellular changes in protein synthesis. Interestingly, recent work in bacteria and in yeast implicates differential protein synthesis rates in cell size control (Basan et al., 2015, Schmoller et al., 2015). The latter study suggests that size control arises from differences in the size dependence of synthesis of a cell cycle activator versus a cell cycle inhibitor, but it does not show how different protein synthesis pathways can differ in their size sensitivity (Schmoller and Skotheim, 2015). Our findings show that nucleolin and importin β1 perturbation can affect both levels and localization of protein synthesis. The latter finding is especially striking since it provides a plausible transport-regulated mechanism for size-sensitive protein synthesis at cellular extremities, with concomitant size-insensitive synthesis in the cell center. The motor-dependent RNA localization mechanisms delineated in this study provide a mechanism for size sensing that may work via regulation of the subcellular localization of protein synthesis in large cells. Importin β1 may act to link critical regulators to the system, since importin-dynein complexes have been shown to transport transcription factors and other regulatory molecules. These and other questions regarding the proposed mechanism remain open for future work.
To summarize, our findings implicate microtubule motors, mRNA localization, and local translation in the regulation of cell size homeostasis. We propose that feedback monitoring of microtubule cytoskeleton length by transport of locally translated mRNAs enables neuron length and cell size sensing.
Experimental Procedures
Animals, Preparations, and Cultures
All rat and mouse strains used were bred and maintained at the Veterinary Resources Department of the Weizmann Institute. DRG neuron culture preparations were as previously described (Rishal et al., 2010). The study was conducted in accordance with the guidelines of the Weizmann and University of South Carolina (USC) Institutional Animal Care and Use Committees (IACUCs).
Capillary Electrophoresis Immuno-quantification
Automated capillary electrophoresis immuno-quantification runs were conducted on a Wes instrument (ProteinSimple) as described (Harris, 2015). Analyses were performed on 15 s or 30 s image exposures.
DRG Neuron Cultures and Growth Rate Analyses
DRG neurons from the indicated conditions and genotypes were imaged periodically in continuous culture in a Fluoview (FV10i, Olympus) automated confocal laser-scanning microscope with built-in incubator chamber or in an ImageXpress Micro (Molecular Devices) automated microscopy system.
The 20 μM AS1411 or control DNAs were added to rat DRG culture media for 48 hr. Cells were replated to tissue culture inserts for 24 hr before isolation of RNA or protein. Adult YFP/WT mice were treated with control or AS1411 aptamer for 48 hr and then replated and imaged for 24 hr as described above. Cultured DRG neurons from WT or importin β1 3′ UTR KO mice were fixed 24 hr after replating and stained with anti-NFH for process length determination. Neuronal morphology was quantified using WIS-Neuromath (Rishal et al., 2013) or MetaXpress (Molecular Devices).
EM
Samples were prepared for EM as previously described (Rishal et al., 2012). Quantitative analysis was performed using a Fiji macro script written in house.
Fibroblast Cell Imaging and FACS Analysis
AS1411 DNA or control DNA (10 μM) was added to the culture media of 3T3 cells. After 48 hr the cells were replated for another 24 hr without the aptamer for imaging or for live cell cycle analysis by flow cytometry.
FISH
Antisense oligonucleotide probes for importin β1 were designed using Oligo 6 software and checked for homology and specificity by BLAST. cRNA probes for GFP reporter mRNA were as previously described (Vuppalanchi et al., 2010). Hybridization to DRG neuronal cultures was as previously described (Willis et al., 2007). For colocalization of RNA and protein, fluorescently labeled Stellaris RNA probes were used (BiosearchTech) as previously described (Spillane et al., 2013).
FRAP
Dissociated DRG cultures were transfected with importin β1 3′ UTR axonal and cell body variants using Amaxa nucleofection. Terminal axons were subjected to FRAP sequence at 37°C with 488 nm laser line of Leica TCS/SP2 confocal microscope as described with minor modifications (Yudin et al., 2008). Prior to bleaching, neurons were imaged every 30 s for 2 min at 15% laser power. For photobleaching, the region of interest (ROI) was exposed to 75% laser power every 1.6 s for 40 frames. Recovery was monitored every 60 s over 20 min at 15% laser power. To test for translation dependence, cultures were pretreated with 50 μM anisomycin for 30 min before the photobleaching sequence. FRAP quantification and statistical tests are detailed in the Supplemental Experimental Procedures.
Pull-downs and Mass Spectrometry
Axoplasm from rat or mouse sciatic nerve was extracted as previously described (Rishal et al., 2010), and RBP pull-downs were carried out as described (Doron-Mandel et al., 2016). Bovine axoplasm was extracted by the same procedure, using sciatic nerve dissected on site from fresh bovine carcasses within 20 min of slaughter at the Tnuva Slaughterhouse. Streptavidin magnetic beads were washed several times with different concentrations of NaCl, and they were then incubated with 100 μM of the different RNA probes or DNA probes, except for the no-probe sample that was incubated with water. All samples were incubated for 1 hr at 4°C. After washing the resin, 0.5 mg rat axoplasm extract or 10 mg bovine axoplasm extract was applied to the no-probe resin for 30 min to deplete unspecific proteins, and then the unbound fraction was added to the specific probe resin for another 30 min. After intensive washing, bound material was eluted from the resin using SDS sample buffer. The samples from the bovine axoplasm pull-down were loaded into 10% SDS-PAGE gels, followed by Colloidal Blue staining, in-gel digest, and mass spectrometry (see the Supplemental Experimental Procedures).
Protein Synthesis Assays by Puromycin Incorporation
Overall protein synthesis levels were quantified by puromycin incorporation as previously described (Schmidt et al., 2009). Subcellular visualization of protein synthesis in situ was by puromycin immunostaining as described (David et al., 2012).
qPCR
The qPCR was performed using Taqman primer kits for β-actin (normalization control) and importin β1 or perfecta SYBR green (Quanta Biosciences) and gene-specific primers for importin β1 and 18S.
Statistical Methods
Data represent mean ± SEM, unless otherwise noted. Groupwise analyses were conducted by one- or two-way ANOVA with Bonferonni post hoc test. Pairwise analyses were conducted by two-tailed Student’s t tests (unpaired, unless otherwise noted; see figure legends). Statistical analyses were conducted using GraphPad Prism, Synergy Kaleidagraph, or Microsoft Excel. Significance was considered as p values < 0.05.
Author Contributions
M.F., R.B.-T.P., I.R., and E.D.-M. designed the study. R.B.-T.P., I.R., E.D.-M., A.L.K., M.T., S.A., S.K., A.L., M.R., D.Y., P.K.S., C.G., and E.A.H. performed experiments and data analyses. K.F.M. carried out mass spectrometry analyses. V.S. performed EM. W.G. supervised bovine dissections and sample preparation. M.F., J.L.T., A.L.B., A.Y., and C.J.W. supervised research. M.F., R.B.-T.P., I.R., and E.D.-M. wrote the initial manuscript draft. All authors revised the manuscript and approved the final version.
Acknowledgments
We thank Nitzan Korem for excellent technical assistance; Ofra Golani and Reinat Nevo for expert advice on image analyses; Shifra Ben-Dor for expert assistance with bioinformatics; Hanna Vega for graphics; and Dalia Gordon, Elizabeth M.C. Fisher, and Giampietro Schiavo for helpful comments on earlier drafts of this manuscript. This work was supported by funding from the European Research Council (Neurogrowth, M.F.), the Dr. Miriam and Sheldon G. Adelson Medical Research Foundation (M.F., J.L.T., C.J.W., and A.L.B.), the Israel Science Foundation (1284/13, M.F.), the Minerva Foundation (M.F.), the USA-Israel Binational Science Foundation (2011329, M.F. and J.L.T.), the U.S. Army Medical Research Program (W81XWH-13-1-0308, J.L.T. and M.F.), and the NIH (National Institute of General Medical Sciences [NIGMS] 8P41GM103481, A.L.B.; National Institute of Neurological Disorders and Stroke [NINDS] 5R01NS041596, J.L.T.). M.F. is the incumbent of the Chaya Professorial Chair in Molecular Neuroscience at the Weizmann Institute of Science. J.L.T. is the incumbent of the SmartState Chair in Childhood Neurotherapeutics at the University of South Carolina. A.Y. is the incumbent of the Jack & Simon Djanogly Professorial Chair in Biochemistry at the Weizmann Institute of Science.
Published: July 28, 2016
Footnotes
Supplemental Information
Document S1. Supplemental Experimental Procedures and Figures S1–S7
Document S2. Article plus Supplemental Information
References
- Abdelmohsen K., Gorospe M. RNA-binding protein nucleolin in disease. RNA Biol. 2012;9:799–808. doi: 10.4161/rna.19718. [DOI] [PMC free article] [PubMed] [Google Scholar]
- Abdelmohsen K., Tominaga K., Lee E.K., Srikantan S., Kang M.J., Kim M.M., Selimyan R., Martindale J.L., Yang X., Carrier F. Enhanced translation by Nucleolin via G-rich elements in coding and non-coding regions of target mRNAs. Nucleic Acids Res. 2011;39:8513–8530. doi: 10.1093/nar/gkr488. [DOI] [PMC free article] [PubMed] [Google Scholar]
- Albus C.A., Rishal I., Fainzilber M. Cell length sensing for neuronal growth control. Trends Cell Biol. 2013;23:305–310. doi: 10.1016/j.tcb.2013.02.001. [DOI] [PubMed] [Google Scholar]
- Andreassi C., Riccio A. To localize or not to localize: mRNA fate is in 3’UTR ends. Trends Cell Biol. 2009;19:465–474. doi: 10.1016/j.tcb.2009.06.001. [DOI] [PubMed] [Google Scholar]
- Basan M., Zhu M., Dai X., Warren M., Sévin D., Wang Y.P., Hwa T. Inflating bacterial cells by increased protein synthesis. Mol. Syst. Biol. 2015;11:836. doi: 10.15252/msb.20156178. [DOI] [PMC free article] [PubMed] [Google Scholar]
- Bates P.J., Laber D.A., Miller D.M., Thomas S.D., Trent J.O. Discovery and development of the G-rich oligonucleotide AS1411 as a novel treatment for cancer. Exp. Mol. Pathol. 2009;86:151–164. doi: 10.1016/j.yexmp.2009.01.004. [DOI] [PMC free article] [PubMed] [Google Scholar]
- Berger C.M., Gaume X., Bouvet P. The roles of nucleolin subcellular localization in cancer. Biochimie. 2015;113:78–85. doi: 10.1016/j.biochi.2015.03.023. [DOI] [PubMed] [Google Scholar]
- David A., Dolan B.P., Hickman H.D., Knowlton J.J., Clavarino G., Pierre P., Bennink J.R., Yewdell J.W. Nuclear translation visualized by ribosome-bound nascent chain puromycylation. J. Cell Biol. 2012;197:45–57. doi: 10.1083/jcb.201112145. [DOI] [PMC free article] [PubMed] [Google Scholar]
- Doron-Mandel E., Alber S., Oses J.A., Medzihradszky K.F., Burlingame A.L., Fainzilber M., Twiss J.L., Lee S.J. Isolation and analyses of axonal ribonucleoprotein complexes. Methods Cell Biol. 2016;131:467–486. doi: 10.1016/bs.mcb.2015.06.010. [DOI] [PMC free article] [PubMed] [Google Scholar]
- Feng G., Mellor R.H., Bernstein M., Keller-Peck C., Nguyen Q.T., Wallace M., Nerbonne J.M., Lichtman J.W., Sanes J.R. Imaging neuronal subsets in transgenic mice expressing multiple spectral variants of GFP. Neuron. 2000;28:41–51. doi: 10.1016/s0896-6273(00)00084-2. [DOI] [PubMed] [Google Scholar]
- Ginisty H., Amalric F., Bouvet P. Two different combinations of RNA-binding domains determine the RNA binding specificity of nucleolin. J. Biol. Chem. 2001;276:14338–14343. doi: 10.1074/jbc.M011120200. [DOI] [PubMed] [Google Scholar]
- Ginzberg M.B., Kafri R., Kirschner M. Cell biology. On being the right (cell) size. Science. 2015;348:1245075. doi: 10.1126/science.1245075. [DOI] [PMC free article] [PubMed] [Google Scholar]
- Hanz S., Perlson E., Willis D., Zheng J.Q., Massarwa R., Huerta J.J., Koltzenburg M., Kohler M., van-Minnen J., Twiss J.L., Fainzilber M. Axoplasmic importins enable retrograde injury signaling in lesioned nerve. Neuron. 2003;40:1095–1104. doi: 10.1016/s0896-6273(03)00770-0. [DOI] [PubMed] [Google Scholar]
- Harrington A.W., Ginty D.D. Long-distance retrograde neurotrophic factor signalling in neurons. Nat. Rev. Neurosci. 2013;14:177–187. doi: 10.1038/nrn3253. [DOI] [PubMed] [Google Scholar]
- Harris V.M. Protein detection by Simple Western™ analysis. Methods Mol. Biol. 2015;1312:465–468. doi: 10.1007/978-1-4939-2694-7_47. [DOI] [PubMed] [Google Scholar]
- Hovanessian A.G., Soundaramourty C., El Khoury D., Nondier I., Svab J., Krust B. Surface expressed nucleolin is constantly induced in tumor cells to mediate calcium-dependent ligand internalization. PLoS ONE. 2010;5:e15787. doi: 10.1371/journal.pone.0015787. [DOI] [PMC free article] [PubMed] [Google Scholar]
- Ishimaru D., Zuraw L., Ramalingam S., Sengupta T.K., Bandyopadhyay S., Reuben A., Fernandes D.J., Spicer E.K. Mechanism of regulation of bcl-2 mRNA by nucleolin and A+U-rich element-binding factor 1 (AUF1) J. Biol. Chem. 2010;285:27182–27191. doi: 10.1074/jbc.M109.098830. [DOI] [PMC free article] [PubMed] [Google Scholar]
- Jung H., Gkogkas C.G., Sonenberg N., Holt C.E. Remote control of gene function by local translation. Cell. 2014;157:26–40. doi: 10.1016/j.cell.2014.03.005. [DOI] [PMC free article] [PubMed] [Google Scholar]
- Kim H.H., Lee S.J., Gardiner A.S., Perrone-Bizzozero N.I., Yoo S. Different motif requirements for the localization zipcode element of β-actin mRNA binding by HuD and ZBP1. Nucleic Acids Res. 2015;43:7432–7446. doi: 10.1093/nar/gkv699. [DOI] [PMC free article] [PubMed] [Google Scholar]
- Lallemend F., Sterzenbach U., Hadjab-Lallemend S., Aquino J.B., Castelo-Branco G., Sinha I., Villaescusa J.C., Levanon D., Wang Y., Franck M.C. Positional differences of axon growth rates between sensory neurons encoded by Runx3. EMBO J. 2012;31:3718–3729. doi: 10.1038/emboj.2012.228. [DOI] [PMC free article] [PubMed] [Google Scholar]
- Marguerat S., Bähler J. Coordinating genome expression with cell size. Trends Genet. 2012;28:560–565. doi: 10.1016/j.tig.2012.07.003. [DOI] [PubMed] [Google Scholar]
- Perry R.B., Doron-Mandel E., Iavnilovitch E., Rishal I., Dagan S.Y., Tsoory M., Coppola G., McDonald M.K., Gomes C., Geschwind D.H. Subcellular knockout of importin β1 perturbs axonal retrograde signaling. Neuron. 2012;75:294–305. doi: 10.1016/j.neuron.2012.05.033. [DOI] [PMC free article] [PubMed] [Google Scholar]
- Riordan D.P., Herschlag D., Brown P.O. Identification of RNA recognition elements in the Saccharomyces cerevisiae transcriptome. Nucleic Acids Res. 2011;39:1501–1509. doi: 10.1093/nar/gkq920. [DOI] [PMC free article] [PubMed] [Google Scholar]
- Rishal I., Michaelevski I., Rozenbaum M., Shinder V., Medzihradszky K.F., Burlingame A.L., Fainzilber M. Axoplasm isolation from peripheral nerve. Dev. Neurobiol. 2010;70:126–133. doi: 10.1002/dneu.20755. [DOI] [PMC free article] [PubMed] [Google Scholar]
- Rishal I., Kam N., Perry R.B., Shinder V., Fisher E.M., Schiavo G., Fainzilber M. A motor-driven mechanism for cell-length sensing. Cell Rep. 2012;1:608–616. doi: 10.1016/j.celrep.2012.05.013. [DOI] [PMC free article] [PubMed] [Google Scholar]
- Rishal I., Golani O., Rajman M., Costa B., Ben-Yaakov K., Schoenmann Z., Yaron A., Basri R., Fainzilber M., Galun M. WIS-NeuroMath enables versatile high throughput analyses of neuronal processes. Dev. Neurobiol. 2013;73:247–256. doi: 10.1002/dneu.22061. [DOI] [PubMed] [Google Scholar]
- Sanz E., Yang L., Su T., Morris D.R., McKnight G.S., Amieux P.S. Cell-type-specific isolation of ribosome-associated mRNA from complex tissues. Proc. Natl. Acad. Sci. USA. 2009;106:13939–13944. doi: 10.1073/pnas.0907143106. [DOI] [PMC free article] [PubMed] [Google Scholar]
- Schmidt E.K., Clavarino G., Ceppi M., Pierre P. SUnSET, a nonradioactive method to monitor protein synthesis. Nat. Methods. 2009;6:275–277. doi: 10.1038/nmeth.1314. [DOI] [PubMed] [Google Scholar]
- Schmoller K.M., Skotheim J.M. The biosynthetic basis of cell size control. Trends Cell Biol. 2015;25:793–802. doi: 10.1016/j.tcb.2015.10.006. [DOI] [PMC free article] [PubMed] [Google Scholar]
- Schmoller K.M., Turner J.J., Kõivomägi M., Skotheim J.M. Dilution of the cell cycle inhibitor Whi5 controls budding-yeast cell size. Nature. 2015;526:268–272. doi: 10.1038/nature14908. [DOI] [PMC free article] [PubMed] [Google Scholar]
- Söderberg O., Gullberg M., Jarvius M., Ridderstråle K., Leuchowius K.J., Jarvius J., Wester K., Hydbring P., Bahram F., Larsson L.G., Landegren U. Direct observation of individual endogenous protein complexes in situ by proximity ligation. Nat. Methods. 2006;3:995–1000. doi: 10.1038/nmeth947. [DOI] [PubMed] [Google Scholar]
- Spillane M., Ketschek A., Merianda T.T., Twiss J.L., Gallo G. Mitochondria coordinate sites of axon branching through localized intra-axonal protein synthesis. Cell Rep. 2013;5:1564–1575. doi: 10.1016/j.celrep.2013.11.022. [DOI] [PMC free article] [PubMed] [Google Scholar]
- van Diepen M.T., Parsons M., Downes C.P., Leslie N.R., Hindges R., Eickholt B.J. MyosinV controls PTEN function and neuronal cell size. Nat. Cell Biol. 2009;11:1191–1196. doi: 10.1038/ncb1961. [DOI] [PMC free article] [PubMed] [Google Scholar]
- Vuppalanchi D., Coleman J., Yoo S., Merianda T.T., Yadhati A.G., Hossain J., Blesch A., Willis D.E., Twiss J.L. Conserved 3′-untranslated region sequences direct subcellular localization of chaperone protein mRNAs in neurons. J. Biol. Chem. 2010;285:18025–18038. doi: 10.1074/jbc.M109.061333. [DOI] [PMC free article] [PubMed] [Google Scholar]
- Watt D., Dixit R., Cavalli V. JIP3 activates kinesin-1 motility to promote axon elongation. J. Biol. Chem. 2015;290:15512–15525. doi: 10.1074/jbc.M115.651885. [DOI] [PMC free article] [PubMed] [Google Scholar]
- Willis D.E., van Niekerk E.A., Sasaki Y., Mesngon M., Merianda T.T., Williams G.G., Kendall M., Smith D.S., Bassell G.J., Twiss J.L. Extracellular stimuli specifically regulate localized levels of individual neuronal mRNAs. J. Cell Biol. 2007;178:965–980. doi: 10.1083/jcb.200703209. [DOI] [PMC free article] [PubMed] [Google Scholar]
- Yudin D., Hanz S., Yoo S., Iavnilovitch E., Willis D., Gradus T., Vuppalanchi D., Segal-Ruder Y., Ben-Yaakov K., Hieda M. Localized regulation of axonal RanGTPase controls retrograde injury signaling in peripheral nerve. Neuron. 2008;59:241–252. doi: 10.1016/j.neuron.2008.05.029. [DOI] [PMC free article] [PubMed] [Google Scholar]
- Zuker M. Mfold web server for nucleic acid folding and hybridization prediction. Nucleic Acids Res. 2003;31:3406–3415. doi: 10.1093/nar/gkg595. [DOI] [PMC free article] [PubMed] [Google Scholar]
Associated Data
This section collects any data citations, data availability statements, or supplementary materials included in this article.
Supplementary Materials
Document S1. Supplemental Experimental Procedures and Figures S1–S7
Document S2. Article plus Supplemental Information