Rapid evolution of expression and regulatory divergences after yeast gene duplication (original) (raw)
Abstract
Although gene duplication is widely believed to be the major source of genetic novelty, how the expression or regulatory network of duplicate genes evolves remains poorly understood. In this article, we propose an additive expression distance between duplicate genes, so that the evolutionary rate of expression divergence after gene duplication can be estimated through phylogenomic analysis. We have analyzed yeast genome sequences, microarrays, and transcriptional regulatory networks, showing a >10-fold increase in the initial rate for both expression and regulatory network evolution after gene duplication but only an ≈20% rate increase in the early stage for protein sequences. Based on the estimated age distribution of yeast duplicate genes, we roughly estimate that the initial rate of expression divergence shortly after gene duplication is 2.9 × 10⁻⁹ per year, whereas the baseline rate for very ancient gene duplication is 0.14 × 10⁻⁹ per year. Relative expression rate tests suggest that the expression of duplicate genes tends to evolve asymmetrically, that is, the expression of one copy evolves rapidly, whereas the other one largely maintains the ancestral expression profile. Our study highlights the crucial role of early rapid evolution after gene/genome duplication for continuously increasing the complexity of the yeast regulatory network.
Keywords: Brownian-based modeling, gene expression evolution, gene/genome duplication, microarray, phylogenetic analysis
Although understanding the evolution of gene function is a long-standing central issue, evolutionary genetics has been primarily focused on DNA sequences (1). This paradigm has recently shifted dramatically because of the advance of postgenomics for generating important functional measures of genes on a very large scale (2–10). In particular, DNA microarray technology can simultaneously monitor the expression levels of thousands of genes across many experimental conditions or treatments, facilitating greatly the evolutionary study of gene regulation after gene duplication or speciation (e.g., refs. 2, 3, 5, 6, 10, and 11). For instance, we (6) showed a significant but weak coevolution fashion between cis-regulatory motif structure and expression profile after yeast gene duplication, raising an interesting question about the relative importance of cis- or transregulatory elements for the evolution of gene expression.
However, how the expression or regulatory network of duplicate genes evolves remains controversial (1–11), although gene or genome duplication has been widely accepted as the major source of genetic novelty (11–17). The aim of our study, by taking advantage of the substantial functional genomics data in Saccharomyces cerevisiae, is to test whether (i) accelerated expression and regulatory divergence occur shortly after gene duplication and (ii) expression evolution after gene duplication is asymmetric, that is, one duplicate has experienced substantial expression divergence, whereas the other one largely remains the ancestral expression pattern. To achieve these goals, an important step is to estimate the evolutionary rate of expression divergence, which requires an appropriate definition of evolutionary expression distance (E) within a biologically meaningful model.
Given a set of microarray experimental conditions, the expression difference between two genes can be measured by so-called standard metrics, e.g., the Euclidean metric, the Pearson correlation, or their variations (18, 19). Although these metrics have been widely used in microarray clustering or support vector machine analysis, an additional property, i.e., the additivity along the phylogenetic tree, is desirable for evolutionary study (1). In this article, we propose an evolutionary expression distance related to the square of the Euclidean metric and show it is additive under the statistical framework we developed (5). We then design a least-squares approach to mapping the pairwise expression distances onto the given phylogeny of the gene family and estimate the rate of gene expression divergence. The evolutionary rate of regulatory interaction is estimated for further testing the hypothesis of rapid regulatory evolution after gene duplication. Moreover, we develop a relative-rate test to study asymmetric expression evolution after gene duplication. All these methods are applied to the genome-wide gene families of yeast to explore the pattern of functional evolution after gene duplication.
Data and Methods
Functional Genomics Data. A total of 276 yeast microarray experiments were downloaded from an on-line database (genome-www.stanford.edu). As commonly suggested, we used the fold change after the normalization for representing the gene expression level (19). The yeast transcription factor (TF)–target gene interaction data (presented by the P value) were from ref. 20.
Phylogenetic Analysis and Duplication Time Estimation. The complete sequences of 43 genomes of bacteria, archaea, and S. cerevisiae were downloaded from the Clusters of Orthologous Groups (COG) database, where gene families are classified as COGs. Each COG requires at least one homologous gene in the major lineages, allowing us to date the age of yeast gene duplication. The phylogeny of each gene family (COG) was inferred from amino acid sequences by using the neighbor-joining method (21). After carefully excluding the potential lateral gene transfer events, we used several methods (6) to compute the relative duplication time, with the bacteria/yeast split as the time unit (≈1.4–2 billion years ago): (i) the linearized-tree method assuming a global molecular clock (22); (ii) the nearest calibration (15), phylogenetic analysis to determine whether a duplication event was before or after the yeast–Escherichia coli split and then estimating the (relative) age assuming a local clock; (iii) the simple distance ratio between the yeast duplicates and the yeast–E. coli; and (iv) the amino acid distance between duplicates used as a proxy for evolutionary time (10).
Phylogenetic Inference of Regulatory Interactions. After downloading the yeast regulatory interaction data (measured by the P value) from ref. 20, we developed a relational database to retrieve regulatory interactions for all yeast gene families. For each of 434 gene families with at least two yeast duplicates, evolutionary events (gain or loss) for regulatory interactions can be inferred by parsimony, given the inferred tree and the cutoff P value. For instance, at cutoff P = 0.001, as suggested by Lee et al. (20), we identified in total 1,358 evolutionary events of regulatory interactions.
Evolutionary Distance (E) for Expression Divergence. For any duplicate genes 1 and 2, let x_1_k and x_2_k be the expression levels, respectively, in the _k_th microarray experiment, k = 1,..., m. Let _x̄_1 and _x̄_2 be the means of expression, respectively. Then we define the evolutionary expression distance between genes 1 and 2 as follows:
 |
[1] |
|---|
In other words, the evolutionary expression distance is the centralized squared Euclidean metric that is normalized by the sample size.
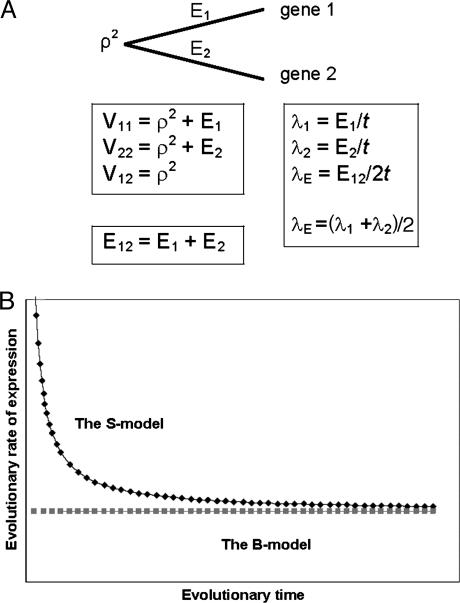
We have shown that the expression distance defined by Eq. 1 satisfies the additive requirement. The general proof will be published elsewhere, as illustrated here by the two-gene case (Fig. 1). Let _E_12 = E[_Ê_12] be the expectation of expression distance between gene 1 and gene 2, called the true expression distance. After directly applying the expectation operator E[.] to Eq. 1, one can show _E_12 = _V_11 + _V_22 -2 _V_12, where _V_12 is the expression covariance between genes 1 and 2, and _V_11 (or _V_22) the expression variance of gene 1 (or gene 2). On the other hand, according to the stochastic model for expression evolution along the phylogeny (5), the variance–covariance matrix of expression profiles is given by _V_11 = ρ2 +_E_1, _V_22 = ρ2 +_E_2, and _V_12 = ρ2, where ρ2 is the common variance component of the gene family, and _E_1 and _E_2 are the expression branch lengths. It is therefore straightforward to verify the additivity of _E_12, that is,
 |
[2] |
|---|
The additivity assures that, given the evolutionary time t between two duplicate genes, the evolutionary rate of expression divergence is given by λ_E_ = E_12/2_t, which is the average rate over two lineages, i.e., λ_E_ = (_E_1/t + E_2/t)/2 = (λ1 + λ2)/2, as shown in Fig. 1. For a large gene family, the additivity allows us to develop a least-squares method for mapping the pairwise expression distances onto the phylogeny, e.g., see ref. 23. Thus, the mean rate of expression divergence can be estimated by λ_E = ET/T, where ET is the sum of expression branch lengths, and T is the total evolutionary time of the gene family. The software geneexpression is available at http://xgu.zool.iastate.edu.
Fig. 1.
Illustration of models for expression divergence after gene duplication. (A) Schematic illustration for a rooted two-gene tree. _E_1 and _E_2 refer to the expression lengths associated with the branches after gene duplication; ρ2 refers to the common expression variance. The expression distance _E_12 is the sum of _E_1 and _E_2. (B) Schematic illustration for the time dependency of the evolutionary rate under the S model.
Biological Meaning of Expression Distance. Gu (5) developed a statistical framework for expression evolution under the Brownian process. This simplest B model assumes that the expression divergence of a gene family is mainly driven by small and additive genetic drifts (random effects), with a constant rate measured by σ2 or the mutational variance under the drift-mutation model of quantitative traits (24). In the two-gene case (Fig. 1_A_), the B model assures _E_1 = _E_2 = σ2 t. Hence, the expression distance is given by _E_12 = E_1 + E_2 = 2σ2_t, and the evolutionary rate of expression divergence equals to the mutational variance, i.e., λ_E = E_12/2_t = σ2. Consequently, the B model could be considered the neutral-evolution model of gene expression; in analogy, under the classical neutral model, the evolutionary rate of DNA sequence equals the mutation rate.
Moreover, Gu (5) studied several evolutionary mechanisms in which selection forces may be involved. For instance, under the dramatic-shift (S) model (punctuated-equilibrium), the expression branch lengths are  and
and  , where
  and
and  are the expression variances caused by the duplication-dependent dramatic shifts in both lineages, respectively. Under the S model, the expression distance turns out to be
  , resulting in λ_E_ = E_12/2_t = σ2 + S2/t, where
  . Therefore, the accelerated (time-dependent) rate of expression divergence may reflect the nonneutral fashion of expression divergence after gene duplication (Fig. 1_B_).
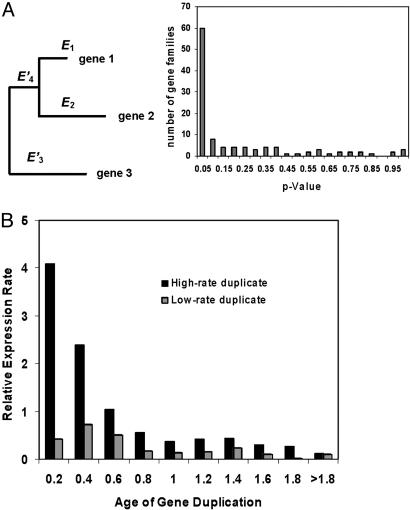
Relative Expression Rate Test. Similar to DNA sequence evolution (25–28), we implement the relative-rate test to examine whether the expression divergence is asymmetric after gene duplication, when an outgroup gene (gene 3) is available (Fig. 5_A_). The null hypothesis is _E_1 = _E_2, i.e., equal expression divergence after duplication (symmetric evolution). From the additivity of expression distance, i.e., _E_13 = _E_1 + _E_3, and _E_23 = _E_2 + _E_3, the relative rate test for gene expression is to compute the statistic
 |
[3] |
|---|
The biological interpretation of Δ_E_ can be illustrated under the S model. Because  and
and  , we have
  , i.e., to test which lineage may have more dramatic (duplication-dependent) expression shift. Under the null hypothesis, Δ_E_ = 0, the P value can be empirically calculated by the bootstrapping procedure. Therefore, the null hypothesis of symmetric expression evolution is rejected at the significance level α if P < α.
Fig. 5.
Relative-rate test for asymmetric evolution of expression divergence. (A) Schematic illustration for the relative expression rate test, whereas _E_3 = _E_3′ + _E_4′.(B) Histogram for the P values obtained from the bootstrapping in each individual test. (C) Expression rates for highly as well as lowly diverged copy after gene duplication, averaged over each time bin (0.2 unit), are plotted against total evolutionary time relative to the bacteria/yeast split.
Effects of Microarray Experimental Factors. Let σ2ε be the variance component of gene expression from the (nonbiological) experimental factors (dye effects, spot effects, random errors, etc.) (18, 19, 29). Consequently, the expectation of the expression distance defined by Eq. 1. turns out to be
 |
[4] |
|---|
That is, the expression distance, as well as the evolutionary rate of expression divergence, tends to be overestimated. Nevertheless, the relative-rate expression test in Eq. 3 is statistically not affected by the experimental factors; the facts  and
and  directly result in
  .
.
The ANOVA Model. We use the ANOVA model to account for various sources of expression variation in microarray data (29), which provides a rough estimate of the experimental variance σ2ε. For instance, we consider the cDNA microarrays during yeast sporulation. Let yijkg be the log-transformed expression intensity of gene g from array i = 1,...,7, dye j (j = 1 for green and 2 for red) at time point k = 1,...,7. The ANOVA model for yijkg can be written as follows
 |
[5] |
|---|
where μ is the overall mean. The error terms eijkg are independent and identically distributed with mean 0 and variance ε2. The array effects Ai account for mean expression differences of expression between arrays and the dye effects Dj for differences between the average signals from each dye. The time-point effects Tk account for overall differences in the time points. The gene effects Gg capture the average levels of expression for individual genes spotted on the arrays. The array-by-gene interactions (AG)ig account for the effect of the spot on array i for gene g. For example, some spots may be generally brighter than others due to variations in the slide or uneven washing. The spot effects account for such differences. Finally, the normalized interactions between genes and time points, (TG)kg, capture differences from overall averages that are attributable to the specific combination of time k and gene g.
Hence, the experimental variance σ2ε may include the dye effect Dj, the array-by-gene interactions (AG)ig, and the variance ε2 of error terms eijkg, because the standard normalization procedure may have largely erased the array effects Ai.
Results
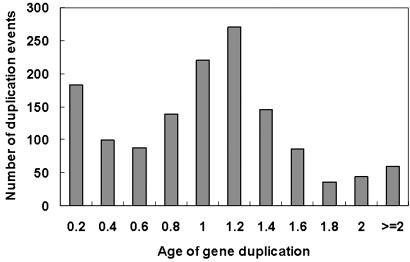
Age Distribution of Yeast Gene Duplications. We have studied 434 yeast (S. cerevisiae) gene families in the COG database (in total, 1,906 genes), consisting of 201 two-, 113 three-, 39 four-, 18 five- and 63 six-or-more-member gene families. For each gene family, we inferred the phylogenetic tree and estimated the age of each duplication event. The age distribution of 1,369 duplication events we identified is shown in Fig. 2, representing 41% yeast proteome in the COG database. The time scale used in our analysis was the divergence time between prokaryotes and eukaryotes, which is ≈1.4–2 billion years ago. We demonstrated that technical issues of time estimation have little effect on the shape of age distribution that reflects the general picture for the occurrence of gene duplications over long-time yeast evolution. Using amino acid distance as a proxy for duplication time gives virtually the same result (not shown).
Fig. 2.
Histogram for the estimated age distribution of yeast duplicates. The evolutionary time unit is defined by the time of the bacteria/yeast split, ≈2 billion years ago.
We noticed two peaks in the age distribution of yeast duplicates (Fig. 2). The recent tremendous increase of duplication events could well be explained by the yeast genome duplication hypothesis (a polyploidization event) that might have occurred ≈100 million years ago (13–14). In addition, there exists a very ancient peak for gene duplications that occurred around the divergence time between prokaryotes and eukaryotes. The age distributions from bacteria (_E. coli K_12) and archaea (Thermoplasma acidophilum) also show this very ancient component of duplicates (not shown). These observations together raise an interesting question about the role of gene duplications during the emergence of three major kingdoms.
Evolutionary Rate of Expression Divergence After Gene Duplication. For each of 434 yeast gene families with at least two duplicates, we estimated the expression distances (Eij) between any two duplicate genes i and j, based on 276 yeast microarray datasets. Given the inferred phylogeny from the multialignment of gene family, the total expression branch length (ET) was estimated by the least-squares mapping of expression distances on the topology. Because the total evolutionary time (T) of the gene family was obtained from the estimated duplication times (see above), we estimated the evolutionary rate (λ_E_ = ET/T) of expression divergence for each gene family.
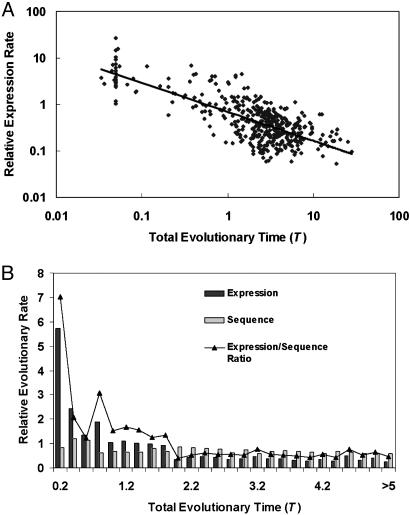
Overall, the mean rate among yeast gene families under study is 0.977 per time unit (the bacteria/yeast split); the 95% quantile (0.09–6.50) reveals a substantial variation of expression rates. If one further assumes the bacteria/yeast split was ≈2 billion years ago, the mean rate of expression divergence after yeast duplication turns out to be 0.49 × 10⁻⁹ per year. Interestingly, the evolutionary rate (λ_E_) of gene expression after duplication is time-dependent (Fig. 3_A_); the log-log regression (Fig. 3_A_) shows λ_E_ is negatively correlated with the total evolutionary time (T) of the gene family (R = -0.75, P value <10-8). Fig. 3_B_ shows that in the early stage, the mean initial rate of expression divergence would be as high as 5.8 per time unit, or 2.9 × 10⁻⁹ per year, which is >20-fold higher than the baseline expression rate (0.14 × 10⁻⁹ per year). Our finding supports the notion of rapid expression divergence shortly after gene duplication, which is much more dramatic than in the sequence evolution of duplicate genes (25–28). Indeed, only a moderate (≈20%) increase in the rate of protein sequence evolution is observed for young gene families (R = -0.18, P < 0.01). Consequently, the ratio of expression rate to protein sequence rate is high (≈7.1) for young duplicates and decreases with the evolutionary time; the average is ≈1.44 (Fig. 3_B_).
Fig. 3.
Rapid evolution of expression divergence shortly after gene duplication. Log-log regression (A) between the evolutionary rate (λ_E_) of gene expression and the total evolutionary time (T) of the gene family. (B) Evolutionary rate of gene expression and protein sequence, as well as the expression/sequence ratio, averaged over each bin (0.2 time unit), is plotted against T. The evolutionary time unit is defined by the time of bacteria/yeast split, ≈2 billion years ago.
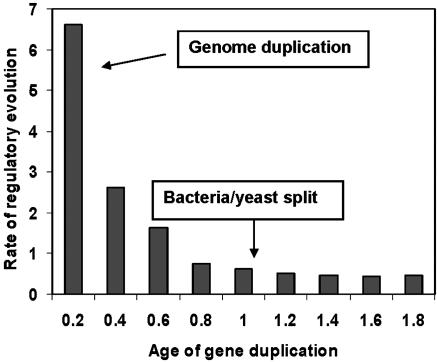
Evolutionary Rate of Regulatory Interaction Between TF Genes. Rapid expression divergence reflects rapid evolution of regulatory network in the early stage after gene duplication. We tested this prediction using TF–target gene interaction by large-scale chromatin immunoprecipitation (ChIP) experiments (hereafter, regulatory interactions) (20). The advantage of ChIP technology is that it detects the regulatory network without accurate identification of binding sites. We used parsimony to infer the evolutionary events of regulatory interactions. Because the root of the gene family tree is uncertain in many cases, we used turnover events (gain or loss) in our study (see Data and Methods). Then we estimated that the mean evolutionary rate (λ_R_) of regulatory interactions λ_R_ ≈ 0.722 per time unit, or 0.36 × 10⁻⁹ per year. Similar to the rate of expression divergence, we grouped duplicate genes with similar duplication age (with a bin of 0.2 time unit) and estimated the mean evolutionary rate for each group. As shown in Fig. 4, the regulatory evolution in the young duplicate group is almost 10-fold faster than in the ancient group. The null hypothesis of equal rate among age groups is highly rejected (P value <10-5). Note that we used the cutoff P = 0.001 as did Lee et al. (20), but the pattern remains virtually the same for P = 0.005 or P = 0.01 (not shown).
Fig. 4.
Evolutionary rate of regulatory interaction turnover, averaged over each bin (0.2 time unit), is plotted against age of gene duplication. The evolutionary time unit is defined by the time of bacteria/yeast split, ≈2 billion years ago.
Asymmetric Expression Evolution After Gene Duplication. The view of asymmetric evolution after gene duplication (25–28) predicts that only one duplicate copy has undergone rapid expression evolution shortly after gene duplication (high-rate expression divergence), whereas the other copy largely kept the ancestral pattern (low-rate expression divergence). We used the relative expression rate test to study 111 yeast duplicate gene pairs (Fig. 5_A_), whereas an out-group duplicate gene was determined by phylogenetic analysis with 43 complete genomes. Overall, 60 gene families (54%) show the null hypothesis (equal expression divergence, _E_1 = _E_2) is rejected at the 0.05 significance level, and 47 gene families (42%) at the 0.01 significance level. It has been recommended that a reasonable measure for type I error under multiple tests is the false discovery rate (FDR) (30). Given the histogram of the P values (Fig. 5_B_), we estimated FDR = 11.8% at the 0.05 significance level; that is, there are ≈60 × 11.8% ≈ 7 cases that could be false-positive. This result indicates that the expression evolution of duplicate gene pairs is more asymmetric than that of protein sequences, which is ≈30%, despite much controversy (25–28). We tentatively classified these duplicate genes into high (H) or low (L) expression-rate groups, respectively. Fig. 5_C_ shows that the mean expression rate in the H group is much higher in young duplicates, whereas that in the L group has no difference between young and ancient duplicates.
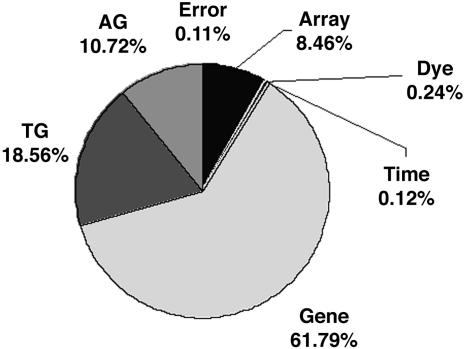
Expression Distance and Rate Corrected for Experimental Variance. One remaining question is whether our results could be affected by nonbiological experimental factors. We applied the ANOVA procedure to the yeast sporulation microarray data (31) to obtain a rough estimate of σ2ε. Fig. 6 shows the percentage of the sum of squares for each source. The mean of squares for the dye effect, Dj, the array-by-gene interactions (AG)ig, and the error terms, eijkg, is 0.031, 0.229, and 0.015, respectively, per gene. After assuming these are typical values for the current cDNA microarray procedure, we obtain σ2ε ≈ 0.031 + 0.229 + 0.015 = 0.275. We then recalculated the evolutionary rate of expression divergence after gene duplication. It showed that the mean initial rate of expression divergence now is down to 3.4 per time unit, or 1.7 × 10⁻⁹ per year, which is ≈41% lower than the original estimate. However, it is still >10-fold higher than the baseline expression rate. In other words, the relatively high level of experimental variance does not alter our main result.
Fig. 6.
Percentages of sum of squares for various factors under the ANOVA model, based on yeast sporulation microarray data (31).
Discussion
We conducted a genome-wide phylogenetic expression analysis after yeast gene duplication. Together, we conclude there is at least a 10-fold increase in the initial rate for both expression and regulatory evolution shortly after gene duplication, while only an ≈20% rate increase in the early stage for protein sequences. Moreover, relative expression rate tests suggest that the expression of duplicate genes tends to evolve asymmetrically; that is, the expression of one copy evolves rapidly, whereas the other one largely maintains the ancestral expression profile.
We have addressed several technical issues to examine whether our major conclusion might be affected. It is well known that time estimations from molecular data are not accurate (1). We therefore used several alternative dating approaches and found that the age distribution of yeast gene duplicates is generally robust. To investigate the effect of phylogeny inference, we selected 100 gene families (random sample) to infer the phylogenetic trees using parsimony and likelihood methods. The results from this random sample are very consistent with age distribution, as shown in Fig. 2. Nevertheless, the evolutionary rates of expression and regulatory interactions were calculated under alternative dating approaches, which were virtually identical to Figs. 3 and 4 (data not shown).
We recognized that the expression distance tends to be overestimated if some nonbiological experimental factors inherited in the microarray data have not been appropriately corrected (19, 29). In this sense, the estimated expression rate should be interpreted as up-bound. Notice that the potential crosshybridization among recent duplicates may cause our estimate to be more conservative. More advanced chip technology and statistically sound experimental design might provide an accurate estimate for the expression distance in the near future. Nevertheless, we have tried to reduce the noise inherent in the yeast microarray dataset we used in the current study. Using the ANOVA approach, we estimated roughly the experimental variance and concluded that rapid expression evolution is unlikely to be an artifact of nonbiological experimental factors. It should also be noted that the rate difference, which is fundamental for testing asymmetric expression after gene duplications, is fairly robust.
Our phylogenomic expression analysis suggests that the phylogeny of a gene family should be inferred from sequences rather than from microarray data for two reasons. First, it avoids the circular argument, and second, the microarray expression data are not suitable for tree making, because the rate is not only strongly time-dependent but also highly variable among lineages. Consequently, the correct percentage of tree making using expression profiles is very sensitive to model selection, as shown by our empirical and simulation studies. In other words, phylogenetic inference based on expression data tends to be misleading, because the evolution of expression is complicated.
Because the regulatory interaction data (20) were presented by the P value, we have to rely on the cutoff value to determine the status of TF gene regulation. The choice of cutoff should balance the false-positive and -negative rates, which may be arbitrary. In additional to P = 0.001, as suggested by Lee et al. (20), we tried several alternative cutoff values from P = 0.0001 to 0.01. Although, as expected, the number of regulatory interactions varies considerably, the rapid evolution of the pattern shortly after gene duplication (Fig. 4) is not sensitive to the cutoff value. Of course, it is desirable to develop a method without the help of the cutoff. It would also be interesting to determine how the functional divergence of TF protein sequences (32) could affect the TF-binding pattern. These problems may be addressed in future studies.
Acknowledgments
We are grateful to Xu Dongping for developing the software geneexpression used in this study. This work was supported by grants from the National Institutes of Health and the National Science Foundation of China Overseas Outstanding Young Investigator Award.
Author contributions: X.G. designed research; X.G., Z.Z., and W.H. performed research; X.G. contributed new reagents/analytic tools; Z.Z. and W.H. analyzed data; and X.G. wrote the paper.
Abbreviations: COG, Clusters of Orthologous Groups; TF, transcription factor.
References
- 1.Li, W. H. (1997) Molecular Evolution (Sinauer, Sunderland, MA).
- 2.Wagner, A. (2000) Proc. Natl. Acad. Sci. USA 97**,** 6579-6584. [DOI] [PMC free article] [PubMed] [Google Scholar]
- 3.Papp, B., Pál, C. & Hurst, L. D. (2003) Trends Genet. 19**,** 417-422. [DOI] [PubMed] [Google Scholar]
- 4.Gu, Z., Steinmetz, L. M., Gu, X., Scharfe, C., Davis, R. W. & Li, W.-H. (2003) Nature 421**,** 63-66. [DOI] [PubMed] [Google Scholar]
- 5.Gu, X. (2004) Genetics 167**,** 531-542. [DOI] [PMC free article] [PubMed] [Google Scholar]
- 6.Zhang, Z., Gu, J. & Gu, X. (2004) Trends Genet. 20**,** 403-407. [DOI] [PubMed] [Google Scholar]
- 7.Fraser, H. B., Hirsh, A. E., Steinmetz, L. M., Scharfe, C. & Feldman, M. W. (2002) Science 296**,** 750-752. [DOI] [PubMed] [Google Scholar]
- 8.Hirsh, A. E. & Fraser, H. B. (2001) Nature 411**,** 1046-1049. [DOI] [PubMed] [Google Scholar]
- 9.Wray, G. A., Hahn, M. W., Abouheif, E., Balhoff, J. P., Pizer, M., Rockman, M. V. & Romano, L. A. (2003) Mol. Biol. Evol. 20**,** 1377-1419. [DOI] [PubMed] [Google Scholar]
- 10.Gu, Z., Nicolae, D., Lu, H. H.-S. & Li, W.-H. (2002) Trends Genet. 18**,** 609-613. [DOI] [PubMed] [Google Scholar]
- 11.Gu, J. & Gu, X. (2003) Trends Genet. 19**,** 63-65. [DOI] [PubMed] [Google Scholar]
- 12.Ohno, S. (1970) Evolution by Gene Duplication (Springer, Berlin).
- 13.Wolfe, K. H & Shields, D. C. (1997) Nature 387**,** 708-713.9192896 [Google Scholar]
- 14.Kellis, M., Birren, B. W. & Lander, E. S. (2004) Nature 428**,** 617-624. [DOI] [PubMed] [Google Scholar]
- 15.Gu, X, Wang, Y. & Gu, J. (2002) Nat. Genet. 31**,** 205-209. [DOI] [PubMed] [Google Scholar]
- 16.Prince, V. E. & Pickett, B. F. (2002) Nat. Rev. Genet. 3**,** 827-837. [DOI] [PubMed] [Google Scholar]
- 17.Force, A., Lynch, M., Pickett, F. B., Amores, A., Yan, Y. & Postlethwait, J. (1999) Genetics 151**,** 1531-1545. [DOI] [PMC free article] [PubMed] [Google Scholar]
- 18.Eisen, M. B., Spellman, P. T., Brown, P. O. & Botstein, D. (1998) Proc. Natl. Acad. Sci. USA 95**,** 14863-14868. [DOI] [PMC free article] [PubMed] [Google Scholar]
- 19.Quackenbush, J. (2001) Nat. Rev. Genet. 2**,** 418-427. [DOI] [PubMed] [Google Scholar]
- 20.Lee, T., Rinaldi, N. J., Robert, F., Odom, D. T., Bar-Joseph, Z., Gerber, G. K., Hannett, N. M., Harbison, C. T., Thompson, C. M., Simon, I., et al. (2002) Science 298**,** 799-804. [DOI] [PubMed] [Google Scholar]
- 21.Saitou, N. & Nei, M. (1987) Mol. Biol. Evol. 4**,** 406-425. [DOI] [PubMed] [Google Scholar]
- 22.Takezaki, N., Rzhetsky, A. & Nei, M. (1995) Mol. Biol. Evol. 12**,** 823-833. [DOI] [PubMed] [Google Scholar]
- 23.Rzhetsky, A. & Nei, M. (1993) Mol. Biol. Evol. 10**,** 1073-1095. [DOI] [PubMed] [Google Scholar]
- 24.Lynch, M. & Hill, W. G. (1986) Evolution (Lawrence, Kans.) 40**,** 915-935. [DOI] [PubMed] [Google Scholar]
- 25.Kondrashov, F. A., Rogozin, I. B., Wolf, Y. I. & Koonin, E. V. (2002) Genome Biol. 3**,** research0008.1-research0008.9. [DOI] [PMC free article] [PubMed] [Google Scholar]
- 26.Zhang, P., Gu, Z. & Li, W.-H. (2003) Genome Biol, 4**,** R56. [DOI] [PMC free article] [PubMed] [Google Scholar]
- 27.Lynch, M. & Conery, J. S. (2000) Science 290**,** 1151-1155. [DOI] [PubMed] [Google Scholar]
- 28.Conant, G. C. & Wagner, A. (2003) Genome Res. 13**,** 2052-2058. [DOI] [PMC free article] [PubMed] [Google Scholar]
- 29.Kerr, M. K. & Churchill, G. A. (2001) Proc. Natl. Acad. Sci. USA 98**,** 8961-8965. [DOI] [PMC free article] [PubMed] [Google Scholar]
- 30.Storey, J. D. & Tibshirani, R. (2003) Proc. Natl. Acad. Sci. USA 100**,** 9440-9445. [DOI] [PMC free article] [PubMed] [Google Scholar]
- 31.Chu, S., DeRisi, J., Eisen, M., Mulholland, J., Botstein, D., Brown, P. O. & Herskowitz, I. (1998) Science 282**,** 699-705. [DOI] [PubMed] [Google Scholar]
- 32.Gu, X. (1999) Mol. Biol. Evol. 16**,** 1664-1674. [DOI] [PubMed] [Google Scholar]
