The human cytoplasmic dynein interactome reveals novel activators of motility (original) (raw)
Abstract
In human cells, cytoplasmic dynein-1 is essential for long-distance transport of many cargos, including organelles, RNAs, proteins, and viruses, towards microtubule minus ends. To understand how a single motor achieves cargo specificity, we identified the human dynein interactome by attaching a promiscuous biotin ligase (‘BioID’) to seven components of the dynein machinery, including a subunit of the essential cofactor dynactin. This method reported spatial information about the large cytosolic dynein/dynactin complex in living cells. To achieve maximal motile activity and to bind its cargos, human dynein/dynactin requires ‘activators’, of which only five have been described. We developed methods to identify new activators in our BioID data, and discovered that ninein and ninein-like are a new family of dynein activators. Analysis of the protein interactomes for six activators, including ninein and ninein-like, suggests that each dynein activator has multiple cargos.
DOI: http://dx.doi.org/10.7554/eLife.28257.001
Research Organism: Human
Introduction
Microtubules and their motors are the primary means of long-distance intracellular transport in humans and many other eukaryotic organisms. Mutations in the transport machinery cause both neurodevelopmental and neurodegenerative diseases (Lipka et al., 2013). Microtubules are polar structures, with dynamic ‘plus’ ends typically found near the cell periphery and ‘minus’ ends anchored in internal microtubule organizing centers. Dynein motors move towards the microtubule minus end, whereas most kinesins move in the opposite direction. The human genome contains 15 motor domain-encoding dynein genes (Vale, 2003), but only cytoplasmic dynein-1 (DYNC1H1; ‘dynein’ hereafter) is involved in long-distance, minus-end-directed transport in the cytoplasm. Dynein transports dozens of distinct cargos including organelles, ribonucleoprotein complexes, proteins and viruses (Kardon and Vale, 2009). A major outstanding question in the field is to understand how dynein achieves temporal and spatial specificity for cargo interactions.
Most cytoskeletal motors that transport cargos over long distances in cells are processive motors, capable of taking multiple steps along their track. While dimers of the S. cerevisiae dynein heavy chain move processively in the absence of cofactors (Reck-Peterson et al., 2006), mammalian dynein requires the 1.1 MDa dynactin complex and a coiled coil-containing activator (‘activator’ hereafter) for robust processive motility (McKenney et al., 2014; Schlager et al., 2014; Trokter et al., 2012). Activators have a second function; they also link dynein/dynactin to cargo (Figure 1A) (Cianfrocco et al., 2015).
Figure 1. Validation of BioID-tagged dynein and dynactin subunits.
(A) A cartoon of the dynein/dynactin/activator complex based on cryo-EM structural studies (Chowdhury et al., 2015; Urnavicius et al., 2015) with proteins drawn to scale. (B) BioID-3×FLAG or IC2-BioID-3×FLAG were immunoprecipitated from stable HEK-293 cell lines using α-FLAG antibodies and eluted using FLAG peptide. A Sypro Red stained SDS-PAGE gel of the immunoprecipitates is shown. (C) MS/MS analysis of the immunoprecipitates from (B). Core dynein subunit dNSAF (distributed normalized spectral abundance factor) (Zhang et al., 2015) values are displayed as a gray scale heat map. (D) Immunoprecipitations were performed as in (B) with mild (M) or harsh (H) detergent conditions (see Materials and methods). Harsh detergent conditions disrupt IC2 incorporation into the dynein/dynactin complex as shown by Western blots with α-HC and α-p150 (dynactin subunit) antibodies. (E) IC2-BioID-3×FLAG was immunoprecipitated from a stable HEK-293 cell line using α-FLAG antibodies and fractionated by gel filtration FPLC chromatography. Fractions were analyzed by Western blotting with α-FLAG and α-HC antibodies. The signal intensity for IC2-BioID-3×FLAG (magenta) and HC (gray) in each fraction is plotted as a fraction of the summed intensity of all fractions. The elution volumes of molecular weight standards are indicated (dashed lines). (F) BioID-3×FLAG or p62-BioID-3×FLAG were immunoprecipitated from stable HEK-293 cell lines using α-FLAG antibodies. Immunoprecipitations were performed with mild (M) or harsh (H) detergent concentrations. Harsh detergent conditions disrupt p62 incorporation into the dynein/dynactin complex. (G) p62-BioID-3×FLAG was immunoprecipitated from a stable HEK-293 cell line using α-FLAG antibodies and analyzed as described in (E) with α-FLAG and α-p150 antibodies. The signal intensities for p62-BioID-3×FLAG (magenta) and p150 (gray) are plotted as a fraction of the summed intensity of all fractions. The elution volumes of molecular weight standards are indicated (dashed lines).
DOI: http://dx.doi.org/10.7554/eLife.28257.002

Figure 1—figure supplement 1. Schematic of the dynein/dynactin/activator complex.

Dynein subunits are uniquely colored except for the light chains (green). Dynactin subunits other than Arp1 (light gray) and actin (dark gray) are colored light blue. The dynactin Arp1 filament (light gray) is indicated with a single label. A coiled coil activator (e.g. BICD2) is depicted and colored yellow. The corresponding gene names, common names, and abbreviations are listed below.
Currently, there are five proteins that likely function as dynein activators. The activators BICD2 and HOOK3 have been definitively shown, using purified components, to activate dynein/dynactin motility in vitro (McKenney et al., 2014; Schlager et al., 2014; Schroeder and Vale, 2016). HOOK1, Spindly (SPDL1), and RAB11FIP3 are also likely activators based on their ability to co-purify and co-migrate with dynein/dynactin in in vitro motility assays (McKenney et al., 2014; Olenick et al., 2016). Other proteins may be activators based on their homology to BICD and HOOK family activators, including BICD1, BICDL1, BICDL2, and HOOK2 (Hoogenraad and Akhmanova, 2016; Simpson et al., 2005). Known and predicted activators all contain long stretches of predicted coiled coil, but share very little sequence homology across activator families (Gama et al., 2017); currently it is not possible to identify activators based on sequence alone. Central to understanding how dynein performs so many tasks is to determine if it has additional activators.
Here we used new proteomics tools to address major unanswered questions about dynein-based transport. What is the dynein protein interactome? How many activators does dynein have in a given cell type? Which cargos do activators link to? Does each cargo have its own activator? To answer these questions, we used proximity-dependent labeling in living human cells. Traditionally, protein-protein interaction discovery using immunoprecipitation followed by mass spectrometry has been confined to relatively stable interactions. However, recently developed methods such as BioID (Roux et al., 2012) and APEX (Rhee et al., 2013) allow the discovery of weak and short-lived interactions in living cells, in addition to more stable interactions. The BioID method relies on expressing a protein of interest fused to a promiscuous biotin ligase that releases activated biotin-AMP in the absence of substrate (Roux et al., 2012). Biotin-AMP covalently modifies the primary amines of proximal proteins within a nanometer-scale labeling radius (Kim et al., 2014). Biotinlyated proximal proteins are identified by isolation with streptavidin followed by tandem mass spectrometry (MS/MS). For example, this approach has been used to map protein interactions at human centrosomes and cilia (Gupta et al., 2015), focal adhesions (Dong et al., 2016) and the nuclear pore (Kim et al., 2014).
Using these methods we describe the human dynein/dynactin interactome. We also developed methods to identify dynein activators within these datasets and identified two new activators that constitute a novel activator family. Finally, to determine the candidate cargos of six distinct activators we elucidated their individual interactomes. Our results suggest that each dynein activator has multiple cargos. We propose that activators provide the first layer of defining cargo specificity for cytoplasmic dynein, but that refinement of cargo selection will require additional factors.
Results
Identification of the dynein/dynactin interactome
To identify the human dynein/dynactin interactome, we began by biochemically characterizing dynein and dynactin subunits fused to BioID that were stably expressed in HEK-293 cells. The 1.4 MDa dynein holoenzyme is composed of dimers of heavy chains (HC; DYNC1H1), intermediate chains (IC1 or IC2; DYNC1I1 and 2), light intermediate chains (LIC1 or LIC2; DYNC1LI1 and 2), and three types of light chains: Roadblock (RB; DYNLRB1 and 2), LC8 (DYNLL1 and 2), and TCTEX (DYNLT1 and 3) (Figure 1A and Figure 1—figure supplement 1). We first generated a cell line stably expressing IC2 with C-terminal BioID G2 (‘BioID’ here) (Kim et al., 2016b) and 3×FLAG tags. Immunoprecipitations confirmed that IC2-BioID was incorporated into the dynein/dynactin complex (Figure 1B—E). Gel filtration analysis of IC2 immunoprecipitates revealed that 51% of the BioID-tagged IC2 was incorporated into the dynein complex (Figure 1E). We obtained similar results when BioID was fused to the C-terminus of the p62 dynactin subunit. The stably expressed p62-BioID-3×FLAG subunit incorporated into the dynactin complex as shown by immunoprecipitations (Figure 1F), and gel filtration analysis of these immunoprecipitatates revealed that 47% was incorporated into the high molecular weight dynactin complex (Figure 1G).
To perform BioID experiments, we lysed cells in the presence of additional detergents (see Materials and methods), which disrupt both the dynein and dynactin complexes (Figure 1D and F). Disruption of the complexes makes it likely that our BioID experiments identified only proximal proteins that were modified with biotin prior to cell lysis. All BioID experiments with tagged dynein or dynactin subunits were performed in quadruplicate using a label-free quantitative proteomics approach to calculate the enrichment of each identified protein relative to a soluble BioID alone control (Figure 2A) (Zhang et al., 2015). ‘Hits’ were proteins with greater than 3-fold enrichment and p-values greater than 0.05 relative to the control. We first characterized the IC2 subunit of dynein, which is known to be centrally located within the tripartite dynein/dynactin/activator complex based on cryo-electron microscopy (cryo-EM) structural studies (Figure 1A) (Chowdhury et al., 2015; Urnavicius et al., 2015). Our IC2 BioID dataset identified all dynein subunits, as well as a number of dynactin subunits (Figure 2B—D and Supplementary files 1 and 2). In addition, the dataset contained the known activators BICD2, HOOK1, and HOOK3, as well as BICD1, a homolog of BICD2 that is a likely activator (Figure 2D and Supplementary files 1 and 2). The only known dynein activators that we did not identify were Spindly and RAB11FIP3. Spindly regulates mitotic-specific dynein functions in human cells (Chan et al., 2009; Gassmann et al., 2010), likely the reason we did not identify it in an unsynchronized cell population. RAB11FIP3 is poorly expressed in HEK-293T cells (Huttlin et al., 2015) (Table 1). These experiments show that the dynein IC is well positioned within the dynein/dynactin/activator complex for the BioID-based identification of activators.
Figure 2. BioID with the dynein IC reports on activated dynein/dynactin/activator complexes in living human cells.

(A) BioID experimental design. For each stably expressed BioID-tagged subunit reported in this study, quadruplicate samples were prepared, analyzed, and compared to a quadruplicate BioID only control. Fold enrichment was calculated as the ratio of dNSAF between the BioID-tagged subunit and the BioID control. (B) Biotinylated proteins were isolated from cells stably expressing either IC2-BioID or BioID by streptavidin affinity purification. A Sypro Red stained SDS-PAGE gel is shown. (C) MS/MS analysis of the immunoprecipitates from (B). Core dynein subunit dNSAF (Zhang et al., 2015) values are displayed as a heat map. (D) A volcano plot showing enrichment versus significance of proteins identified in IC2-BioID experiments relative to control (BioID alone) experiments. A quadrant (dashed magenta line) bounded by a p-value of 0.05 and 3-fold enrichment contained dynein (dark blue) and dynactin (light blue) subunits, as well as the known activators BICD2, HOOK1, and HOOK3, and the candidate activator BICD1 (yellow).
DOI: http://dx.doi.org/10.7554/eLife.28257.004
Table 1.
Total protein expression levels of dynein and dynactin subunits, and activators or candidate activators or adaptors in HEK-293T cells. The number of peptides or phosphopeptides from HEK-293T cells (Huttlin et al., 2015) is shown. Activators or candidate activators identified in our secondary screen are highlighted in bold.
DOI: http://dx.doi.org/10.7554/eLife.28257.005
| Protein | Peptides | Phospho-peptides |
|---|---|---|
| Dynein subunits | ||
| DYNC1H1 | 3395 | 9 |
| DYNC1I1 | 5 | 1 |
| DYNC1I2 | 281 | 76 |
| DYNC1LI1 | 499 | 179 |
| DYNC1LI2 | 130 | 29 |
| DYNLT1 | 44 | 0 |
| DYNLT3 | 15 | 0 |
| DYNLRB1 | 94 | 0 |
| DYNLRB2 | Not present | |
| DYNLL1 | 248 | 0 |
| DYNLL2 | 168 | 0 |
| Dynactin subunits | ||
| DCTN1 (p150) | 538 | 0 |
| DCTN2 (p50) | 338 | 13 |
| DCTN3 (p22) | 67 | 0 |
| DCTN4 (p62) | 152 | 0 |
| DCTN5 (p25) | 28 | 0 |
| DCTN6 (p27) | 29 | 0 |
| ACTR1A (Arp1) | 354 | 0 |
| ACTR1B (Arp1) | 222 | 0 |
| ACTR10 (Arp11) | 118 | 2 |
| CAPZA1 | 423 | 1 |
| CAPZA2 | 194 | 0 |
| CAPZB | 387 | 0 |
| Activators or candidate activators | ||
| BICD1 | 35 | 0 |
| BICD2 | 151 | 6 |
| BICDL1 | not present | |
| BICDL2 | not present | |
| HOOK1 | 183 | 13 |
| HOOK2 | 57 | 2 |
| HOOK3 | 130 | 0 |
| CCDC88A (girdin) | 247 | 51 |
| CCDC88B (gipie) | not present | |
| CCDC88C (daple) | 55 | 17 |
| SPDL1 (CCDC99) | 107 | 0 |
| RAB11FIP3 | 4 | 2 |
| NIN | 114 | 20 |
| NINL | 8 | 5 |
| TRAK1 | 17 | 8 |
| TRAK2 | 3 | 1 |
| HAP1 | not present | |
| RILP | not present |
To further explore the ability of BioID to report on the spatial organization of the dynein/dynactin/activator complex, we tagged additional dynein and dynactin subunits with BioID. Specifically, we generated five additional HEK-293 cell lines stably expressing BioID fused to the IC1, LIC1, LIC2, RB1, and TCTEX1 dynein subunits and analyzed these along with the tagged dynein IC2 and dynactin p62 subunits. Each BioID fusion protein incorporated into their respective complexes based on their ability to co-immunoprecipitate with dynein and dynactin (Figure 3A and B). Validating our approach, a protein-protein interaction network consisting of the hits shared between BioID-tagged subunits revealed that 13 of 20 hits present in three or more datasets were dynein/dynactin subunits and activators (Figure 3—figure supplement 1 and Supplementary file 3). Further validation of our approach came from the presence of T-complex and prefoldin subunits as IC-specific hits (Figure 3—figure supplement 1), as prefoldin is a T-complex co-chaperone, and T-complex has been shown to interact with newly synthesized ICs (Özdemir et al., 2016; Vainberg et al., 1998).
Figure 3. BioID reports on the spatial organization of the dynein/dynactin/activator complex.
(A and B) Dynein (IC1, IC2, LIC1, LIC2, RB1, TCTEX1) and dynactin (p62) subunits tagged with BioID-3×FLAG were immunoprecipitated (for 16 hr in A or 2 hr in B) from stable HEK-293 cell lines using α-FLAG antibodies. All subunits incorporated into the dynein/dynactin complex based on Western blots with α-HC and α-p150 antibodies. (C) BioID experiments were performed with cells expressing the indicated dynein and dynactin subunits (magenta and magenta arrows). Other dynein and dynactin subunits enriched in the BioID experiments are shaded light gray (2–3 fold) or dark gray (≥3 fold), p<0.05 (Student’s two-tailed t-test).
DOI: http://dx.doi.org/10.7554/eLife.28257.006

Figure 3—figure supplement 1. Enriched and significant hits from dynein and dynactin BioID datasets were used to construct a protein-protein interaction network.

Large spheres represent BioID-tagged subunits (color coded according to a schematic of the dynein/dynactin complex, bottom right). Hits (small spheres) specific to a subunit family, color-coded according to their respective subunits: LCs (green), ICs (magenta) and LICs (orange). Gray spheres (‘two datasets’) and white spheres (‘three or more datasets’) represent hits enriched in two or three separate datasets, respectively. The protein names corresponding to white spheres are listed, right. Dynein and dynactin subunits, and activators are numbered; other hits are indicated with letters. Asterisk denotes hits detected in three different subunit classes (e.g. LICs/ICs/p62). Lines connecting spheres (edges) are color coded according to their respective datasets. For this figure enrichment is ≥3 fold, significance is p<0.05, Student’s two-tailed t-test; and average spectral counts are ≥2.
Analyses of the dynein/dynactin hits enriched in each subunit dataset were also consistent with recent structural studies (Figure 3C) (Chowdhury et al., 2015; Urnavicius et al., 2015). IC1 and IC2 BioID samples detected more dynactin subunits than either LIC1 or 2, consistent with the dynein LIC being further away from dynactin compared to the IC (Figure 3C). With respect to activators, we found that the IC1, LIC1 and LIC2 dynein subunits and the p62 dynactin subunit identified dynein activators (Figure 3C and Supplementary files 1 and 3). This finding is consistent with the current structural model of the dynein/dynactin/activator complex (Chowdhury et al., 2015; Urnavicius et al., 2015). Thus, BioID provides spatial information about the large dynein complex, which is capable of moving in the cytoplasm. Importantly, these results also show that BioID experiments with the dynein IC and LIC subunits and dynactin p62 subunit can be used to identify activators, providing a method to discover dynein activators in other cell types or tissues.
Ninein and ninein-like constitute a new family of dynein activators
To identify novel dynein activators in the dynein/dynactin interactome, we performed a secondary screen (Figure 4A). Because all known activators contain long stretches of coiled coil (Figure 4B), we pooled datasets with known activators present (IC1, IC2, LIC1, LIC2, and p62) and selected a set of proteins with predicted coiled coils of at least 100 amino acids. We then expressed each predicted coiled coil domain tagged with GFP and 3×FLAG in HEK-293 cells (Figure 4—figure supplement 1). A hallmark of known activators is their ability to co-immunoprecipitate dynein and dynactin (McKenney et al., 2014; Olenick et al., 2016). Four proteins analyzed in our secondary screen, ninein (NIN), ninein-like (NINL), daple (CCDC88C) and girdin (CCDC88A), co-immunoprecipitated dynein and dynactin, as did our positive controls BICD2 and HOOK3 (Figure 4C and D and Figure 4—figure supplement 1). NIN was identified in the IC1 and IC2 BioID datasets, NINL and daple in the IC2 BioID dataset, and girdin in the LIC1 dataset (Supplementary file 1). Some construct optimization was necessary to determine the dynein/dynactin interacting region of each candidate activator and we used the literature to guide this process (Casenghi et al., 2005; Schroeder and Vale, 2016) (Figure 4C and D and Figure 4—figure supplement 2A).
Figure 4. A secondary screen identifies candidate activators of dynein/dynactin motility.
(A) A schematic of our secondary screen. (B) Location of predicted coiled coils (rectangles) in known and candidate dynein/dynactin activators. (C, D) Candidate and known (BICD2 and HOOK3) activators tagged with 3×FLAG were immunoprecipitated with α-FLAG antibodies from HEK-293 cells. Western blots with α-HC and α-p150 antibodies were used to determine which proteins co-immunoprecipitated dynein and dynactin. (E—H) The candidate NIN (1-693) and NINL (1-702) activators, as well as the known BICD2 (1–422) and HOOK3 (1–552) activators were tagged with GFP and 3×FLAG and were immunoprecipitated with α-FLAG antibodies from HEK-293 cells. The motility of immunoprecipitated dynein/dynactin/activator complexes was monitored by GFP fluorescence using TIRF microscopy. Kymographs (left) and velocity histograms (right) with mean velocity (± S.D.) shown, n is greater than 102. Data shown is analyzed from one technical replicate, although two technical replicates were collected for each activator and displayed similar trends.
DOI: http://dx.doi.org/10.7554/eLife.28257.008

Figure 4—figure supplement 1. Candidate and known (BICD2 and HOOK3) activators were tagged with 3×FLAG and immunoprecipitated with α-FLAG antibodies from HEK-293 cells.

Western blots with α-HC and α-p150 antibodies were used to determine which proteins co-immunoprecipitated dynein and dynactin.
Figure 4—figure supplement 2. (A) The amino acid sequences for HOOK1, HOOK2, HOOK3 and two HOOK-related proteins (daple and girdin) were downloaded from Uniprot and aligned using Clustal Omega.

A region containing the HOOK3 (1–552) C-terminal truncation point is displayed and the residue in each protein equivalent to HOOK3 (1–552) is indicated. (B) As a control for the experiments in Figure 4E—H, GFP-3×FLAG was immunoprecipitated with an α-FLAG antibody from HEK-293 cells. No moving GFP signal was detected on microtubules. (C) The percentage of processive, diffusive and non-motile runs (see Materials and methods) in single-molecule motility assays (as described in Figure 4E–H) was analyzed for NIN (1-693), NINL (1-702), girdin (1-542) and daple (1-545) and compared to the known activators BICD2 (1–422) and HOOK3 (1–552).
To determine whether these candidate activators were part of activated dynein/dynactin complexes, we next performed in vitro single-molecule motility assays. We immunoprecipitated GFP-tagged BICD2 (aa 1–422), HOOK3 (aa 1–552), NIN (aa 1–693), NINL (aa 1–702), daple (aa 1–545) and girdin (aa 1–542) from HEK-293 cells and observed the motility of any co-purifying dynein and dynactin on microtubules using total internal reflection fluorescence (TIRF) microscopy. Our positive controls, BICD2 and HOOK3, exhibited robust processive motility, as did NIN and NINL (Figure 4E–H). In contrast, daple and girdin showed only a very modest ability to isolate activated dynein/dynactin complexes (Figure 4—figure supplement 2B,C). Because reconstituted purified dynein and dynactin occasionally show processive runs in the absence of an activator (McKenney et al., 2014; Schlager et al., 2014), we cannot yet conclude if daple and girdin are bona fide dynein activators.
The gold standard assay for dynein activators is to reconstitute dynein/dynactin/activator motility from purified components (McKenney et al., 2014; Schlager et al., 2014). To this end, we purified dynein and dynactin individually from HEK-293 cell lines stably expressing either IC2 or p62 tagged with SNAP or Halo tags (for fluorophore labeling) and 3×FLAG (for purification) (Figure 5A and Figure 5—figure supplement 1A). The coiled coil domains of BICD2, NIN, and NINL were tagged with GFP and purified from E. coli (Figure 5—figure supplement 1A). After reconstituting the complexes, we used near-simultaneous three-color TIRF microscopy to visualize the motility of single dynein/dynactin/activator complexes on microtubules. As expected, BICD2 activated and co-migrated with processively moving dynein and dynactin (Figure 5B). Both NIN and NINL also activated and co-migrated with moving dynein/dynactin complexes (Figure 5C and D). In the absence of an activator dynein/dynactin is largely stationary, with some diffusive and rare processive runs observed (Figure 5E and Figure 5—figure supplement 1B). Together, our results show that the BioID method can identify dynein activators, including the members of a new family of activators we discovered here: NIN and NINL.
Figure 5. NIN and NINL are novel activators of dynein/dynactin motility.
(A) A schematic of the components added to the single-molecule motility assay. Dynein (IC2-TMR; yellow star), dynactin (p62-Atto647; red star) and GFP-tagged (green spheres) activators (BICD2) or candidate activators (NIN and NINL) were purified separately, mixed, and the motility of the complex along microtubules was monitored by nearly simultaneous three-color TIRF microscopy. (B-E ).ymographs of each imaging channel (left) and velocity histograms (right) with mean velocity (± S.D.) are shown, n is greater than 146. NIN had a slower velocity in this assay compared to Figure 4G. This could be due to the lack of post-translational modifications in proteins expressed in E. coli; future work will be required to understand this. Data shown is analyzed from one technical replicate, although two technical replicates were collected for each activator and displayed similar trends.
DOI: http://dx.doi.org/10.7554/eLife.28257.011

Figure 5—figure supplement 1. Purification of dynein, dynactin and activators.
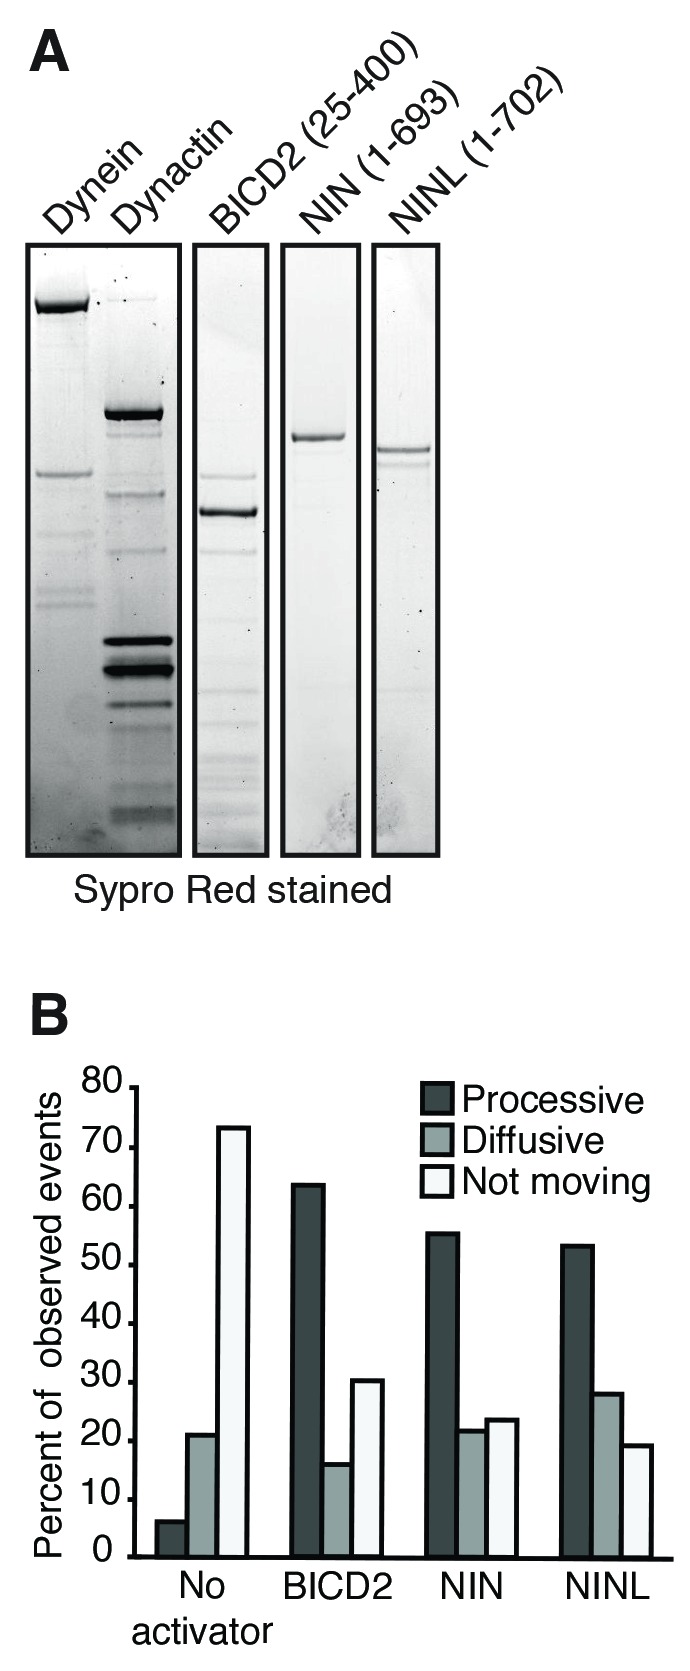
(A) Dynein (IC2-SNAP-3×FLAG), dynactin (p62-Halo-3×FLAG) and the activators BICD2 (25–400), NIN (1-693) and NINL (1-702) (GFP-activator-Strep tag) were separately purified and used for the motility assays shown in Figure 5. An SDS-PAGE gel stained with Sypro Red shows the purification of each component. (B) The percentage of processive, diffusive and non-motile events in single-molecule motility assays (as described in E–G) was analyzed.
Identification of the interactomes of six dynein activators
A major goal in the transport field is to determine the molecular rules that govern cargo recognition and specificity. This is especially critical for dynein, which moves all microtubule minus-end-directed cargos in the cytoplasm. How many cargos does each activator recognize? Does each activator allow dynein/dynactin to recognize a specific subset of cargo, or is there overlap in the number of activators that can recognize any given cargo? To begin to address these questions, and to provide a starting point for future exploration of activator-cargo interactions, we used BioID to identify the interactomes of six dynein activators. We made both N- and C-terminal BioID fusions with each activator because, for the known activators BICD2 and HOOK3, their N-termini interact with dynein/dynactin and their C-termini bind to cargos or cargo adaptor proteins (Cianfrocco et al., 2015). We generated HEK-293 cell lines stably expressing full-length BICD1, BICD2, HOOK1, HOOK3, NIN, and NINL with BioID tags at either their N- or C-termini, and used MS/MS to detect activator proximal proteins that had been biotinylated in living cells from each cell line (Figure 6A and Supplementary files 1 and 4). As with our earlier experiments, we used detergent conditions (see Materials and methods) that made it likely we only identified proteins that were directly biotinylated and considered hits to be proteins with greater than 3-fold enrichment, p-values greater than 0.05 relative to a soluble BioID control, and average spectral counts greater than two.
Figure 6. Dynein activators have distinct proteomes.
(A) Location of predicted coiled coils in dynein activators, with minimal activating regions shown (orange rectangles). (B) Enriched and significant hits from N- and C-terminal datasets of six activators were used to construct two separate protein-protein interaction networks. Hits specific to an activator family (color-coded according to their respective activators), and hits shared between activator families (HOOK/BICD, purple; BICD/NIN, yellow; NIN/HOOK, cyan) are shown. White spheres (‘3-family’) represent hits enriched in at least one activator from each family. For this figure enrichment is ≥3 fold, significance is p<0.05, Student’s two-tailed t-test; and average spectral counts are ≥2. The location of dynein and dynactin subunits and select hits discussed in the text are indicated. We note that we identified BICD1 in our BICD2 datasets and vice versa (Supplementary files 1 and 4). The same was true for HOOK1 and HOOK3, but not for NIN and NINL (Supplementary files 1 and 4). HOOK proteins have been shown to heterodimerize (Xu et al., 2008), whereas heterodimerization between BICD proteins has not been reported. (C) The number of total, unique (occurring in a single activator N- or C-terminal dataset), and shared (occurring in multiple activator N- or C-terminal datasets) hits for individual activator N- and C-termini are shown.
DOI: http://dx.doi.org/10.7554/eLife.28257.013

Figure 6—figure supplement 1. An interaction map of the N- and C-terminal activator datasets combined.

Enriched and significant hits from the combined N- and C-terminal datasets of six activators were used to construct a single protein-protein interaction network. Hits (small spheres) specific to an activator family (color-coded according to their respective activators), and hits shared between activator families (HOOK/BICD, purple; BICD/NIN, yellow; NIN/HOOK, cyan) are shown. White spheres (‘3-family’) represent hits enriched in at least one activator (NT or CT) from each family. Lines connecting spheres (edges) are color coded according to activator family and termini (NT = thin, CT = thick). The regions encompassing activator family CT-specific overlap are indicated with their respective n. The number of unique hits for each dataset is represented as a gray circle that is scaled according to the number of hits and the number of hits is shown. For this figure enrichment is ≥3 fold, significance is p<0.05, Student’s two-tailed t-test; and average spectral counts are ≥2. The location of dynein and dynactin subunits and select hits discussed in the text are indicated.
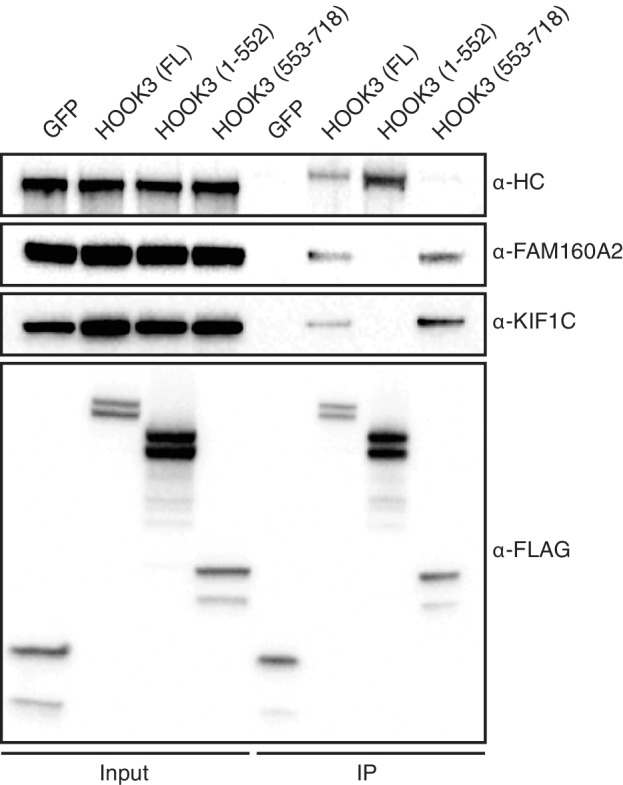
Figure 6—figure supplement 2. KIF1C is a novel HOOK3-interacting protein.
sfGFP-3×FLAG and full length (FL) HOOK3, HOOK3 (1–552), and HOOK3 (553–718) all tagged with sfGFP and 3×FLAG were immunoprecipitated with α-FLAG antibodies from transiently transfected HEK-293T cells. Western blots with α-HC, α-FAM160A2, α-KIF1C, and α-FLAG antibodies were used to determine which proteins co-immunoprecipitated with each HOOK3 construct.
BICD1 and 2, the best structurally characterized dynein activators, are known to be elongated structures (Liu et al., 2013; Terawaki et al., 2015; Urnavicius et al., 2015). Given this, and the likely elongated nature of other activators, we reasoned that BioID would be ideally suited to report on the spatially separated functional differences between the N- and C-termini of activators. We analyzed the N- and C-terminal BioID datasets from all six activators. We first contrasted the N- and C-terminal datasets separately, in both cases seeking to reveal activator-specific interactions and those shared between multiple activators. The shared interactions were used to construct interaction networks revealing the connections between activators (Figure 6B). Overall, in comparison to N-terminal datasets, the C-terminal datasets had more unique hits (except for NIN), more hits shared between activators, and more total hits (Figure 6C).
We next identified proteins that were found in all activator families (BICD1/2, HOOK1/3, and NIN/NINL). When we performed this analysis for the N-terminal datasets only four out of 225 proteins were present in at least one dataset from each activator family (Figure 6B, white circles). Strikingly, three of these four proteins were dynein subunits (HC, LIC1, and LIC2), highlighting that the shared function associated with the N-termini of activators is their interaction with dynein. When we performed this analysis with the C-terminal datasets we found 21 out of 547 proteins were present in each activator family (Figure 6B). Gene ontology (GO) enrichment analysis (Gene Ontology Consortium, 2015) of these 21 proteins revealed an association with cellular locations that correlate with microtubule minus ends (‘ciliary basal body’, ‘microtubule organizing center’, and ‘centrosome’) (Supplementary file 5). Other GO terms that were enriched included ‘F-actin capping complex’, ‘intraciliary transport particle B’, and ‘ciliary tip’. In contrast to the N-terminal dataset we did not detect any dynein subunits in the C-terminal dataset. Overall, this data highlights the power of the BioID technique to report on the distinct protein interactions of different regions of the dynein activators.
We next contrasted all 12 activator datasets (Figure 6—figure supplement 1 and Supplementary files 1 and 4). This analysis allowed for the removal of hits shared between the N- and C-termini of activators and focus on C-terminal-specific activator hits, as this is the region of cargo interaction for characterized activators (Cianfrocco et al., 2015). Each activator had dozens of C-terminal specific hits (Figure 6—figure supplement 1 and Supplementary files 1 and 4). These proteins are candidates for activator-specific cargos, cargo adaptors, or proteins that regulate how dynein connects to its cargo. GO term enrichment analysis of these activator-specific hits revealed several trends. The BICD2 C-terminal interactome was enriched for GO terms relating to cortical actin cytoskeleton structures, including adherens junctions and focal adhesions (Supplementary file 5), consistent with previous studies that have linked dynein to these cortical actin-based structures (Ligon et al., 2001; Rosse et al., 2012). The HOOK3 C-terminal interactome was enriched for GO terms relating to clathrin coated vesicles (Supplementary file 5). Both the NIN and NINL C-terminal interactomes were enriched for GO terms generally related to structures found at microtubule minus ends (Supplementary file 5).
We also analyzed the shared interactions of activators within the same family (e.g. BICD1/2, HOOK1/3 and NIN/NINL). Activators within families share significant sequence similarity (global identity, global similarity: BICD1/BICD2 = 53.6%, 65.2%; HOOK1/HOOK3 = 57.0%, 73.2%; NIN/NINL = 21.1%, 33.9%). Reflecting this protein conservation, activators from the same protein family had more C-terminal-specific overlap than activators from different families (Table 2). The BICD activator family was enriched for GO terms associated with the actin cytoskeleton. The HOOK family was enriched for GO terms related to kinesin motors (Supplementary file 5); we identified C-terminal-specific interactions of HOOK1 and HOOK3 with the kinesins KIF1C and KIF5B, as well as the KIF5B associated light chains, KLC2 and KLC4 (Supplementary file 4). The NIN family was enriched for GO terms related to microtubule minus ends (Supplementary file 5).
Table 2.
Specific pairwise overlap between activator C-terminal BioID datasets. Twelve activator BioID datasets were contrasted (6 N-terminal and 6 C-terminal) to determine for each activator which of its C-terminal hits were specifically shared with other datasets. Those shared with N-terminal datasets were removed. The specific pairwise overlap of the remaining hits with each activator is reported (n and %). Input n = BICD1 (92), BICD2 (87), HOOK1 (39), HOOK3 (37), NIN (74), NINL (53). Only pairwise overlap is represented in this analysis; overlap with multiple activators (e.g. BICD1 overlap with both BICD2 and HOOK1) is not shown.
DOI: http://dx.doi.org/10.7554/eLife.28257.016
| | BICD1 | BICD2 | HOOK1 | HOOK3 | NIN | NINL | | | | | | | | ------------ | --------- | --------- | --------- | ------- | -------- | ---- | - | --- | -- | ---- | - | | N | % | N | % | N | % | N | % | N | % | N | % | | BICD1 | 44 | 50.6 | 4 | 10.3 | 0 | 0 | 5 | 6.8 | 5 | 9.4 | | | BICD2 | 44 | 47.8 | 4 | 10.3 | 7 | 18.9 | 6 | 8.1 | 0 | 0 | | | HOOK1 | 4 | 4.3 | 4 | 4.6 | 14 | 37.8 | 3 | 4.1 | 1 | 1.9 | | | HOOK3 | 0 | 0 | 7 | 8.0 | 14 | 35.9 | 2 | 2.7 | 1 | 1.9 | | | NIN | 5 | 5.4 | 6 | 6.9 | 3 | 7.7 | 2 | 5.4 | 27 | 50.9 | | | NINL | 5 | 5.4 | 0 | 0 | 1 | 2.6 | 1 | 2.7 | 27 | 36.5 | |
Validating our approach, our analysis of activator- and activator family-specific hits identified several known activator-cargo interactions. HOOK1 and HOOK3 are members of the FHF complex, which is involved in endosomal sorting (Xu et al., 2008). We identified proteins in this complex (AKTIP/FTS and FAM160A2/FHIP), as well as two proteins that are homologous to FAM160A2 (FAM160A1, FAM160B1) as specifically enriched in the HOOK1 and HOOK3 datasets. FAM160A1 and FAM160A2 share sequence identity (global identity 36.4%, global similarity 50.5%), and FAM160A2 was reported to interact with HOOK3 and AKTIP/FTS in a recent high-throughput proteomics study (Huttlin et al., 2015). We also identified RIMBP3, a known HOOK1 interacting protein involved in spermatogenesis, as a HOOK1 C-terminal-specific hit (Zhou et al., 2009). In the BICD2 interactome, we identified RANBP2, a well-characterized BICD2-interacting protein that is responsible for targeting dynein/dynactin/BICD2 to nuclear pore complexes (Splinter et al., 2010). The NINL C-terminal interactome was specifically enriched for MICAL3, a protein that interacts with Rab8 and is localized to the base of primary cilia in a NINL-dependent manner (Bachmann-Gagescu et al., 2015).
We were intrigued by the presence of kinesin, including the kinesin-3 KIF1C, in the HOOK datasets (Supplementary file 4). Although Hook proteins are not known to interact with kinesins in humans, studies in filamentous fungi have linked dynein, Hook, and kinesin (Bielska et al., 2014). We used co-immunoprecipitation experiments to verify the interaction of HOOK3 with the dynein heavy chain, FAM160A2/FHIP, and KIF1C (Figure 6—figure supplement 2). Our BioID data had identified the interaction of HOOK3 with KIF1C and FAM160A2/FHIP as C-terminal-specific and the interaction with dynein/dynactin as N-terminal-specific. In agreement with our BioID data, immunoprecipitation experiments showed that the interaction of KIF1C and FAM160A2/FHIP with HOOK3 was specific to the C-terminus of HOOK3 (553–718) (Figure 6—figure supplement 2), while dynein’s interaction was specific to the N-terminus of HOOK3 (aa 1–552) (McKenney et al., 2014). This data further validates the BioID approach and highlights how BioID can identify spatially restricted interactions. In addition, this data suggests that HOOK3 may represent a new class of dynein activator, one that not only activates dynein/dynactin, but can also recruit the opposite polarity motor KIF1C.
Discussion
We applied proximity-dependent biotinylation to identify the dynein/dynactin and activator interactomes. Our data show that BioID reports on the spatial organization of both the tripartite dynein/dynactin/activator complex, as well as the domain organization of dynein activators. Using a secondary screen of our dynein/dynactin BioID data, we developed an approach to identify novel dynein activators. We identified ninein and ninein-like as a new family of dynein activators and two Hook-related proteins, girdin and daple, as candidate dynein/dynactin activators. Our analysis of the activator interactomes suggests that there are dozens of unique interactions for each activator, as well as shared interactions particularly among activators of the same family. We propose that these proteins represent novel dynein cargos, cargo adaptors or regulators of motor-cargo interactions and that each activator will link dynein to multiple cargos.
BioID provides spatial information about the large cytosolic dynein transport machinery
We tagged seven distinct dynein or dynactin subunits with the BioID tag. Our analysis of their interactomes suggests that BioID can provide spatial information about the large dynein machinery, capable of moving in the live cells we used for our experiments. The recent cryo-EM structures of the dynein/dynactin/activator complex (Chowdhury et al., 2015; Urnavicius et al., 2015) allowed us to roughly map the interactions we identified. The interactomes of each dynein or dynactin subunit identified other dynein and dynactin subunits that were located in close proximity based on these structural studies. Important for future discovery efforts, we found that proteins that were in the vicinity of the activator (the dynein ICs and LICs and the p62 subunit of dynactin) had interactomes containing activators. Thus, tagging these proteins with proximity-dependent biotinylation tags will allow future efforts to identify dynein activators in other cell types and tissues.
We also found that each activator, all of which contain long stretches of predicted coiled coil and likely have elongated structures, had largely non-overlapping protein interactions depending on whether their N- or C-terminus was tagged with BioID. Our data agrees with published data showing that the N-termini of activators interact with dynein/dynactin and that the C-termini with cargos or cargo adaptors (Cianfrocco et al., 2015). We also identified a novel interaction between the dynein activator HOOK3 and the kinesin-3 KIF1C. Both our BioID data and confirmatory immunoprecipitation experiments showed that dynein interacts with the N-terminus of HOOK3 (McKenney et al., 2014), while kinesin interacts with its C-terminus. This further highlights the ability of BioID to provide spatial information about protein-protein interactions and also raises the exciting possibility that HOOK3 is a scaffold for plus- and minus-end-directed microtubule-based motors.
BioID identifies ninein and ninein-like as members of a new family of dynein/dynactin activators
Our secondary screen of predicted coiled coil-containing proteins found in the dynein/dynactin interactome identified four proteins that could co-immunoprecipitate with dynein and dynactin: NIN, NINL, girdin and daple. Further analysis of these proteins demonstrated that NIN and NINL activated dynein/dynactin motility in single-molecule motility assays, while girdin and daple did not. Here, we focused on determining if predicted coiled coil-containing proteins could activate dynein/dynactin motility. Future analysis of the hits found in the dynein/dynactin interactome could identify additional positive or negative regulators of dynein motor activity. It is possible that there will be dynein activators lacking large stretches of coiled coil, which were not assessed in our secondary screen.
Both NIN and NINL localize to the centrosome, are involved in microtubule nucleation, and have been shown previously to immunoprecipitate with dynein/dynactin (Casenghi et al., 2005, 2003; Delgehyr et al., 2005; Wang et al., 2015). The ability of NIN and NINL to activate dynein suggests that they control their own, as well as any associated proteins, recruitment to the centrosome or other sites of microtubule nucleation. NINL has also been implicated in dynein-based vesicle trafficking (Dona et al., 2015), in support of the idea that each activator has multiple cargos (see below).
Girdin and daple are Hook-related proteins (Simpson et al., 2005), which also act as guanine nucleotide exchange factors for small G proteins (Aznar et al., 2016, 2015). While both robustly co-immunoprecipitated dynein and dynactin, they did not conclusively activate dynein/dynactin motility. We used girdin and daple constructs that were identical in length to a HOOK3 construct that could activate motility. However, it is possible that longer girdin or daple constructs will be required for activation or that post-translational modifications regulate their ability to activate dynein/dynactin motility. For example, both daple and girdin are phosphoproteins (Table 1) (Huttlin et al., 2015). It is also possible that girdin and daple regulate dynein by blocking the ability of motility-inducing activators to bind to dynein. CCDC88B/gipie is related to girdin and daple and interacts with dynein and dynactin (Ham et al., 2015). We did not identify gipie in our screen, likely because it is not expressed in HEK-293T cells (Table 1) (Huttlin et al., 2015). Future studies of these Hook-related proteins will be aimed at exploring if and how they regulate dynein/dynactin activity.
Activators have many new candidate cargos
Our findings suggest that the number of dynein activators is much smaller than the number of dynein cargos, strongly implying that each activator links dynein to multiple cargos. There are hints of this concept in the literature as BICD2 interacts with both Rab6 and RanBP2 (Hoogenraad and Akhmanova, 2016), and in Drosophila the RNA binding protein egalitarian (Dienstbier et al., 2009). Consistent with this, our GO analysis of the interactomes of six distinct dynein activators suggests that each of these activators is involved in multiple dynein-based functions. Overall, our data imply a tiered mode of dynein regulation in which activators, such as members of the BICD, HOOK and NIN families constitute the first step in cargo recognition, but additional layers must be required to achieve cargo specificity.
Our data raise a number of interesting questions for future exploration. How are activators released from dynein/dynactin? Which factors mediate this? Given that the dynein/dynactin machinery may be relatively invariant compared to activators, are activators exchanged? And, if so which factors mediate this? Are there proteins that bind to the same region of dynein/dynactin as activators, but don’t activate motility? Finally, are activators promiscuous and if so what is the balance of stochastic versus regulated motor-cargo interactions? Our dynein transport machinery interactome provides a rich dataset to address these fundamental questions.
Materials and methods
Molecular cloning and generation of stable cell lines
All plasmids used in this study were constructed by PCR and Gibson isothermal assembly. BioID G2 (Kim et al., 2016a) was the kind gift of Kyle Roux (Sanford School of Medicine, University of South Dakota). ORFs (isoforms indicated where applicable) were obtained from several sources. IC1 (isoform 2, 628 aa), IC2 (isoform 2C, 612 aa), LIC1, Roadblock (isoform 1, 96 aa), TCTEX1, and p62 (isoform 1, 460 aa) were amplified from a human RPE1 cell cDNA library (generated in the Reck-Peterson lab). LIC2 (isoform 1, 492 aa) and HOOK1 (isoform 1, 728 aa) were obtained from the Harvard Medical School PlasmID Repository, BICD2 (isoform 1, 824 aa) from Thermo Fisher Scientific (Waltham, MA), BICD1 (isoform 1, 975 aa) from Genescript (Piscataway, NJ), HOOK3 from GE Dharmacon (Lafayette, CO), and NIN was the kind gift of Dr. Yi-Ren Hong (Department of Biochemistry, Kaohsiung Medical University, Taiwan). NINL (isoform 1, 1382 aa) was synthesized in segments (IDT; Coralville, IA) and assembled by Gibson isothermal assembly. For constitutive expression, ORFs were inserted into pcDNA5/FRT (Invitrogen). IC1, IC2, LIC1, LIC2, and p62 were constructed as C-terminal fusions with BioID (e.g. pcDNA5-FRT-IC1-5×GA-BioID-3×FLAG); Roadblock1 and TCTEX1 were constructed as N-terminal fusions (e.g. pcDNA5-FRT-BioID-5×GA-Roadblock1-3×FLAG); and activators (BICD1, BICD2, HOOK1, HOOK3) were constructed as both N- and C-terminal fusions. To obtain inducible expression, NIN-BioID, BioID-NIN, NINL-BioID, BioID-NINL, and a BioID control were inserted into pcDNA5/FRT/TO (Invitrogen/ Thermo Fisher Scientific). All constructs had 5×glycine-alanine linkers added between BioID and the ORFs to provide flexibility between the modules. All constructs were sequence verified and expression was verified by Western blotting with an anti-FLAG M2-HRP antibody (Sigma-Aldrich; Saint Louis, MO).
For all experiments, stable and transiently transfected cell lines were maintained at 37°C with 5% CO2 in Dulbecco’s Modified Eagle Medium (DMEM, Corning; Tewksbury, MA) supplemented with 10% fetal bovine serum (FBS, Gibco/ Thermo Fisher Scientific) and 1% Penicillin/Streptomycin (PenStrep, Corning). HEK293-T cells (purchased from ATCC, Manassas, VA, catalog number: CRL-3216) were used for all transient transfections. Flp-InTM T-RExTM293 cells (purchased from Thermo Fisher, catalog number: R78007), which constitutively express the Tet repressor, were used to generate the stable cell lines. We confirmed that both cell lines were free of mycoplasma contamination. Stable cell lines were generated by transfection with Lipofectamine 2000 (Thermo Fisher Scientific) and a combination of the appropriate pcDNA5 construct and pOG44, which expresses Flipase. After recovery from transfection, cells were grown in DMEM containing 10% FBS, 1% PenStrep, and 50 µg/mL Hygromycin B. Colonies were isolated, expanded, and screened for expression of the fusion proteins by Western Blotting with an anti-FLAG M2-HRP antibody (A8592, Sigma-Aldrich; see ‘Western analysis and antibodies’ below for details).
Protein sequence analysis
Protein sequences were downloaded from UniProt (The UniProt Consortium, 2017). Multiple sequence alignments were calculated with Clustal Omega, and pairwise alignments used to calculate percent identity and similarity between proteins were calculated with EMBOSS Needle (Li et al., 2015).
BioID: cell growth and sample preparation
To initiate a BioID experiment, low passage cells were plated at 20% confluence in 15 cm dishes as four replicates, with each replicate consisting of 8 × 15 cm plates. After 24 hr, biotin was added to the media to a final concentration of 50 µM, and the cells were incubated for an additional 16 hr. Tetracycline was added to tetracycline-inducible stable cell lines (1 µg/mL final concentration) at the same time as biotin. After decanting the media, cells were dislodged from each plate by pipetting with ice-cold PBS. Cells were centrifuged at 1000 x g for 2 min and the PBS was decanted. Cells were washed once more with ice cold PBS before proceeding to cell lysis. Cells were resuspended and lysed in 10 mL RIPA buffer (50 mM Tris-HCl, pH 8.0; 150 mM NaCl, 1% (v/v) NP-40, 0.5% (w/v) sodium deoxycholate, 0.1% (w/v) SDS, 1 mM DTT, and protease inhibitors (cOmplete Protease Inhibitor Cocktail, Roche; Switzerland) by gentle rocking for 5–10 min at 4°C. The cell lysate was clarified via centrifugation at 66,000 x g for 30 min in a Type 70 Ti rotor (Beckman Coulter; Brea, CA) at 4°C. The clarified lysate was retrieved and dialyzed twice against dialysis buffer (50 mM Tris-HCl, pH 8.0; 150 mM NaCl, 1 mM DTT, 0.01% Triton X-100) for 2 hr per exchange. The dialysate was retrieved, supplemented with fresh protease inhibitors, and combined with 1 mL streptavidin-conjugated beads (Dynabeads MyOne Streptavidin T1, Thermo Fisher Scientific) and incubated overnight at 4°C with gentle rocking. Bead/lysate mixtures were collected on a magnetic stand into a single 2 mL round-bottom microcentrifuge tube. The beads were then washed 4 times with 2 mL RIPA buffer, with immobilization and solution removal performed on a magnetic stand. To elute bound immobilized proteins, the beads were boiled for 10 min at 100°C in 100 µL elution buffer (50 mM Tris, pH 6.8, 2% SDS (w/v), 20 mM DTT, 12.5 mM EDTA, 2 mM biotin). Typically, 10 µL was analyzed by SDS-PAGE and Sypro Red staining and the remaining eluate (90 µL) was diluted to a final volume of 400 µL with 100 mM Tris-HCl, pH 8.5. 100% trichloroacetic acid was added to a final concentration of 20% and the solution was incubated overnight at 4°C. The precipitate was collected by centrifugation at maximum speed in a microcentrifuge for 30 min at 4°C. The supernatant was removed, the pellet was washed with 500 µL ice cold 100% acetone, and was centrifuged at maximum speed in a microcentrifuge for 10 min at 4°C. The acetone was removed, and the wash was repeated. After removing the final acetone wash, the pellet was dried in a laminar flow cabinet for 30–60 min.
Mass spectrometry
Preparation of peptide mixtures
TCA-precipitated protein samples from streptavidin affinity purifications or FLAG immunoprecipitations were solubilized in 30 µl of freshly made 0.1 M Tris-HCl, pH 8.5, 8 M urea, 5 mM TCEP (Tris [2-Carboxylethyl]-Phosphine Hydrochloride, Pierce/ Thermo Fisher Scientific). After 30 min at room temperature, freshly made 0.5 M 2-Chloroacetamide (Sigma-Aldrich) was added to a final concentration of 10 mM, and the samples were left at room temperature for another 30 min in the dark. Endoproteinase Lys-C (Roche) was first added at an estimated 1:100 (wt/wt) enzyme to protein ratio, for at least 6 hr at 37°C. Urea was then diluted to 2 M with 0.1 M Tris-HCl, pH 8.5, CaCl2 was added to 0.5 mM, and modified trypsin (Promega; Madison, WI), 1:100 (wt/wt), was added for over 12 hr at 37°C. All enzymatic digestions were quenched by the addition of formic acid to 5% final concentration.
Data acquisition
Each trypsin-digested sample was analyzed independently by Multidimensional Protein Identification Technology (MudPIT) as described previously (Washburn et al., 2001; Wolters et al., 2001). Peptide mixtures were pressure-loaded onto a 250 µm fused-silica column packed first with 2 cm of 5 μm C18 reverse phase particles (Aqua, Phenomenex; Torrance, CA), followed by 3 cm of 5 μm strong cation exchange material (Partisphere SCX, Whatman/ GE Healthcare Life Sciences; Pittsburg, PA). The loaded microcapillary columns were then connected to a 100 µm fused-silica column pulled to a 5 μm tip using a P 2000 CO2 laser puller (Sutter Instruments) packed with 8 cm of 5 μm C18 reverse phase particles. Loaded and assembled microcapillaries were placed in line with either a LTQ ion trap mass spectrometer (Thermo Fisher Scientific; for all datasets except Figure 2D) or a Velos Orbitrap Elite mass spectrometer (Thermo Fisher Scientific; for Figure 2D), both of which were interfaced with quaternary Agilent 1100 quaternary pumps (Agilent Technologies). Overflow tubing was used to decrease the flow rate from 0.1 mL/min to about 200–300 nL/min. During the course of fully automated chromatography, ten 120 min cycles of increasing salt concentrations followed by organic gradients slowly released peptides directly into the mass spectrometer (Florens and Washburn, 2006). Three different elution buffers were used: 5% acetonitrile, 0.1% formic acid (Buffer A); 80% acetonitrile, 0.1% formic acid (Buffer B); and 0.5 M ammonium acetate, 5% acetonitrile, 0.1% formic acid (Buffer C). The last two chromatography steps consisted in a high salt wash with 100% Buffer C followed by the acetonitrile gradient. The application of a 2.5 kV distal voltage electrosprayed the eluting peptides directly into LTQ linear ion trap mass spectrometers equipped with a nano-LC electrospray ionization source (ThermoFinnigan). For LTQ MS runs, each full MS scan (from 400 to 1600 m/z) was followed by five MS/MS events using data-dependent acquisition where the first most intense ion was isolated and fragmented by collision-induced dissociation (at 35% collision energy), followed by the 2nd to 5th most intense ions. For Orbitrap Elite MS runs, full MS spectra were recorded on the peptides over a 400 to 1600 m/z range, followed by 10 tandem mass (MS/MS) events sequentially generated in a data-dependent manner on the first to tenth most intense ions selected from the full MS spectrum (at 35% collision energy). Dynamic exclusion was enabled for 90 s.
Data analysis
RAW files were extracted into ms2 file format (McDonald et al., 2004) using RAW_Xtract (J.R. Yates, Scripps Research Institute). MS/MS spectra were queried for peptide sequence information on a 157-node dual processor Beowulf Linux cluster dedicated to SEQUEST analyses (Eng et al., 1994). MS/MS spectra were searched without specifying differential modifications against a protein database consisting of 55508 human proteins (downloaded from NCBI on 2014-02-04), and 177 usual contaminants (such as human keratins, IgGs, and proteolytic enzymes). In addition, to estimate false discovery rates, each non-redundant protein entry was randomized. The resulting ‘shuffled’ sequences were added to the database and searched at the same time as the ‘forward’ sequences. To account for carboxamidomethylation by CAM, +57 Da were added statically to cysteine residues for all the searches.
Results from different runs were compared and merged using CONTRAST (Tabb et al., 2002). Spectrum/peptide matches were only retained if peptides were at least seven amino acids long and fully tryptic. The DeltCn had to be at least 0.08, with minimum XCorrs of 1.8 for singly-, 2.5 for doubly-, and 3.5 for triply-charged spectra, and a maximum Sp rank of 10. Finally, combining all runs, proteins had to be detected by at least two such peptides, or 1 peptide with two independent spectra. Proteins that were a subset of others were removed.
NSAF7 (Tim Wen) was used to create the final report on all detected proteins across the different runs, calculate their respective distributed Normalized Spectral Abundance Factor (dNSAF) values, and estimate false discovery rates (FDR).
Spectral FDR is calculated as:
FDR=2×ShuffledSpectralCountsTotalSpectralCounts×100
Protein level FDR is calculated as:
ProteinFDR=ShuffledProteinTotalProtein×100
Under these criteria the overall FDRs at the spectra and peptide levels were less than 1%.
To estimate relative protein levels, dNSAFs were calculated for each non-redundant protein, as described (Florens et al., 2006; Mosley et al., 2009; Paoletti et al., 2006; Zhang et al., 2010; Zybailov et al., 2006). Average dNSAFs were calculated for each protein using replicates with non-zero dNSAF values. Selected average dNSAF values for proteins detected in FLAG immunoprecipitations and streptavidin affinity purifications (Figures 1C and 2C) were visualized using Multi Experiment Viewer. Enrichment of proteins in streptavidin affinity purifications from BioID-tagged stable cell lines relative to a control BioID stable cell line were calculated as the ratio of average dNSAF (ratio = avg. dNSAFORF-BioID: avg. dNSAFBioID). The volcano plot in Figure 2D was generated by plotting the log2(fold enrichment) against the –log10(p-value), where the p-value (2-tailed Student’s T-test) was generated by comparing the replicate dNSAF values of IC2-BioID to the BioID control. Mapping of dynein/dynactin subunits detected in dynein core subunit BioID datasets was performed by first calculating fold enrichment and p-values. Hits within the dynein/dynactin complex were mapped if they had either 2–3 fold or >3 fold enrichment and had p-values<0.05 (Figure 3C).
To compare and contrast BioID datasets (core [Figure 3—figure supplement 1], activator NT [Figure 6B], activator CT [Figure 6B], and combined activator NT-CT [Figure 6—figure supplement 1]) we first sorted proteins based on enrichment and significance. Protein hits with >3 fold enrichment, p-values<0.05 (Students two-tailed t-test), and average spectral counts > 2 were used for all of these analyses. One replicate each for NIN-BioID and HOOK3-BioID were discarded due to extremely low overall spectral counts, and one replicate for BioID-BICD1 was lost due to a faulty LC column. Hits were contrasted to generate categorized lists of hits (http://bioinformatics.psb.ugent.be/webtools/Venn/). For network analysis, we constructed protein-protein interaction networks using Cytoscape (Figure 3—figure supplement 1, Figure 6B, Figure 6—figure supplement 1; cytoscape.org).
For the core dynein/dynactin subunit network we contrasted seven datasets (IC1-BioID, IC2-BioID, LIC1-BioID, LIC2-BioID, BioID-TCTEX1, BioID-RB1, and p62-BioID) to determine the proteins unique to each dataset and those shared between multiple datasets. Those shared between datasets were used to construct the network (Figure 3—figure supplement 1).
Similarly, we constructed networks comprising the 6 N-terminal activator datasets (NT: BioID-BICD1, BioID-BICD2, BioID-HOOK1, BioID-HOOK3, BioID-NIN, BioID NINL), 6 C-terminal activator datasets (CT: BICD1-BioID, BICD2-BioID, HOOK1-BioID, HOOK3-BioID, NIN-BioID, NINL-BioID) (Figure 6B and Supplementary file 4 [‘NT hits’ tab and ‘CT hits’ tab]), and a combination of all 12 NT and CT datasets (Figure 6—figure supplement 1 and Supplementary file 4 [‘NT-CT combined hits’ tab]). Activator NT-specific hits (Supplementary file 4 [‘NT hits’ tab, ‘NT Specific’ columns]) were tabulated. The remaining shared hits (Supplementary file 4 [‘NT hits’ tab, ‘NT Shared’ columns]) were assigned their respective activator interactions and then used to create a network. The same process was repeated to construct a CT-network. Activator CT-specific hits (Supplementary file 4 [‘CT hits’ tab, ‘CT Specific’ columns]) were tabulated. The remaining shared hits (Supplementary file 4 [‘CT hits’ tab, ‘CT Shared’ columns]) were assigned their respective activator interactions and then used to create a network. To construct the complete NT-CT network all 12 activator datasets were contrasted to determine the unique and shared hits for each activator NT and CT (Supplementary file 4 [‘NT-CT hits’ tab, ‘NT Specific’, ‘CT Specific’, ‘NT Shared’ and ‘CT Shared’ columns]). Shared hits were used to construct the 12-way network. Hits used for network analysis refer to proteins with designated NCBI gene names. Predicted proteins lacking NCBI gene names were omitted from this analysis.
All networks were organized using the Cytoscape ‘yFiles Layouts-Organic’ option. Regions of the interaction map were color coded and then selected for gene ontology analysis using the ‘cellular component’ option (GO, geneontology.org) (Gene Ontology Consortium, 2015). The GO terms with p-values<0.05 were tabulated (Supplementary file 5).
Immunoprecipitations
For small-scale immunoprecipitations (Figures 1D, F, 3A and B) from stable cell lines, cells were split into 10 cm dishes at 40% confluence the day before harvesting. For immunoprecipitations from transiently transfected cells (Figure 4C and D and Figure 4—figure supplement 1A, Figure 6—figure supplement 2), cells were plated on 10 cm dishes at 10–15% confluence the day before transfection. At least two technical replicates were performed for the experiments in Figures 1, 3 and 4. Transfections were performed with Lipofectamine 2000 (Invitrogen) and 2–4 µg (kept constant within an experiment) of transfection-grade DNA (Purelink midi prep kit, Invitrogen/ Thermo Fisher Scientific) per dish in OPTI-MEM media. After 6 hr the media was exchanged for DMEM containing 10% FBS and 1% PenStrep. Cells were then grown for 24–48 hr before lysate preparation. For both approaches (transient or stable cell lines), cell collection, lysis, and immunoprecipitation conditions were the same. Cells were collected by decanting the media, and washing the cells off the dish with ice-cold PBS. Cells were collected by centrifugation at 1000 x g for 2 min, washed again with PBS, and then transferred with PBS to Eppendorf tubes for lysis. Cells were centrifuged at 2000 rpm in a microcentrifuge for 1 min and the supernatant was removed. For Figure 1D and 1F, cells were lysed in 500 µL of either ‘mild’ detergent lysis buffer (50 mM Tris-HCl, pH 7.4, 100 mM NaCl, 0.2% Triton X-100, 1 mM DTT, 0.5 mM ATP, 1X protease inhibitor cocktail (cOmplete, Roche)) or ‘harsh’ detergent lysis buffer (50 mM Tris-HCl, pH 8.0, 150 mM NaCl, 0.1% SDS (wt/v), 0.5% sodium deoxycholate (wt/v), 1% NP40 (v/v), 0.5 mM ATP, 1 mM DTT, 1X protease inhibitor cocktail). For immunoprecipitations of dynein and dynactin subunits from stable cell lines (Figure 3), immunoprecipitations followed by single-molecule motility (Figure 4 and Figure 4—figure supplement 2) and those used to assess coiled coil protein binding (Figure 4—figure supplement 1), cells were lysed in 500 µL dynein lysis buffer (25 mM HEPES, pH 7.4, 50 mM potassium acetate, 2 mM magnesium acetate, 1 mM EGTA, 10% glycerol, and 1 mM DTT) supplemented with 0.2% Triton X-100, 0.5 mM Mg-ATP, and 1X protease inhibitors (cOmplete Protease Inhibitor Cocktail, Roche). For all samples, lysis was accomplished with gentle mixing at 4°C for 20 min. All lysates were centrifuged at maximum speed in a 4°C microcentrifuge for 15 min. The clarified lysate was retrieved and added to 50 µL packed volume of anti-FLAG M2 agarose (Sigma-Aldrich) and incubated for either 2 (Figures 3B and 4C and D and Figure 4—figure supplement 1A, Figure 6—figure supplement 2) or 16 hr (Figures 1D, F and 3A) at 4°C. Cells were washed four times in the same buffer they were lysed in and elutions were performed with 50 µL of each lysis buffer supplemented with 0.4 mg/mL 3×FLAG peptide.
One large scale FLAG-immunoprecipitation experiment was carried out (Figure 1B and C) in order to analyze the composition of dynein complexes isolated from cells expressing IC2-BioID-3×FLAG (Figure 1B and C). Four replicates of 8 × 15 cm plates were prepared from BioID-3×FLAG and IC2-BioID-3×FLAG stable cell lines. Each replicate was lysed in 10 mL ‘mild’ detergent lysis buffer by mixing gently at 4°C for 20 min. The mixture was centrifuged at 66,000 x g for 30 min in a Type 70 Ti rotor (Beckman Coulter) at 4°C. The lysate was recovered and incubated with 250 µL packed volume anti-FLAG agarose for 16 hr at 4°C with gentle mixing. Beads were collected by centrifugation at 1000 rpm in a microcentrifuge for 2 min and washed four times with ‘mild’ detergent lysis buffer. Proteins were eluted with 250 µL lysis buffer containing 0.4 mg/mL 3×FLAG peptide at 4°C for 30 min. Eluates were precipitated with TCA as described above. MS/MS analysis was performed as described above.
We used FLAG-immunoprecipitation combined with FPLC to determine the percent incorporation of BioID-tagged subunits into their respective complexes. Cells expressing either IC2-BioID-3×FLAG or p62-BioID-3×FLAG were collected from 8 × 15 cm plates as described above. Cells were lysed in 10 mL GF buffer (50 mM Tris-HCl, pH 8.0; 150 mM NaCl, 10% glycerol, 0.2% Triton X-100, 1 mM DTT, 0.5 mM ATP, 1X protease inhibitor cocktail) and centrifuged as described. The lysate was added to 200 µL packed Anti-FLAG M2 Affinity Gel (Sigma-Aldrich) for 16 hr at 4°C with gentle mixing. After washing in batch twice with 50 mL GF buffer, elutions were performed with 250 µL of lysis buffer with 0.5 mg/mL 3×FLAG peptide at 4°C for 30 min. A Superose 6 Increase 10/300 GL was equilibrated in GF buffer containing 5% glycerol. Molecular weight standards were analyzed first and consisted of a mixture of thyroglobulin (669 kDa), beta-amylase (200 kDa), alcohol dehydrogenase (150 kDa), albumin (66 kDa), and carbonic anhydrase (29 kDa). 200 µL of each BioID fusion protein eluate were then run separately, and 1 mL fractions were collected for each. Selected fractions were mixed with 10 µL packed Anti-FLAG M2 Affinity Gel (Sigma-Aldrich) and incubated with mixing at 4°C for 2 hr. This mixture was then centrifuged briefly, the supernatant was removed, and the resin was boiled in 2X SDS sample buffer. Released proteins were analyzed by Western blotting with anti-FLAG, anti-dynein heavy chain, and anti-p150 dynactin antibodies (see “Western analysis and antibodies, below, for details). Image intensities of bands were quantified using FIJI. Peak anti-FLAG Western band signal intensities of the low molecular weight (= free) and high molecular weight (= incorporated) IC2- and p62-containing species were used to calculate the percent incorporation of IC2 and p62 into the dynein and dynactin complexes, respectively (Figure 1E and G). The percent incorporation was calculated as intensityincorporated/(intensityfree+ intensityincorporated). To construct the graphs in Figure 1E and Figure 1G the intensity of each fraction was divided by the sum of the intensities for all fractions and plotted against the elution volume.
Western analysis and antibodies
Lysates and eluates were run on 4–12% polyacrylamide gels (NuPage, Invitrogen/ Thermo Fisher Scientific) and transferred to PVDF (Immobilon-P, EMD Millipore; Billerica, MA) for 1.5 hr at 300 mA constant current. Blots were blocked for 10 min with TBST +5% dry milk (w/v), and immunoblotted with appropriate antibodies. All antibodies were diluted in TBST +5% milk (w/v). Primary antibodies were incubated overnight at 4°C, while secondary antibodies were incubated for 1 hr at room temperature. Antibodies used were anti-FLAG conjugated HRP (A8592, Sigma-Aldrich, 1:5000 dilution), rabbit anti-dynein heavy chain (R325, Santa Cruz Biotechnology, Dallas, TX, 1:500-1:1000 dilution), mouse anti-p150 dynactin (610474, BD Biosciences, San Jose, CA, 1:500-1:1000 dilution), rabbit anti-BICD2 (ab117818, Abcam; Cambridge, MA, 1:5000 dilution), rabbit anti-FAM160A2 (ab184160, Abcam, 1:1000), rabbit anti-KIF1C (NB100-57510, Novus Biologicals, Littleton, CO, 1:1000), goat anti-rabbit HRP (sc-2030, Santa Cruz Biotechnology, 1:5000 dilution) and goat anti-mouse HRP (sc-2031, Santa Cruz Biotechnology, 1:5000 dilution). Westerns were visualized with Supersignal West Pico or Femto Chemiluminescent reagents (Thermo Fisher Scientific) and a VersaDoc imaging system (Bio-Rad Laboratories; Hercules, CA). Image intensity histograms were adjusted and images were converted to 8-bit with FIJI before being imported into Adobe Illustrator to make figures.
Secondary screen and hit validation
For the secondary screen described in Figure 4, we pooled BioID datasets from the core dynein/dynactin subunits where at least one known activator (BICD1, BICD2, HOOK1, or HOOK3) was enriched. Proteins were selected for coiled coil analysis if they had a dNSAFORF-BioID:dNSAFBioID ratio greater than 3, were present in 3 of 4 replicates, and contained a predicted coiled coil of at least 100 aa. Predicted coiled coil sequences were extracted from UniProt; those from nuclear proteins, dynein/dynactin subunits, and a single protein that was entirely coiled coil (GOLGA4), were discarded. Each coiled coil was then codon optimized for synthesis and expression in mammalian cells, synthesized (IDT), and cloned by isothermal assembly into pcDNA5/FRT/TO as fusions with super folder (sf) GFP (e.g. pcDNA5/FRT/TO-sfGFP-CCx-3×FLAG). A negative control was used consisting of sfGFP-3×FLAG alone, and two known activator coiled coil constructs were used as positive controls (sfGFP-BICD2 [1-422]−3×FLAG, sfGFP-HOOK3 [1-552]−3×FLAG). Transient transfections, ‘mild’ detergent immunoprecipitations and Western blot analysis were performed as described above.
The length of expression constructs for the positive hits (NINL, daple and girdin), and NIN, a protein closely related to NINL were further optimized (Figure 4C and D). Although our initial girdin construct (sfGFP-girdin [1-425]−3×FLAG) immunoprecipitated dynein/dynactin, it was expressed as a truncated protein (open triangle, Figure 4D). Informed by a recent study of Hook proteins (both daple and girdin contain a Hook domain) (Schroeder and Vale, 2016), we made longer girdin and daple constructs (1–542 and 1–545, respectively). Since girdin was truncated, yet still produced a FLAG positive Western signal, we reasoned that GFP was proteolytically cleaved from the construct in cells. To circumvent this, we moved the sfGFP module to the C-terminus of girdin (girdin [1-542]-sfGFP-3×FLAG). This construct was not proteolyzed, as was the case with a longer version of daple (sfGFP-daple [1-545]−3×FLAG); both constructs immunoprecipitated dynein/dynactin (Figure 4D). In our secondary screen NINL (373-702) immunoprecipitated dynein/dynactin (Figure 4—figure supplement 1A), while a construct from the closely related protein, NIN (353-580), did not. Based upon a previous report (Casenghi et al., 2005), we generated longer versions of NIN (1-693) and NINL (1-702); both immunoprecipitated dynein/dynactin (Figure 4C).
sfGFP-tagged HOOK3 constructs were used to map the interaction between HOOK3 and KIF1C (Figure 6—figure supplement 2). Full length HOOK3 (1–718) was moved from pcDNA5/FRT/TO-HOOK3-BioID-3×FLAG to pcDNA5/FRT/TO-sfGFP-3×FLAG by PCR and isothermal assembly. pcDNA5/FRT/TO-HOOK3 [1-552]−3×FLAG is described above. pcDNA5/FRT/TO-sfGFP-HOOK3 [553-718] was generated by PCR and ligation using pcDNA5/FRT/TO-sfGFP-HOOK3 [1-718]−3×FLAG as a template.
Protein purification
Dynein and dynactin were purified from stable HEK293 cell lines expressing IC2-SNAPf-3xFLAG or p62-HALO-3xFLAG, respectively. Cell lines were constructed using the FLP/FRT system (Thermo Fisher Scientific) as outlined above. Between 60–100 80% confluent, 15 cm plates were harvested per purification. Cells were collected by pipetting with ice-cold PBS and centrifuged at 1000 x g for 2 min to pellet. Cells were washed once more with ice-cold PBS. Cell pellets were either snap-frozen in liquid nitrogen in 50 mL conical tubes or immediately lysed for protein purification. To lyse, cell pellets were resuspended in dynein lysis buffer (25 mM HEPES pH 7.4, 50 mM KOAc, 2 mM MgOAc, 1 mM EGTA, 10% glycerol (v/v), and 1 mM DTT) supplemented with 0.2% Triton X-100, 0.5 mM Mg-ATP, and 1X protease inhibitors (cOmplete Protease Inhibitor Cocktail, Roche). To ensure complete lysis, resuspended cells were slowly rotated lengthwise at 4°C for 15 min. The lysate was clarified via centrifugation at 66,000 x g for 30 min in a Type 70 Ti rotor (Beckman Coulter) at 4°C. The clarified supernatant was mixed with 0.75–1 mL of Anti-FLAG M2 Affinity Gel (Sigma-Aldrich) overnight at 4°C. During incubation, the slurry was rotated about its long axis in a full 50 mL Falcon tube. Beads were collected by gravity flow and washed with 50 mL wash buffer (dynein lysis buffer with 0.02% Triton X-100 and 0.5 mM Mg-ATP) supplemented with protease inhibitors (cOmplete Protease Inhibitor Cocktail, Roche). Beads were then washed with 50 mL high salt wash buffer (25 mM HEPES, pH 7.4, 300 mM KOAc, 2 mM MgOAc, 10% glycerol, 1 mM DTT, 0.02% Triton X-100, 0.5 mM Mg-ATP, and 1X protease inhibitor (cOmplete Protease Inhibitor Cocktail, Roche) and then with 100 mL wash buffer.
To label with a fluorophore the beads were resuspended in 1 mL wash buffer and incubated with either 5 μM SNAP-Cell TMR Star (New England BioLabs; Ipswich, MA) (to label IC2) or 5 μM Halo-Atto647N (Promega) (to label p62) for 10 min at room temperature. Unreacted dye was removed from beads with 50–80 mL of wash buffer. Protein complexes were eluted with 0.5–1 mL of elution buffer (wash buffer with 2 mg/mL 3xFLAG peptide). Elution was collected, diluted to 2 mL in Buffer A (50 mM Tris pH 8, 2 mM MgOAc, 1 mM EGTA, and 1 mM DTT) and injected onto a MonoQ 5/50 GL column (GE Healthcare Life Sciences) at 0.5 mL/min. The column was washed with 20 CV of Buffer A at 1 mL/min. To elute, a linear gradient was run over 40 CV into Buffer B (50 mM Tris pH 8, 2 mM MgOAc, 1 mM EGTA, 1 mM DTT, 1 M KOAc). Pure dynein complex elutes from ~60–70% Buffer B, while pure dynactin complex elutes around ~70–80% Buffer B. Peak fractions were pooled and concentrated, Mg-ATP was added to 0.1 mM and glycerol was added to 10%. Samples were then snap frozen in 2 µL aliquots.
Activators and potential activators were cloned into pET-28a vectors with an N-terminal StrepII-sfGFP tag. Mouse BICD2 (mBICD2) (aa 25–400) was a gift from Rick McKenney (University of California, Davis), while NIN (aa 1–693) and NINL (aa 1–702) were sub-cloned from ORFs outlined above. All constructs were transformed into BL21-CodonPlus (DE3)-RIPL cells (Agilent Technologies; Santa Clara, CA). 2 L of cells were grown at 37°C in LB media to a 600 nm optical density of 0.4–0.8 before the temperature was reduced to 18°C and expression was induced with 0.5 mM IPTG. After 16–18 hr, cells were harvested via centrifugation for 6 min at 4°C at 6000 rpm in a JLA 8.1000 fixed angle rotor (Beckman Coulter). Pellets were resuspended in 30–40 mL of dynein lysis buffer with 0.5 mM PefaBloc SC (Sigma-Aldrich) and 1 mg/mL lysozyme and incubated at 4°C for 30 min. Cells were lysed via sonication (Branson Digital Sonifier, Emerson; Saint Louis, MA) and clarified via centrifugation at 66,000 x g for 30 min in a Type 70 Ti rotor (Beckman) at 4°C. Supernatant was loaded onto a 5 mL StrepTrap column (GE Healthcare Life Sciences) and washed with 50–100 mL of lysis buffer. Activators were then eluted with 25–50 mL of elution buffer (dynein lysis buffer with 3 mM d-Desthiobiotin). Finally, all activators were purified via size exclusion chromatography on either a Superdex 200 Increase 10/300 GL or a Superose 6 Increase 10/300 GL column (GE Healthcare Life Sciences) that had been equilibrated with degassed dynein lysis buffer. Peak fractions were collected and used for single molecule motility experiments immediately or snap-frozen in 2–20 µL aliquots. Care was taken not to concentrate the activators as we observed that this led to aggregation and inactivity.
Single-molecule motility assays and data analysis
Two types of single-molecule motility assays were performed. Owing to the presence of sfGFP on each construct from the secondary screen described above, we were able to use a TIRF-based motility assay to determine if dynein/ dynactin present in coiled coil immunoprecipitations was activated. Here, immunoprecipitation eluate was imaged in a single-molecule motility assay (see ‘Immunoprecipitation’ section above for sample preparation details). In this experiment, microtubules were labeled with HiLyte 647 tubulin (Cytoskeleton, Inc.; Denver, CO) for visualization.
In the second type of single-molecule assay, purified ~6 nM dynein (labeled with TMR),~60 nM dynactin (labeled with Atto-647N) and ~24–260 nM bacterially expressed and purified activator (labeled with sfGFP) were mixed together for ten minutes at 4°C before imaging. Immediately before imaging, the dynein/ dynactin/ activator complexes were diluted 1:20-1:80 in imaging buffer (see below for composition). In this experiment, microtubules were labeled with Alexa Fluor 405 tubulin (Thermo Fisher Scientific).
Each type of single-molecule motility assay was performed in flow chambers. Biotinylated and PEGylated coverslips (Microsurfaces; Englewood, NJ) were used to reduce non-specific binding. Microtubules contained ~10% biotin-tubulin for attachment to streptavidin-coated cover slip and ~10% HiLyte 647 tubulin (Cytoskeleton, Inc.) or ~10% Alexa Fluor 405 (Thermo Fisher Scientific) tubulin for visualization. The imaging buffer used consisted of dynein lysis buffer (25 mM HEPES pH 7.4, 50 mM KOAc, 2 mM MgOAc, 1 mM EGTA, 10% glycerol (v/v), and 1 mM DTT) supplemented with 0.75–1 mg/mL casein, 1 mM Mg-ATP, 71.5 mM βME (beta-mercaptoethanol) and an oxygen scavenger system (0.4% glucose, 45 μg/ml glucose catalase (Sigma-Aldrich), and 1.15 mg/ml glucose oxidase (Sigma-Aldrich)). Images were recorded every 0.5 s for 10 min. Each individual sample was imaged no longer than 35 min. At least two technical replicates were performed for all single-molecule experiments shown in Figure 4 and Figure 5.
Motility assays were performed with an inverted Nikon (Melville, NY) Ti-E Eclipse microscope equipped with 100 × 1.4 N.A. oil immersion Plano Apo Nikon objective. The xy position of the stage was controlled by ProScan linear motor stage controller (Prior Scientific; Rockland, MA). The microscope was equipped with an MLC400B laser launch (Agilent Technologies) equipped with 405 nm (30 mW), 488 nm (90 mW), 561 nm (90 mW), and 640 nm (170 mW) laser lines. The excitation and emission paths were filtered using appropriate filter cubes (Chroma; Bellows Falls, VT). The emitted signals were detected with an iXon Ultra electron multiplier CCD camera (Andor Technology; United Kingdom). Illumination and image acquisition is controlled by NIS Elements Advanced Research software (Nikon).
The velocity of moving particles was calculated from kymographs generated in ImageJ as described (Roberts et al., 2014). For the immunoprecipitation followed by single-molecule experiments, particles moving in the 488 channel (activator) were used for velocity calculations. For the motility experiments with purified components, the 561 channel (dynein) was used for quantification of velocity. Velocities were only calculated from molecules that moved processively for greater than five frames. Non-motile or diffusive events were not considered in velocity calculation.
Processive events were defined as events that move uni-directionally and do not exhibit directional changes greater than 600 nm. Diffusive events were defined as events that exhibit at least one bi-directional movement greater than 600 nm in each direction. Single-molecule movements that change apparent behavior (e.g. shift from non-motile to processive) were counted as multiple events.
Acknowledgements
We thank Chris Patil, Agnieszka Kendrick, John Salogiannis, and Andres Leschziner for critical comments on the manuscript, Kyle Roux for sharing the G2 BioID plasmid ahead of publication, and Wade Harper and members of the Harper lab for scientific advice. MPW, LAF and SES are supported by the Stowers Institute for Medical Research. SRP is supported by the NIH (R01GM121772 and R01GM107214) and is a Howard Hughes Medical Institute-Simons Faculty Scholar. MED is a Jane Coffin Childs Fellow and ZMH is supported by a NSF graduate fellowship.
Funding Statement
The funders had no role in study design, data collection and interpretation, or the decision to submit the work for publication.
Funding Information
This paper was supported by the following grants:
- National Institutes of Health R01GM121772 to William B Redwine, Phuoc Tien Tran, Samara L Reck-Peterson.
- Howard Hughes Medical Institute Faculty Scholar to Morgan E DeSantis, Samara L Reck-Peterson.
- Simons Foundation Faculty Scholar to Morgan E DeSantis, Samara L Reck-Peterson.
- National Institutes of Health R01GM107214 to Ian Hollyer, Samara L Reck-Peterson.
- Jane Coffin Childs Memorial Fund for Medical Research to Morgan E DeSantis.
- National Science Foundation to Zaw Min Htet.
- Stowers Institute for Medical Research to Selene K Swanson, Laurence Florens, Michael P Washburn.
Additional information
Competing interests
SLR-P: Reviewing editor, eLife.
The other authors declare that no competing interests exist.
Author contributions
WBR, Conceptualization, Data curation, Formal analysis, Supervision, Validation, Investigation, Visualization, Methodology, Writing—original draft, Writing—review and editing.
MED, Conceptualization, Data curation, Formal analysis, Supervision, Funding acquisition, Validation, Investigation, Visualization, Methodology, Writing—original draft, Writing—review and editing.
IH, Formal analysis, Validation, Methodology.
ZMH, Formal analysis, Validation, Investigation, Visualization, Methodology.
PTT, Investigation, Methodology.
SKS, Resources, Data curation, Software, Formal analysis, Methodology.
LF, Resources, Data curation, Software, Formal analysis, Supervision, Project administration.
MPW, Supervision, Funding acquisition, Project administration.
SLR-P, Conceptualization, Resources, Supervision, Funding acquisition, Visualization, Writing—original draft, Project administration, Writing—review and editing.
Additional files
Supplementary file 1. Master file of mass spectrometry data related to Figures 1, 2, 3 and 6.
This excel file contains all of the mass spectrometry data referenced in the manuscript. The first blue tab corresponds to the Flag immunoprecipitation experiment in Figure 1B. The second blue tab contains the dynein core subunits detected in the Flag immunoprecipitation experiment, corresponding to Figure 1C. The purple tab contains all mass spectrometry data related to Figure 2. The pink tabs contain all of the dynein/dynactin interactome mass spectrometry data. This data was used to generate Figure 3C. The green tabs contain all of the activator interactome mass spectrometry data. This data was used to generate Figure 6 and Figure 6—figure supplement 1. ‘NT’ and ‘CT’ indicate that the BioID tag was on the N-terminus or C-terminus of the full-length protein, respectively.
DOI: http://dx.doi.org/10.7554/eLife.28257.017
Supplementary file 2. Mass spectrometry data related to Figure 2.
This excel file contains the mass spectrometry data that was used to generate Figure 2C (second tab) and 2D (first tab).
DOI: http://dx.doi.org/10.7554/eLife.28257.018
Supplementary file 3. Mass spectrometry data related to Figure 3C and Figure 3—figure supplement 1.
The blue tabs contain the BioID interactome data for IC1, IC2, LIC1, LIC2, TcTex, RB, and p62. Only the data for dynein and dynactin subunits and known (BICD2, HOOK1 and HOOK3) and suspected (BICD1) activators are shown. The blue tab titled ‘mapping color code’ lists the dynein and dynactin subunits enriched in the BioID experiments and graphically displayed in Figure 3C. Shading indicates enrichment value: light gray (2–3 fold) or dark gray (≥3 fold), p<0.05 (Student’s two-tailed t-test). The entire datasets can be found in Supplementary file 1 (pink tabs in Supplementary file 1). The pink tabs in this excel file contain all of the significant hits from each BioID tagged dynein and dynactin subunit. Significance was defined as >3 fold enrichment, p-values<0.05 (Students two-tailed t-test), and average spectral counts > 2. This data was used to generate the network shown in Figure 3—figure supplement 1. The pink tab titled ‘core hits’ lists the gene names for all hits, specific hits (unique to each tagged subunit), and hits shared by at least two datasets, for the dynein and dynactin BioID tagged subunits. The pink tab titled ‘core Venn’ contains the output from the Venn analysis (http://bioinformatics.psb.ugent.be/webtools/Venn/) of the dynein and dynactin core subunit interactomes used to generate the network shown in Figure 3—figure supplement 1. Proteins found in only one dataset are listed in the excel file, but not shown in the network.
DOI: http://dx.doi.org/10.7554/eLife.28257.019
Supplementary file 4. Mass spectrometry data related to Figure 6 and Figure 6—figure supplement 1.
The green tabs contain all significant hits from the NT and CT BioID tagged activator datasets. Significance was defined as >3 fold enrichment, p-values<0.05 (Students two-tailed t-test), and average spectral counts > 2. The blue tab titled ‘NT hits’ lists the gene names for all hits, specific hits (unique to each tagged activator), and hits shared by at least two datasets, for the NT-activator BioID tagged subunits. The blue tab titled ‘NT Venn’ contains the output from the Venn analysis (http://bioinformatics.psb.ugent.be/webtools/Venn/) of the NT activator interactomes used to generate the network shown in Figure 6B. Proteins found in only one dataset are listed in the excel file, but not shown in the network. The blue tab titled ‘white spheres NT’ highlights (in grey) the four hits that were shared by an activator from each activator family (i.e. BICD, HOOK, and NIN). The orange tab titled ‘CT hits’ lists the gene names for all hits, specific hits (unique to each tagged activator), and hits shared by at least two datasets, for the CT-activator BioID tagged subunits. The orange tab titled ‘CT Venn’ contains the output from the Venn analysis (http://bioinformatics.psb.ugent.be/webtools/Venn/) of the CT activator interactomes used to generate the network shown in Figure 6B. Proteins found in only one dataset are listed in the excel file, but not shown in the network. The orange tab titled ‘white spheres CT’ highlights (in grey) the 21 hits that were shared by an activator from each activator family (i.e. BICD, HOOK, and NIN). The pink tabs contain data that contrast all of the activator hits, combining the NT and CT datasets. The pink tab titled ‘NT-CT combined hits’ contains the gene names that are specific for each termini of each activator or shared between any dataset. The pink tab titled ‘NT-CT combined Venn’ contains the output from the Venn analysis (http://bioinformatics.psb.ugent.be/webtools/Venn/) of all activator interactomes used to generate the network shown in Figure 6—figure supplement 1.
DOI: http://dx.doi.org/10.7554/eLife.28257.020
Supplementary file 5. GO analysis of dynein activator C-terminal BioID datasets.
This excel file contains gene ontology analyses using the ‘cellular component’ option (GO, geneontology.org). The GO terms with p-values<0.05 are shown for hits that were shared in at least three C-terminal BioID datasets; C-terminal hits that were specific to BICD2, HOOK1, HOOK3, NIN, and NINL; and C-terminal hits that were shared by activator family members BICD1 and BICD2, HOOK1 and HOOK3, and NIN and NINL.
DOI: http://dx.doi.org/10.7554/eLife.28257.021
References
- Aznar N, Kalogriopoulos N, Midde KK, Ghosh P. Heterotrimeric G protein signaling via GIV/Girdin: breaking the rules of engagement, space, and time. BioEssays. 2016;38:379–393. doi: 10.1002/bies.201500133. [DOI] [PMC free article] [PubMed] [Google Scholar]
- Aznar N, Midde KK, Dunkel Y, Lopez-Sanchez I, Pavlova Y, Marivin A, Barbazán J, Murray F, Nitsche U, Janssen KP, Willert K, Goel A, Abal M, Garcia-Marcos M, Ghosh P. Daple is a novel non-receptor GEF required for trimeric G protein activation in wnt signaling. eLife. 2015;4:e07091. doi: 10.7554/eLife.07091. [DOI] [PMC free article] [PubMed] [Google Scholar]
- Bachmann-Gagescu R, Dona M, Hetterschijt L, Tonnaer E, Peters T, de Vrieze E, Mans DA, van Beersum SE, Phelps IG, Arts HH, Keunen JE, Ueffing M, Roepman R, Boldt K, Doherty D, Moens CB, Neuhauss SC, Kremer H, van Wijk E. The ciliopathy protein CC2D2A associates with NINL and functions in RAB8-MICAL3-regulated vesicle trafficking. PLOS Genetics. 2015;11:e1005575. doi: 10.1371/journal.pgen.1005575. [DOI] [PMC free article] [PubMed] [Google Scholar]
- Bielska E, Schuster M, Roger Y, Berepiki A, Soanes DM, Talbot NJ, Steinberg G. Hook is an adapter that coordinates kinesin-3 and dynein cargo attachment on early endosomes. The Journal of Cell Biology. 2014;204:989–1007. doi: 10.1083/jcb.201309022. [DOI] [PMC free article] [PubMed] [Google Scholar]
- Casenghi M, Barr FA, Nigg EA. Phosphorylation of nlp by Plk1 negatively regulates its dynein-dynactin-dependent targeting to the centrosome. Journal of Cell Science. 2005;118:5101–5108. doi: 10.1242/jcs.02622. [DOI] [PubMed] [Google Scholar]
- Casenghi M, Meraldi P, Weinhart U, Duncan PI, Körner R, Nigg EA. Polo-like kinase 1 regulates Nlp, a centrosome protein involved in microtubule nucleation. Developmental Cell. 2003;5:113–125. doi: 10.1016/S1534-5807(03)00193-X. [DOI] [PubMed] [Google Scholar]
- Chan YW, Fava LL, Uldschmid A, Schmitz MH, Gerlich DW, Nigg EA, Santamaria A. Mitotic control of kinetochore-associated dynein and spindle orientation by human spindly. The Journal of Cell Biology. 2009;185:859–874. doi: 10.1083/jcb.200812167. [DOI] [PMC free article] [PubMed] [Google Scholar]
- Chowdhury S, Ketcham SA, Schroer TA, Lander GC. Structural organization of the dynein-dynactin complex bound to microtubules. Nature Structural & Molecular Biology. 2015;22:345–347. doi: 10.1038/nsmb.2996. [DOI] [PMC free article] [PubMed] [Google Scholar]
- Cianfrocco MA, DeSantis ME, Leschziner AE, Reck-Peterson SL. Mechanism and regulation of cytoplasmic dynein. Annual Review of Cell and Developmental Biology. 2015;31:83–108. doi: 10.1146/annurev-cellbio-100814-125438. [DOI] [PMC free article] [PubMed] [Google Scholar]
- Delgehyr N, Sillibourne J, Bornens M. Microtubule nucleation and anchoring at the centrosome are independent processes linked by ninein function. Journal of Cell Science. 2005;118:1565–1575. doi: 10.1242/jcs.02302. [DOI] [PubMed] [Google Scholar]
- Dienstbier M, Boehl F, Li X, Bullock SL. Egalitarian is a selective RNA-binding protein linking mRNA localization signals to the dynein motor. Genes & Development. 2009;23:1546–1558. doi: 10.1101/gad.531009. [DOI] [PMC free article] [PubMed] [Google Scholar]
- Dona M, Bachmann-Gagescu R, Texier Y, Toedt G, Hetterschijt L, Tonnaer EL, Peters TA, van Beersum SE, Bergboer JG, Horn N, de Vrieze E, Slijkerman RW, van Reeuwijk J, Flik G, Keunen JE, Ueffing M, Gibson TJ, Roepman R, Boldt K, Kremer H, van Wijk E. NINL and DZANK1 Co-function in Vesicle Transport and are essential for Photoreceptor Development in Zebrafish. PLOS Genetics. 2015;11:e1005574. doi: 10.1371/journal.pgen.1005574. [DOI] [PMC free article] [PubMed] [Google Scholar]
- Dong JM, Tay FP, Swa HL, Gunaratne J, Leung T, Burke B, Manser E. Proximity biotinylation provides insight into the molecular composition of focal adhesions at the nanometer scale. Science Signaling. 2016;9:rs4. doi: 10.1126/scisignal.aaf3572. [DOI] [PubMed] [Google Scholar]
- Eng JK, McCormack AL, Yates JR. An approach to correlate tandem mass spectral data of peptides with amino acid sequences in a protein database. Journal of the American Society for Mass Spectrometry. 1994;5:976–989. doi: 10.1016/1044-0305(94)80016-2. [DOI] [PubMed] [Google Scholar]
- Florens L, Carozza MJ, Swanson SK, Fournier M, Coleman MK, Workman JL, Washburn MP. Analyzing chromatin remodeling complexes using shotgun proteomics and normalized spectral abundance factors. Methods. 2006;40:303–311. doi: 10.1016/j.ymeth.2006.07.028. [DOI] [PMC free article] [PubMed] [Google Scholar]
- Florens L, Washburn MP. Proteomic analysis by multidimensional protein identification technology. Methods in Molecular Biology. 2006;328:159–175. doi: 10.1385/1-59745-026-X:159. [DOI] [PubMed] [Google Scholar]
- Gama JB, Pereira C, Simões PA, Celestino R, Reis RM, Barbosa DJ, Pires HR, Carvalho C, Amorim J, Carvalho AX, Cheerambathur DK, Gassmann R. Molecular mechanism of dynein recruitment to kinetochores by the Rod-Zw10-Zwilch complex and spindly. The Journal of Cell Biology. 2017;216:943–960. doi: 10.1083/jcb.201610108. [DOI] [PMC free article] [PubMed] [Google Scholar]
- Gassmann R, Holland AJ, Varma D, Wan X, Civril F, Cleveland DW, Oegema K, Salmon ED, Desai A. Removal of Spindly from microtubule-attached kinetochores controls spindle checkpoint silencing in human cells. Genes & Development. 2010;24:957–971. doi: 10.1101/gad.1886810. [DOI] [PMC free article] [PubMed] [Google Scholar]
- Gene Ontology Consortium Gene ontology consortium: going forward. Nucleic Acids Research. 2015;43:D1049–D1056. doi: 10.1093/nar/gku1179. [DOI] [PMC free article] [PubMed] [Google Scholar]
- Gupta GD, Coyaud É, Gonçalves J, Mojarad BA, Liu Y, Wu Q, Gheiratmand L, Comartin D, Tkach JM, Cheung SW, Bashkurov M, Hasegan M, Knight JD, Lin ZY, Schueler M, Hildebrandt F, Moffat J, Gingras AC, Raught B, Pelletier L. A Dynamic protein interaction landscape of the human centrosome-cilium interface. Cell. 2015;163:1484–1499. doi: 10.1016/j.cell.2015.10.065. [DOI] [PMC free article] [PubMed] [Google Scholar]
- Ham H, Huynh W, Schoon RA, Vale RD, Billadeau DD. HkRP3 is a microtubule-binding protein regulating lytic granule clustering and NK cell killing. The Journal of Immunology. 2015;194:3984–3996. doi: 10.4049/jimmunol.1402897. [DOI] [PMC free article] [PubMed] [Google Scholar]
- Hoogenraad CC, Akhmanova A. Bicaudal d family of motor adaptors: linking dynein motility to cargo binding. Trends in Cell Biology. 2016;26:327–340. doi: 10.1016/j.tcb.2016.01.001. [DOI] [PubMed] [Google Scholar]
- Huttlin EL, Ting L, Bruckner RJ, Gebreab F, Gygi MP, Szpyt J, Tam S, Zarraga G, Colby G, Baltier K, Dong R, Guarani V, Vaites LP, Ordureau A, Rad R, Erickson BK, Wühr M, Chick J, Zhai B, Kolippakkam D, Mintseris J, Obar RA, Harris T, Artavanis-Tsakonas S, Sowa ME, De Camilli P, Paulo JA, Harper JW, Gygi SP. The bioplex network: a systematic exploration of the human interactome. Cell. 2015;162:425–440. doi: 10.1016/j.cell.2015.06.043. [DOI] [PMC free article] [PubMed] [Google Scholar]
- Kardon JR, Vale RD. Regulators of the cytoplasmic dynein motor. Nature Reviews Molecular Cell Biology. 2009;10:854–865. doi: 10.1038/nrm2804. [DOI] [PMC free article] [PubMed] [Google Scholar]
- Kim DI, Birendra KC, Zhu W, Motamedchaboki K, Doye V, Roux KJ. Probing nuclear pore complex architecture with proximity-dependent biotinylation. PNAS. 2014;111:E2453–E2461. doi: 10.1073/pnas.1406459111. [DOI] [PMC free article] [PubMed] [Google Scholar]
- Kim DI, Jensen SC, Noble KA, Kc B, Roux KH, Motamedchaboki K, Roux KJ. An improved smaller biotin ligase for BioID proximity labeling. Molecular Biology of the Cell. 2016a;27:1188–1196. doi: 10.1091/mbc.E15-12-0844. [DOI] [PMC free article] [PubMed] [Google Scholar]
- Kim DI, Jensen SC, Roux KJ. Identifying protein-protein associations at the nuclear envelope with BioID. Methods in Molecular Biology. 2016b;1411:133–146. doi: 10.1007/978-1-4939-3530-7_8. [DOI] [PMC free article] [PubMed] [Google Scholar]
- Li W, Cowley A, Uludag M, Gur T, McWilliam H, Squizzato S, Park YM, Buso N, Lopez R. The EMBL-EBI bioinformatics web and programmatic tools framework. Nucleic Acids Research. 2015;43:W580–W584. doi: 10.1093/nar/gkv279. [DOI] [PMC free article] [PubMed] [Google Scholar]
- Ligon LA, Karki S, Tokito M, Holzbaur EL. Dynein binds to beta-catenin and may tether microtubules at adherens junctions. Nature Cell Biology. 2001;3:913–917. doi: 10.1038/ncb1001-913. [DOI] [PubMed] [Google Scholar]
- Lipka J, Kuijpers M, Jaworski J, Hoogenraad CC. Mutations in cytoplasmic dynein and its regulators cause malformations of cortical development and neurodegenerative diseases. Biochemical Society Transactions. 2013;41:1605–1612. doi: 10.1042/BST20130188. [DOI] [PubMed] [Google Scholar]
- Liu Y, Salter HK, Holding AN, Johnson CM, Stephens E, Lukavsky PJ, Walshaw J, Bullock SL. Bicaudal-D uses a parallel, homodimeric coiled coil with heterotypic registry to coordinate recruitment of cargos to dynein. Genes & Development. 2013;27:1233–1246. doi: 10.1101/gad.212381.112. [DOI] [PMC free article] [PubMed] [Google Scholar]
- McDonald WH, Tabb DL, Sadygov RG, MacCoss MJ, Venable J, Graumann J, Johnson JR, Cociorva D, Yates JR. MS1, MS2, and SQT-three unified, compact, and easily parsed file formats for the storage of shotgun proteomic spectra and identifications. Rapid Communications in Mass Spectrometry. 2004;18:2162–2168. doi: 10.1002/rcm.1603. [DOI] [PubMed] [Google Scholar]
- McKenney RJ, Huynh W, Tanenbaum ME, Bhabha G, Vale RD. Activation of cytoplasmic dynein motility by dynactin-cargo adapter complexes. Science. 2014;345:337–341. doi: 10.1126/science.1254198. [DOI] [PMC free article] [PubMed] [Google Scholar]
- Mosley AL, Florens L, Wen Z, Washburn MP. A label free quantitative proteomic analysis of the Saccharomyces cerevisiae nucleus. Journal of Proteomics. 2009;72:110–120. doi: 10.1016/j.jprot.2008.10.008. [DOI] [PMC free article] [PubMed] [Google Scholar]
- Olenick MA, Tokito M, Boczkowska M, Dominguez R, Holzbaur EL. Hook adaptors induce unidirectional processive motility by enhancing the dynein-dynactin interaction. Journal of Biological Chemistry. 2016;291:18239–18251. doi: 10.1074/jbc.M116.738211. [DOI] [PMC free article] [PubMed] [Google Scholar]
- Özdemir A, Machida K, Imataka H, Catling AD. Identification of the T-complex protein as a binding partner for newly synthesized cytoplasmic dynein intermediate chain 2. Biochemical and Biophysical Research Communications. 2016;469:126–131. doi: 10.1016/j.bbrc.2015.11.082. [DOI] [PubMed] [Google Scholar]
- Paoletti AC, Parmely TJ, Tomomori-Sato C, Sato S, Zhu D, Conaway RC, Conaway JW, Florens L, Washburn MP. Quantitative proteomic analysis of distinct mammalian mediator complexes using normalized spectral abundance factors. PNAS. 2006;103:18928–18933. doi: 10.1073/pnas.0606379103. [DOI] [PMC free article] [PubMed] [Google Scholar]
- Reck-Peterson SL, Yildiz A, Carter AP, Gennerich A, Zhang N, Vale RD. Single-molecule analysis of dynein processivity and stepping behavior. Cell. 2006;126:335–348. doi: 10.1016/j.cell.2006.05.046. [DOI] [PMC free article] [PubMed] [Google Scholar]
- Rhee HW, Zou P, Udeshi ND, Martell JD, Mootha VK, Carr SA, Ting AY. Proteomic mapping of mitochondria in living cells via spatially restricted enzymatic tagging. Science. 2013;339:1328–1331. doi: 10.1126/science.1230593. [DOI] [PMC free article] [PubMed] [Google Scholar]
- Roberts AJ, Goodman BS, Reck-Peterson SL. Reconstitution of dynein transport to the microtubule plus end by kinesin. eLife. 2014;3:e02641. doi: 10.7554/eLife.02641. [DOI] [PMC free article] [PubMed] [Google Scholar]
- Rosse C, Boeckeler K, Linch M, Radtke S, Frith D, Barnouin K, Morsi AS, Hafezparast M, Howell M, Parker PJ. Binding of dynein intermediate chain 2 to paxillin controls focal adhesion dynamics and migration. Journal of Cell Science. 2012;125:3733–3738. doi: 10.1242/jcs.089557. [DOI] [PubMed] [Google Scholar]
- Roux KJ, Kim DI, Raida M, Burke B. A promiscuous biotin ligase fusion protein identifies proximal and interacting proteins in mammalian cells. The Journal of Cell Biology. 2012;196:801–810. doi: 10.1083/jcb.201112098. [DOI] [PMC free article] [PubMed] [Google Scholar]
- Schlager MA, Hoang HT, Urnavicius L, Bullock SL, Carter AP. In vitro reconstitution of a highly processive recombinant human dynein complex. The EMBO Journal. 2014;33:1855–1868. doi: 10.15252/embj.201488792. [DOI] [PMC free article] [PubMed] [Google Scholar]
- Schroeder CM, Vale RD. Assembly and activation of dynein-dynactin by the cargo adaptor protein Hook3. The Journal of Cell Biology. 2016;214:309–318. doi: 10.1083/jcb.201604002. [DOI] [PMC free article] [PubMed] [Google Scholar]
- Simpson F, Martin S, Evans TM, Kerr M, James DE, Parton RG, Teasdale RD, Wicking C. A novel hook-related protein family and the characterization of hook-related protein 1. Traffic. 2005;6:442–458. doi: 10.1111/j.1600-0854.2005.00289.x. [DOI] [PubMed] [Google Scholar]
- Splinter D, Tanenbaum ME, Lindqvist A, Jaarsma D, Flotho A, Yu KL, Grigoriev I, Engelsma D, Haasdijk ED, Keijzer N, Demmers J, Fornerod M, Melchior F, Hoogenraad CC, Medema RH, Akhmanova A. Bicaudal D2, dynein, and kinesin-1 associate with nuclear pore complexes and regulate centrosome and nuclear positioning during mitotic entry. PLoS Biology. 2010;8:e1000350. doi: 10.1371/journal.pbio.1000350. [DOI] [PMC free article] [PubMed] [Google Scholar]
- Tabb DL, McDonald WH, Yates JR. DTASelect and contrast: tools for assembling and comparing protein identifications from shotgun proteomics. Journal of Proteome Research. 2002;1:21–26. doi: 10.1021/pr015504q. [DOI] [PMC free article] [PubMed] [Google Scholar]
- Terawaki S, Yoshikane A, Higuchi Y, Wakamatsu K. Structural basis for cargo binding and autoinhibition of Bicaudal-D1 by a parallel coiled-coil with homotypic registry. Biochemical and Biophysical Research Communications. 2015;460:451–456. doi: 10.1016/j.bbrc.2015.03.054. [DOI] [PubMed] [Google Scholar]
- The UniProt Consortium UniProt: the universal protein knowledgebase. Nucleic Acids Research. 2017;45:D158–D169. doi: 10.1093/nar/gkw1099. [DOI] [PMC free article] [PubMed] [Google Scholar]
- Trokter M, Mücke N, Surrey T. Reconstitution of the human cytoplasmic dynein complex. PNAS. 2012;109:20895–20900. doi: 10.1073/pnas.1210573110. [DOI] [PMC free article] [PubMed] [Google Scholar]
- Urnavicius L, Zhang K, Diamant AG, Motz C, Schlager MA, Yu M, Patel NA, Robinson CV, Carter AP. The structure of the dynactin complex and its interaction with dynein. Science. 2015;347:1441–1446. doi: 10.1126/science.aaa4080. [DOI] [PMC free article] [PubMed] [Google Scholar]
- Vainberg IE, Lewis SA, Rommelaere H, Ampe C, Vandekerckhove J, Klein HL, Cowan NJ. Prefoldin, a chaperone that delivers unfolded proteins to cytosolic chaperonin. Cell. 1998;93:863–873. doi: 10.1016/S0092-8674(00)81446-4. [DOI] [PubMed] [Google Scholar]
- Vale RD. The molecular motor toolbox for intracellular transport. Cell. 2003;112:467–480. doi: 10.1016/S0092-8674(03)00111-9. [DOI] [PubMed] [Google Scholar]
- Wang S, Wu D, Quintin S, Green RA, Cheerambathur DK, Ochoa SD, Desai A, Oegema K. NOCA-1 functions with γ-tubulin and in parallel to patronin to assemble non-centrosomal microtubule arrays in C. elegans. eLife. 2015;4:e08649. doi: 10.7554/eLife.08649. [DOI] [PMC free article] [PubMed] [Google Scholar]
- Washburn MP, Wolters D, Yates JR. Large-scale analysis of the yeast proteome by multidimensional protein identification technology. Nature Biotechnology. 2001;19:242–247. doi: 10.1038/85686. [DOI] [PubMed] [Google Scholar]
- Wolters DA, Washburn MP, Yates JR. An automated multidimensional protein identification technology for shotgun proteomics. Analytical Chemistry. 2001;73:5683–5690. doi: 10.1021/ac010617e. [DOI] [PubMed] [Google Scholar]
- Xu L, Sowa ME, Chen J, Li X, Gygi SP, Harper JW. An FTS/Hook/p107(FHIP) complex interacts with and promotes endosomal clustering by the homotypic vacuolar protein sorting complex. Molecular Biology of the Cell. 2008;19:5059–5071. doi: 10.1091/mbc.E08-05-0473. [DOI] [PMC free article] [PubMed] [Google Scholar]
- Zhang Y, Wen Z, Washburn MP, Florens L. Refinements to label free proteome quantitation: how to deal with peptides shared by multiple proteins. Analytical Chemistry. 2010;82:2272–2281. doi: 10.1021/ac9023999. [DOI] [PubMed] [Google Scholar]
- Zhang Y, Wen Z, Washburn MP, Florens L. Improving label-free quantitative proteomics strategies by distributing shared peptides and stabilizing variance. Analytical Chemistry. 2015;87:4749–4756. doi: 10.1021/ac504740p. [DOI] [PubMed] [Google Scholar]
- Zhou J, Du YR, Qin WH, Hu YG, Huang YN, Bao L, Han D, Mansouri A, Xu GL. RIM-BP3 is a manchette-associated protein essential for spermiogenesis. Development. 2009;136:373–382. doi: 10.1242/dev.030858. [DOI] [PubMed] [Google Scholar]
- Zybailov B, Mosley AL, Sardiu ME, Coleman MK, Florens L, Washburn MP. Statistical analysis of membrane proteome expression changes in Saccharomyces cerevisiae. Journal of Proteome Research. 2006;5:2339–2347. doi: 10.1021/pr060161n. [DOI] [PubMed] [Google Scholar]
In the interests of transparency, eLife includes the editorial decision letter and accompanying author responses. A lightly edited version of the letter sent to the authors after peer review is shown, indicating the most substantive concerns; minor comments are not usually included.
Thank you for submitting your article "The human cytoplasmic dynein interactome reveals novel activators of motility" for consideration by eLife. Your article has been favorably evaluated by Vivek Malhotra (Senior Editor) and three reviewers, one of whom is a member of our Board of Reviewing Editors. The reviewers have opted to remain anonymous.
The reviewers have discussed the reviews with one another and the Reviewing Editor has drafted this decision to help you prepare a revised submission.
The referees enthusiastically support the new approach of BioID you are taking to uncover the Dynein interactome as well as to identify potential dynein interactors.
The referees believe that the paper would be more appropriate for the "tools and resources" section since the biological mechanistic insight from the study is somewhat limited. I hope you can recast your story along these lines.
The referees have raised a number of points that I would like you to consider, but perhaps the most important of them is the point 2 of referee 1 and point 1 of referee 2, who would like to see perhaps another line of evidence that the interactions are physiological. Perhaps co-IPs and / orcofractionation could be an approach you can explore. Such a validated database would provide a solid platform for the field to move forward in this exciting area.
Most other points raised are rather minor in nature and I would like you to consider them and respond with appropriate changes to the text or experiments (if already available).
The referees’ comments are provided verbatim for your information.
Reviewer #1:
This manuscript by Reck-Peterson and colleagues used the BioID strategy to identify proteins that transiently interact and are / or located within ~ 10 angstroms of dynein or its associated proteins. The work produces a very impressive data set of protein interactions. They use the presence of coiled-coil domains and ability to coimmunoprecipitate as criteria to focus on a few proteins as potential activators. They show that ninein and ninein-like are strong candidates to act as activators of dynein-based motility. In general the work is very well done and I have three major points that need to be considered before publication.
I feel this paper fits a "resource and tools" article more than a research paper,since despite the large and extremely useful datasets arising from the work, any actual mechanistic insight is limited. I don't expect the authors to investigate mechanism of dynein activation by ninein or ninein-like.
For this to be useful as a dataset, is there a way the authors can test how many of these interactions happen under physiological conditions using co-IPs or even better using short-range cross-linkers.
Figure 4 motility assays seem to miss some control. The experiments have a positive control of known activators, but no negative control. I am not sure what would constitute a negative control of dynein without activators. There is a kind of control incorporated in Figure 5, which may be more appropriate in Figure 4, or a better control is needed in Figure 4.
Reviewer #2:
This manuscript describes efforts to identify interactors of the dynein complex using the BioID method. The authors produce a very large dataset as a result of BioID G2-tagging of several dynein subunits and p62 of dynactin, as well as known coiled-coil activators of dynein-dynactin motility. The dataset will be of great interest to the dynein field, as previous proteomic studies have used methods that are likely to miss transient protein-protein interactions. In addition to other dynein-dynactin subunits, a small number of proteins are identified in proximity to multiple dynein subunits, which will undoubtedly seed future mechanistic studies. In this study, the authors follow up NIN and NINL, which were identified in the IC1 and IC2 BioID experiments, and were previously shown by others to associate with dynein and dynactin in cells. It is convincingly shown that NIN and NINL are sufficient to activate dynein-dynactin motility in vitro, thus increasing the number of known activators of dynein. The authors also identify a large number of proteins in proximity to the C-terminal regions of previously known coiled-coil activators of dynein, as well as NIN and NINL. The long list contains some known cargo adaptors that were shown to associate with the activators by more stringent methods, suggesting that it also contains novel proteins of this class. The authors use this information to hypothesize that activators/adaptors have many interaction partners, constituting a tiered mechanism for linking specific cargoes to dynein.
Overall the experiments are well controlled and the advances are substantive. However, there are some essential points that need to be addressed.
For a publication in a journal of this standing I would expect to see evidence that the list of proteins identified in proximity to the C-terminal regions of activators contains novel, bona fide interactors. An alternative possibility is that these proteins do not interact directly with the activators but are present at high concentrations in the regions of the cells where these fusion proteins accumulate. Without some validation readers will be unsure how much confidence they can have in this part of the dataset. This issue could, for example, be addressed by performing immunoprecipitations from tissue culture cells for at least one of the C-terminal constructs, followed by western blotting with available antibodies to some of the proteins on the list. Whereas some bona fide interactions may be too transient to detect by this method, others may not be. Elucidating which biological processes depend on validated interactions is not, however, necessary.
The identification of NIN and NINL as activators of dynein is a key part of the study and the authors should state explicitly in the Results section of the text in which BioID experiments they were (and were not) identified.
The legends for the motility assays should describe if the number of complexes analyzed come from a single technical replicate or a combination of multiple technical replicates. The Methods should give more information on what constitutes a technical replicate in this study.
Reviewer #3:
Cytoplasmic dynein is a microtubule motor that transports many different cargoes. While recent work has revealed how dynein is activated by binding an adaptor protein and dynactin to form a tripartite complex, what is not clear is how many adaptors there are, and whether there is one per cargo, and so forth. This work provides significant new insight into this question, by using the proximity ligation BioID approach combined with mass spectrometry. Two new adaptors, NIN and NINL, are identified as interacting with dynein and dynactin. Importantly, the authors also clearly demonstrate that this interaction leads to activation of dynein's motor activity, using elegant in vitro motility approaches. The authors go on to perform BioID on the new and previously identified adaptors themselves, which reveals a range of shared and distinct interacting proteins. This leads to the conclusion that there is a small number of adaptors, each of which can interact with multiple cargo components. One surprise is that several known membrane-associated adaptors were not detected (RILP, Rab11FIP3), but this is explained by their low expression in HEK cells. A complication of the approach used is that while ~50% of the BirA-tagged IC2 or p62 subunits are in the dynein or dynactin complexes, respectively, that does mean that 50% are not, and could be contributing non-specific interactions. Even with this caveat, this is an important study.
Overall, the work is thorough, well presented and explained, and the conclusions are sound. The methods are described in detail, which is excellent to see. The mass spectrometry data will be a valuable resource for the motor community. I have no substantive concerns.
[…] Reviewer #1:
This manuscript by Reck-Peterson and colleagues used the BioID strategy to identify proteins that transiently interact and are / or located within ~ 10 angstroms of dynein or its associated proteins. The work produces a very impressive data set of protein interactions. They use the presence of coiled-coil domains and ability to coimmunoprecipitate as criteria to focus on a few proteins as potential activators. They show that ninein and ninein-like are strong candidates to act as activators of dynein-based motility. In general the work is very well done and I have three major points that need to be considered before publication.
1) I feel this paper fits a "resource and tools" article more than a research paper,since despite the large and extremely useful datasets arising from the work, any actual mechanistic insight is limited. I don't expect the authors to investigate mechanism of dynein activation by ninein or ninein-like.
Thank you for the suggestion. We will resubmit this paper as a “resource and tools” article.
2) For this to be useful as a dataset, is there a way the authors can test how many of these interactions happen under physiological conditions using co-IPs or even better using short-range cross-linkers.
To include new validation data for our activator datasets we have now added a new figure (Figure 6—figure supplement 2) investigating a unique interaction found in the HOOK1 and HOOK3 BioID datasets. We chose to focus on these datasets because we were intrigued by the presence of the kinesin, KIF1C, in both the HOOK1 and HOOK3 datasets, but not in the dataset of any other activator. KIF1C is a kinesin-3 and its interaction with a dynein activator suggests that HOOK proteins could serve as scaffolds for plus- and minus-end-directed motors. Our results are summarized in the following paragraph.
We used co-immunoprecipitation experiments to verify the interaction between KIF1C and HOOK3 (new Figure 6—figure supplement 2). In addition, we showed that this interaction requires the C-terminus of HOOK3 (new Figure 6—figure supplement 2). Highlighting the power of BioID to detect proximal interactions, we only identified KIF1C in the HOOK1 and HOOK3 C-terminal BioID datasets(Supplementary file 4). Conversely, dynein and dynactin were enriched only in the N-terminal BioID datasets and dynein was immunoprecipitated only by full length and N-terminal portions of HOOK3 (new Figure 6—figure supplement 2 and Supplementary file 4). Together, these results further validate our approach and provide additional support for the spatially restricted nature of BioID. They also provide an exciting new biological finding that HOOK proteins may function as scaffolds for both plus- and minus-end-directed motors. We have added text in both the Results and Discussion to highlight this important finding.
We would also like to emphasize that BioID involves the labeling of proteins within cells, in their physiological environments – the cytoplasm for constructs used in our study. Any experiment performed post-lysis can only be an approximation of the conditions that exist in a living cell. As mentioned by reviewer #2, BioID also has the potential to identify interactions that are transient or of low affinity; thus, BioID can identify interactions that do not survive the dilution or the timescale of an immunoprecipitation experiment. In addition to the new experiment in Figure 6—figure supplement 2, a wealth of data in our original submission validated the power of our approach (see points 1-4 below). We feel that further validation would best be done using localization and depletion studies in living cells, but think that this is beyond the scope of the current work.
In the dynein and dynactin interactomes we identified known subunits of the dynein and dynactin complexes that are known to be in close proximity to the labeled subunit based on cryo-EM structures (Figures 2, 3, Figure 3—figure supplement 1, and Supplementary file 1) (Chowdhury et al., 2015; Urnavicius et al., 2015).
We identified known (BICD2, HOOK1 and HOOK3) or suspected (BICD1) activators in the datasets of dynein or dynactin subunits that are located in close proximity to activators based on cryo-EM structures (Figure 4 and figure 4—figure supplement 1 and Supplementary file 1) (Chowdhury et al., 2015; Urnavicius et al., 2015).
We performed immunoprecipitation experiments using 24 coiled coil-containing proteins that were enriched in our dynein/dynactin interactome. Four of these proteins co-immunoprecipitated with dynein and dynactin (NIN, NINL, CCDC88A, and CCDC88C). While we did not detect a dynein/dynactin interaction with the other 20 proteins by co-immunoprecipitation, as described above, this could be because the interactions are not stable enough to be detected under the conditions we use for an immunoprecipitation experiment. It is also possible that some of these “hits” do not represent bona fide interactions with dynein/dynactin. Localization experiments in cells, which we think are beyond the scope of this work, will be the best next step to verify these interactions.
We identified a number of known interactions in our activator datasets, further validating our approach (for more details see Discussion).
a) AKTIP/FTSis a known HOOK1 and HOOK3 interacting protein present in our HOOK datasets.
b) FAM160A2/FHIP is a known HOOK1 and HOOK3 interacting protein in our HOOK datasets. We also identified two homologues of FHIP in our datasets: FAM160A1 and FAM160A2.
c) RIMBP3 is a known HOOK1-interacting protein that we identified in our dataset.
d) RANBP2 is a well-characterized BICD2 interacting protein that we identified in our BICD2 dataset.
e) MICAL3 is a known interaction partner of NINL, which we identified in our NINL dataset.
3) Figure 4 motility assays seem to miss some control. The experiments have a positive control of known activators, but no negative control. I am not sure what would constitute a negative control of dynein without activators. There is a kind of control incorporated in Figure 5, which may be more appropriate in Figure 4, or a better control is needed in Figure 4.
We have included a kymograph of the control immunoprecipitation of soluble GFP, which shows no motile events (new Figure 4—figure supplement 2B). Another informative control/comparison is our daple and girdin data, which show that although daple and girdin can bind dynein/dynactin, motile events are extremely rare (new Figure 4—figure supplement 2B). Motile events are also extremely rare with fully reconstituted dynein/dynactin (Figure 5E), as has been reported previously for dynein/dynactin in the absence of an activator (McKenney et al., 2014; Schlager et al., 2014; Trokter et al., 2012).
Reviewer #2:
[…] Overall the experiments are well controlled and the advances are substantive. However, there are some essential points that need to be addressed.
1) For a publication in a journal of this standing I would expect to see evidence that the list of proteins identified in proximity to the C-terminal regions of activators contains novel, bona fide interactors. An alternative possibility is that these proteins do not interact directly with the activators but are present at high concentrations in the regions of the cells where these fusion proteins accumulate. Without some validation readers will be unsure how much confidence they can have in this part of the dataset. This issue could, for example, be addressed by performing immunoprecipitations from tissue culture cells for at least one of the C-terminal constructs, followed by western blotting with available antibodies to some of the proteins on the list. Whereas some bona fide interactions may be too transient to detect by this method, others may not be. Elucidating which biological processes depend on validated interactions is not, however, necessary.
Please see response #2 to reviewer #1.
2) The identification of NIN and NINL as activators of dynein is a key part of the study and the authors should state explicitly in the Results section of the text in which BioID experiments they were (and were not) identified.
Thank you for this suggestion. We have amended the text to include specific reference to the core dynein and dynactin subunit datasets enriched for NIN and NINL.
3) The legends for the motility assays should describe if the number of complexes analyzed come from a single technical replicate or a combination of multiple technical replicates. The Methods should give more information on what constitutes a technical replicate in this study.
We have added this information.
Reviewer #3:
[…] Overall, the work is thorough, well presented and explained, and the conclusions are sound. The methods are described in detail, which is excellent to see. The mass spectrometry data will be a valuable resource for the motor community. I have no substantive concerns.
We thank the reviewer for these comments.
Supplementary Materials
Supplementary file 1. Master file of mass spectrometry data related to Figures 1, 2, 3 and 6.
This excel file contains all of the mass spectrometry data referenced in the manuscript. The first blue tab corresponds to the Flag immunoprecipitation experiment in Figure 1B. The second blue tab contains the dynein core subunits detected in the Flag immunoprecipitation experiment, corresponding to Figure 1C. The purple tab contains all mass spectrometry data related to Figure 2. The pink tabs contain all of the dynein/dynactin interactome mass spectrometry data. This data was used to generate Figure 3C. The green tabs contain all of the activator interactome mass spectrometry data. This data was used to generate Figure 6 and Figure 6—figure supplement 1. ‘NT’ and ‘CT’ indicate that the BioID tag was on the N-terminus or C-terminus of the full-length protein, respectively.
DOI: http://dx.doi.org/10.7554/eLife.28257.017
Supplementary file 2. Mass spectrometry data related to Figure 2.
This excel file contains the mass spectrometry data that was used to generate Figure 2C (second tab) and 2D (first tab).
DOI: http://dx.doi.org/10.7554/eLife.28257.018
Supplementary file 3. Mass spectrometry data related to Figure 3C and Figure 3—figure supplement 1.
The blue tabs contain the BioID interactome data for IC1, IC2, LIC1, LIC2, TcTex, RB, and p62. Only the data for dynein and dynactin subunits and known (BICD2, HOOK1 and HOOK3) and suspected (BICD1) activators are shown. The blue tab titled ‘mapping color code’ lists the dynein and dynactin subunits enriched in the BioID experiments and graphically displayed in Figure 3C. Shading indicates enrichment value: light gray (2–3 fold) or dark gray (≥3 fold), p<0.05 (Student’s two-tailed t-test). The entire datasets can be found in Supplementary file 1 (pink tabs in Supplementary file 1). The pink tabs in this excel file contain all of the significant hits from each BioID tagged dynein and dynactin subunit. Significance was defined as >3 fold enrichment, p-values<0.05 (Students two-tailed t-test), and average spectral counts > 2. This data was used to generate the network shown in Figure 3—figure supplement 1. The pink tab titled ‘core hits’ lists the gene names for all hits, specific hits (unique to each tagged subunit), and hits shared by at least two datasets, for the dynein and dynactin BioID tagged subunits. The pink tab titled ‘core Venn’ contains the output from the Venn analysis (http://bioinformatics.psb.ugent.be/webtools/Venn/) of the dynein and dynactin core subunit interactomes used to generate the network shown in Figure 3—figure supplement 1. Proteins found in only one dataset are listed in the excel file, but not shown in the network.
DOI: http://dx.doi.org/10.7554/eLife.28257.019
Supplementary file 4. Mass spectrometry data related to Figure 6 and Figure 6—figure supplement 1.
The green tabs contain all significant hits from the NT and CT BioID tagged activator datasets. Significance was defined as >3 fold enrichment, p-values<0.05 (Students two-tailed t-test), and average spectral counts > 2. The blue tab titled ‘NT hits’ lists the gene names for all hits, specific hits (unique to each tagged activator), and hits shared by at least two datasets, for the NT-activator BioID tagged subunits. The blue tab titled ‘NT Venn’ contains the output from the Venn analysis (http://bioinformatics.psb.ugent.be/webtools/Venn/) of the NT activator interactomes used to generate the network shown in Figure 6B. Proteins found in only one dataset are listed in the excel file, but not shown in the network. The blue tab titled ‘white spheres NT’ highlights (in grey) the four hits that were shared by an activator from each activator family (i.e. BICD, HOOK, and NIN). The orange tab titled ‘CT hits’ lists the gene names for all hits, specific hits (unique to each tagged activator), and hits shared by at least two datasets, for the CT-activator BioID tagged subunits. The orange tab titled ‘CT Venn’ contains the output from the Venn analysis (http://bioinformatics.psb.ugent.be/webtools/Venn/) of the CT activator interactomes used to generate the network shown in Figure 6B. Proteins found in only one dataset are listed in the excel file, but not shown in the network. The orange tab titled ‘white spheres CT’ highlights (in grey) the 21 hits that were shared by an activator from each activator family (i.e. BICD, HOOK, and NIN). The pink tabs contain data that contrast all of the activator hits, combining the NT and CT datasets. The pink tab titled ‘NT-CT combined hits’ contains the gene names that are specific for each termini of each activator or shared between any dataset. The pink tab titled ‘NT-CT combined Venn’ contains the output from the Venn analysis (http://bioinformatics.psb.ugent.be/webtools/Venn/) of all activator interactomes used to generate the network shown in Figure 6—figure supplement 1.
DOI: http://dx.doi.org/10.7554/eLife.28257.020
Supplementary file 5. GO analysis of dynein activator C-terminal BioID datasets.
This excel file contains gene ontology analyses using the ‘cellular component’ option (GO, geneontology.org). The GO terms with p-values<0.05 are shown for hits that were shared in at least three C-terminal BioID datasets; C-terminal hits that were specific to BICD2, HOOK1, HOOK3, NIN, and NINL; and C-terminal hits that were shared by activator family members BICD1 and BICD2, HOOK1 and HOOK3, and NIN and NINL.