Rare cell variability and drug-induced reprogramming as a mode of cancer drug resistance (original) (raw)
. Author manuscript; available in PMC: 2017 Dec 7.
Published in final edited form as: Nature. 2017 Jun 7;546(7658):431–435. doi: 10.1038/nature22794
Abstract
Therapies targeting signaling molecules mutated in cancers can often have striking short-term effects, but the emergence of resistant cancer cells is a major barrier to full cures1,2. Resistance can result from a secondary mutations3,4, but other times there is no clear genetic cause, raising the possibility of non-genetic rare cell variability5–11. Here, we show that melanoma cells can display profound transcriptional variability at the single cell level that predicts which cells will ultimately resist drug treatment. This variability involves infrequent, semi-coordinated transcription of a number of resistance markers at high levels in a very small percentage of cells. The addition of drug then induces epigenetic reprogramming in these cells, converting the transient transcriptional state to a stably resistant state. This reprogramming begins with a loss of SOX10-mediated differentiation followed by activation of new signaling pathways, partially mediated by activity of Jun-AP-1 and TEAD. Our work reveals the multistage nature of the acquisition of drug resistance and provides a framework for understanding resistance dynamics in single cells. We find that other cell types also exhibit sporadic expression of many of these same marker genes, suggesting the existence of a general rare-cell expression program.
Melanoma is a paradigmatic example of resistance to cancer therapy, often resulting from mutations to the BRAF protein. The drug vemurafenib, which inhibits the mutated V600E BRAF protein, nearly eradicates tumors, but a small subset of cancer cells develop drug resistance1–3.
To understand resistance at the single cell level, we turned to cultured patient-derived melanoma cells. Cells isolated from two patients (WM989, WM983B) grown under normal conditions proliferated readily. A fractional killing dose of vemurafenib (1μM, Extended Data Fig. 1a–d) stopped most cells’ growth, but sporadic proliferative colonies of resistant cells formed. (These surviving cells’ transcriptomes resembled that of drug-resistant cells in patients; Extended Data Fig. 2d.) Long-term time-lapse imaging capturing the onset of resistance revealed that drug-resistant colonies can arise from single cells proliferating normally before drug addition (Supplementary video 1; Extended Data Fig. 1f), showing these cells are not in a dormant “persister” state.
We considered two models for resistance in single cells: a genetic “mutation” model and a transient, non-heritable model (Fig. 1a). In the strongly heritable “mutation” model, a cell in the resistant state cannot revert. In the transient model cells transition between pre-resistant and non-resistant states, with pre-resistant cells defined as those that give rise to resistant colonies upon addition of drug (Fig. 1a). We tested these hypotheses using Luria and Delbrück’s “fluctuation analysis”12. First, we isolated a single cell from the parental cell line to minimize any existing genetic heterogeneity. We expanded this cell for 7–8 divisions, derived several single cell cultures (~1 million cells), then added drug and counted resistant colonies (Fig. 1a). If resistance were heritable, then occasional early transitions to resistance would propagate during expansion, leading to large numbers of resistant colonies. If, however, the pre-resistant state is transient, then all cells in any culture are equally likely to form a resistant colony, making large numbers of resistant colonies unlikely.
Figure 1. Resistance to vemurafenib is not heritable, and pre-existing pre-resistant cells are marked by very high expression of resistance genes.
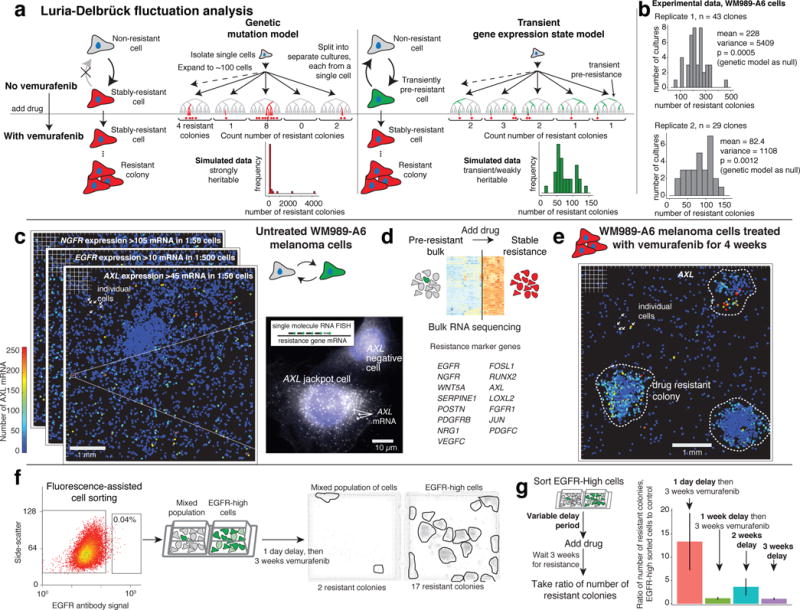
a. Alternative models for heritability of the resistant phenotype and simulated outcomes of each model. b. Distributions of resistant colonies in WM989-A6 (n=2 biological replicates of 43 and 29 clones; WM983B-E9 in Extended Data Fig. 3). c. Transcriptome analysis before drug, 48 hours after drug and stably resistant cultures (see Extended Data Fig. 2). Heatmap depicts “marker genes” whose expression increased in resistant cells relative to untreated. d. Computational representation of single-cell RNA FISH (8672 untreated cells) for AXL, NGFR, and EGFR mRNA; each dot is a cell colored by number of mRNA (1 of n=2 biological replicates). e. Single-cell AXL RNA FISH (1966 cells) after 4 weeks treatment with 1μM vemurafenib (1 of n=2 biological replicates). f. FACS of cells with an EGFR antibody; isolated an EGFR-high and mixed cell population, then applied vemurafenib. Two-well chamber of populations after 3 weeks vemurafenib(1 of n=3 biological replicates, Extended Data Fig. 5a). g. Ratio of number of colonies in EGFR-high vs. mixed wells after cells grew without drug for varying periods before vemurafenib application. Error bars represent standard error of the mean (3 biological replicates).
The lack of outliers in the distributions of number of resistant colonies was incompatible with a heritable pre-resistant phenotype. Simulations confirmed statistical significance with p-values of 0.0005 and 0.0012 in WM989-A6 cells (Fig 1b; replicates with 43 and 29 cultures) and 0.0395 for WM983B-E9 cells (WM983B-E9 data and analysis in Extended Data Fig. 3). Targeted DNA sequencing of 119 cancer-related genes revealed no new mutations in two resistant subclones (Extended Data Fig. 1e).
We then wondered whether single-cell gene expression differences marked pre-resistant cells. We first identified the transcriptional program associated with stable drug resistance in WM989-A6 and WM983B-E9 cells (clonal isolates of WM989, WM983B, respectively) and stably resistant subclones (Fig. 1d; Extended Data Fig. 2a) via population-based RNA-sequencing, revealing marker genes (1456 and 1316 genes, respectively) whose expression increased in resistant cells but not upon drug administration (Extended Data Fig. 2b). We recovered well-known markers of drug resistance, including WNT5A13, AXL14, EGFR15, PDGFRβ3, and JUN16.
The low average marker expression in untreated cells may mask rare individual cells with high expression. We used high-throughput single molecule RNA FISH to count mRNA of selected resistance genes in thousands of cells before drug treatment. We found a population of rare cells (frequencies of 1:50 to 1:500) expressing resistance genes at high levels before drug exposure (Fig. 1c and Extended Data Fig. 4a,c; outliers remained after GAPDH normalization17). After 4 weeks of treatment with vemurafenib, resistant colonies expressed these markers at more uniformly high levels (Fig. 1e).
To see if sporadic marker gene expression marked cells that ultimately become resistant, we stained live WM989-A6 melanoma cells with antibodies targeting one of the sporadic markers (EGFR) and performed fluorescence-activated cell sorting (FACS), isolating the top 0.02–0.2% EGFR-stained cells. We then applied vemurafenib for 3 weeks (Fig. 1f), finding that EGFR-high cells produced 7.9±0.92 (standard deviation) fold more resistant colonies (on average 2.4 fold larger) than EGFR-mixed cells (Fig. 1f, Extended Data Fig. 5a). (RNA FISH confirmed higher resistance gene expression in EGFR-High cells (Extended Data Fig. 5b–d)13–15.) Thus, rare cells with high levels of EGFR within the untreated population are far more likely to become resistant once drug is applied.
We confirmed the transient model by allowing EGFR-high subpopulations to grow in culture without drug to see if resistance reverted. The ratio of colonies in the EGFR high to the EGFR mixed population dropped from 13.4±10.6 to 1.17±0.47 after 1 week of growth before drug treatment, demonstrating that pre-resistance is not heritable on this timescale (Fig. 1g). (Incomplete reversion at the longest time point in culture was possibly due to differences in paracrine signaling between cultures.)
We wondered how widespread sporadic expression was. We performed RNA FISH for a panel of 19 genes on up to 40,000 single cells, including resistance markers, housekeeping genes, and master melanocyte regulators by developing a method for iterative RNA FISH using multiple cycles of hybridization (Fig. 2a; Extended Data Fig. 6a)18. We quantified sporadic, “jackpot” type of heterogeneity seen for AXL, EGFR and NGFR with the Gini coefficient19: 0 means all cells have the same number of mRNA molecules, while 1 means one cell expresses all the mRNA molecules while others express none (Fig. 2b). Of 23 genes (19 genes in our panel plus 4 additional control genes) in WM989-A6 cells, 13 genes had Gini coefficients greater than 0.5, indicating a large degree of inequality. Housekeeping genes had Gini coefficients below 0.5, and the cell cycle marker CCNA2 and slow-cycling marker KDM5B20 had Gini coefficients slightly above 0.5 (Fig. 2b, Extended Data Fig. 7).
Figure 2. Multiplex single cell RNA FISH reveals rare cells with high, sporadic expression of resistance markers across multiple cell lines.
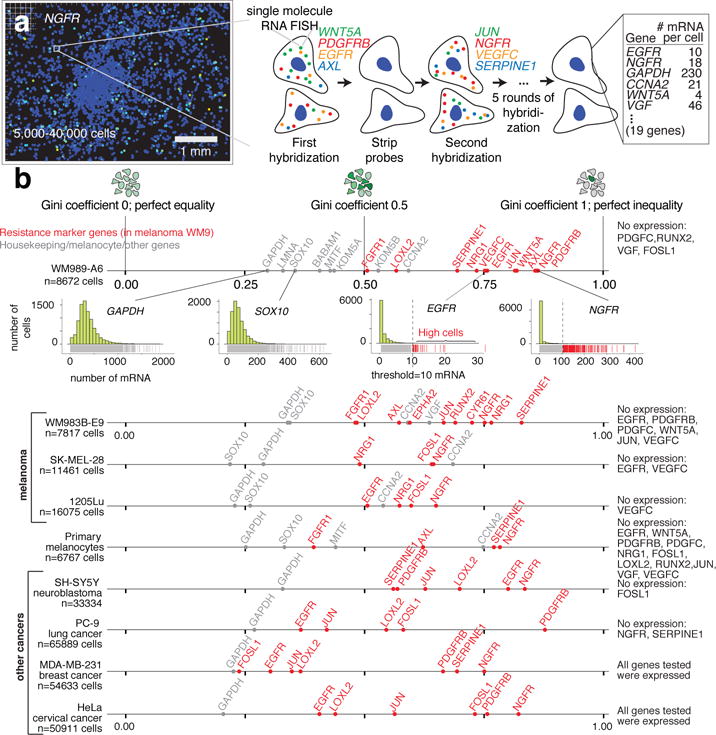
a. High-throughput imaging and reiterative hybridization scheme. b. Gini coefficients of single-cell RNA FISH data for 4 melanoma cell lines, primary melanocytes, and 4 other cancer cell lines (1 of n=2 biological replicates shown).
This phenomenon extended to three other melanoma cell lines, primary melanocytes, and 4 other cancer types (Fig. 2b). Each cell line had genes with very high Gini coefficients, showing that sporadic expression is neither unique to cancer nor melanoma. Furthermore, rare-cell expression manifested in patient-derived xenografts (LOXL2, CYR61, NGFR, AXL, NRG1; Extended Data Fig. 8), and patient single cell RNA-sequencing data21 (Extended Data Fig. 7a,b).
Sorting for NGFR or AXL also enriched for pre-resistant cells in WM989-A6. (Extended Data Fig. 9). NGFR sorting enriched for pre-resistance in two of three melanoma lines tested (WM989-A6, SK-MEL-28; not WM983B-E9).
Since many resistance markers individually showed rare expression patterns, we wondered if sporadic expression events were coordinated between genes. Quantifying pairwise relationships in high and low expression states, yielded odds ratios between resistance genes ranging from 4 to 142, indicating high degrees of co-expression (Fig. 3a,b). We found two groups of genes: housekeeping/melanocyte differentiation factors and resistance marker genes (Fig. 3b; Extended Data Fig. 4d), confirmed by principal components analysis (Extended Data Figs. 6b,c).
Figure 3. Rare cell expression of resistance marker genes is coordinated between genes, leading to cells expressing multiple markers.
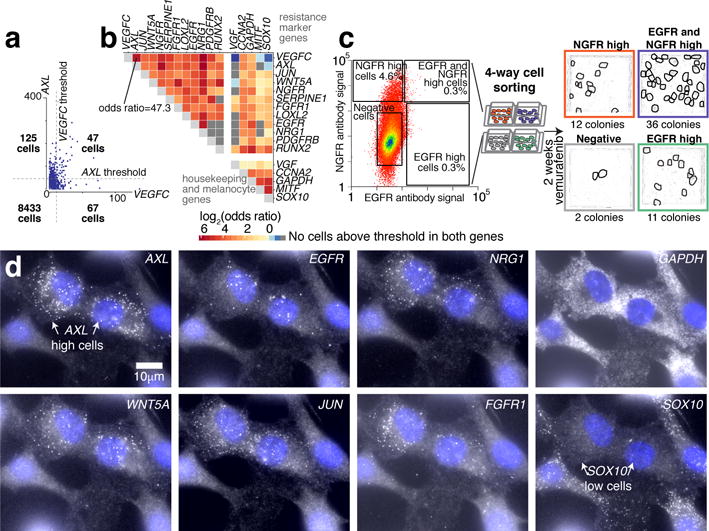
a. AXL vs. VEGFC mRNA in individual WM989-A6 melanoma cells. Dotted lines represent thresholds for high/low. Inset tabulates cells. b. Odds ratio for co-expression. Dark gray boxes indicate zero double-positive cells (1 of n=2 biological replicates). c. Co-stain and sort for EGFR and NGFR into 4 populations: double negative and positive, and EGFR/NGFR positive only, followed by 1μM vemurafenib (2 weeks). Resistant colonies circled in the images (1 of n=2 biological replicates). d. Two cells across multiple rounds of hybridization. RNA FISH signal in white; cell nuclei in blue.
We hypothesized that cells expressing multiple resistance markers were even more likely to be pre-resistant. We stained live WM989-A6 cells with both NGFR and EGFR antibodies and isolated four cell populations: double negative, EGFR positive only, NGFR positive only, and EGFR/NGFR positive (validated by RNA FISH; Extended Data Fig. 5e). We then applied vemurafenib for 2 weeks. While both EGFR only and NGFR only cells formed more resistant colonies than negative cells (11 and 12 versus 2), double positive cells formed the most resistant colonies (36) (Fig. 3c).
We also found higher order correlations for these markers. Many cells expressed high levels of multiple markers, with 13 of 8672 expressing 6 markers simultaneously and 2 expressing 8 (Fig. 3d). The frequency of multi-expressing cells approached that of resistance itself (Extended Data Fig. 6d). Expression did not “cluster”, though the correlation structure revealed potential network structure (Extended Data Fig. 7d,e).
These results show that sporadic cells occupy a transient state characterized by high levels of resistance marker transcription. Yet, once fully resistant, drug “holidays” did not affect either the transcriptome (Extended Data Fig. 2b) nor the resistant phenotype (Extended Data Fig. 5f), showing that the resistant phenotype is stable. We therefore hypothesized that resistance occurs in two phases: first, rare cells become transiently pre-resistant, then adding drug initiates cellular reprogramming, “burning in” the stable resistant phenotype.
To determine whether adding drug led to reprogramming of pre-resistant cells, we isolated pre-resistant cells (by sorting for high EGFR levels) before adding drug as well as 1 week and 4 weeks after adding drug (Fig. 4a; Extended Data Fig. 10a). We found that pre-resistant cells express only a very small fraction (72 of 1456) of resistance markers (Fig. 1c) at near the level of activation in resistance (Fig. 4a). After adding drug, however, the percentage of resistance genes expressed increased; by 1 week in drug, 600 of 1456 total resistance genes were activated to >80%, increasing to 966 at week 4, demonstrating a progressive transformation of the transcriptome as cells became stably resistant (gene ontology analysis in Supplementary Data 1).
Figure 4. Vemurafenib induces stepwise reprogramming of pre-resistant cells into a stably-resistant state.
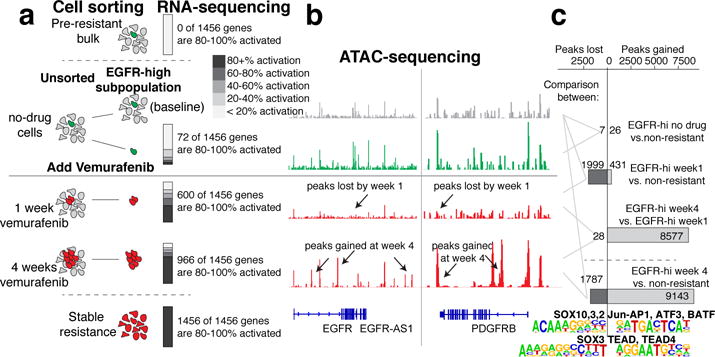
a. EGFR-high cells isolated at different time points in vemurafenib treatment (untreated, 1 week, 4 weeks); RNA sequencing on sorted populations (3 biological replicates for untreated; 2 biological replicates at 1 week, 4 weeks, Extended Data Fig. 10). Percentage activation for resistance genes; activation index is log2(fold change) compared to EGFR-mix baseline divided by total log2 fold change between bulk non-resistant and bulk stably resistant populations. Bars show percentage of resistance genes at varying degrees of activation. b. ATAC-seq identified differentially accessible sites; tracks from one of two replicates. c. Peaks called as lost or gained if we could identify the peak in one of the conditions and saw a change in read count in the peak of 4 fold or higher across both replicates. Motifs and transcription factors identified using HOMER differential peak calling and de novo motif tools.
An important caveat is that selection processes can create apparent changes in expression patterns of EGFR-High cells. We confirmed reprogramming by analyzing APCDD1, a marker of resistance but not pre-resistance (Extended Data Fig. 6e). APCDD1 was not expressed in any cell in the untreated population, but had high expression in stably resistant cells, demonstrating that the expression profile of the pre-resistant cells changed upon becoming stably resistant. Furthermore, for many resistance marker genes (EGFR, PDGFRβ, and NRG1), the rare high expressing cells had less expression than resistant cells, indicating transcriptional reprogramming (Extended Data Fig. 4b). Coupled with the phenotypic changes upon becoming stably resistant (Fig. 1g vs. Extended Data. Fig. 5f), these results demonstrate that these cells reprogram to achieve stable resistance, irrespective of potential selection effects.
To determine what gene regulatory changes underpinned this reprogramming, we used a genome-wide assay for transposase-accessible chromatin (ATAC-seq)22 to identify putative transcription factor binding sites (Fig. 4b; Extended Data Fig. 10a). Comparing non-resistant and pre-resistant cells revealed only 33 total differentially accessible sites, consistent with the hypothesis that the transient, pre-drug, pre-resistant state is a shallow deviation from the non-resistant state.
ATAC-seq revealed large changes in the pattern of transcription factor occupancy after adding drug, however. We categorized these changes into gains and losses of accessible sites, corresponding to changes in transcription factor occupancy. Between untreated cells and those in drug for 4 weeks, the cells lost 1787 and gained 9143 accessible sites (Fig. 4b), demonstrating broad cellular reprogramming. The predominant change during the first week was loss of accessible sites, followed by a gain of new sites from 1 to 4 weeks (gene ontology analysis in Supplementary Data 2). Much of the initial peak loss resulted from loss of SOX10 binding, whereas the subsequent gain of peaks resulted from activation of TEAD and Jun/AP-1 and other signaling pathways (Fig. 4c). SOX10 regulates neural crest development in melanocytes, and TEADs regulate invasion in melanoma23, suggesting that the post-drug transition to stable resistance consists of dedifferentiation followed by activation of new signaling pathways. Confirming this, we found that EGFR15,23 inhibition during reprogramming affected resistance, while inhibition during pre-resistance did not (Extended Data Fig. 9).
Here, we document a rare, transient state that leads to drug-resistance. Our findings are conceptually similar to those of Sharma et al.6, and may extend beyond melanoma; many of these genes show rare-cell expression in unrelated cancer cell types10 (including primary, non-cancerous melanocytes), suggesting the existence of a rare-cell expression program co-opted in resistance and potentially phenotype switching24. Further elucidation of both plasticity and reprogramming may open new avenues for for therapeutic targeting, including lipid peroxidase pathways25.
Also, transient and genetic1 causes of resistance are not mutually exclusive9,26. Transient effects may provide initial resistance, allowing a small subpopulation of tumor cells to survive until some acquire secondary mutations that drive the progression to relapse. In that case, brief application of drug may prevent the completion of the burn-in reprogramming process, leaving cells free to revert to a drug-sensitive state27. Our findings may inform such interval dosing strategies28,29.
Methods
Cell culture, drugs, and fixation
We grew melanoma cell lines (WM989-A6, WM983B-E9, and 1205Lu, SK-MEL-28) from the lab of Meenhard Herlyn, validated in the Herlyn lab by short tandem repeat profiling using AmpFlSTR® Identifiler® PCR Amplification Kit (Life Technologies), in Tu2% media containing 78% MCDB, 20% Leibovitz’s L-15 media, 2% FBS, and 1.68mM CaCl2 and primary melanocytes isolated from human neonatal foreskin (Fom217-1 from the lab of Meenhard) in Medium 254CF (Life Technologies, M254500) supplemented with Human Melanocyte Growth Supplement (Life Technologies, S0025). WM989-A6 and WM983B-E9 are specific single-cell-derived subclone of WM989 and WM983B, respectively, that we used for all experiments to minimize genetic heterogeneity, and was chosen because its resistance properties were similar to the parental WM989 and WM983B cell lines. We also grew HeLa cells and MDA-MB-231 cells in DMEM supplemented with 10% FBS, PC-9 cells in RPMI supplemented with 10% FBS, and SH-SY5Y cells in DMEM/F12 with 10% FBS. All cell lines tested negative for mycoplasma. We made stocks of 4mM vemurafenib (Selleckchem, S1267) and 4mM lapatinib (Santa Cruz Biotechnology, 202205B) in DMSO, and diluted in media to a final concentration of 1μM in all drug treatment experiments. For all RNA FISH experiments, we grew cells on two-well Lab-Tek chambered coverglasses. We fixed and permeabilized cells for RNA FISH according to30.
Time-lapse imaging
We imaged the cells on a Nikon Ti-E enclosed in plexiglass incubation chamber heated to 37℃ with 5% CO2. We seeded WM989-A6 cells into a two-well Lab-Tek chambered coverglasses and took brightfield images every 2 hours for 28 days. At each time point, we acquired a total of 702 images over a 39×18 grid of images at 10× magnification to capture the entire culture dish. We stitched each of tiles into one composite image for each time point and then compiled movies from the images using MATLAB.
Luria Delbruck fluctuation analysis
To minimize pre-existing genetic heterogeneity in the cell line, we isolated a single-cell clones from WM989-A6 and WM983B-E9 melanoma cell lines. We expanded these clones up to 100–200 cells total and then isolated single cells to derive the subclones for the Luria Delbruck fluctuation analysis. We then allowed the subclones to grow in culture through ~20 doublings for WM989-A6 and ~22 doublings for WM983B-E9 to give approximately 1 million cells and 4 million cells, respectively. After expansion, we trypsinized each subclone, counted the number of cells in the culture using a hemocytometer, and then seeded 600,000 cells into 2 12-well plates (yielding 25,000 cells per well). We had a total of 43 and 29 subclones with the WM989-A6 cell line (biological replicates) and 20 subclones for WM983B-E9. One day after seeding into 12-well plates, we applied 1μM vemurafenib. Throughout the experiment, we changed the media and drug and counted the number of resistant colonies twice per week. We ended the experiment when the plates stopped developing new resistant colonies or when all the resistant colonies appeared to be daughter colonies from larger ones. Note that upon re-plating the cultures before administration of drug, we observed varying degrees of growth and plating efficiency, all of which served to increase the variance, as we found that cultures with larger numbers of cells following replating had generally higher numbers of resistant cells. Thus, by not taking this into account, our observed variance is likely higher than the actual variance, biasing against the transient pre-resistance hypothesis.
To show that our resulting counts of resistant colonies were likely not the result of a strongly heritable transition to a pre-resistant state, we simulated the strongly heritable Luria-Delbruck process (code available at https://www.dropbox.com/sh/g9c84n2torx7nuk/AABZei_vVpcfTUNL7buAp8z-a?dl=0). Briefly, the parameters are the initial culture size (set to one in our case), the ultimate sizes of the cultures (we used the largest multiple of two lower than the actual measured culture sizes, thus biasing against ourselves), and the mutation rate, which we varied as part of our simulations. For each mutation rate, we ran the simulations 10,000 times, and noted both the Fano factor (variance divided by the mean) and coefficient of variation across the simulated cultures for each iteration. We then computed a p-value for each mutation rate by determining how often the simulated Fano factor or coefficient of variation (separate p-values for each statistic) exceeded our actual measurements (Extended Data Fig. 3). The p-value we report is based on the most conservative estimate based on both the statistics we computed.
Iterative RNA FISH
We designed oligonucleotide probe sets using the Stellaris probe designer (Biosearch Technologies) and ordered them with an amine group on the 3′ end (sequences available in Supplementary Data 3). We pooled the oligonucleotides for each probe set and coupled them to either Cy3 (GE Healthcare), Alexa 594 (Life Technologies), Atto647N or Atto 700 (Atto-Tec). We performed RNA FISH as previously described30 for each of the cycles of hybridization. We first fixed cells with formaldehyde and permeabilized with 70% ethanol. We next washed once with wash buffer (containing 10% formamide and 2X SSC) and then applied hybridization buffer (containing 10% formamide, 10% dextran sulfate, and 2X SSC) with the specified pool of RNA FISH probes. We hybridized for 6–12 hours and then washed 2 times for 30 minutes with wash buffer.
After imaging, we applied 60% formamide with 2X SSC for 15 minutes on a heat plate kept at 37℃. We then washed the sample 3 times with 1X PBS for 15 minutes also at 37℃ to remove residual formamide, which we have found can inhibit further hybridizations. Lastly, we washed once with wash buffer to remove residual 1X PBS and prepare the samples for another RNA FISH hybridization.
RNA FISH on patient derived xenografts
We fixed tissue sections by treating with 4% formaldehyde in PBS for 10 minutes and then permeabilized and stored them in 70% ethanol at 4℃. We performed one cycle of RNA FISH as described above. We mounted the samples for imaging in 2X SSC. We performed these experiments with two biological replicates from different mice and different tissue donors.
RNA FISH imaging
We imaged each sample on a Nikon Ti-E with a 60X Plan-Apo objective and filter sets for DAPI, Cy3, Atto647N, Alexa594, and Atto700. We used Metamorph imaging software (Scan Slide application) to acquire a tiled grid of images (40 by 40 for the data sets shown in Fig. 2a) covering a 8.9mm by 8.9mm area of the sample. We used the Nikon Perfect Focus System to ensure that the images remained in focus over the imaging area.
Image analysis
We developed a custom MATLAB pipeline for counting RNA FISH spots in tiled images. First, this software segments the nuclei of individual cells using the DAPI images. Next, the software identifies regional maxima in each tiled image as potential RNA FISH spots and assigns them to the nearest nucleus. Through a MATLAB GUI, the user selects a global threshold for each RNA FISH channel to identify the individual spots. We then visually inspected all cells that were above the jackpot threshold and used GUI editing tools to remove any autofluorescent debris or artifacts from subsequent analysis. Lastly, we extracted the position of every cell in the scan and the number of RNA molecules for each fluorescent channel.
We also developed software to match cells across subsequent hybridizations, which poses a challenge because of slight warping in the tiled image in each acquisition. Our algorithm attempts to match cells locally by shifting cells in the first hybridization to all potential candidates in the subsequent hybridization, choosing the best match as the one that minimizes total distance for nearby cells. We then smooth out this shift and apply it across the entire tiled image field. We then matched cells by proximity, discarding cells that did not match uniquely to a nearby cell in subsequent hybridizations; our yield was typically > 90% of cells in the initial hybridization matching in subsequent hybridizations.
We decided whether or not a cell was deemed a “high” expressing cell for a particular gene by determining whether the number of mRNA molecules in the cell exceeded a threshold. To avoid bias, our default was to set a threshold that captured the top 2% of cells. If this percentage did not yield a reasonable threshold, we manually set a more appropriate threshold based on the distribution. Occasionally, autofluorescent debris in the images would be spuriously identified as cells, often with high numbers of false spots in them. Thus, we manually removed such regions, starting with cells with the highest number of identified RNA counts and continuing until we reached a relatively low level of mRNA below which manually evaluating the data was no longer feasible. This procedure ensured that we manually inspected all jackpot cells to verify their expression levels. For genes that did not exhibit sporadic expression patterns (including GAPDH, SOX10, CCNA2), we set thresholds by plotting the distribution and selecting a threshold that captures the tail. We performed all iterative RNA FISH experiments in duplicate with biological replicates. We calculated Gini coefficients on the distributions of RNA FISH counts for each gene using the “ineq” package in R. The code for this image analysis pipeline and the data files including replicates (with a minimum of two independent biological replicates per dataset) are available at https://www.dropbox.com/sh/g9c84n2torx7nuk/AABZei_vVpcfTUNL7buAp8z-a?dl=0.
RNA sequencing and analysis
We sequenced messenger RNA from WM989-A6 and WM983B-E9 melanoma cells. For WM989-A6, we sequenced the RNA from 8 untreated samples, 8 samples treated with 1 μM vemurafenib for 48 hours, 10 resistant samples in 1 μM vemurafenib, 4 resistant samples with drug removed for 48 hours, and 4 resistant samples with drug removed for 1 week. For WM983B-E9, we sequenced RNA from 20 untreated samples, 20 samples treated with 1 μM vemurafenib for 48 hours, 37 resistant samples in 1 μM vemurafenib, 2 resistant samples with drug removed for 48 hours, and 2 resistant samples with drug removed for 1 week. Each sample is a biological replicate. We used the NEBNext Poly(A) mRNA Magnetic Isolation Module and NEBNext Ultra RNA Library Prep Kit for Illumina to extract polyadenylated RNA and prepare barcoded RNA sequencing libraries. We sequenced each sample at a depth of approximately 20 million reads on a HiSeq 2000 (50 base pair length) or NextSeq (75 base pair length). We aligned our reads to hg19 using STAR and quantified reads per gene using HTseq. We then used R to perform differential expression analysis with DESeq2 (code available at https://bitbucket.org/arjunrajlaboratory/rajlabseqtools) to identify resistance marker genes. We defined resistance marker genes using DESeq2 p-value < 10−5 and log2 fold change > 0.5.
Generation of patient derived xenografts
We collected tumor biopsies from melanoma patients as previously described by4. Fresh biopsies were processed under sterile conditions within 24 hours. For processing, we used a cross blade technique to finely mince the tissue, then briefly digested the tissue in collagenase IV for 20 minutes at 37℃. The tumor tissue was then implanted s.c. with matrigel (Corning Life Sciences) into NSG mice (6–8 weeks, male or female). Tumor grafts were harvested at maximum tumor size and serially transplanted for expansion. Low passage PDX tumors were mounted in OCT immediately after sacrifice. For RNA FISH analysis, we sectioned the tumors into 7μm slices and then proceeded with RNA FISH as described above. All sample collection and animal experiments were approved by Wistar IRB and Wistar IACUC, respectively. We analyzed samples from four different patients: the first of which (WM4335) had a BRAF-V600E mutation and was sensitive to combination BRAF/MEK inhibition, the second (WM4299) had a NRAS-Q61L mutation and was not sensitive to MEK inhibition, the third (WM4266) had a unknown mutational status and the patient’s cancer progressed on immunotherapy, and the fourth (WM3909) had BRAF-V600E mutation and a PIK3R1 mutation (The data from PDX experiments are in Fig. 2d and Extended Data Fig. 8).
EGFR and NGFR fluorescence assisted cell sorting
We stained WM989-A6 melanoma cells for fluorescence assisted cell sorting using an antibody for EGFR. First, we trypsinized the cells, washed once with 0.1% BSA in 1X PBS, and incubated for 1 hour at 4℃ with 1:200 mouse anti-EGFR antibody, clone 225 (Millipore, MABF120) in 0.1% BSA PBS. Next, we washed with 0.1% BSA PBS and then incubated for 30 minutes at 4℃ with 1:500 donkey anti-mouse IgG antibody labeled with Alexa Fluor 488 (Jackson Laboratories, 715-545-150). We washed the samples again with 0.1% BSA PBS and resuspended in 1% BSA PBS with 2mM EDTA and DAPI for fluorescence assisted cell sorting. We used a MoFlo Astrios (Beckman Coulter) to collect the top 0.02–0.2% of cells stained for EGFR. We used the DAPI stain to exclude dead cells and used cells that were not incubated with the primary antibody as a negative control. To stain WM989-A6, WM983B-E9, and SK-MEL-28 cells for NGFR, we used anti-NGFR clone ME20.4 fluorescently labeled with PE/Cy7 (Biolegend, 345110). We incubated the cells with 5uL of antibody for 10 minutes at 4℃. We then washed the samples and proceeded with sorting (as described above). For our negative control, we used a PE/Cy7 mouse IgG1 (Biolegend, 400126). When sorting either EGFR-high or NGFR-high subpopulations, we also collected a EGFR-mixed or NGFR-mixed population control by using the same gating for live cells, but without gating on the EGFR or NGFR stain. When staining for both EGFR and NGFR, we performed the EGFR staining first then stained with the NGFR antibody. When sorting for EGFR and NGFR together, we collected all 4 possible populations: cells negative for both stains, cells positive for EGFR only, cells positive for NGFR only, and cells positive for both EGFR and NGFR.
ATAC sequencing and analysis
We performed ATAC sequencing on WM989-A6 melanoma cells according to22. Briefly, we lysed the cells and set up the transposition reaction with the Tn5 Transposes (Illumina Catalog #FC121-1030) at 37℃ for 30 minutes. We cleaned the reaction with a Qiagen MinElute Kit and then amplified the libraries using the custom Nextera PCR primers described in22. We sequenced our libraries on a NextSeq with 75 base pair reads at a depth of approximately 40–70 million reads per sample. We aligned our reads to hg19 with bowtie2 and then used the HOMER package for peak calling, differential peak calling, motif analysis, and gene ontology analysis (code available at https://bitbucket.org/arjunrajlaboratory/rajlabseqtools). Peaks called as lost or gained if we could identify the peak in one of the conditions and saw a change in read count in the peak of 4 fold or higher across both replicates.
MTS Cell Proliferation Assay
The cell viability was estimated by using CellTiter 96 Aqueous MTS Cell Proliferation Assay (MTS Cat# PR-G1111). Briefly, WM989-A6 cells were seeded in 96-well plates with 2000 cells/well. 24 hours incubation later, cells were cultured in the presence of vemurafenib at serial 3-fold dilution concentration. After 6 days treatment, 20ul/well MTS reagent were added and incubated for 4 hours. Then read plate at 490nm wavelength to estimate cell proliferation.
Apoptosis Assay
After treatment with vemurafenib at 1uM, 3uM for 3 days, WM989-A6 cells were harvested with trypsin-EDTA, centrifuged into a pellet including all floating cells, and rinsed with phosphate-buffered saline (PBS). Then, the cells were re-suspended in Annexin V binding buffer containing Annexin V APC (Biolegend Cat#640920) and propidium iodide (Sigma Cat#P4864). The cells were incubated at room temperature for 15 minutes and were analyzed using the FACSCalibur flow cytometry.
Western Blot
WM989-A6 cells were cultured in 1uM, 3uM vemurafenib medium for 3 days. The cells were collected with or without floating cells and were lysed with TNE buffer with protease inhibitors. 30ug protein extracts were electrophoresed on 12% SDS-Page gels and transferred on the Nitrocellulose membranes in Bio-rad Trans-Blot Turbo transfer system. The membranes were blocked with ODYSSEY Blocking Buffer (LI-COR #927-40000) for 1hr at room temperature and incubated at 4°C overnight with the following primary antibodies: pMek(Cell signal #9121s), pErk(Cell signal #4370s), pS6(Cell signal #9121s), caspase3(Cell signal #9662), parp(Cell signal #9542s), b-actin(Sigma #A5441). After 2nd antibodies incubation, membranes were visualized by LI-COR Odyssey infrared imaging system.
Targeted DNA sequencing
We sequenced WM9-A6 (main WM9 subclone), intermediate subclone A6-B1, and two resistant subclones, A6-B1-A2 and A6-B1-A3. We obtained resistant subclones by isolating cell clusters and expanding in the presence of drug. For each cell line, 500 ng of genomic DNA was sheared randomly into 200 bp fragments with the Covaris™ S200 UltraSonicator (Covaris®). Sheared DNA was A-tailed and ligated with adaptor-embedded indexes using the NEBNext® Ultra™ DNA Library Prep Kit for Illumina® (New England BioLabs, Inc.). DNA quality, fragment size, and concentration of library preps were measured using Agilent’s DNA 1000 chips in conjunction with the 2100 Bioanalyzer (Agilent Technologies). Samples were equimolarly pooled and sequenced with a 2.318Mbp SureSelectXT Custom Target Enrichment Kit (Agilent Technologies) targeting 119 genes (Extended Data Fig. 1). Paired-end sequencing (2×125bp) was carried out on the HiSeq™ 2500 sequencing system (Illumina) at the next Generation Sequencing Core Facility. Mean target coverage of 346X was achieved.
Short-sequenced reads were aligned to the GRCh37 human reference genome using the Burrows-Wheeler Aligner (BWA) tool (Li and Durbin, 2009). Duplicate reads were removed, as well as reads that map to more than one location, off-target reads, and variants annotated with the incorrect transcript. Somatic SNVs/indels were detected using the MuTect (14), Scalpel scalpel.sourceforge.net), VarDict (github.com/AstraZeneca-NGS/VarDict), and Freebayes (15) algorithms. Ensembl calling was done as in the bcbio-nextgen pipeline (github.com/chapmanb/bcbio-nextgen). Variants were annotated with ANNOVAR. Annotated variants with a read depth less than 20, as well as all synonymous variants, and/or variants present in the germline samples, were excluded. Furthermore, variants were removed if the minor allele frequency (MAF) was greater than or equal to 0.1% in the population databases ExAC (http://exac.broadinstitute.org/) and/or 1000 Genomes (1000 Genomes Project Consortium et al., 2012).
Extended Data
Extended Data Fig. 1. Treatment of WM989 cells with vemurafenib induces cell death initially, but after weeks of treatment, colonies of resistant cells develop.
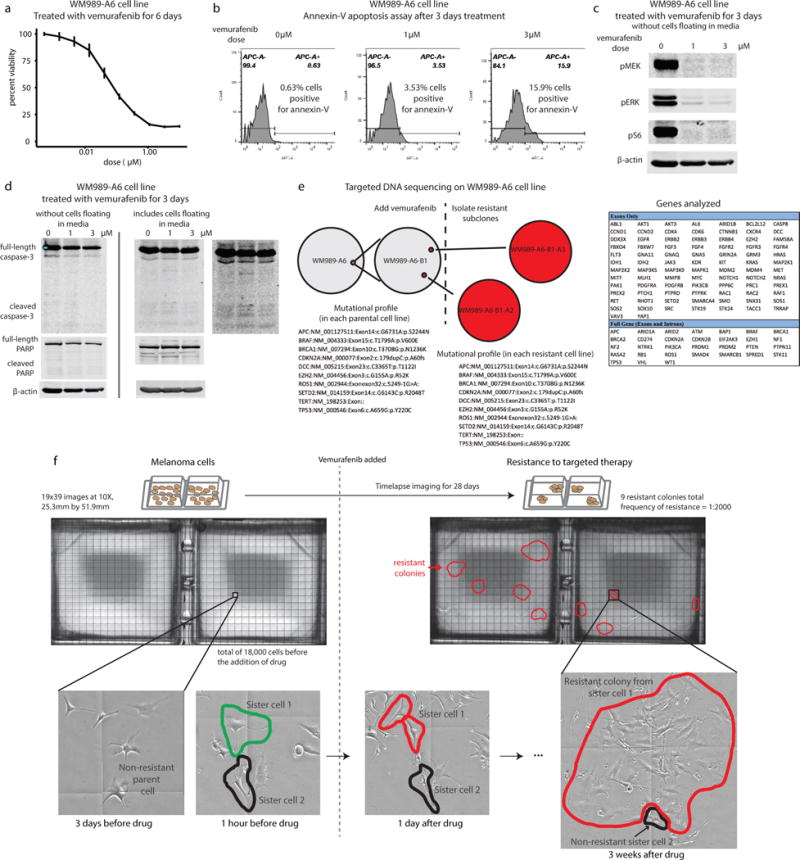
a. Percent viability of WM989-A6 cells treated with vemurafenib for 6 days (MTS assay). b. Annexin-V staining in WM989-A6 cells after 3 days of treatment with vemurafenib measured by flow cytometry. The percentage of cells that are positive for annexin-v is labeled on the plots. c. Western blot for pMEK, pERK, and pS6 after 3 days of treatment with vemurafenib. d. Western blot for caspase-3 and PARP after 3 days treatment with vemurafenib. This demonstrates that WM989-A6 cells are highly responsive to BRAF inhibitor treatment with inhibition of signaling downstream of BRAF and apoptosis of sensitive cells. e. We performed targeted DNA-sequencing on a panel of 119 cancer and melanoma-related genes. We performed sequencing on the parental WM989-A6 subclone used throughout this work, along with WM989-A6-B1 subclone. From the WM989-A6-B1 subclone, we isolated two resistant subclones, WM989-A6-B1-A2 and WM989-A6-B1-A3. All of these cell lines had the same mutational profile. Thus, we can say that none of the clinically documented mutational profiles (such as in KRAS) appeared as genetic resistance mechanisms in our experiments. This does not in and of itself preclude, however, mutations to other genes or non-coding mutations to regulatory regions. f. Twenty-eight day time-lapse images of WM989-A6 cells before and then after application of cytostatic dose of vemurafenib. Sister cells are labeled in the images. There were approximately 18,000 cells at the time that we applied drug, and a total of 9 resistant colonies formed on the culture dish. We observed instances in which two sister cells exhibited divergent phenotypes, for instance, one would respond to drug while the other would continue growing, eventually forming a resistant colony. These results suggested the possibility of a non-genetic resistance mechanism, although do not constitute proof.
Extended Data Fig. 2. RNA-sequencing identifies genes whose expression is specific to resistance.
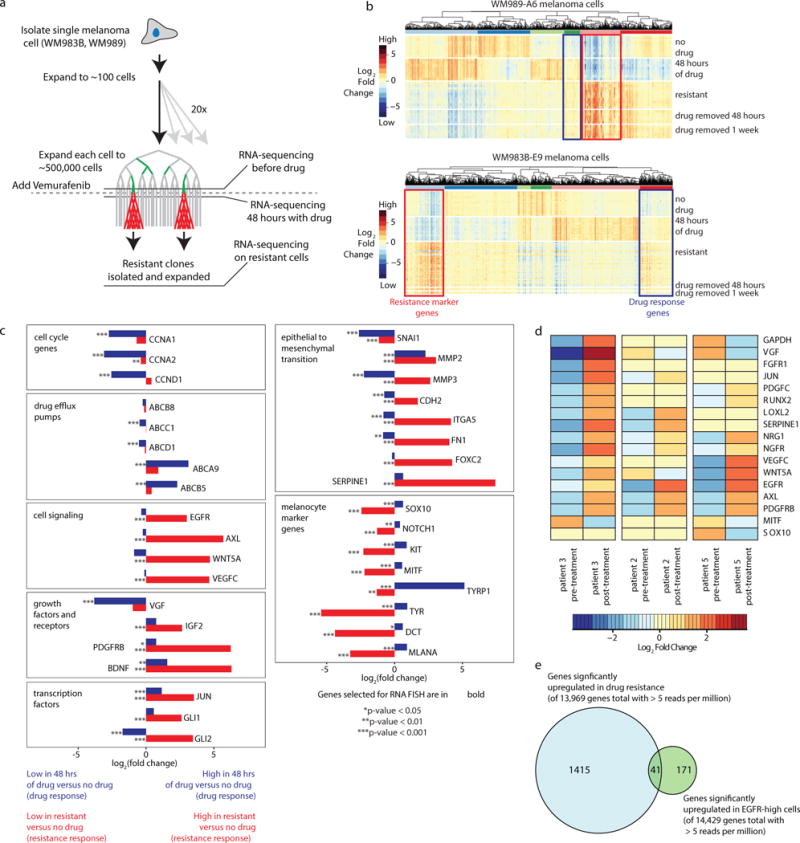
a. Schematic of transcriptional profiling experiments. We harvested cells for analysis before drug, 48 hours after drug application and then on stably resistant cultures. b. Heatmaps depicting expression changes across all differentially expressed genes. Each row represents a separate RNA-sequencing experiment taken from a different Luria-Delbruck subclone. Resistant cultures obtained from subculturing resistant colonies. All genes shown have a greater than 1.4 fold change and adjusted p-value less than 10−5 in at least one experimental condition. Color represents log2 of fold change across the conditions. c. Fold changes in expression in drug response (blue; fold change of 48 hours in drug vs. no drug) and resistance (red; fold change of resistant cells vs. no drug) for WM989-A6 cell line. Bolded gene names are the genes that were selected for analysis by RNA FISH in WM989-A6 cells (Fig. 2a). P-values for differential expression of the drug response or resistance are indicated by asterisks next to each bar and cutoffs are labeled below the plots. d. RNA sequencing of patient tumors pre-treatment and post-treatment from Sun et al. Nature 2014 shows changes in gene expression for many of the same resistance marker genes found in WM989-A6 cells. Heatmap depicts the log2 fold change for each gene. Samples are normalized by patient. The genes displayed here are the same panel of genes used for RNA FISH in WM989-A6 cells in Fig. 2a. This analysis demonstrates that there is significant overlap between the transcriptional signature of resistance in WM989-A6 cells and resistant patient samples. e. We wondered whether the set of pre-resistance associated markers was a privileged subset of the genes upregulated upon the cell becoming drug-resistant. We performed our analysis on WM989-A6 cells, comparing untreated cells, cells treated with vemurafenib for 48 hours, and resistant cells to identify marker genes that are upregulated uniquely during drug-resistance (n=1,456) and EGFR-high to EGFR-mix for pre-resistance markers (n=212) (significance defined as log2 fold change of 0.5, p=0.00001). We found that there was a strong overlap of 41 genes, but there were also clearly genes specific to both drug-resistance and pre-resistance, suggesting that they are not the same biological process per se.
Extended Data Fig. 3. Luria-Delbrück fluctuation analysis demonstrates that WM989-A6 and WM983B-E9 cells develop drug resistance through a non-heritable mechanism.
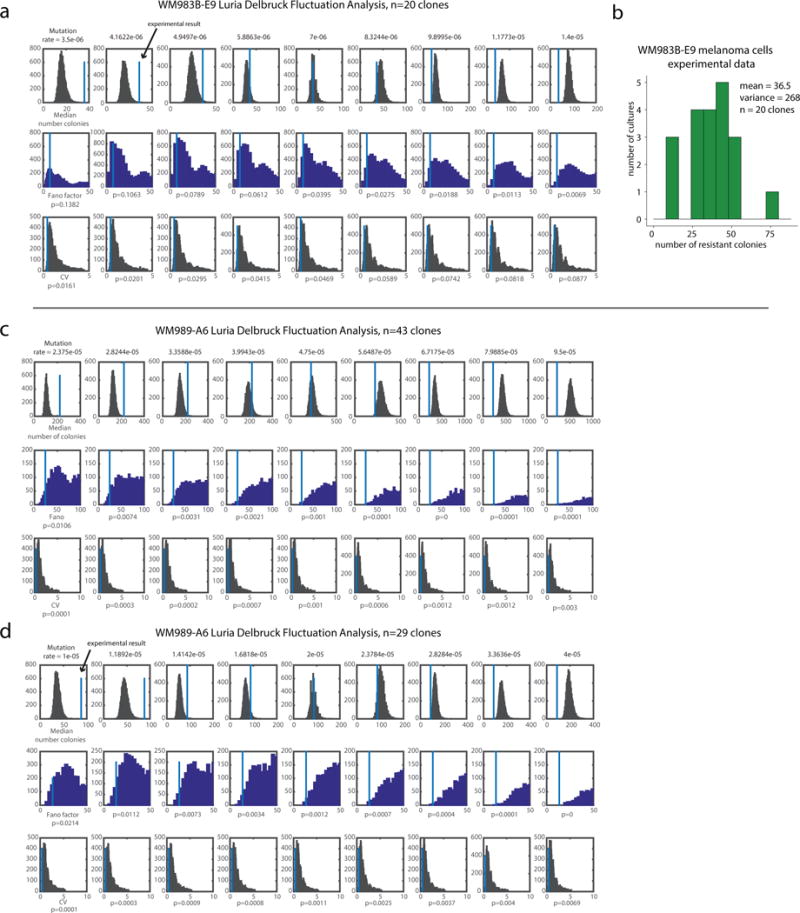
a. We simulated the strongly heritable hypothesis for a range of different mutation rates. At each mutation rate, we ran the simulation 10,000 times. We used the parameters specific to this experiment for the WM983B-E9 cell line, including the total number of divisions and subsampling of the cultures prior to drug treatment. Each column of plots assumes a different mutation rate which is labeled above. The first row contains histograms of the median number of colonies from each simulation, the second row contains histograms of the Fano factor from each simulation, and the third row contains histograms of the coefficient of variation (CV) from each simulation. In each plot, the value corresponding to our experimental findings are labeled by the vertical line. The p-value to reject the strongly heritable hypothesis based upon the Fano factor or CV at each mutation rate is below the plot. b. Histogram of the number of resistant colonies from the Luria Delbruck fluctuation analysis in WM983B-E9 with a total of 20 clones. c,d. We performed the Luria-Delbrück fluctuation analysis twice with the WM989-A6 cell line. As described for a, we simulated the strongly heritable hypothesis for a range of different mutation rates. The plots in panels c and d are from separate biological replicates with a total of 43 and 29 clones. The super-Poisson distribution we observed may potentially be due to variation in plating efficiency or proliferation rates between clones; the pre-resistant state may also be heritable over small numbers of divisions.
Extended Data Fig. 4. RNA FISH on thousands of melanoma cells reveals rare cells that express high levels of resistance marker genes.
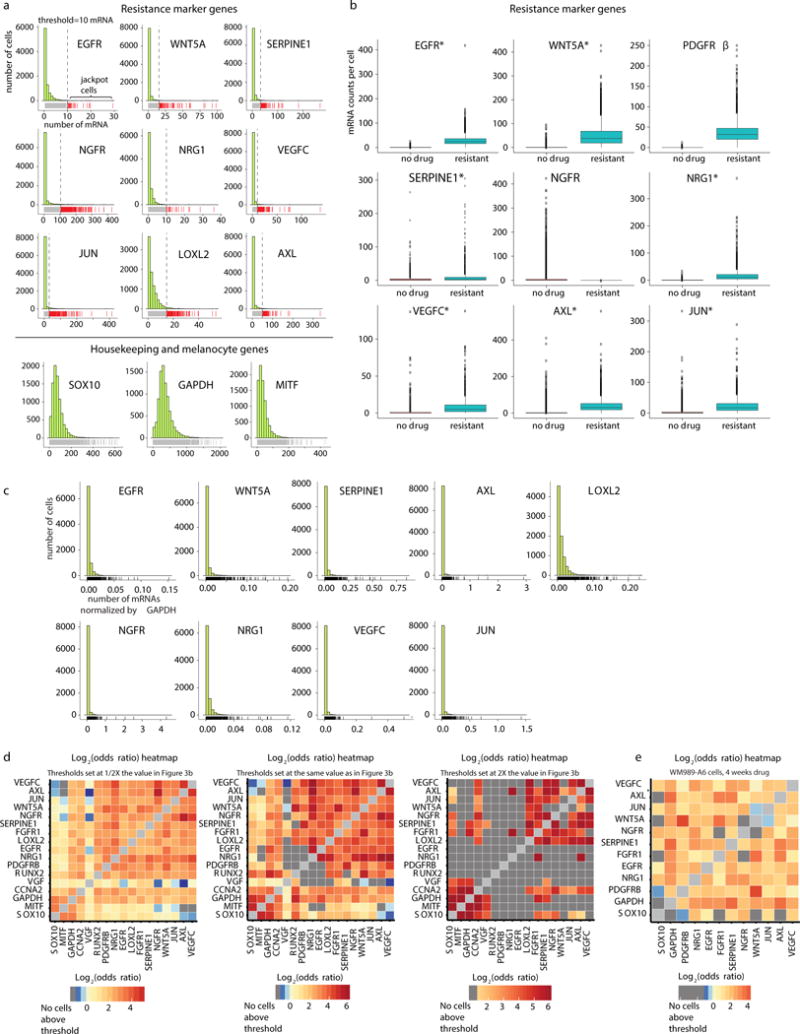
a. Histograms of transcript abundance for resistance marker genes (top) and nonresistance markers (bottom). The vertical lines represent the threshold for designating cells as either “high” or “low” expressing for a particular gene. The cells labeled by the red carpet below the histogram are high expressing, and the cells labeled by the gray carpet are low expressing. The data set shown contains a total of 8672 cells and is one of two biological replicates. b. In an untreated population of cells, rare cells express resistance marker genes at much higher levels than the population average, sometimes at levels similar to the drug resistant state. Boxplots showing the distribution of mRNA counts per cell for untreated WM989-A6 cells and resistant WM989-A6 cells. The untreated data set is the same data as shown in a. For the resistant WM989-A6 cells, we performed iterative RNA FISH with the same panel of genes. The untreated data set contains a total of 8672 cells and the resistant data set contains a total of 4082 cells (1 of n=2 biological replicates are shown for each dataset). Asterisks next to the gene names indicates that the max expression of the untreated sample is greater than or equal to the median of the resistant sample, demonstrating that for these 7 of 9 genes, the “high” cells have expression levels potentially equivalent to resistant cells. However, we also point out that given that the sampling of high expressing cells in the untreated samples is low, it is difficult to explicitly compare the distributions to say that the expression in the rare high-expressing cells is equivalent to that in stably resistant cells. c. Rare cells expressing sporadic but high levels of resistance markers are still present when each gene is normalized by GAPDH mRNA counts. Each histogram shows the distribution of GAPDH normalized counts for a particular jackpot gene. The counts for each gene in each cells has been divided by the GAPDH counts in that same cell. This accounts for any volume-dependent differences between cells. Cells that had GAPDH counts less than 50 were dropped from this analysis (these cells were infrequent and gave abnormally high numbers after normalization, thus were dropped). With these cells removed, the data set contains a total of 8477 cells. d. Heatmap shows the odds ratio for co-expression between all pairs of genes in WM989-A6 cells (1 of n=2 biological replicates shown). Dark gray boxes label pairs where there were zero cells with counts high expression threshold for both genes. The heatmap in the middle has the same thresholds for designating cells as “high” or “low” as used in Fig. 3b. Meanwhile, the heatmap on the left shows the same analysis with the thresholds set to 1⁄2 of the their value in 3b and the heatmap on the right shows this analysis with thresholds set to twice their value in Fig. 3b. When the thresholds are at 1⁄2, the result is very similar to that in Fig. 3b. However, increasing the threshold by 2X leads to many gene pairs that do not have any cells that are “high” for both genes (indicated by the dark gray boxes). e. Heatmap showing odds ratios for WM989-A6 data after 4 weeks in drug (1 of n=2 biological replicates shown).
Extended Data Fig. 5. Sorting for EGFR-high cells enriches for pre-resistant cells and removing drug from resistant cells does not appear to reverse the resistant phenotype.
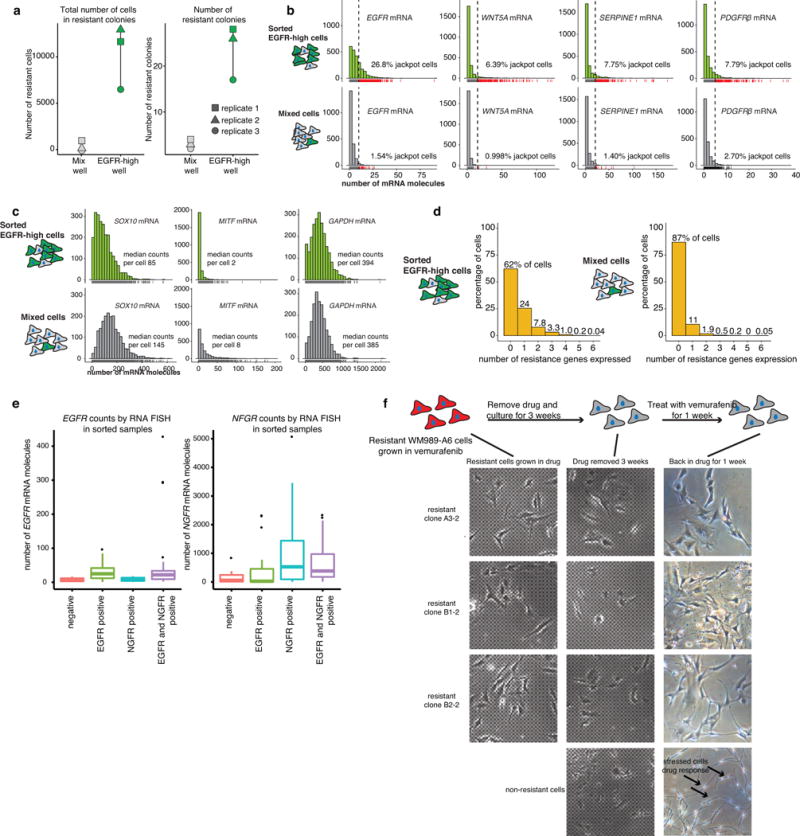
a. Quantification of 3 biological replicates of the experiment depicted in Fig. 1f. b,c. Histograms showing the transcript abundance measured by RNA FISH in untreated and FACS sorted EGFR-high and mixed cell populations (n=1). The green histograms are from the EGFR-high population and the gray histograms are the mixed population. The percentage of high-expressing cells are labeled on each plot. Panel b shows resistance marker genes EGFR, WNT5A, SERPINE1, and PDGFRβ, and panel c shows melanocyte development genes, SOX10 and MITF, and a housekeeping gene, GAPDH. d. Histograms of percentage of cells that have high expression of a particular number of genes simultaneously. The left histogram is from the FACS sorted EGFR-high cells, and the right histogram is from the mixed population. e. Boxplots summarize the single-cell RNA FISH counts for EGFR and NGFR in flow sorted populations shown in Fig. 3c. These results show that sorting the high populations indeed enriched for EGFR and NGFR mRNA, thus validating the sort procedure (n=1). Furthermore, it shows that the double sorting does not further enrich for either EGFR or NGFR mRNA alone, showing that the effects of the double sort do not arise from a further enrichment of either EGFR or NGFR-high cells per se, but rather the combination of both in the same cell. f. Isolated resistant subclones are stably resistant to vemurafenib. We established stably resistant subclones of WM989-A6 cells grown in vemurafenib by culturing genetically homogeneous WM989-A6 subclones, adding drug, then isolating small resistant colonies and expanding them in the presence of drug into large populations. For three such resistant subclones, we removed drug for a period of three weeks (drug “holiday”), then added drug back for a week and looked for response. Generally, the cells looked fairly similar to the pre-holiday state and continued to proliferate, indicating that they remained insensitive to drug despite the prolonged holiday from drug exposure. The bottom panel is a control experiment consisting of a non-resistant parental line exposed to drug, showing the morphological changes associated with drug response.
Extended Data Fig. 6. Iterative RNA FISH enables quantification of genes that are expressed in rare cells and control genes that are expressed throughout a population.
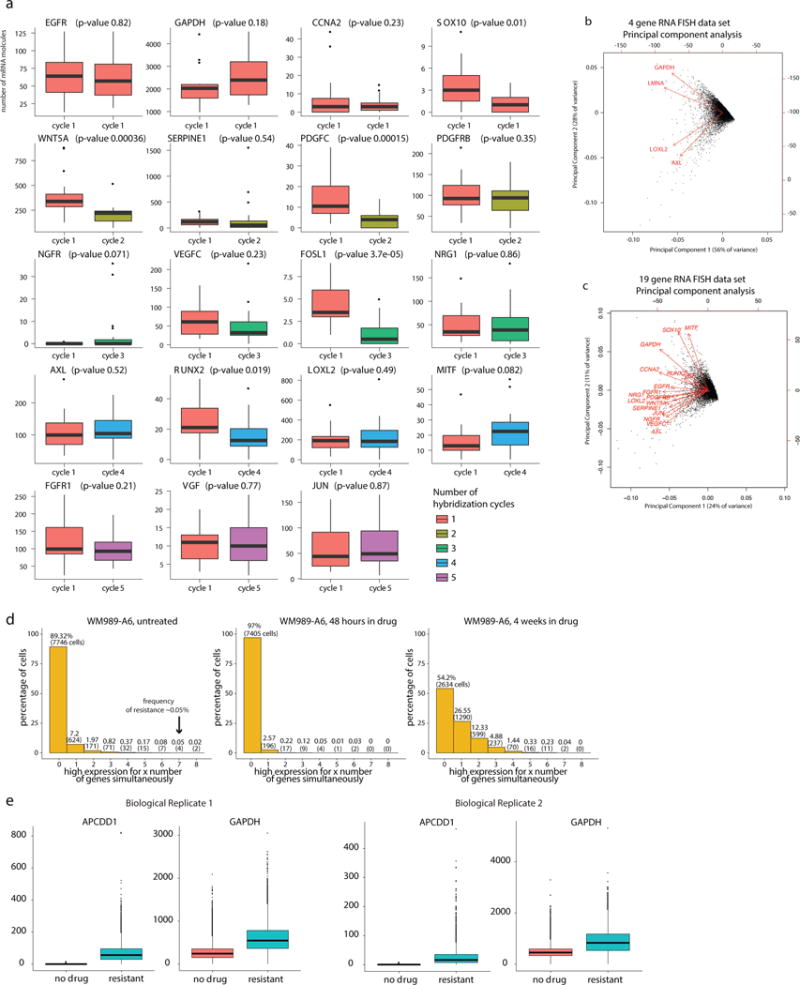
a. RNA counts are consistent whether a gene is probed on the first cycle of iterative RNA FISH or subsequent cycles. Boxplots summarizing RNA FISH mRNA counts for each gene in the 19 gene panel (shown in Fig. 2a). We probed each gene from the panel in resistant WM989-A6 cells without performing iterative hybridizations (n=1 with further validation performed on a 5 gene panel; note that we used resistant cells because the generally higher expression levels allowed for more robust comparisons). We then performed iterative RNA FISH with all the probes and compared the total mRNA counts. We took image z-stacks of each sample and captured a total 15–25 cells per sample. Expression levels were similar between the first round of hybridization and all subsequent hybridization cycles. The color of the boxplot indicates the hybridization cycle during which we used each probe. The p-value for differences in RNA counts between the cycles are labeled above each plot. Some variability may be due to sampling with genes that have low and/or highly variable expression, and in these instances, we expect some differences in the two count distributions. There is some loss for some genes in later cycles, but we do not believe that affects our qualitative findings of rare, high-expressing cells. b. Housekeeping genes correlate more with each other than with resistance markers and vice-versa. We performed RNA FISH on 8672 non-drugged cells with probes targeting LOXL2 and AXL (both of which exhibit rare-cell expression) and LMNA and GAPDH, both of which are control genes not associated with resistance (1 of n=2 biological replicates shown). We then performed principal component analysis to determine which genes covary with which other genes. We transformed the vector representing the expression levels of each cell into the space spanned by the first two principal components. Arrows represent transformations of unit vectors of the specified gene into this same space. We observed two rough axes of variability, one corresponding to the GAPDH and LMNA and the other to AXL and LOXL2. Thus, these results show that there is substantial covariation in housekeeping genes and in resistance markers, but that these two axes of variation separate. c. Same plot as in panel b, but with the RNA FISH data shown for WM989-A6 in Figure 2b. d. There are subpopulations of cells that have high expression of multiple resistance marker genes. Histogram of number/fraction of cells that have high expression for a particular number of genes simultaneously, both before, immediately after and then 4 weeks after application of drug (1 of n=2 biological replicates shown). We found that immediately after adding drug, there was a large general decrease in the amount of high-expressing cells, but a few cells remained that expressed several marker genes at once. This suggests, but certainly does not prove, that these multi-expressing cells may be the pre-resistant cells. At best, it establishes that such a correspondence is plausible. e. We used RNA FISH analysis to look (in WM989-A6 cells) at the expression of APCDD1 cells, which was identified as a potential marker of drug-induced reprogramming (as opposed to pre-re- sistance). We measured APCDD1 expression in a total of 61,770 (20,030 in replicate 1 and 41,740 in replicate 2) cells before adding drug and 11,452 (7,138 in replicate 1 and 4,314 cells in replicate 2) cells after cells became stably resistant (n=2 biological replicates shown). Given the number of cells analyzed, we expected that roughly 30 cells in the untreated population would be pre-resistant (assuming conservatively that the frequency of pre-resistance is 1:2000), but despite that, we found essentially no cells with APCDD1 expression levels approaching those of even the median resistant cell. Thus, expression of this gene must have changed upon the pre-resistant cell becoming stably resistant in the presence of drug, as opposed to a selection effect in which high levels of expression in pre-resistance cells become prevalent due to those cells surviving rather than reprogramming.
Extended Data Fig. 7. Gini analysis on other single cell expression data sets and network structure for rare high expressing cells.
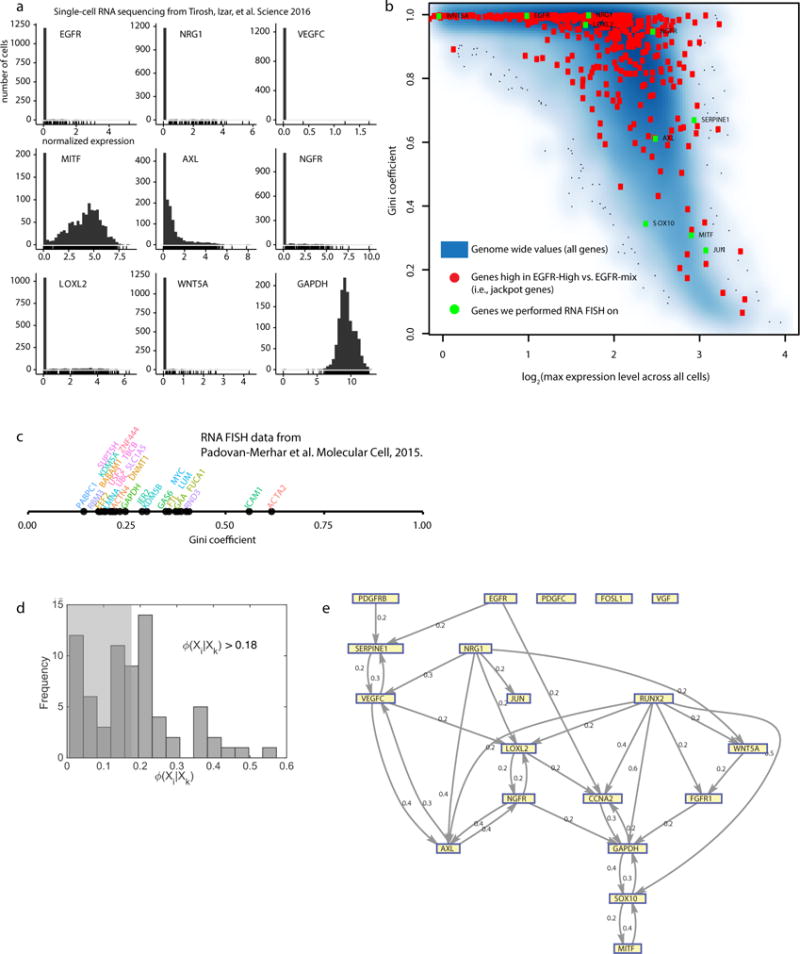
a. Rare cells expressing high levels of resistance genes are suggested by single cell sequencing data from Tirosh, Izar, et al. Science 2016. Histograms of normalized single-cell expression data for 9 marker genes, including all malignant cells from this data set. b. Study of Gini coefficients based on single cell RNA-sequencing data (looking at patient 79 with 469 cells; results similar for other patients). As per GiniClust (Jiang et al. Genome Biology 2016), we first plotted the Gini coefficient vs. the maximum expression level out of all cells examined (results similar if one uses the mean instead of max). As they did, we found a strong anti-correlation, which presumably results from the large number of artifactual zeros in the datasets that inflate Gini coefficients in general for lowly expressed genes. As a positive control, we examined 405 genes that we know to be jackpot genes (high fold change in EGFR-High vs. EGFR-mix), and we found that they were essentially randomly scattered throughout the distribution. We then plotted genes we performed RNA FISH on. We found again that they were squarely in the middle of the distribution and not towards the top right of the region, which is where one would expect to find abnormally high Gini coefficient genes. There are two possible interpretations of our data. One is that the Gini coefficients of the genes we selected are not especially different from those of similarly expression matched cells, and so the genes we selected do not comprise a deviant subset of all genes. Another is that single cell RNA-sequencing data has a number of known and unknown artifacts that make Gini analysis difficult. We favor the latter based on our experience with RNA FISH and the results of Battich and Stoeger et al. Cell 2015, but our current analysis leaves us unable to resolve this for now. We do, however, note that Tirosh et al. do report low frequency AXL positive cells via immunofluorescence, which is directly comparable and consistent with our RNA FISH results. c. Gini analysis of 26 references genes from Padovan-Merhar et al. Molecular Cell 2015. Padovan-Merhar et al. performed RNA FISH to obtain single cell RNA FISH counts for a panel of 26 genes across a range of expression values and degrees of variability. We calculated the Gini coefficient for each gene. We found that 24 out of the 26 genes had low Gini coefficients (less than 0.5), while two had Gini coefficients slightly higher than 0.5. None were as high as the highest amongst our panel of pre-resistance markers. These results suggest that our panel of resistance markers have higher degrees of rare-cell expression behavior than average, although a more unbiased RNA FISH analysis with a more complete set of genes would make such a conclusion more definitive. d. Phixer analysis reveals the network structure of rare-cell expression (see Supplementary Discussion 1). Histogram of the φ-mixing coefficient (edge strength) for all edges in the inferred network for melanoma undrugged cancer cells. To illustrate the network we select the 34 most strongest edges (non-shaded portion), and this corresponds to selecting edges with φ ≥ 0.18. e. Gene interactions obtained using the phixer algorithm applied to the single-cell RNA FISH data from cancer cells. Each directed edge and its corresponding strength (φ-mixing coefficient) quantifies the effect of an upstream gene on the probability of rare-cell expression of a downstream gene.
Extended Data Fig. 8. Analysis of multiple patient-derived xenografts reveals cells that sporadically express high levels of some resistance markers.
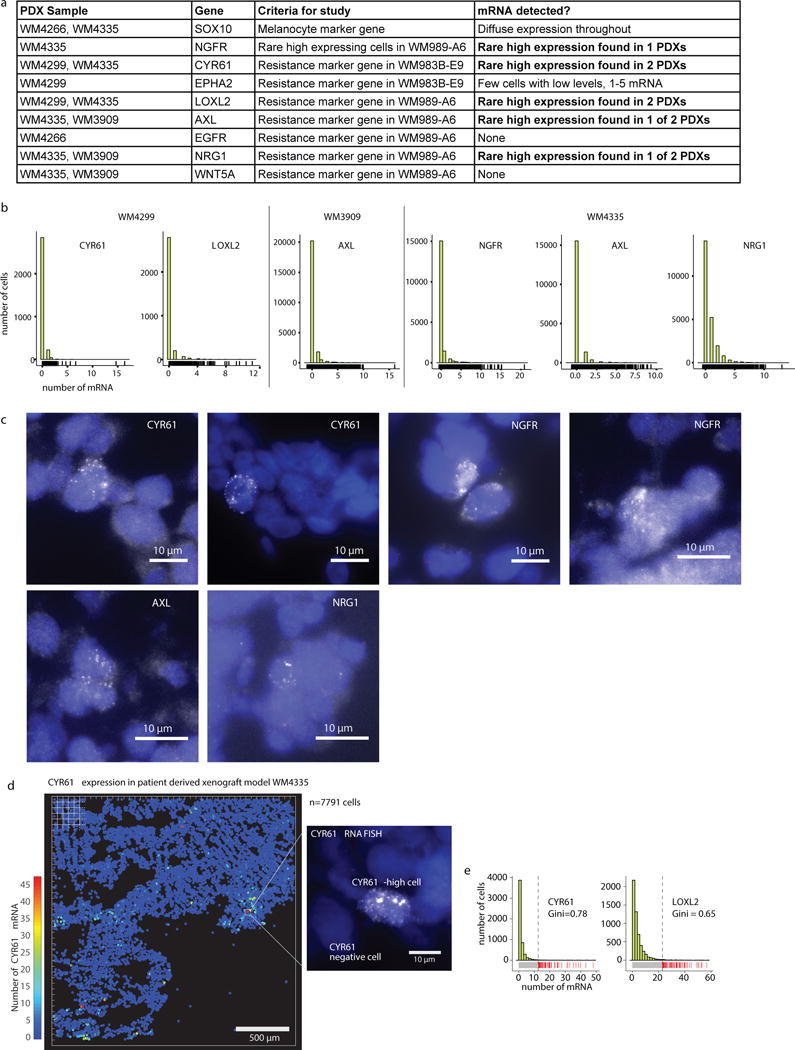
a. Table summarizing results of our patient-derived xenograft experiments, including the 4 different models and all the genes tested with each. b. Histograms show full distribution of mRNA expression for genes for which we saw convincing signal. Note that for some expressing genes, there were sporadic noise spots in the analysis, leading to some cells with, say, transcript counts of 1–2 that are probably spurious. c. Image panel of marker gene expression in the patient-derived xenografts. d. Computational representation of CYR61 mRNA expression in patient-derived xenografts. Each cell is represented by a dot on this plot and the color of the dot represents the number of RNA in that particular cell as indicated by the color scale bar. e. Histograms show full distribution of mRNA expression for CYR61 and LOXL2 in WM4335.
Extended Data Fig. 9. Analysis of resistance after sorting by NGFR or AXL.
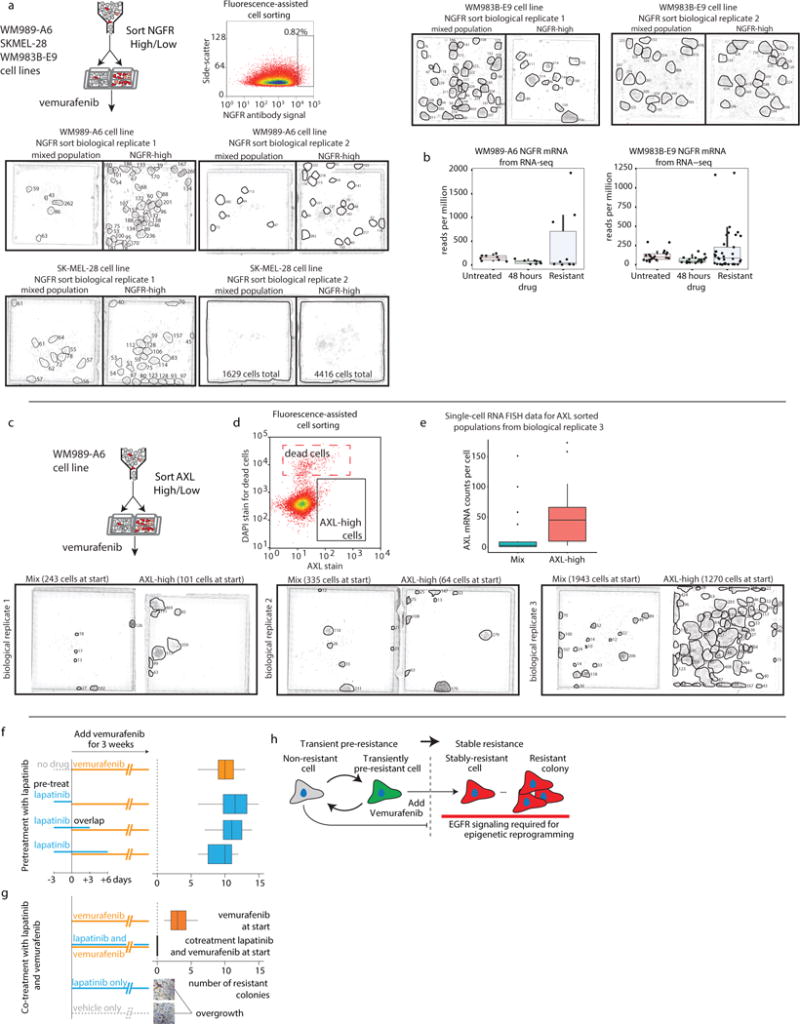
a. We sorted three cell lines (WM989-A6, WM983B-E9, and SK-MEL-28) by NGFR antibody staining and applied vemurafenib for three weeks to look for differences in resistance. In WM989 cells and SK-MEL-28 cells, we observed an increased amount of resistant cells after NGFR sorting (2 biological replicates shown). In WM983B cells, we did not observe an enrichment in resistant cells, suggesting that NGFR is not resistance marker in this cell line (2 biological replicates shown). b. We performed analysis of RNA-sequencing transcript abundance levels in a number of independent subclones of WM983B-E9 both before drug addition, after 48 hours of drug addition, and after isolating stably resistant subclones. We found that NGFR was strongly associated with resistance in 3 of 10 clones, whereas in WM983B-E9, just 2 of 37 showed upregulation of NGFR. c. We sorted WM989-A6 cells by AXL antibody staining and applied vemurafenib to look for differences in resistance. Three biological replicates shown here. For each replicate, we recovered a different number of cells from the sort causing each experiment to have a different number of cells at the start of drug treatment. These numbers are shown in parenthesis above each image. After sorting, biological replicates 1 and 2 were in drug for 28 days before imaging and biological replicate 3 was in drug for 17 days before imaging. d. Example of plots from fluorescence assisted cell sorting plots showing the existence of a population of dead cells that we excluded. e. Validation of the AXL sorting by RNA FISH analysis post-sort. f. EGFR signaling affects the burn-in phase of resistance. Pre-treatment with lapatinib and vemurafenib and corresponding quantification of number of resistant colonies. g. Co-treatment of lapatinib and vemurafenib (also vemurafenib, lapatinib and vehicle only). No growth inhibition for lapatinib and vehicle only. (1 of n=2 biological replicates). h. Schematic of resistance model.
Extended Data Fig. 10. RNA-sequencing on FACS sorted EGFR high cells shows that sporadically expressing genes are more highly expressed in EGFR-high cells than the mixed population.
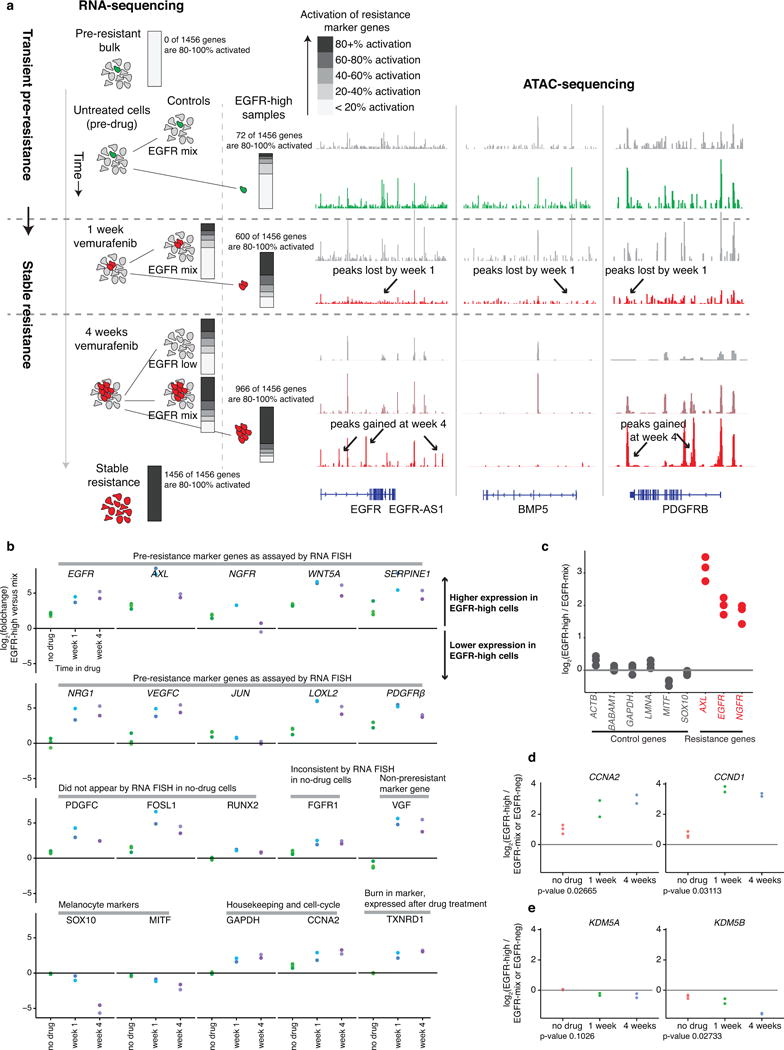
a. We sorted EGFR-high cells at different time points in vemurafenib treatment (untreated n=3, 1 week n=2, and 4 weeks n=2) and performed RNA sequencing and ATAC sequencing on the sorted populations. Bar plots showing percentage of the resistance transcriptome that has become activated at different levels in each of the samples. Activation index is defined as log2 of the fold change divided by the total log2 fold change for the gene between the bulk non-resistant and bulk stably resistant populations. We then performed ATAC-seq analysis to identify differentially accessible sites between the sorted cell populations; example tracks shown displaying accessible site loss and gain from one of two replicates. b. Dot plot comparing the gene expression differences between EGFR-high and the mixed cell population. The y-axis shows the log2 fold change between the EGFR-high and mix cells, and the x-axis shows the different time points in drug (untreated, 1 week, and 4 weeks). Dots that fall above the zero line represent samples that have higher expression in the EGFR-high cells and dots that fall below the zero line represent samples that have lower expression in the EGFR-high cells. The genes summarized here are the same panel of genes used for multiplex RNA FISH in Fig. 2a. Each dot represents a separate biological replicate. There are 3 biological replicates for the untreated condition, 2 biological replicates for week 1, and 2 biological replicates for week 4. We found that 8 of the 10 genes that exhibited rare expression behavior also exhibited increased expression in the EGFR-high cells (EGFR, AXL, NGFR, WNT5A, SERPINE1, JUN, LOXL2 and PDGFRB). c. Control genes do not show as much enrichment in the EGFR-high subpopulation as the pre-resistance marker genes. We sorted by EGFR antibody to isolate the EGFR-high subpopulation of cells and then performed RNA sequencing on these populations as well as an EGFR-mixed population. Dot plots show the log2 fold change in gene expression for a set of control genes and a set of resistance marker genes. Each dot represents a separate biological replicate (paired EGFR-high/EGFR-mixed). The horizontal line at y=0 represents no change in the EGFR-high samples relative to the EGFR-mix. For the resistance marker genes (EGFR, AXL, and NGFR), there is significantly more expression in the EGFR-high sample, while the control genes do not show large differences, showing that they do not correlate with the expression of the resistance markers. d. EGFR-high cells are proliferating based upon expression of cell cycle markers. Barplot showing the fraction of max expression for cell cycle genes (CCNA2 and CCND1) across EGFR-high, EGFR-mixed, and EGFR-negative populations at each time point. e. EGFR-high cells do not express markers of slow-cycling subpopulations. Barplot showing the fraction of max expression for KDM5A and KDM5B, which are both markers of slow-cycling subpopulations in melanoma (Roesch et al. 2010; Sharma et al. 2010), across EGFR-high, EGFR-mixed, and EGFR-negative populations at each time point. Note that we only collected an EGFR-negative sample at 4 weeks because this was the only time point where the EGFR-high cells represented a significant portion of the total mixed population (>1%).
Supplementary Material
supp_data1
supp_data2
supp_data3
supp_data4
supp_discussion
supp_guide
video
Acknowledgments
We thank Gautham Nair for suggesting Luria-Delbrück experiments, Matt MacLean for image software; Hyun Youk, Ashani Weeraratna, and Julia Rood for feedback on the manuscript, and Raj Lab members for comments. AR acknowledges NIH New Innovator Award DP2 OD008514, NIH/NCI PSOC award number U54 CA193417, NSF CAREER 1350601, NIH R33 EB019767, P30 CA016520. SMS acknowledges NIH F30 AI114475. AS acknowledges National Science Foundation Grant DMS-1312926. MH acknowledges P01 CA114046, R01 CA047159, SPORE P50 CA174523, Melanoma Research Foundation, Dr. Miriam and Sheldon G. Adelson Medical Research Foundation. KN acknowledges Melanoma Research Alliance, P50 CA174523, P01 CA114046.
Footnotes
Author contributions:
SMS, AR designed the study. SMS performed all experiments and analysis except: MD, ST assisted with fluctuation analysis and RNA-sequencing; EAT, BE performed NGFR and AXL sort experiments; CK, MB, KS performed PDX experiments; PB, MH provided cell lines; MX performed WM989-A6 characterization; EE developed iterative RNA FISH protocol; INA, KN performed DNA sequencing. MH provided guidance. SMS, AR wrote the paper.
Author information:
AR receives consulting income and AR and SMS receive royalties related to Stellaris™ RNA FISH probes.
References
- 1.Trunzer K, et al. Pharmacodynamic effects and mechanisms of resistance to vemurafenib in patients with metastatic melanoma. J Clin Oncol. 2013;31:1767–1774. doi: 10.1200/JCO.2012.44.7888. [DOI] [PubMed] [Google Scholar]
- 2.Garraway LA, Jänne PA. Circumventing cancer drug resistance in the era of personalized medicine. Cancer Discov. 2012;2:214–226. doi: 10.1158/2159-8290.CD-12-0012. [DOI] [PubMed] [Google Scholar]
- 3.Nazarian R, et al. Melanomas acquire resistance to B-RAF(V600E) inhibition by RTK or N-RAS upregulation. Nature. 2010;468:973–977. doi: 10.1038/nature09626. [DOI] [PMC free article] [PubMed] [Google Scholar]
- 4.Krepler C, et al. Personalized pre-clinical trials in BRAF inhibitor resistant patient derived xenograft models identify second line combination therapies. Clin Cancer Res. 2015 doi: 10.1158/1078-0432.CCR-15-1762. [DOI] [PMC free article] [PubMed] [Google Scholar]
- 5.Spencer SL, Gaudet S, Albeck JG, Burke JM, Sorger PK. Non-genetic origins of cell-to-cell variability in TRAIL-induced apoptosis. Nature. 2009;459:428–432. doi: 10.1038/nature08012. [DOI] [PMC free article] [PubMed] [Google Scholar]
- 6.Sharma SV, et al. A chromatin-mediated reversible drug-tolerant state in cancer cell subpopulations. Cell. 2010;141:69–80. doi: 10.1016/j.cell.2010.02.027. [DOI] [PMC free article] [PubMed] [Google Scholar]
- 7.Gupta PB, et al. Stochastic state transitions give rise to phenotypic equilibrium in populations of cancer cells. Cell. 2011;146:633–644. doi: 10.1016/j.cell.2011.07.026. [DOI] [PubMed] [Google Scholar]
- 8.Pisco AO, Huang S. Non-genetic cancer cell plasticity and therapy-induced stemness in tumour relapse: ‘What does not kill me strengthens me’. Br J Cancer. 2015;112:1725–1732. doi: 10.1038/bjc.2015.146. [DOI] [PMC free article] [PubMed] [Google Scholar]
- 9.Ramirez M, et al. Diverse drug-resistance mechanisms can emerge from drug-tolerant cancer persister cells. Nat Commun. 2016;7:10690. doi: 10.1038/ncomms10690. [DOI] [PMC free article] [PubMed] [Google Scholar]
- 10.Nguyen A, Yoshida M, Goodarzi H, Tavazoie SF. Highly variable cancer subpopulations that exhibit enhanced transcriptome variability and metastatic fitness. Nat Commun. 2016;7:11246. doi: 10.1038/ncomms11246. [DOI] [PMC free article] [PubMed] [Google Scholar]
- 11.Symmons O, Raj A. What’s Luck Got to Do with It: Single Cells, Multiple Fates, and Biological Nondeterminism. Mol Cell. 2016;62:788–802. doi: 10.1016/j.molcel.2016.05.023. [DOI] [PMC free article] [PubMed] [Google Scholar]
- 12.Luria SE, Delbrück M. Mutations of Bacteria from Virus Sensitivity to Virus Resistance. Genetics. 1943;28:491–511. doi: 10.1093/genetics/28.6.491. [DOI] [PMC free article] [PubMed] [Google Scholar]
- 13.Webster MR, Weeraratna AT. A Wnt-er migration: the confusing role of β-catenin in melanoma metastasis. Sci Signal. 2013;6:e11. doi: 10.1126/scisignal.2004114. [DOI] [PubMed] [Google Scholar]
- 14.Müller J, et al. Low MITF/AXL ratio predicts early resistance to multiple targeted drugs in melanoma. Nat Commun. 2014;5:5712. doi: 10.1038/ncomms6712. [DOI] [PMC free article] [PubMed] [Google Scholar]
- 15.Sun C, et al. Reversible and adaptive resistance to BRAF(V600E) inhibition in melanoma. Nature. 2014;508:118–122. doi: 10.1038/nature13121. [DOI] [PubMed] [Google Scholar]
- 16.Ramsdale R, et al. The transcription cofactor c-JUN mediates phenotype switching and BRAF inhibitor resistance in melanoma. Sci Signal. 2015;8:ra82. doi: 10.1126/scisignal.aab1111. [DOI] [PubMed] [Google Scholar]
- 17.Padovan-Merhar O, et al. Single mammalian cells compensate for differences in cellular volume and DNA copy number through independent global transcriptional mechanisms. Mol Cell. 2015;58:339–352. doi: 10.1016/j.molcel.2015.03.005. [DOI] [PMC free article] [PubMed] [Google Scholar]
- 18.Lubeck E, Coskun AF, Zhiyentayev T, Ahmad M, Cai L. Single-cell in situ RNA profiling by sequential hybridization. Nat Methods. 2014;11:360–361. doi: 10.1038/nmeth.2892. [DOI] [PMC free article] [PubMed] [Google Scholar]
- 19.Jiang L, Chen H, Pinello L, Yuan GC. GiniClust: detecting rare cell types from single-cell gene expression data with Gini index. Genome Biol. 2016;17:144. doi: 10.1186/s13059-016-1010-4. [DOI] [PMC free article] [PubMed] [Google Scholar]
- 20.Roesch A, et al. Overcoming intrinsic multidrug resistance in melanoma by blocking the mitochondrial respiratory chain of slow-cycling JARID1B(high) cells. Cancer Cell. 2013;23:811–825. doi: 10.1016/j.ccr.2013.05.003. [DOI] [PMC free article] [PubMed] [Google Scholar]
- 21.Tirosh I, et al. Dissecting the multicellular ecosystem of metastatic melanoma by single-cell RNA-seq. Science. 2016;352:189–196. doi: 10.1126/science.aad0501. [DOI] [PMC free article] [PubMed] [Google Scholar]
- 22.Buenrostro JD, Giresi PG, Zaba LC, Chang HY, Greenleaf WJ. Transposition of native chromatin for fast and sensitive epigenomic profiling of open chromatin, DNA-binding proteins and nucleosome position. Nat Methods. 2013;10:1213–1218. doi: 10.1038/nmeth.2688. [DOI] [PMC free article] [PubMed] [Google Scholar]
- 23.Verfaillie A, et al. Decoding the regulatory landscape of melanoma reveals TEADS as regulators of the invasive cell state. Nat Commun. 2015;6:6683. doi: 10.1038/ncomms7683. [DOI] [PMC free article] [PubMed] [Google Scholar]
- 24.O’Connell MP, et al. Hypoxia induces phenotypic plasticity and therapy resistance in melanoma via the tyrosine kinase receptors ROR1 and ROR2. Cancer Discov. 2013;3:1378–1393. doi: 10.1158/2159-8290.CD-13-0005. [DOI] [PMC free article] [PubMed] [Google Scholar]
- 25.Viswanathan VS, Schreiber S. Dependency of a therapy-resistant high-mesenchymal state of cancer cells on a lipid peroxidase pathway. Nature. doi: 10.1038/nature23007. [DOI] [PMC free article] [PubMed] [Google Scholar]
- 26.Hata AN, et al. Tumor cells can follow distinct evolutionary paths to become resistant to epidermal growth factor receptor inhibition. Nat Med. 2016;22:262–269. doi: 10.1038/nm.4040. [DOI] [PMC free article] [PubMed] [Google Scholar]
- 27.Liao D, Estévez-Salmerón L, Tlsty TD. Conceptualizing a tool to optimize therapy based on dynamic heterogeneityThe authors dedicate this paper to Dr Barton Kamen who inspired its initiation and enthusiastically supported its pursuit. Phys Biol. 2012;9:065005. doi: 10.1088/1478-3975/9/6/065005. [DOI] [PMC free article] [PubMed] [Google Scholar]
- 28.Das Thakur M, et al. Modelling vemurafenib resistance in melanoma reveals a strategy to forestall drug resistance. Nature. 2013;494:251–255. doi: 10.1038/nature11814. [DOI] [PMC free article] [PubMed] [Google Scholar]
- 29.Seghers AC, Wilgenhof S, Lebbé C, Neyns B. Successful rechallenge in two patients with BRAF-V600-mutant melanoma who experienced previous progression during treatment with a selective BRAF inhibitor. Melanoma Res. 2012;22:466–472. doi: 10.1097/CMR.0b013e3283541541. [DOI] [PubMed] [Google Scholar]
- 30.Raj A, van den Bogaard P, Rifkin SA, van Oudenaarden A, Tyagi S. Imaging individual mRNA molecules using multiple singly labeled probes. Nat Methods. 2008;5:877–879. doi: 10.1038/nmeth.1253. [DOI] [PMC free article] [PubMed] [Google Scholar]
Associated Data
This section collects any data citations, data availability statements, or supplementary materials included in this article.
Supplementary Materials
supp_data1
supp_data2
supp_data3
supp_data4
supp_discussion
supp_guide
video