DGAT1-dependent lipid droplet biogenesis protects mitochondrial function during starvation-induced autophagy (original) (raw)
. Author manuscript; available in PMC: 2018 Jul 10.
Summary
Lipid droplets (LDs) provide an “on demand” source of fatty acids (FAs) that can be mobilized in response to fluctuations in nutrient abundance. Surprisingly, the amount of LDs increases during prolonged periods of nutrient deprivation. Why cells store FAs in LDs during an energy crisis is unknown. Our data demonstrate that mTORC1-regulated autophagy is necessary and sufficient for starvation-induced LD biogenesis. The ER-resident diacylglycerol acyltransferase 1 (DGAT1) selectively channels autophagy-liberated FAs into new, clustered LDs that are in close proximity to mitochondria and are lipolytically degraded. However, LDs are not required for FA delivery to mitochondria, but instead function to prevent acylcarnitine accumulation and lipotoxic dysregulation of mitochondria. Our data support a model in which LDs provide a lipid buffering system that sequesters FAs released during the autophagic degradation of membranous organelles, reducing lipotoxicity. These findings reveal an unrecognized aspect of the cellular adaptive response to starvation mediated by LDs.
Keywords: Lipid droplet, autophagy, lipotoxicity, mitochondria, DGAT1, mTORC1
eTOC blurb
Nguyen et al. demonstrate that lipid droplet biogenesis is a general, protective cellular response during periods of high autophagic flux. Under these conditions, lipid droplets prevent lipotoxicity by sequestering fatty acids released during the autophagic breakdown of organelles. In the absence of lipid droplets, acylcarnitines accumulate and cause mitochondrial uncoupling.
Introduction
Throughout evolution, organisms have developed mechanisms to monitor and respond to fluctuations in nutrient abundance (Chantranupong et al., 2015; Efeyan et al., 2015). During prolonged periods of nutrient deprivation, cells initiate global programs to coordinately alter their metabolism, shifting from a reliance on glycolysis to fatty acid (FA) breakdown via mitochondrial β-oxidation for energy (Finn and Dice, 2006). FAs are stored as triacylglycerol (TAG) in lipid droplets (LDs), which are endoplasmic reticulum (ER)-derived organelles that consist of a core of neutral lipids (e.g. TAG and cholesterol esters) encircled by a phospholipid monolayer (Hashemi and Goodman, 2015; Pol et al., 2014; Walther and Farese, 2012). LDs serve as dynamic hubs of cellular lipid metabolism, sequestering excess FAs to prevent lipotoxicity (Bailey et al., 2015; Garbarino et al., 2009; Listenberger et al., 2003; Petschnigg et al., 2009; Velazquez et al., 2016) and providing an “on demand” source of FAs for energy (Cabodevilla et al., 2013; Herms et al., 2015; Rambold et al., 2015). LD-associated neutral lipases (e.g. adipose triglyceride lipase [ATGL]) respond to the metabolic state of the cell and rapidly liberate FAs from the stored TAG for transfer to mitochondria (Lass et al., 2011; Rambold et al., 2015).
Under conditions of prolonged starvation, macro-autophagy (herein referred to as autophagy) is upregulated to recycle cellular components and provide constituents for essential processes (Galluzzi et al., 2014; Yang and Klionsky, 2010). Autophagy involves a suite of specialized proteins that mediate the biogenesis of the autophagosome, a double-membrane organelle that engulfs portions of the cytoplasm and fuses with the lysosome to enable the degradation of the sequestered cytoplasmic contents (Galluzzi et al., 2014;Yang and Klionsky, 2010). The initiation of autophagy is regulated by numerous signaling pathways that respond to alterations in the levels of nutrients, growth factors, chemokines, and stress (Galluzzi et al., 2014; Yang and Klionsky, 2010). Although there are now many examples of selective autophagic degradation, autophagy triggered by nutrient deprivation is relatively nonselective in its delivery of portions of cytoplasm to the lysosome (Galluzzi et al., 2014; Yang and Klionsky, 2010). An exception are mitochondria, which undergo morphological changes that prevent their autophagic degradation (Gomes et al., 2011; Rambold et al., 2011).
The breakdown of LDs and the upregulation of autophagy serve complementary roles in supplying the cell with substrates for the generation of energy. Surprisingly, despite evidence of lipolytic degradation of LDs, the abundance of LDs increased in mouse embryonic fibroblasts (MEFs) during combined starvation for amino acids, glucose, and serum in Hank’s balanced salt solution (HBSS) (Rambold et al., 2015). The increase in LDs was not observed in MEFs lacking the critical autophagy gene ATG5, leading to a model in which the autophagic breakdown of membranous organelles releases lipids that are re-esterified and packaged into new LDs (Rambold et al., 2015). However, the molecular pathways that regulate the biogenesis of autophagy-dependent LDs and the functional explanation for why cells expend energy to package FAs into new LDs during an energy crisis are unknown.
Here, we demonstrate that diacylglycerol acyltransferase 1 (DGAT1) channels FAs into LDs downstream of mTORC1-regulated autophagy during nutrient deprivation. Under these conditions, DGAT1-dependent sequestration of FAs as TAG in LDs protects against lipotoxic disruption of mitochondrial function and promotes cell viability. These data identify an unexplored aspect of the cellular starvation response in which LDs constitute a lipid buffering system that is essential for cellular homeostasis during periods of high autophagy.
Results
Lack of amino acids stimulates autophagy-dependent lipid droplet biogenesis
To gain a better understanding of LD dynamics during starvation, we examined LD distribution and abundance in MEFs incubated in complete serum-containing rich medium (CM) or following transfer from CM into HBSS. In contrast to CM, HBSS induced a rapid increase in LD levels that reached a higher steady state level after 16 hr, exhibiting approximately 3.5-fold more LDs than in CM (Figure 1A,B). The accumulation of LDs was accompanied by the re-localization of dispersed LDs to a highly clustered distribution (Figure 1A,C), and LDs were often observed in close proximity to mitochondria (Figure 1A, Figure S1A–C, and Movies S1–S2). The increase in LDs during starvation also occurred in several cultured human cell lines, including HeLa, Huh7, and U2OS (Figure S1D–G), suggesting that an increase in LDs is a general cellular response to nutrient deprivation.
Figure 1. Lack of amino acids is sufficient to induce autophagy-dependent lipid droplet biogenesis.

(A–C) MEFs were grown in CM or HBSS for the indicated times, fixed, and analyzed by fluorescence microscopy. (A) LDs were stained with BODIPY 493/503 (green), mitochondria with MitoTracker Orange CMTMRos (red), and nuclei with DAPI (blue). (B) The abundance of LDs was quantified during incubations in CM or HBSS. (C) The percentage of cells with dispersed, intermediate, or clustered LDs were quantified after incubating in HBSS for the indicated times. (D and E) Cells deprived of the indicated groups of nutrients for 16 hr were fixed, the distribution of LDs (green) and mitochondria (red) analyzed by fluorescence microscopy (D), and the LD area per cell quantified (E). (F) A time-lapse montage of BODIPY 493/503-stained LDs in live cells during amino acid deprivation in the presence and absence of bafilomycin A1 (BafA1) or FA synthesis inhibitor TVB-3166.(G) Quantification of LD area following a 16 hr amino acid starvation with the indicated treatments (as in panel F). All graphical data are quantified as mean ± SEM. An asterisk indicates a significant difference (p < 0.05, t test) based on n = 50 cells from three independent biological replicates. In the micrographs, white boxes indicate the magnified regions. Scale bars = 10 μm.
See also Figure S1, Figure S2, Figure S3, and Movies S1–S2.
HBSS starvation conditions have low concentrations of glucose and lack amino acids and serum. To define the minimal conditions required to induce LD biogenesis, we selectively depleted groups of nutrients (Figure 1D,E). Incubation in media lacking glucose or serum resulted in a severe decrease in LDs compared to CM (Figure 1D,E), likely due to the degradation of existing LDs and a lack of compensatory LD biogenesis. In contrast, incubation with media lacking amino acids, or just glutamine, increased the pool of LDs, largely phenocopying the effect of HBSS starvation (Figure 1B,D,E). Consistent with the importance of autophagy in starvation-induced LD biogenesis, growth in HBSS or in media lacking amino acids induced LC3 and p62 degradation that could be blocked by bafilomycin A1 (BafA1), an inhibitor of V-ATPase and lysosomal acidification (Figure S2A). In addition, growth in HBSS or in media lacking amino acids also was found to increase autophagy measured using the GFP-LC3-RFP-LC3ΔG autophagic flux reporter (Kaizuka et al., 2016) (Figure S2B). In contrast, glucose or serum deprivation did not significantly impact LC3 or p62 degradation (Figure S2A) or autophagic flux (Figure S2B), supporting a correlation between autophagy induction and LD formation. Moreover, the generation of LDs during amino acid starvation was blocked by BafA1 and by the autophagy inhibitor 3-methyladenine (Figure 1F,G and Figure S3A,B), but was insensitive to the FA synthase inhibitor TVB-3166 (Figure 1F,G). These results indicate that amino acid deprivation is sufficient to induce autophagy-dependent LD biogenesis via lipid recycling, in the absence of de novo FA synthesis.
mTORC1 controls autophagy-dependent lipid droplet biogenesis during starvation
Mechanistic target of rapamycin (mTOR) is a nutrient sensitive kinase that, as part of mTOR complex 1 (mTORC1), functions as a master regulator of cell growth and autophagy (Zoncu et al., 2011). Under conditions of sufficient amino acids, the heterodimeric RagA/B-RagC/D GTPases, the Ragulator complex, and the v-ATPase recruit mTORC1 to the surface of lysosomes, where the kinase activity of mTORC1 is turned on (or unlocked) (Zoncu et al., 2011) (Figure 2A). Conversely, in the absence of amino acids, mTORC1 is no longer recruited to the lysosome and is inactive, resulting in the upregulation of autophagy (Zoncu et al., 2011).
Figure 2. mTORC1-regulated autophagy impacts lipid droplet biogenesis during nutrient deprivation.

(A) A model illustrating methods to control mTORC1 activity by using the small molecule torin1 or by deletion of the Ragulator subunit p18 or the Gator1 subunit Nprl2. (B) Immunoblot analysis of S6K and AMPK phosphorylation in MEF cells incubated in HBSS for the indicated times or treated with the designated compounds for 16 hr. (C and D) MEFs were treated as indicated for 16 hr, fixed, and LDs stained with BODIPY 493/503. Stained MEFs were imaged and the area of LDs was quantified. (E and F) p18−/− rev and p18−/− MEFs were treated as indicated for 16 hr and analyzed either by immunoblotting_(E)_ or by quantifying LD area after fixation and staining with BODIPY 493/503 (F). (G and H) Control and Nprl2 KO MEFs were treated as indicated for 16 hr and analyzed by immunoblotting_(G)_ or by quantifying LD area after fixation and staining with BODIPY 493/503 (H). All graphical data are quantified as mean ± SEM. An asterisk indicates a significant difference (p < 0.05,t test) based on n = 50 cells from three independent biological replicates.
See also Figure S2, Figure S3, and Figure S4.
In agreement with the inhibition of mTORC1 activity during starvation, incubation in HBSS or in media lacking amino acids resulted in the rapid loss of phosphorylated S6 kinase (p-S6K) (Figure 2Band Figure S2A), a substrate of mTORC1 and a useful reporter of mTORC1 activity, and also a decrease in the phosphorylation of the autophagy initiator kinase ULK1 (p-ULK1 S757) (Figure S2A). Inhibition of mTOR with the catalytic inhibitor torin1 was sufficient to increase LD abundance in CM and no further increase was observed during starvation in HBSS (Figure 2C and Figure S3C,D), a condition in which mTORC1 is already fully inhibited (Figure 2B and Figure S2A). Torin1 promotion of LD biogenesis was blocked by BafA1 (Figure S3C,D), indicating a dependence on autophagy. mTORC1 activity and autophagy initiation can be impacted by the AMPK signaling pathway (Alers et al., 2012; Kim et al., 2011). Phosphorylated AMPK (p-AMPK) was absent following 1 hr HBSS starvation and only became apparent after 4 hr HBSS starvation (Figure 2B), suggesting that AMPK is not functioning upstream of mTORC1 under these conditions. Incubation with the AMPK activator AICAR was insufficient to induce LD biogenesis in complete media, but it had a stimulatory effect during HBSS starvation (Figure 2B,D). The AMPK inhibitor compound C (comp. C) had the opposite effect, and decreased LDs during HBSS starvation (Figure 2B,D). Thus, inhibition of mTOR is sufficient to induce autophagy-dependent LD biogenesis in the absence of starvation and the extent of LD biogenesis during starvation is modulated by AMPK signaling.
Torin1 inhibits mTOR present in both mTORC1 and mTORC2. To selectively impair mTORC1 activity, we exploited MEFs lacking p18, a subunit of the Ragulator complex that is essential for mTORC1 lysosomal recruitment and activation (Nada et al., 2009; Sancak et al., 2010) (Figure 2A). p18 revertant (p18rev) MEFs rescued with strep-tagged p18 (Nada et al., 2009;Sancak et al., 2010) were employed as controls. As in the torin1-treated cells, the p18−/− MEFs exhibited a complete lack of p-S6K, indicating inhibition of mTORC1 (Figure 2E). Moreover, the p18−/− MEFs displayed high levels of LDs relative to the control p18rev MEFs cells and no further increase was observed during HBSS starvation (Figure 2F). To determine if mTORC1 inhibition is necessary for LD biogenesis during starvation, we generated MEFs lacking Nprl2 (Figure S4A), a subunit of the Gator1 complex that inactivates the Rag GTPases under low amino acid conditions (Bar-Peled et al., 2013) (Figure 2A). MEFs lacking Nprl2 exhibited decreased starvation-induced inhibition of mTORC1 as evidenced by the persistence of the p-S6K signal during HBSS incubation (Figure 2G), consistent with the uncoupling of mTORC1 from the nutrient status of these cells. Strikingly, the Nprl2 null cell lines were completely unresponsive to HBSS-induced LD biogenesis (Figure 2H). Cancer cell lines HCC1500 and SW780, which lack Nprl2 and exhibit decreased mTOR nutrient responsiveness (Bar-Peled et al., 2013) (Figure S4B), also showed reduced LD biogenesis during HBSS starvation (Figure S4C,D). Together, these data demonstrate that inhibition of mTORC1 is necessary and sufficient for autophagy-dependent LD biogenesis.
LD biogenesis during starvation selectively requires DGAT1
DGAT1 and DGAT2 mediate the final committed step in TAG synthesis, esterifying diacylglycerol (DAG) to yield TAG, which is then packaged into LDs (Harris et al., 2011; Walther and Farese, 2012). Simultaneous inhibition of DGAT1 and DGAT2 abrogates LD biogenesis in adipocytes (Harris et al., 2011) and MEFs (To et al., 2017). To examine the contribution of these two enzymes to LD biogenesis under distinct metabolic states, we treated MEFs with DGAT inhibitors and induced LD biogenesis either with nutrient excess (i.e. oleate supplementation) (Figure 3A) or nutrient deprivation (i.e. HBSS) (Figure 3B). In the presence of oleate, LD biogenesis was only partially blocked by treatment with DGAT1 inhibitor T863 (DGAT1i) or DGAT2 inhibitor PF-06424439 (DGAT2i) alone, but it was completely blocked by incubation with both DGAT inhibitors together (Figure 3A). In contrast, during HBSS starvation, DGAT1i largely blocked LD biogenesis, while DGAT2i had no effect (Figure 3B). Depletion of the DGAT enzymes using siRNAs also indicated that DGAT1 is preferentially required for starvation-induced LD biogenesis (Figure S5A–C). Measurements of transcript levels of DGAT1 and DGAT2 revealed that the levels of both transcripts increased during HBSS starvation (Figure S5D), indicating that cells upregulate TAG synthesis machinery under these conditions. This result also indicates that the mechanism enabling channeling of FAs selectively into DGAT1-dependent LDs is likely not due to differences in DGAT1 and DGAT2 expression levels, and the mechanism for this selective channeling from the autolysosome remains unclear. LDs are required for autophagy under certain conditions in yeast (Li et al., 2015;Shpilka et al., 2015; Velazquez et al., 2016) and mammalian cells (Dupont et al., 2014), raising the possibility that DGAT1 inhibition could impact LD biogenesis by disrupting autophagy. However, incubation with DGAT1i had no effect on autophagic flux (Figure 3C) or the kinetics LC3 and p62 degradation (Figure 3D) during starvation in HBSS, indicating that the autophagy pathway is intact. Together, these results demonstrate that DGAT1 channels FAs downstream of autophagy into LDs during starvation.
Figure 3. DGAT1 channels autophagy released lipids into new lipid droplets that are degraded during nutrient deprivation.

(A and B) LD biogenesis was induced in MEFs by incubation with 200 μM oleate in CM (A) or by starvation in HBSS for 16 hr (B). MEFs were treated with DGAT1 and/or DGAT2 inhibitors (DGAT1i and DGAT2i) as indicated. Cells were fixed, BODIPY 493/503-stained LDs imaged by fluorescence microscopy, and the abundance of LDs quantified.(C) MEFs stably expressing a GFP-LC3-RFP-LC3ΔG autophagy flux reporter were incubated in CM or HBSS and treated with DGAT1 and/or DGAT2 inhibitors as indicated. Following a 16 hr incubation, the GFP:RFP ratio was measured by flow cytometry and the fold change in the GFP:RFP ratio quantified (n=3; mean ± SEM). (D) Immunoblot analysis of MEFs starved in HBSS and treated with vehicle, DGAT1i, and/or BafA1.(E) Illustration of the chase paradigm to visualize the stability of pre-existing, dispersed LDs. DGAT1i is added together with HBSS and the amount of BODIPY493/503-stained LDs present in live cells imaged and quantified over 16 hr. (F) Illustration of the pulse-chase paradigm to visualize the stability of starvation-induced, clustered LDs. Following a 6 hr HBSS (pulse) to induce autophagy-dependent LD biogenesis, DGAT1i is added and the amount of BODIPY493/503-stained LDs present in live cells imaged and quantified over 16 hr. (G) Time-lapse montage of dispersed and clustered LD degradation in live cells treated according to the paradigms in panels E and _F. (H)_Quantification of the turnover kinetics of dispersed and clustered LDs treated and imaged as in panel G. All graphical data are quantified as mean ± SEM. For the quantified microscopy images, an asterisk indicates a significant difference (p < 0.05, t test) based on n = 50 cells from three independent biological replicates.
See also Figure S5.
Whether the new pool of starvation-induced LDs is degraded is unknown. Inhibition of DGAT1 provides a useful method to prevent additional LD biogenesis, allowing measurement of the stability and degradation of any existing LDs. Upon shifting MEFs from CM into HBSS starvation media containing DGAT1i (Figure 3E), the pre-existing pool of dispersed LDs was stable for the first 300 min and then was degraded at a steady rate for the remaining period of the experiment (Figure 3G,H). To examine the degradation kinetics of the new pool of autophagy-dependent LDs, we employed a starvation “pulse chase” paradigm (Figure 3F). In this paradigm, MEFs were briefly starved with HBSS to induce the formation of autophagy-dependent LDs, then DGAT1i was added and the stability of the LDs measured. The autophagy-dependent, clustered LDs were immediately degraded with similar rates as the dispersed LDs (Figure 3G,H). The lack of a lag period was likely because the cells had already initiated a starvation response at the beginning of these measurements. Degradation of pre-existing and starvation-induced LDs was blocked by ATGListatin (Figure S5E,F), an inhibitor of the LD-associated TAG lipase ATGL (Mayer et al., 2013). These results demonstrate that both the pre-existing dispersed LDs and the newly formed autophagy-dependent LDs are lipolytically degraded during nutrient deprivation.
DGAT1 impacts fatty acid storage and channeling to mitochondria during starvation
LDs have been reported to form membrane contact sites with mitochondria (Herms et al., 2015; Rambold et al., 2015; Wang et al., 2011) and we observe LDs in close proximity to mitochondria during HBSS starvation (Figure 1A, Figure S1A–C and Movies S1–S2). One possibility is that LDs could function as a requisite intermediate for the transfer of FAs released by autophagy to mitochondria for breakdown by β-oxidation. If this model is correct, blocking DGAT1-dependent LD biogenesis would reduce FA delivery to mitochondria and their subsequent conversion into acylcarnitines by mitochondrial carnitine palmitoyltransferase 1 (CPT1), resulting in a decrease in acylcarnitine levels and potentially in an increase in FA flux into non-energy accessible lipid pools (e.g. increase in phospholipids). To test this model, we employed single reaction monitoring (SRM)-based LC-MS steady state lipidomic profiling to analyze the levels of 113 lipids from multiple lipid classes (Figure 4, Figure S6A–E, Tables S1 and S2). In MEFs incubated in CM, very few lipids were affected by DGAT1 inhibition and TAG levels were unchanged (Figure S6A–E and Table S1), indicating that DGAT1 is not required for maintenance of TAG pools in CM. In contrast, DGAT1 inhibition during starvation in HBSS resulted in a number of significant changes in the cellular lipid profile (Figure 4 and Table S2). The levels of nearly all TAG species measured were significantly decreased (Figure 4A,B), which correlates well with the importance of DGAT1 in the generation of LDs during HBSS starvation (Figure 3B and Figure S5C). There was also a large decrease in cholesterol esters and a small increase in cholesterol (Figure 4A,C), suggesting that impairments in the biogenesis of TAG-rich LDs may impact cholesterol ester synthesis and storage. There were additional small changes in other lipid classes (Figure 4A,E–I), including an increase in C16:0 ceramide (1.6-fold) (Figure 4A,G), which may reflect cellular stress. Interestingly, there were significant increases in both C16:0 acylcarnitine (3.6-fold) and C18:0 acylcarnitine (2.5-fold) (Figure 4A,D), suggesting that FA delivery to mitochondria is not impaired and may increase in the absence of DGAT1 activity.
Figure 4. DGAT1 impacts fatty acid channeling and sequestration in TAG during nutrient deprivation.

(A–I) MEFs were starved in HBSS in the presence of vehicle or DGAT1i for 16 hr. (A) Heatmap of metabolomic alterations organized by lipid class. Significantly altered lipids are indicated in blue text (significantly decreased) and red text (significantly increased).(B–I) Quantification showing the relative levels of significantly altered lipids (p < 0.01, t test) (n = 4–5).
See also Figure S6.
To more specifically track FA flux, we employed isotopic palmitate tracing (Figure 5 and Table S3). In these experiments, isotopically-labeled palmitate (d4-free FA [FFA]) was added at the beginning of the starvation together with vehicle or DGAT1i, and the incorporation of d4-FFA into lipids tracked by mass spectrometry. We observed incorporation of d4-FFA into 20 lipids, and incorporation into 7 lipids was statistically altered by DGAT1 inhibition (Figure 5A–H). As expected, DGAT1 inhibition reduced d4-FFA incorporation into TAG species containing C16:0, including C16:0/C16:0/C16:0 TAG and C16:0/C18:1/C16:0 TAG (Figure 5A–C). In addition, consistent with our steady state lipidomics data (Figure 4), we observed increased incorporation of d4-FFA into C16:0 acylcarnitine (2.3-fold) in DGAT1i-treated cells (Figure 5A,D). These data indicate that the absence of DGAT1 activity disrupts FA channeling into TAG and instead results in FA incorporation into other lipid species, including acylcarnitines. In addition, during an incubation in HBSS with DGAT1i, co-treatment with ATGListatin stabilized TAGs as expected (Figure S6F–J), but it did not block the increase in acylcarnitines (Figure S6K,L). Together, these results argue against the model that TAG-containing LDs are a requisite intermediate for FA delivery to mitochondria.
Figure 5. Analysis of fatty acid channeling during nutrient deprivation using isotopic palmitate tracing.
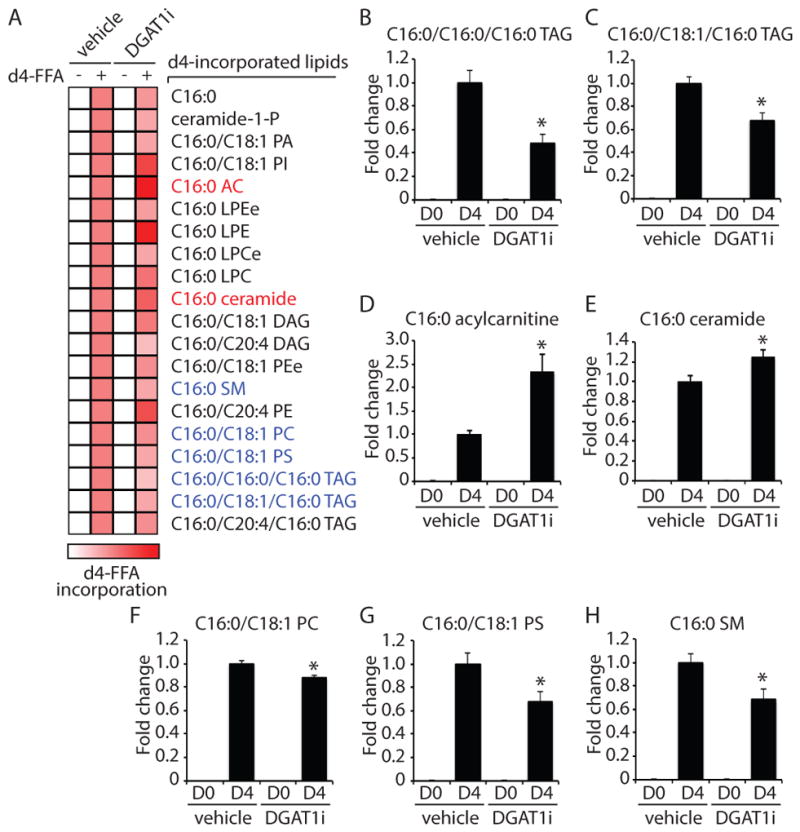
(A–H) MEFs were starved for 16 hr in HBSS in the presence of either d0-C16:0 or d4-C16:0 FFA complexed with 0.5% BSA. Cells were also treated with vehicle or DGAT1i as indicated. (A) Heatmap showing the relative levels of lipids with significant incorporation of d4-C16:0 FFA. A red color indicates increased d4-C16:0 incorporation (scale bar). Lipids that exhibited significantly altered d4-C16:0 incorporation in response to treatment with DGAT1i are indicated in blue text (significantly decreased) and red text (significantly increased). (BH) Quantification showing the relative levels of lipids significantly altered by treatment with DGAT1i (p < 0.01, t test) (n =5).
DGAT1-dependent LD biogenesis prevents acylcarnitine-induced mitochondrial dysfunction during starvation
To determine if DGAT1-dependent LDs are important for cellular health under starvation conditions, we analyzed cell viability. Our results indicated that the inhibition of DGAT1, but not DGAT2, significantly increased the percentage of apoptotic cells during HBSS starvation (Figure 6A). LDs can play cytoprotective roles by sequestering FA and reducing the accumulation of various cytotoxic lipid species. This lipid sequestration function may prevent alterations in ER lipid homeostasis that cause ER stress or prevent the generation of reactive oxygen species (ROS) damaged lipids (e.g. lipid peroxides). However, no changes were observed in cellular levels of ROS (Figure S7A,B) or lipid peroxides (Figure S7C) following DGAT1 inhibition during incubations in CM or HBSS. In addition, DGAT1 inhibition in CM or HBSS did not increase ER unfolded protein response (UPR) pathways (Figure S7D–K), such as IRE1-mediated XBP1 splicing (Figure S7D,E) or the expression of canonical UPR targets (BiP/GRP78, GRP94, SEL1L, ERDJ4) (Figure S7H–K). HBSS starvation alone was sufficient to increase ATF4 expression, which is downstream of eIF2α (Figure S7F,G). However, ATF4 induction was unaffected by DGAT1 inhibition (Figure S7F,G) or PERK inhibition with GSK2606414 (Figure S7G). The starvation-induced ATF4 expression likely reflects signaling through the well-characterized nutrient responsive GCN2-eIF2α-ATF4 pathway (Harding et al., 2000, 2003), not increased ER stress. Finally, employing the retention using selective hooks (RUSH) system (Boncompain et al., 2012), we found that DGAT1 inhibition did not affect the trafficking of SBP-EGFP-tagged E-cadherin from the ER to the Golgi (Figure S7L), indicating that secretory pathway function is not generally impaired. These data demonstrate that although DGAT1 inhibition during starvation reduces cell viability, it does not cause large increases in ROS or ER stress.
Figure 6. DGAT1-dependent LD biogenesis protects mitochondrial function during starvation.

(A) MEFs were treated as indicated during a 16 hr HBSS starve. Cells were stained with propidium iodide and annexin-V, and the percentage of cell death measured by flow cytometry. (B and C) Oxygen consumption rates (OCR) were measured for MEFs incubated in CM_(B)_ or HBSS (C) together with vehicle or DGAT1i for 16 hr. Oligomycin, FCCP, and rotenone/antimycin were added at the indicated time points. (D and E) Flow cytometry histograms_(D)_ and the corresponding quantification of mean fluorescent intensity (n=3) (E) of MEFs stained with MitoTracker Orange CMTMRos following incubation in CM or HBSS together with vehicle or DGAT1i for 16 hr. (F and G) Flow cytometry histograms (F) and the corresponding quantification of mean fluorescent intensity (n=3) (G) of MEFs stained with MitoTracker Green FM following incubation in CM or HBSS together with vehicle or DGAT1i for 16 hr. (H–J) Flow cytometry histograms_(H and I)_ and the corresponding quantification of mean fluorescent intensity (n=3) (J) of MEFs stained with MitoTracker Orange CMTMRos following treatment with vehicle or DGAT1i during an HBSS starvation for the indicated times. (K) MEFs were incubated in CM or HBSS for 16 hr in the presence or absence of DGAT1i. Mitochondria stained with MitoTracker Orange CMTMRos (red) were visualized by fluorescence microscopy. In the micrographs, white boxes indicate the magnified regions. Scale bars = 10 μm. (L–N) Flow cytometry histograms (L and M) and the corresponding quantification of mean fluorescent intensity (n=3) (N)of MEFs stained with MitoTracker Orange CMTMRos following treatment with vehicle, DGAT1i, and etomoxir as indicated during an HBSS starvation for 16 hr. Etomoxir was added for the final 4 hr or 8 hr of the experiment where indicated.(O) Mitochondria isolated from MEFs were stained with JC-9 and then incubated with increase concentrations of palmitoylcarnitine for 30 min. JC-9 fluorescence and mitochondrial diameter were measured by flow cytometry and the normalized mitochondrial membrane potential determined. The background value of depolarized mitochondria (depol.) was determined by incubation with valinomycin. All graphical data are quantified as mean ± SEM (n=3). An asterisk indicates a significant difference (p < 0.05,t test).
See also Figure S6 and Figure S7.
The observed increase in acylcarnitines (Figure 4 and 5) in response to DGAT1 inhibition during starvation could reflect mitochondrial dysfunction. To test whether LD biogenesis impacts mitochondrial function, we measured mitochondrial oxygen consumption and found that DGAT1 inhibition resulted in a significant decrease in the rates of basal mitochondrial oxygen consumption in HBSS starved MEFs, but not MEFs incubated in CM (Figure 6B,C). Basal mitochondrial oxygen consumption generally decreased during the HBSS starvation relative to CM (Figure 6B,C), but the reduction was more dramatic for DGAT1i-treated MEFs (0.46-fold) compared to the vehicle-treated MEFs (0.80-fold). Furthermore, inhibition of DGAT1 for 16 hr reduced mitochondrial membrane potential in HBSS starved MEFs, but not MEFs incubated in CM (Figure 6D,E). These reductions in mitochondrial oxygen consumption and membrane potential were not due to a general decrease in the number of mitochondria because the signal from mitotracker green FM, which is unaffected by mitochondrial membrane potential, was unaltered by DGAT1 inhibition (Figure 6F,G). Analysis of mitochondrial membrane potential over time revealed that, during the HBSS starvation, the mitochondrial membrane potential was maintained for 8 hr and the DGAT1i-induced uncoupling of the mitochondrial membrane potential became evident at the 12 hr and 16 hr time points (Figure 6H–J). Although DGAT1 inhibition impacted mitochondrial membrane potential, it did not alter the ability of mitochondria to adopt an elongated morphology during starvation (Figure 6K), a morphology that has been proposed to reduce mitochondrial clearance by autophagy (Gomes et al., 2011; Rambold et al., 2011).
Acylcarnitines exhibited the largest increase in response to DGAT1 inhibition (Figure 4 and 5) and acylcarnitines have been previously suggested to be lipotoxic (McCoin et al., 2015;Son et al., 2010; Wajner and Amaral, 2015). To explore the possibility that the increase in acylcarnitine levels impacts mitochondrial function we employed the CPT1 inhibitor etomoxir to reduce acylcarnitine levels (Figure S6K,L). Addition of etomoxir alone had no effect on mitochondrial membrane potential during HBSS (Figure 6L,N). However, in cells incubated with DGAT1 inhibitor, co-treatment with etomoxir was sufficient to rescue mitochondrial membrane potential (Figure 6M,N). Furthermore, addition of palmitoylcarnitine (i.e. C16:0 acylcarnitine) to mitochondria isolated from MEFs was sufficient to depolarize mitochondria (Figure 6O). Thus, our results indicate that DGAT1-dependent LDs are required to prevent the accumulation of acylcarnitines, which cause mitochondrial dysfunction during periods of prolonged nutrient deprivation.
Discussion
In this study, we examined the biogenesis and function of LDs during nutrient deprivation. Our data support a model (Figure 7) in which mTORC1-regulated autophagy degrades membranous organelles, releasing FAs that are selectively channeled by DGAT1 into new LDs. The biogenesis of LDs under these conditions is necessary to sequester FAs in TAG-rich LDs, preventing acylcarnitine accumulation and subsequent mitochondrial dysfunction. These data identify a distinct aspect of the cellular response to starvation and reveal a role for LDs as a lipid buffering system that protects against lipotoxicity during autophagy. These findings underscore the high degree of crosstalk between autophagy, the ER, LDs, and mitochondria that is essential to maintain lipid and energy homeostasis during nutrient deprivation.
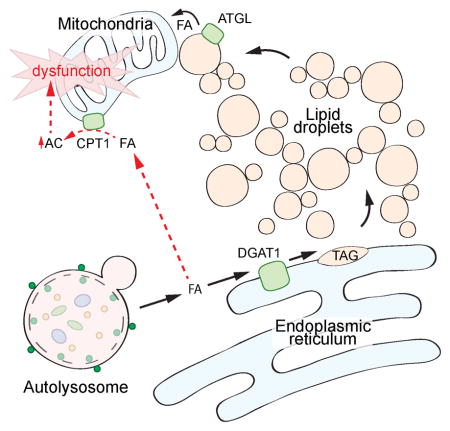
Figure 7. DGAT1-dependent lipid droplet biogenesis prevents lipotoxicity during starvation-induced autophagy.

In the presence of sufficient amino acids, mTORC1 is recruited to the lysosome and activated through the actions of the Rag GTPases, the Ragulator complex, and the V-ATPase. Active mTORC1 inhibits the initiation of autophagy. In the absence of amino acids, mTORC1 is inactive and autophagy is upregulated. This pathway can be modulated by the Gator1 complex and AMPK signaling. Autophagic degradation of membranous organelles releases FAs that are selectively channeled into DGAT1-dependent LDs, which form clusters of LDs in close proximity to mitochondria. These new LDs are degraded by ATGL-mediated lipolysis, presumably supplying FAs to mitochondria for energy. These LDs also sequester FA in TAG, preventing acylcarnitine accumulation, which leads to mitochondrial dysfunction.
In agreement with the importance of autophagy in the formation of LDs (Rambold et al., 2015), uncoupling the canonical mTORC1 signaling pathway from nutrient status by disrupting the Gator1 complex strongly blocked LD biogenesis during starvation. Interestingly, mTORC1 inhibition was sufficient to induce autophagy-dependent LD biogenesis in CM. This finding indicates that autophagy-dependent LD biogenesis is not limited to nutrient deprivation conditions and suggests that LD biogenesis is a general protective response to high levels of autophagy, which may be relevant to particular cancers, during development and aging, or following rapamycin treatment (Ravikumar et al., 2010). LDs may play a similar role to prevent lipotoxicity during the selective autophagic degradation of the ER (i.e. ERphagy) or mitochondria (i.e. mitophagy), which would be predicted to release FAs. It is worth noting that mTORC1 integrates a wide variety of nutrient, chemokine, and stress signals, and the alteration of mTORC1 activity could explain reported LD increases during diverse stress conditions, including proteasome inhibition (Xu et al., 2005, 2006) and ER stress (Gubern et al., 2009; Lee et al., 2012). Indeed, the sestrin proteins inhibit mTORC1 in response to tunicamycin-induced ER stress through their association with the Gator2 complex (Parmigiani et al., 2014), providing a mechanism connecting cellular stress with mTORC1 inhibition, autophagy, and possibly LDs.
The biogenesis of starvation-induced LDs specifically required DGAT1, but not DGAT2. Differences in the structure and distribution of DGAT1 and DGAT2 suggest that the two enzymes serve unique functions (Wilfling et al., 2013; Yen et al., 2008). In contrast to the ER-resident polytopic DGAT1, DGAT2 adopts a hairpin structure and is able to traffic to the surface of LDs, where it facilitates local TAG synthesis and LD expansion (Wilfling et al., 2013). DGAT1 mediates the formation of small LDs, and it was suggested that these LDs may function to protect the ER from accumulating lipotoxic intermediates (Wilfling et al., 2013). Our data are in agreement with a protective role for LDs, and emerging findings indicate a role for DGAT1-dependent LDs in mitigating lipotoxicity under multiple conditions, including high fat diet conditions (Koliwad et al., 2010), models of lipotoxic cardiomyopathy (Liu et al., 2009, 2012, 2014), incubation with exogenous saturated fatty acids (Koliwad et al., 2010; Listenberger et al., 2003), and during periods of high autophagic flux (this manuscript). In each of these examples, DGAT1 is likely playing a conceptually similar role, sequestering FAs as TAG in LDs and preventing the accumulation of a cytotoxic lipid species. However, the cytotoxic lipid species and the resulting downstream cellular dysfunctions may differ. For example, the addition of exogenous palmitate to CHO cells caused apoptosis associated with ceramide generation and ER stress induction (Listenberger et al., 2003). The addition of exogenous saturated FAs to macrophages resulted in altered ER phospholipid composition, upregulation of the IRE1 ER stress pathway, and activation of the NLRP3 inflammasome and secretion of pro-inflammatory cytokines (Robblee et al., 2016). In mouse models of lipotoxic cardiomyopathy, DGAT1 protected against lipotoxicity associated with the accumulation of DAG and ceramide in cardiomyocytes (Liu et al., 2009, 2012, 2014). In contrast to these examples, DGAT1 inhibition in MEFs during starvation-induced autophagy was not associated with large changes in DAG or ceramide and also was not associated with increases in ROS or ER stress. Instead, autophagy-associated lipotoxicity was linked to acylcarnitine accumulation and mitochondrial dysfunction. Whether the lipotoxic disruption of mitochondrial function occurs in other models of lipotoxicity (e.g. exogenous saturated fatty acid addition or high fat diet) remains to be determined. However, it is interesting to note that mitochondrial breakdown of FAs and LD sequestration of FAs may serve complementary roles in preventing lipotoxicity by reducing the levels of FFA. Thus, DGAT1-dependent LDs broadly mitigate lipotoxicity, but the cytotoxic lipid species and the downstream cellular dysfunction likely differ depending on the initiating cellular insult and cell type.
DGAT1 inhibition during starvation resulted in an increase in acylcarnitines, a small increase in ceramide, and no increase in other potentially cytotoxic lipids such as DAGs and FFA. Reducing acylcarnitine levels with the CPT1 inhibitor etomoxir largely rescued mitochondrial membrane potential, implicating acylcarnitines as the cytotoxic culprit under these conditions. In addition, acylcarnitine disrupted the membrane potential of purified mitochondria in vitro, indicating that acylcarnitines are able to directly uncouple mitochondria. Our finding are consistent with previous suggestions that high concentrations of acylcarnitines may be cytotoxic and may disrupt mitochondrial function (McCoin et al., 2015; Son et al., 2010; Wajner and Amaral, 2015). This could be particularly relevant in the heart, which derives a large portion of its energy from fatty acid oxidation. Indeed, it is noteworthy that acylcarnitine accumulation is associated with fatty acid oxidation diseases and ischemia (McCoin et al., 2015; Son et al., 2010; Wajner and Amaral, 2015). In addition, improvements in cardiac function in a mouse model of cardiomyopathy were associated with reduced acylcarnitine levels, but not reductions in DAG, TAG, or ceramide levels, leading to the proposal that the accumulation of acylcarnitines may be lipotoxic in the heart (Son et al., 2010). Interestingly, N-acyl amino acids were also recently shown to act as direct mitochondrial uncouplers (Long et al., 2016), raising the possibility that this may be a common property of fatty acid derivatives. Acylcarnitines are capable of disrupting membrane integrity in vitro (Requero et al., 1995a,1995b), but whether mitochondrial uncoupling by acylcarnitine in cells is due to direct disruption mitochondrial membrane integrity or involves association with mitochondrial proteins is unclear at this time. Due to their interrelationship, mitochondrial dysfunction and the accumulation of acylcarnitines could result in a positive feedback loop that further increases toxicity.
We observed that the autophagy-dependent pool of LDs was lipolytically degraded by the LD-associated lipase ATGL during nutrient deprivation; and together, our data lead us to propose that LDs mediate two distinct functions during starvation – to protect against lipotoxicity and then to serve as a lipolytically regulated source of FAs. The autophagy-dependent LDs clustered in close proximity to mitochondria and LD-mitochondrial contacts have been proposed to function as sites for FA transfer (Herms et al., 2015; Rambold et al., 2015). This model is attractive because the membrane contact sites could enable channeling of FAs efficiently into the β-oxidation pathway, reducing the danger of lipotoxicity due to cytoplasmic passage of FFAs. The ER makes extensive contacts with organelles throughout the cell (Prinz, 2014; Toulmay and Prinz, 2011), facilitating organelle-to-organelle lipid exchange and acting as an organizing scaffold for organelle events, such as mitochondria (Friedman et al., 2011) and endosomes (Rowland et al., 2014) fission. LDs are ER-derived organelles that form extensive contacts with the ER (Salo et al., 2016; Wang et al., 2016; Wilfling et al., 2013) and the ER is also known to contact mitochondria (Vance, 2014). It is possible that ER serves as an organizer of LD-mitochondrial contacts and thereby coordinates a protected pathway for FA channeling to mitochondria from autolysosomes. However, the identity of a LD-mitochondrial tethering complex, the role of the ER in organizing LD-mitochondrial interactions, and the functional importance of these organelle contact sites in FA transfer and energy homeostasis remain to be determined.
Emerging findings indicate multiple modes of crosstalk between LDs and autophagy. For example, in liver cells a selective autophagic pathway termed lipophagy degrades LDs and inhibition of autophagy in liver cells results in LD accumulation (Martinez-Lopez and Singh, 2015;Singh et al., 2009). Lipophagy does not appear to play a role during nutrient deprivation in our cell types, since LDs decrease following inhibition of autophagy. In addition, we found that LD degradation in MEFs during starvation was inhibited by ATGListatin, and it was previously shown that LD degradation upon starvation was prevented by siRNA-depletion of the LD-associated lipase ATGL (Rambold et al., 2015), consistent with the dominance of the LD lipolytic pathway. LDs have also been suggested to be required for autophagy, either by supplying lipids for autophagosome biogenesis or by sequestering lipids that disrupt ER homeostasis and impair autophagosome biogenesis (Dupont et al., 2014; Li et al., 2015; Shpilka et al., 2015; Velazquez et al., 2016). However, under our conditions, autophagic flux and degradation of autophagy substrates (e.g. LC3 and p62) was unaffected by the loss of DGAT1-dependent LDs. Thus, it is likely that nature of the LD-autophagy relationship is cell type and context specific.
Together, our findings demonstrate that DGAT1-dependent LD biogenesis protects against lipotoxic mitochondrial damage and that LDs are integrally involved in the coordinated, adaptive response to nutrient deprivation. These finding raise the possibility that LDs are more widely involved as protective lipid buffering systems in cellular stress responses, especially those involving altered mTORC1 signaling and upregulation of autophagy. Future research examining the mechanism of mitochondrial dysfunction under these conditions will be important to achieve a comprehensive understanding of the organelle crosstalk underlying cellular lipid and energy homeostasis.
STAR★Methods
CONTACT FOR REAGENT AND RESOURCE SHARING
Further information and requests for resources and reagents should be directed to and will be fulfilled by the Lead Contact, James Olzmann (olzmann@berkeley.edu). Requests will be handled according to the University of California, Berkeley policies regarding MTA and related matters.
EXPERIMENTAL MODEL AND SUBJECT DETAILS
Cell Culture
MEFs, U2OS, HeLa, HEK293T/17, and Huh7 cells were cultured in DMEM containing 4.5 g/L glucose and L-glutamine (Corning) supplemented with 10% fetal bovine serum (FBS; Thermo Fisher Scientific and Gemini Bio Products) at 37°C and 5% CO2. Nprl2 knockout MEFs were generated by infection with LentiCRISPR-V2 constructs (Sanjana et al., 2014) expressing gRNAs targeting EXON2 or EXON3 of Nprl2 (see Key Resources Table for sequences). HCC1500 cells (ATCC) were cultured in RPMI-1640 (ATCC) supplemented with 10% FBS at 37°C and 5% CO2. SW780 (ATCC) cells were cultured in Leibovitz’s L-15 (ATCC) supplemented with 10% FBS at 37°C in the absence of CO2. Unless specified, starvation conditions consisted of growth in Hank’s Balancing Salt Solution (HBSS) (Invitrogen) for 16 hr. For deprivation of amino acids, cells were cultured in DMEM (D9800-13, US Biological) supplemented with 4.5g/L glucose, and 10% FBS. For low glucose, high glucose, and glutamine starvation, DMEM (A1443001, Life Technologies) was supplemented with 10% FBS, 4 mM glutamine (Thermo Fisher Scientific), and 1 g/L glucose (low glucose conditions) or 4.5 g/L (high glucose) accordingly.
KEY RESOURCES TABLE.
| REAGENT or RESOURCE | SOURCE | IDENTIFIER |
|---|---|---|
| Antibodies | ||
| Rabbit monoclonal anti-Phospho-p70 S6 Kinase (Thr389) | Cell Signaling Technology | Cat. # 9234, 108D2 |
| Rabbit polyclonal anti-p70 S6 Kinase | Cell Signaling Technology | Cat. #9202 |
| Rabbit polyclonal anti-AMPKα | Cell Signaling Technology | Cat. # 2532 |
| Mouse monoclonal anti-Glyceraldehyde-3-Phosphate Dehydrogenase | Thermo Fisher Scientific | Cat. # MAB374MI, 6C5 |
| Rabbit polyclonal anti-LC3B antibody | Sigma-Aldrich | L7543 |
| Rabbit polyclonal anti-p62 antibody | Enzo Life Sciences | BML-PW9860 |
| Rabbit monoclonal anti-Phospho-ULK1 (Ser757) | Cell Signaling Technology | Cat. # 14202, D7O6U |
| Rabbit monoclonal anti-ULK1 | Cell Signaling Technology | Cat. # 8054, D8H5 |
| Rabbit polyclonal anti-ATF4 | Proteintech Group, Inc. | Cat. # 10835-1-AP |
| Bacterial and Virus Strains | ||
| N/A | N/A | N/A |
| Biological Samples | ||
| N/A | N/A | N/A |
| Chemicals, Peptides, and Recombinant Proteins | ||
| Bafilomycin A1 (250 nM) | Sigma-Aldrich | Cat. # B1793 |
| TCV-3166 (1 μM) | 3-V Biosciences | Obtained from 3-V Biosciences through MTA |
| AICAR (250 μM) | Cell Signaling Technology | Cat. #9944 |
| Compound C (10 μM) | Tocris | Cat. # 3093 |
| Torin1 (250 nM) | Tocris | Cat. # 4247 |
| T863 (20 μM) | Sigma-Aldrich | Cat. # SML0539 |
| PF-06424439 (10 μM) | Sigma-Aldrich | Cat. # PZ0233 |
| GSK2606414 (1 μM) | EMD Millipore Corporation | Cat. # 516535 |
| Oleate (200 μM) | Sigma-Aldrich | Cat. # O1383 |
| Tunicamycin (5 μg/mL) | Cayman Chemical Co. | Cat. # 11445 |
| Etomoxir (100 μM) | Cayman Chemical Co. | Cat. # 11969 |
| ATGListatin (20 μM) | EMD Millipore Corporation | Cat. # 5.30151.0001 |
| BODIPY 493/503 (4,4-Difluoro-1,3,5,7,8-Pentamethyl-4-Bora-3a,4a-Diaza-s-Indacene) | Life Technologies Co. | Cat. # D3922 |
| BODIPY 558/568 C12 (4,4-Difluoro-5-(2-Thienyl)-4-Bora-3a,4a-Diaza-s-Indacene-3-Dodecanoic Acid) | Life Technologies Co. | Cat. # D3835 |
| MitoTracker Orange CMTMRos | Life Technologies Co. | Cat. # M7510 |
| MitoTracker Green FM | Life Technologies Co. | Cat. # M7514 |
| MitoTracker Deep Red FM | Life Technologies Co. | Cat. # M22426 |
| MitoSOX Red Mitochondrial Superoxide Indicator (5 μM) | Life Technologies Co. | Cat. # M36008 |
| CellROX Deep Red Reagent, for oxidative stress detection | Life Technologies Co. | Cat. # C10422 |
| BODIPY 581/591 C11 (Lipid Peroxidation Sensor) | Life Technologies Co. | Cat. # D3861 |
| JC-9 Dye (Mitochondrial Membrane Potential Probe) | Fisher Scientific | Cat. # D22421 |
| Valinomycin | Sigma Aldrich | Cat. # V0627 |
| Critical Commercial Assays | ||
| Seahorse XF24 FluxPak (includes necessary reagents – oligomycin, rotenone/antimycin, FCCP) | Agilent Technologies | Cat. # 100850-001 |
| FITC Annexin V Apoptosis Detection Kit I | BD Biosciences / BD Pharmingen | Cat. # 556547 |
| High Capacity cDNA Reverse Transcription Kits | Applied Biosystems | Cat. # 4368814 |
| SsoAdvanced Universal SYBR® Green Supermix | Bio-Rad Laboratories, Inc. | Cat. # 1725272 |
| Deposited Data | ||
| N/A | N/A | N/A |
| Experimental Models: Cell Lines | ||
| Mouse embryonic fibroblasts (MEFs) isolated from C57 mice | Kind gift from Dr. Joseph Napoli (University of California, Berkeley) | N/A |
| U2OS | Kind gift from Dr. Ron Kopito (Stanford University) | N/A |
| HeLa | ATCC | Cat. # CCL-2 |
| HEK 293T/17 | ATCC | Cat. # CRL-11268 |
| Huh7 | Kind gift from Dr. Holly Ramage (University of Pennsylvania) | N/A |
| Experimental Models: Organisms/Strains | ||
| N/A | N/A | N/A |
| Oligonucleotides | ||
| Nprl2 gRNA #1, Exon 2-1_CACCG_GAGCAGCTTTGTATCCAACG | This study, http://crispr.mit.edu | N/A |
| Nprl2 gRNA #1, Exon 2-2_AAAC_CGTTGGATACAAAGCTGCTCC | This study, http://crispr.mit.edu | N/A |
| Nprl2 gRNA #2, Exon 3-1_CACCG_ATGGCGAAACCCGTCAATGT | This study, http://crispr.mit.edu | N/A |
| Nprl2 gRNA #2, Exon 3, 2_AAAC_ACATTGACGGGTTTCGCCATC | This study, http://crispr.mit.edu | N/A |
| Primers for RTqPCR and RT-PCR, see Table S4 | This study | N/A |
| Recombinant DNA | ||
| pMRX-IP-GFP-LC3-RFP-LC3ΔG | Kaizuka et al., 2016 | Addgene plasmid # 84572 |
| Str-KDEL_SBP-EGFP-E-cadherin plasmid | Boncompain et al., 2012 | Kind gift from Dr. Boncompain (Institut Curie) |
| LentiCRISPR-V2 | Sanjana et al., 2014 | Addgene Plasmid #52961 |
| Software and Algorithms | ||
| ImageJ Software | Schneider et al., 2012 | https://imagej.nih.gov/ij/ |
| FlowJo Software | FlowJo, LLC | https://www.flowjo.com/ |
| GraphPad Prism | GraphPad Software, Inc. | https://www.graphpad.com/scientific-software/prism/ |
| Other | ||
| N/A | N/A | N/A |
METHOD DETAILS
Fluorescence microscopy
Cells grown on poly-L-lysine-coated coverslips were incubated in the presence or absence of 200 μM oleate for 16 hr. For the last 30 minutes of treatment, 100 nM of MitoTracker Orange CMTMRos was added to the cells. Cells were then washed with PBS, fixed for 15 min in PBS containing 4% (wt/vol) paraformaldehyde, and washed again with PBS. LDs (10 μg BODIPY 493/403; Thermo Fisher Scientific) and nuclei (100 mg DAPI; Thermo Fisher Scientific) were stained by incubating with staining buffer [PBS and 1% (wt/vol) bovine serum albumin] for 1 hr at room temperature. Cells were subsequently washed with staining buffer and mounted in Fluoromount G (Southern Biotech). Stained cells were analyzed by Deltavision Elite widefield epifluoresence deconvolution microscope with either a 40× air objective or a 60× oil immersion objective.
For live-cell imaging, 5 × 10⁴ cells were seeded on Nunc LabTek II chambered coverglass. MitoTracker Orange CMTMROS was added to cells for 30 min at 37°C, cells were washed with HBSS, and LDs were stained with 1ug BODIPY 493/503. Prior to imaging, chemical inhibitors were added to cells. Cells were incubated at 37C in a 5% CO2 humidified chamber and images were taken every 10 min for 18 hr using a Deltavision Elite widefield epifluoresence deconvolution microscope with a 60× oil immersion objective.
Immunoblotting
Cells were washed in PBS and lysed in 1% SDS. Protein amounts were normalized using bicinchoninic acid (BCA) Protein Assay (Thermo Fisher Scientific). Proteins were separated on 4–20% polyacrylamide gradient gels (Bio-Rad) and transferred onto low fluorescence PVDF or nitrocellulose membranes (Bio-Rad). Membranes were washed in PBS + 0.1% Tween-20 (PBST) and blocked in 5% (wt/vol) dried nonfat milk in PBST for 30 min to reduce non-specific antibody binding. Membranes were incubated for at least 2 hr in PBST containing 1% bovine serum albumin (BSA) (Sigma Aldrich) and primary antibodies. Following washing in PBST, membranes were incubated with fluorescent secondary antibodies were diluted in 1% BSA in PBST at room temperature for 1 hr. IRDye680 and IRDye800 conjugated secondary antibodies for immunoblotting were obtained from Li-COR Biosciences. All immunoblots were visualized on a LI-COR imager (LI-COR Biosciences).
Lipidomics
Lipidomics experiments were performed as described previously (Benjamin et al., 2015; Louie et al., 2013, 2016; To et al., 2017). MEFs seeded (5 × 10⁶ cells) in a 60 mm dish were incubated in CM or HBSS. Cells were treated with DGAT1 inhibitor for 16 hr and etomoxir for the last 4 or 8 hr of starvation, where indicated. For isotopic analysis of palmitate incorporation MEFs were starved in HBSS and incubated with d0-palimate acid or (7,7,8,8-d4)-palmitic acid (10μM in 0.1% BSA) together with vehicle or DGAT1 inhibitor for 16 hr. Cells were washed twice in PBS, collected by centrifuged at 500xg, and cell pellets frozen at −80°C until lipid extraction.
Lipids were extracted from cells in a 2:1:1 chloroform:methanol:phosphate-buffered saline solution with inclusion of internal standards (10 nmoles of dodecylglycerol and 10 nmoles of pentadecanoic acid). The organic layer was collected and aqueous layer was acidified with 0.1% formic acid and re-extracted in chloroform. The organic layer were combined and dried down under a stream of nitrogen. Dried extracts were resolubilized in chloroform and 10 μl was injected onto an Agilent 6400 triple quadrupole (QQQ)-liquid chromatography-mass spectrometry (LC-MS) instrument. Metabolites were quantified by integrating the area under the curve. This value was normalized to internal standards and the levels calculated based on external standard curves with representative lipids standards. In cases in which a there was a background peak for the isotopic d4-lipid in the d0-C16:0 treated group, we subtracted the average of the background form both d0- and d4-C16:FFA groups.
Viability Assay
MEF cells were seeded (2 × 10⁵ cells) and upon adherence, cells were incubated in CM or HBSS and treated with DGAT1 inhibitor for 16 hr. Floating cells in the media were collected and adherent cells were trypsinized. Cells were pelleted by centrifugation at 500× g for 5 min, washed in PBS, and stained with the Annexin V-FITC apoptosis Detection Kit I (BD Biosciences), which includes Annexin V-FITC and propidium iodide, according to manufacturer protocol. Fluorescence was analyzed using a BD Biosciences LSRFortessa and the percentage of cell death quantified using FlowJo Software.
Mitochondrial membrane potential and ROS
MEF cells (2 × 10⁵) were seeded and upon adherence, cells were incubated in CM or HBSS and treated with DGAT1 inhibitor or etoxomir for the time-points indicated. Cells were trypzinized and pelleted by centrifugation at 500xg for 5 min, washed with PBS. For mitochondria membrane potential, cells were stained with 100 nM MitoTracker Orange CMTMRos and MitoTracker Green FM (ThermoFisher Scientific) for 30 min. Data was acquired by the BD BIOsciences LSRForetessa using the PE-Tx-Red YG and FITC channel and quantified by FlowJo Software. A minimum of 10,000 cells were analyzed per condition.
To measure ROS production, cells were incubated with 5 μM MitoSOX Red (mitochondrial superoxide indicator), CellROX Deep Red Reagent (oxidative stress indicator), or BODIPY 581/591 C11 (lipid peroxidation sensor) (ThermoFisher Scientific) for 30min at 37°C. Cells were then analyzed by flow cytometry and data were collected from the PE-Tx-Red YG (MitoSOX, C11-BODIPY), APC (CellROX) and FITC (BODIPY 581/591 C11) channels.
Analysis of autophagic flux
pMRX-IP-GFP-LC3-RFP-LC3ΔG plasmid (Kaizuka et al., 2016) was obtained from Addgene (plasmid # 84572) and retrovirus produced in 293T/17 cells. Infected MEFs were selected with 3 μg/mL puromycin and expressing cells were isolated using the BD Bioscience Influx Sorter. Cells were starved, treated accordingly for 16 hr, and flow cytometry data was acquired using the BD Biosciences LSRFortessa FITC and PE-Tx-Red YG channels. The ratio of GFP to RFP for individual cells was quantified using FlowJo Software.
Mitochondrial Respiration Measurements
Mitochondrial activity was determined using the Seahorse Flux Analyzer XF24 according to the manufacturer’s instructions. Briefly, 5 × 10⁴ cells were seeded on Seahorse 24-well plates. After 24 hr, cells were incubated in HBSS for 16 hr in the presence or absence indicated treatments. The OCRs were average from three independent experiments and normalized by cell number. Samples were mixed (3 min), time delayed (2 min), and measured (3 min). Oligomycin (250 nM), FCCP (250 nM), and rotenone / antimycin (100 nM) were injected at the indicated time points. The mean ± SEM was determined and statistical significance was evaluated using the Student_t_ test with a P value < 0.05.
Membrane potential of isolated mitochondria
Mitochondria were isolated from four P150 (15 cm) plates of MEFs via a previously described differential centrifugation protocol (Daniele et al., 2016). Briefly, PBS from previous washes was replaced with filtered mitochondrial isolation buffer (MIB) [50 mM KCl, 110 mM Mannitol, 70 mM Sucrose, 0.1 mM EDTA (pH 8.0), 5 mM Tris-HCl (pH 7.4), and Protease Inhibitors (Calbiochem)] and cells were homogenized by five passes through a 27.5 gauge needle. JC-9 (3,3′-Dimethyl-α-naphthoxacarbocyanine iodide) (Thermo Fisher Scientific) was added [final 10 μM] (except for the “unlabeled mitochondria” control) and the stained mitochondria then aliquoted into Eppendorf tubes. Tubes were then centrifuged at 200 × g for 5 min at 4°C. The supernatant was removed and transferred to new tubes, which were subsequently spun at 800 × g for 10 min at 4°C. The supernatant from these tubes was spun once more at 12,000 × g for 10 min at 4o C. Finally, this supernatant was removed and mitochondria pellets were resuspended in filtered MIB and kept on ice. Three technical replicates were completed for every biological replicate performed. Tubes containing mitochondria then had palmitoyl-DL-carnitine (AC) added to different final concentrations (0 μM, 10 μM, 25 μM, 50 μM, 100 μM) after which samples were incubated on ice for ~30 min and then analyzed by flow cytometery (LSR Fortessa Analyzer). Once all “polarized” samples were run, valinomycin [final 12 uM] was added to these set-aside tubes for 3–5 min and then mitochondria were re-analyzed. JC-9 dye, similar to JC-1 dye, is incompatible with CCCP and FCCP, therefore valinomycin was used to depolarize mitochondria (Cossarizza et al., 1993; Daniele et al., 2016; Reers et al., 1991; Wolken and Arriaga, 2014). All “depolarized” sample controls were analyzed in this manner. A tube containing filtered MIB and JC-9 alone was included in these spins to use as a dye-alone control during all experiments. An additional tube with lysate, but no JC-9 dye, was also included in the spins to control for “unlabeled mitochondria”. Tubes with MIB and AC alone at [10 μm, 25 μm, 50 μm, 100 μm] were also run after ~30 min on ice.
Data was acquired using an LSR Fortessa Analyzer using the forward scatter (FSC), side scatter (SSC, “Granularity”) (488 nm/10), FITC (“Green channel”) (525 nm/50 with a 500 nm Long Pass filter), and PE-Tx-Red YG (“Red channel”) (610 nm/20 with a 600nm Long Pass filter) filters. Although all data points were recorded, lasers and acquisition settings were calibrated to nullify any signal from unlabeled mitochondria or aggregates of JC-9 dye, valinomycin, or palmitoyl-DL-carnitine (AC) in the fluorescent channels used. For all experiments, only singlets (or single mitochondria) were used when creating any plots or performing any statistical analyses. FlowJo v10 was used to process the data. With respect to mitochondrial morphology measurements, mitochondrial diameter was determined by extrapolating from forward scatter (FSC) data acquired using standard beads from Duke Standards (NIST Traceable Polymer Microspheres, catalog #3K-400, 3K-700, and 3K-1000). Mitochondria diameter (nm) = y = 123.08*(FSC)^0.244, R2 = 0.998, Residual sum of squares (RSS) = 467.31. This is an established use of FSC to approximate mitochondrial size (Beavis et al., 1985; Knight et al., 1981; Petit, 1992). Notably, AC suspended alone in MIB is autofluorescent in the Green channel, which made ratiometric determination of membrane potential (e.g. Red /Green fluorescence) a poor predictor of this quality, especially with depolarized mitochondria. Importantly, AC was not autofluorescent in the Red channel, so to normalize the amount of Red JC-9 aggregates (an indicator of membrane potential) we divided this value by the calculated diameter of mitochondria.
RT-qPCR and RT-PCR
RNA from cells was harvested using TRIzol (Thermo Fisher Scientific) according to manufacturer’s protocol. Synthesis of cDNA from total RNA was performed using High Capacity cDNA Reverse Transcription Kits (Applied Biosytems). Primers were order from Integrated DNA Technologies and used in conjunction with 2× SYBR master mix (Bio-Rad), and a 3-step amplication repeated 40× on CFX96 thermocycler (Bio-Rad). RT-qPCR primers used in this study are listed in Table S4.
The expression of spliced and full length XBP-1 was determine by RT-PCR with oligonucleotide sense primer: 5′-AAACAGAGTAGCAGCTCAGACTGC-3′ and anti-sense primer: 5′-AAACAGAGTAGCAGCGCAGACTGC-3′. Amplified PCR products were resolved on a 2.5% agarose gel, visualized using a Gel Doc imaging system (Bio-Rad), and the density of each band was quantified using ImageJ software (Schneider et al., 2012).
Retention using selective hooks (RUSH) system
The RUSH system to analyze secretory function was previously described (Boncompain et al., 2012). MEF grown in DMEM with 10% dialyzed FBS (Life Technologies) were transfected with the Str-KDEL_SBP-EGFP-E-cadherin plasmid using Fugene 6 (Promega) according to manufacturer’s protocol. Transfected cells grown on coverslips were incubated in CM or in HBSS for 16hr in the presence of DMSO or DGAT1 inhibitor. 40 μM biotin (Sigma) was added for 0 or 60 min to induce release of the SBP-EGFP-E-cadherin fusion reporter. Cells were fixed for 15 min in PBS containing 4% (wt/vol) paraformaldehyde, washed with PBS, and coverslips mounted in Fluoromount G (Southern Biotech). Transfected cells were imaged using a Deltavision Elite widefield epifluoresence deconvolution microscope with a 60× oil immersion objective.
Quantification and Statistical Analysis
Fluorescence microscopy
Fluorescence microscopy images acquired using a Delavision Elite were quantified using ImageJ software (Schneider et al., 2012). Images were thresholded, the area of BODIPY 493/503 stained LDs were quantified from three independent experiments (average of 50 cells per experiment), and the mean ± SEM was determined. Statistical significance was evaluated using the Student t test with a p-value < 0.05.
To analyze the proximity of mitochondria and LDs, images were acquired every 5 sec for 3 min. Relative LD proximity to mitochondria was calculating by measuring the distance from the center of the LD to the center of the nearest mitochondrion in 10 cells per condition (245 LDs in CM and 306 LDs in HBSS). Data was presented as box and whisker plot generated in GraphPad Prism Software. Statistical significance was evaluated using the Student t test with a p-value < 0.05.
Immunoblotting
Immunoblots were visualized on a LI-COR imager (LI-COR Biosciences) and band density quantified using ImageJ software (Schneider et al., 2012). Mean ± SEM was determined from three independent experiments. Statistical significance was evaluated using the Student t test with a p-value < 0.05.
Flow cytometry analyses
FlowJo software was employed for analysis of flow cytometry data. The mean ± SEM was determined from three independent experiments. Statistical significance was evaluated using the Student t test with a p-value < 0.05.
RTqPCR
The mean ± SEM was determined from three independent experiments. Statistical significance was evaluated using the Student_t_ test with a p-value < 0.05.
Supplementary Material
1. Movie S1. Dynamics of LDs and mitochondria in CM. Related to Figure 1.
Movie displays the cell (00:00–00:20) and the boxed region (00:21–00:40) shown in Figure S1A. LDs in living MEFs were stained with BODIPY 493/503 (green) and mitochondria were stained with mitotracker (red) following a 16 hr incubation in CM. Images were acquired every 5 seconds.
2. Movie S2. Dynamics of LDs and mitochondria following HBSS starvation. Related to Figure 1.
Movie displays the cell (00:00–00:20) and the boxed region (00:21–00:40) shown in Figure S1B. LDs in living MEFs were stained with BODIPY 493/503 (green) and mitochondria were stained with mitotracker (red) following a 16 hr incubation in HBSS. Images were acquired every 5 seconds.
3. Supplemental Figures 1-7.
4. Table S1. Metabolomic profiling of MEFs grown in complete media and treated with DGAT1i. Related to Figure 4.
Relative levels of all quantified lipids in MEFs grown in CM and treated with either vehicle or DGAT1i for 16 hr. Significantly altered lipids are highlighted.
5. Table S2. Metabolomic profiling of MEFs starved in HBSS and treated with DGAT1i. Related to Figure 4.
Relative levels of all quantified lipids in MEFs grown in HBSS and treated with either vehicle or DGAT1i for 16 hr. Significantly altered lipids are highlighted.
6. Table S3. Isotopic analysis of fatty acid incorporation in MEFs starved in HBSS and treated with DGAT1i. Related to Figure 5.
Relative levels of all lipids exhibiting significant incorporation of D4-C:16 fatty acid in MEFs grown in HBSS treated with vehicle or DGAT1i. Significantly altered lipids are highlighted.
7. Table S4. RT-qPCR primers employed in this study. Related to STAR Methods.
Highlights.
- mTORC1-regulated autophagy generates lipids that are sequestered in lipid droplets
- Autophagy-dependent lipid droplet biogenesis requires DGAT1
- Lipid droplets prevent lipotoxic mitochondrial dysfunction during autophagy
- Acylcarnitine accumulation causes mitochondrial uncoupling
Acknowledgments
We thank members of the Olzmann lab for useful discussions. This research was supported by grants from the National Institutes of Health (R00DK095921 and R01GM112948 to J.A.O and R01CA172667 to D.K.N.) and from the American Heart Association (16GRNT30870005 to J.A.O.). T.B.N was supported by a training grant from the NIH (T32DK061918) and S.L. was supported by a National Science Foundation graduate fellowship. A.D. is a founder of Proteostasis Therapeutics and Mitobridge, Inc. and declares no financial interest.
Footnotes
Author contributions: J.A.O., T.B.N., J.M.G., R.Z., and D.K.M. conceived of and designed experiments; T.B.N., S.M.L., Q.T., and J.R.D. performed the experiments; J.A.O., T.B.N., D.K.M., S.M.L., Q.T., and J.R.D. analyzed data; J.A.O., T.B.N., R.Z., D.K.M., S.M.L., Q.T., and J.R.D interpreted results; J.A.O. and T.B.N. wrote the manuscript; and R.Z., D.K.M., J.R.D., and A.D. read and edited the manuscript.
Publisher's Disclaimer: This is a PDF file of an unedited manuscript that has been accepted for publication. As a service to our customers we are providing this early version of the manuscript. The manuscript will undergo copyediting, typesetting, and review of the resulting proof before it is published in its final citable form. Please note that during the production process errors may be discovered which could affect the content, and all legal disclaimers that apply to the journal pertain.
References
- Alers S, Loffler AS, Wesselborg S, Stork B. Role of AMPK-mTOR-Ulk1/2 in the regulation of autophagy: cross talk, shortcuts, and feedbacks. Mol Cell Biol. 2012;32:2–11. doi: 10.1128/MCB.06159-11. [DOI] [PMC free article] [PubMed] [Google Scholar]
- Bailey AP, Koster G, Guillermier C, Hirst EMA, MacRae JI, Lechene CP, Postle AD, Gould AP. Antioxidant Role for Lipid Droplets in a Stem Cell Niche of Drosophila. Cell. 2015;163:340–353. doi: 10.1016/j.cell.2015.09.020. [DOI] [PMC free article] [PubMed] [Google Scholar]
- Bar-Peled L, Chantranupong L, Cherniack AD, Chen WW, Ottina KA, Grabiner BC, Spear ED, Carter SL, Meyerson M, Sabatini DM. A Tumor suppressor complex with GAP activity for the Rag GTPases that signal amino acid sufficiency to mTORC1. Science. 2013;340:1100–1106. doi: 10.1126/science.1232044. [DOI] [PMC free article] [PubMed] [Google Scholar]
- Beavis AD, Brannan RD, Garlid KD. Swelling and contraction of the mitochondrial matrix. I. A structural interpretation of the relationship between light scattering and matrix volume. J Biol Chem. 1985;260:13424–13433. [PubMed] [Google Scholar]
- Benjamin DI, Li DS, Lowe W, Heuer T, Kemble G, Nomura DK. Diacylglycerol Metabolism and Signaling Is a Driving Force Underlying FASN Inhibitor Sensitivity in Cancer Cells. ACS Chem Biol. 2015;10:1616–1623. doi: 10.1021/acschembio.5b00240. [DOI] [PMC free article] [PubMed] [Google Scholar]
- Boncompain G, Divoux S, Gareil N, de Forges H, Lescure A, Latreche L, Mercanti V, Jollivet F, Raposo G, Perez F. Synchronization of secretory protein traffic in populations of cells. Nat Methods. 2012;9:493–498. doi: 10.1038/nmeth.1928. [DOI] [PubMed] [Google Scholar]
- Cabodevilla AG, Sanchez-Caballero L, Nintou E, Boiadjieva VG, Picatoste F, Gubern A, Claro E. Cell survival during complete nutrient deprivation depends on lipid droplet-fueled β-oxidation of fatty acids. J Biol Chem. 2013;288:27777–27788. doi: 10.1074/jbc.M113.466656. [DOI] [PMC free article] [PubMed] [Google Scholar]
- Chantranupong L, Wolfson RL, Sabatini DM. Nutrient-sensing mechanisms across evolution. Cell. 2015;161:67–83. doi: 10.1016/j.cell.2015.02.041. [DOI] [PMC free article] [PubMed] [Google Scholar]
- Cossarizza A, Baccaranicontri M, Kalashnikova G, Franceschi C. A New Method for the Cytofluorometric Analysis of Mitochondrial Membrane Potential Using the J-Aggregate Forming Lipophilic Cation 5,5′,6,6′-Tetrachloro-1,1′,3,3′-tetraethylbenzimidazolcarbocyanine Iodide (JC-1) Biochem Biophys Res Commun. 1993;197:40–45. doi: 10.1006/bbrc.1993.2438. [DOI] [PubMed] [Google Scholar]
- Daniele JR, Heydari K, Arriaga EA, Dillin A. Identification and Characterization of Mitochondrial Subtypes in Caenorhabditis elegans via Analysis of Individual Mitochondria by Flow Cytometry. Anal Chem. 2016;88:6309–6316. doi: 10.1021/acs.analchem.6b00542. [DOI] [PMC free article] [PubMed] [Google Scholar]
- Dupont N, Chauhan S, Arko-Mensah J, Castillo EF, Masedunskas A, Weigert R, Robenek H, Proikas-Cezanne T, Deretic V. Neutral lipid stores and lipase PNPLA5 contribute to autophagosome biogenesis. Curr Biol. 2014;24:609–620. doi: 10.1016/j.cub.2014.02.008. [DOI] [PMC free article] [PubMed] [Google Scholar]
- Efeyan A, Comb WC, Sabatini DM. Nutrient-sensing mechanisms and pathways. Nature. 2015;517:302–310. doi: 10.1038/nature14190. [DOI] [PMC free article] [PubMed] [Google Scholar]
- Finn PF, Dice JF. Proteolytic and lipolytic responses to starvation. Nutrition. 2006;22:830–844. doi: 10.1016/j.nut.2006.04.008. [DOI] [PubMed] [Google Scholar]
- Friedman JR, Lackner LL, West M, DiBenedetto JR, Nunnari J, Voeltz GK. ER tubules mark sites of mitochondrial division. Science. 2011;334:358–362. doi: 10.1126/science.1207385. [DOI] [PMC free article] [PubMed] [Google Scholar]
- Galluzzi L, Pietrocola F, Levine B, Kroemer G. Metabolic control of autophagy. Cell. 2014;159:1263–1276. doi: 10.1016/j.cell.2014.11.006. [DOI] [PMC free article] [PubMed] [Google Scholar]
- Garbarino J, Padamsee M, Wilcox L, Oelkers PM, D’Ambrosio D, Ruggles KV, Ramsey N, Jabado O, Turkish A, Sturley SL. Sterol and diacylglycerol acyltransferase deficiency triggers fatty acid-mediated cell death. J Biol Chem. 2009;284:30994–31005. doi: 10.1074/jbc.M109.050443. [DOI] [PMC free article] [PubMed] [Google Scholar]
- Gomes LC, Di Benedetto G, Scorrano L. During autophagy mitochondria elongate, are spared from degradation and sustain cell viability. Nat Cell Biol. 2011;13:589–598. doi: 10.1038/ncb2220. [DOI] [PMC free article] [PubMed] [Google Scholar]
- Gubern A, Barcelo-Torns M, Casas J, Barneda D, Masgrau R, Picatoste F, Balsinde J, Balboa MA, Claro E. Lipid droplet biogenesis induced by stress involves triacylglycerol synthesis that depends on group VIA phospholipase A2. J Biol Chem. 2009;284:5697–5708. doi: 10.1074/jbc.M806173200. [DOI] [PubMed] [Google Scholar]
- Harding HP, Novoa I, Zhang Y, Zeng H, Wek R, Schapira M, Ron D. Regulated translation initiation controls stress-induced gene expression in mammalian cells. Mol Cell. 2000;6:1099–1108. doi: 10.1016/s1097-2765(00)00108-8. [DOI] [PubMed] [Google Scholar]
- Harding HP, Zhang Y, Zeng H, Novoa I, Lu PD, Calfon M, Sadri N, Yun C, Popko B, Paules R, et al. An integrated stress response regulates amino acid metabolism and resistance to oxidative stress. Mol Cell. 2003;11:619–633. doi: 10.1016/s1097-2765(03)00105-9. [DOI] [PubMed] [Google Scholar]
- Harris CA, Haas JT, Streeper RS, Stone SJ, Kumari M, Yang K, Han X, Brownell N, Gross RW, Zechner R, et al. DGAT enzymes are required for triacylglycerol synthesis and lipid droplets in adipocytes. J Lipid Res. 2011;52:657–667. doi: 10.1194/jlr.M013003. [DOI] [PMC free article] [PubMed] [Google Scholar]
- Hashemi HF, Goodman JM. The life cycle of lipid droplets. Curr Opin Cell Biol. 2015;33:119–124. doi: 10.1016/j.ceb.2015.02.002. [DOI] [PMC free article] [PubMed] [Google Scholar]
- Herms A, Bosch M, Reddy BJN, Schieber NL, Fajardo A, Ruperez C, Fernandez-Vidal A, Ferguson C, Rentero C, Tebar F, et al. AMPK activation promotes lipid droplet dispersion on detyrosinated microtubules to increase mitochondrial fatty acid oxidation. Nat Commun. 2015;6:7176. doi: 10.1038/ncomms8176. [DOI] [PMC free article] [PubMed] [Google Scholar]
- Kaizuka T, Morishita H, Hama Y, Tsukamoto S, Matsui T, Toyota Y, Kodama A, Ishihara T, Mizushima T, Mizushima N. An Autophagic Flux Probe that Releases an Internal Control. Mol Cell. 2016;64:835–849. doi: 10.1016/j.molcel.2016.09.037. [DOI] [PubMed] [Google Scholar]
- Kim J, Kundu M, Viollet B, Guan KL. AMPK and mTOR regulate autophagy through direct phosphorylation of Ulk1. Nat Cell Biol. 2011;13:132–141. doi: 10.1038/ncb2152. [DOI] [PMC free article] [PubMed] [Google Scholar]
- Knight VA, Wiggins PM, Harvey JD, O’Brien JA. The relationship between the size of mitochondria and the intensity of light that they scatter in different energetic states. Biochim Biophys Acta. 1981;637:146–151. doi: 10.1016/0005-2728(81)90220-6. [DOI] [PubMed] [Google Scholar]
- Koliwad SK, Streeper RS, Monetti M, Cornelissen I, Chan L, Terayama K, Naylor S, Rao M, Hubbard B, Farese RV. DGAT1-dependent triacylglycerol storage by macrophages protects mice from diet-induced insulin resistance and inflammation. J Clin Invest. 2010;120:756–767. doi: 10.1172/JCI36066. [DOI] [PMC free article] [PubMed] [Google Scholar]
- Lass A, Zimmermann R, Oberer M, Zechner R. Lipolysis - a highly regulated multi-enzyme complex mediates the catabolism of cellular fat stores. Prog Lipid Res. 2011;50:14–27. doi: 10.1016/j.plipres.2010.10.004. [DOI] [PMC free article] [PubMed] [Google Scholar]
- Lee JS, Mendez R, Heng HH, Yang ZQ, Zhang K. Pharmacological ER stress promotes hepatic lipogenesis and lipid droplet formation. Am J Transl Res. 2012;4:102–113. [PMC free article] [PubMed] [Google Scholar]
- Li D, Song JZ, Li H, Shan MH, Liang Y, Zhu J, Xie Z. Storage lipid synthesis is necessary for autophagy induced by nitrogen starvation. FEBS Lett. 2015;589:269–276. doi: 10.1016/j.febslet.2014.11.050. [DOI] [PubMed] [Google Scholar]
- Listenberger LL, Han X, Lewis SE, Cases S, Farese RV, Ory DS, Schaffer JE. Triglyceride accumulation protects against fatty acid-induced lipotoxicity. Proc Natl Acad Sci U S A. 2003;100:3077–3082. doi: 10.1073/pnas.0630588100. [DOI] [PMC free article] [PubMed] [Google Scholar]
- Liu L, Shi X, Bharadwaj KG, Ikeda S, Yamashita H, Yagyu H, Schaffer JE, Yu YH, Goldberg IJ. DGAT1 expression increases heart triglyceride content but ameliorates lipotoxicity. J Biol Chem. 2009;284:36312–36323. doi: 10.1074/jbc.M109.049817. [DOI] [PMC free article] [PubMed] [Google Scholar]
- Liu L, Yu S, Khan RS, Homma S, Schulze PC, Blaner WS, Yin Y, Goldberg IJ. Diacylglycerol acyl transferase 1 overexpression detoxifies cardiac lipids in PPARγ transgenic mice. J Lipid Res. 2012;53:1482–1492. doi: 10.1194/jlr.M024208. [DOI] [PMC free article] [PubMed] [Google Scholar]
- Liu L, Trent CM, Fang X, Son NH, Jiang H, Blaner WS, Hu Y, Yin YX, Farese RV, Homma S, et al. Cardiomyocyte-specific loss of diacylglycerol acyltransferase 1 (DGAT1) reproduces the abnormalities in lipids found in severe heart failure. J Biol Chem. 2014;289:29881–29891. doi: 10.1074/jbc.M114.601864. [DOI] [PMC free article] [PubMed] [Google Scholar]
- Long JZ, Svensson KJ, Bateman LA, Lin H, Kamenecka T, Lokurkar IA, Lou J, Rao RR, Chang MR, Jedrychowski MP, et al. The secreted enzyme PM20D1 regulates lipidated amino acid uncouplers of mitochondria. Cell. 2016;166:424–435. doi: 10.1016/j.cell.2016.05.071. [DOI] [PMC free article] [PubMed] [Google Scholar]
- Louie SM, Roberts LS, Mulvihill MM, Luo K, Nomura DK. Cancer cells incorporate and remodel exogenous palmitate into structural and oncogenic signaling lipids. Biochim Biophys Acta. 2013;1831:1566–1572. doi: 10.1016/j.bbalip.2013.07.008. [DOI] [PMC free article] [PubMed] [Google Scholar]
- Louie SM, Grossman EA, Crawford LA, Ding L, Camarda R, Huffman TR, Miyamoto DK, Goga A, Weerapana E, Nomura DK. GSTP1 Is a Driver of Triple-Negative Breast Cancer Cell Metabolism and Pathogenicity. Cell Chemical Biology. 2016;23:567–578. doi: 10.1016/j.chembiol.2016.03.017. [DOI] [PMC free article] [PubMed] [Google Scholar]
- Martinez-Lopez N, Singh R. Autophagy and Lipid Droplets in Liver. Annu Rev Nutr. 2015 doi: 10.1146/annurev-nutr-071813-105336. [DOI] [PMC free article] [PubMed] [Google Scholar]
- Mayer N, Schweiger M, Romauch M, Grabner GF, Eichmann TO, Fuchs E, Ivkovic J, Heier C, Mrak I, Lass A, et al. Development of small-molecule inhibitors targeting adipose triglyceride lipase. Nat Chem Biol. 2013;9:785–787. doi: 10.1038/nchembio.1359. [DOI] [PMC free article] [PubMed] [Google Scholar]
- McCoin CS, Knotts TA, Adams SH. Acylcarnitines--old actors auditioning for new roles in metabolic physiology. Nat Rev Endocrinol. 2015;11:617–625. doi: 10.1038/nrendo.2015.129. [DOI] [PMC free article] [PubMed] [Google Scholar]
- Nada S, Hondo A, Kasai A, Koike M, Saito K, Uchiyama Y, Okada M. The novel lipid raft adaptor p18 controls endosome dynamics by anchoring the MEK-ERK pathway to late endosomes. EMBO J. 2009;28:477–489. doi: 10.1038/emboj.2008.308. [DOI] [PMC free article] [PubMed] [Google Scholar]
- Parmigiani A, Nourbakhsh A, Ding B, Wang W, Kim YC, Akopiants K, Guan KL, Karin M, Budanov AV. Sestrins inhibit mTORC1 kinase activation through the GATOR complex. Cell Rep. 2014;9:1281–1291. doi: 10.1016/j.celrep.2014.10.019. [DOI] [PMC free article] [PubMed] [Google Scholar]
- Petit PX. Flow Cytometric Analysis of Rhodamine 123 Fluorescence during Modulation of the Membrane Potential in Plant Mitochondria. Plant Physiol. 1992;98:279–286. doi: 10.1104/pp.98.1.279. [DOI] [PMC free article] [PubMed] [Google Scholar]
- Petschnigg J, Wolinski H, Kolb D, Zellnig G, Kurat CF, Natter K, Kohlwein SD. Good fat, essential cellular requirements for triacylglycerol synthesis to maintain membrane homeostasis in yeast. J Biol Chem. 2009;284:30981–30993. doi: 10.1074/jbc.M109.024752. [DOI] [PMC free article] [PubMed] [Google Scholar]
- Pol A, Gross SP, Parton RG. Review: biogenesis of the multifunctional lipid droplet: lipids, proteins, and sites. J Cell Biol. 2014;204:635–646. doi: 10.1083/jcb.201311051. [DOI] [PMC free article] [PubMed] [Google Scholar]
- Prinz WA. Bridging the gap: membrane contact sites in signaling, metabolism, and organelle dynamics. J Cell Biol. 2014;205:759–769. doi: 10.1083/jcb.201401126. [DOI] [PMC free article] [PubMed] [Google Scholar]
- Rambold AS, Kostelecky B, Elia N, Lippincott-Schwartz J. Tubular network formation protects mitochondria from autophagosomal degradation during nutrient starvation. Proc Natl Acad Sci U S A. 2011;108:10190–10195. doi: 10.1073/pnas.1107402108. [DOI] [PMC free article] [PubMed] [Google Scholar]
- Rambold AS, Cohen S, Lippincott-Schwartz J. Fatty acid trafficking in starved cells: regulation by lipid droplet lipolysis, autophagy, and mitochondrial fusion dynamics. Dev Cell. 2015;32:678–692. doi: 10.1016/j.devcel.2015.01.029. [DOI] [PMC free article] [PubMed] [Google Scholar]
- Ravikumar B, Sarkar S, Davies JE, Futter M, Garcia-Arencibia M, Green-Thompson ZW, Jimenez-Sanchez M, Korolchuk VI, Lichtenberg M, Luo S, et al. Regulation of mammalian autophagy in physiology and pathophysiology. Physiol Rev. 2010;90:1383–1435. doi: 10.1152/physrev.00030.2009. [DOI] [PubMed] [Google Scholar]
- Reers M, Smith TW, Chen LB. J-aggregate formation of a carbocyanine as a quantitative fluorescent indicator of membrane potential. Biochemistry. 1991;30:4480–4486. doi: 10.1021/bi00232a015. [DOI] [PubMed] [Google Scholar]
- Requero MA, Goni FM, Alonso A. The membrane-perturbing properties of palmitoyl-coenzyme A and palmitoylcarnitine. A comparative study. Biochemistry. 1995a;34:10400–10405. doi: 10.1021/bi00033a011. [DOI] [PubMed] [Google Scholar]
- Requero MA, Gonzalez M, Goni FM, Alonso A, Fidelio G. Differential penetration of fatty acyl-coenzyme A and fatty acylcarnitines into phospholipid monolayers. FEBS Lett. 1995b;357:75–78. doi: 10.1016/0014-5793(94)01326-v. [DOI] [PubMed] [Google Scholar]
- Robblee MM, Kim CC, Porter Abate J, Valdearcos M, Sandlund KLM, Shenoy MK, Volmer R, Iwawaki T, Koliwad SK. Saturated Fatty Acids Engage an IRE1α-Dependent Pathway to Activate the NLRP3 Inflammasome in Myeloid Cells. Cell Rep. 2016;14:2611–2623. doi: 10.1016/j.celrep.2016.02.053. [DOI] [PMC free article] [PubMed] [Google Scholar]
- Rowland AA, Chitwood PJ, Phillips MJ, Voeltz GK. ER contact sites define the position and timing of endosome fission. Cell. 2014;159:1027–1041. doi: 10.1016/j.cell.2014.10.023. [DOI] [PMC free article] [PubMed] [Google Scholar]
- Salo VT, Belevich I, Li S, Karhinen L, Vihinen H, Vigouroux C, Magre J, Thiele C, Holtta-Vuori M, Jokitalo E, et al. Seipin regulates ER-lipid droplet contacts and cargo delivery. EMBO J. 2016;35:2699–2716. doi: 10.15252/embj.201695170. [DOI] [PMC free article] [PubMed] [Google Scholar]
- Sancak Y, Bar-Peled L, Zoncu R, Markhard AL, Nada S, Sabatini DM. Ragulator-Rag complex targets mTORC1 to the lysosomal surface and is necessary for its activation by amino acids. Cell. 2010;141:290–303. doi: 10.1016/j.cell.2010.02.024. [DOI] [PMC free article] [PubMed] [Google Scholar]
- Sanjana NE, Shalem O, Zhang F. Improved vectors and genome-wide libraries for CRISPR screening. Nat Methods. 2014;11:783–784. doi: 10.1038/nmeth.3047. [DOI] [PMC free article] [PubMed] [Google Scholar]
- Schneider CA, Rasband WS, Eliceiri KW. NIH Image to ImageJ: 25 years of image analysis. Nat Methods. 2012;9:671–675. doi: 10.1038/nmeth.2089. [DOI] [PMC free article] [PubMed] [Google Scholar]
- Shpilka T, Welter E, Borovsky N, Amar N, Mari M, Reggiori F, Elazar Z. Lipid droplets and their component triglycerides and steryl esters regulate autophagosome biogenesis. EMBO J. 2015;34:2117–2131. doi: 10.15252/embj.201490315. [DOI] [PMC free article] [PubMed] [Google Scholar]
- Singh R, Kaushik S, Wang Y, Xiang Y, Novak I, Komatsu M, Tanaka K, Cuervo AM, Czaja MJ. Autophagy regulates lipid metabolism. Nature. 2009;458:1131–1135. doi: 10.1038/nature07976. [DOI] [PMC free article] [PubMed] [Google Scholar]
- Son NH, Yu S, Tuinei J, Arai K, Hamai H, Homma S, Shulman GI, Abel ED, Goldberg IJ. PPARγ-induced cardiolipotoxicity in mice is ameliorated by PPARα deficiency despite increases in fatty acid oxidation. J Clin Invest. 2010;120:3443–3454. doi: 10.1172/JCI40905. [DOI] [PMC free article] [PubMed] [Google Scholar]
- To M, Peterson CWH, Roberts MA, Counihan JL, Wu TT, Forster MS, Nomura DK, Olzmann JA. Lipid disequilibrium disrupts ER proteostasis by impairing ERAD substrate glycan trimming and dislocation. Mol Biol Cell. 2017;28:270–284. doi: 10.1091/mbc.E16-07-0483. [DOI] [PMC free article] [PubMed] [Google Scholar]
- Toulmay A, Prinz WA. Lipid transfer and signaling at organelle contact sites: the tip of the iceberg. Curr Opin Cell Biol. 2011;23:458–463. doi: 10.1016/j.ceb.2011.04.006. [DOI] [PMC free article] [PubMed] [Google Scholar]
- Vance JE. MAM (mitochondria-associated membranes) in mammalian cells: lipids and beyond. Biochim Biophys Acta. 2014;1841:595–609. doi: 10.1016/j.bbalip.2013.11.014. [DOI] [PubMed] [Google Scholar]
- Velazquez AP, Tatsuta T, Ghillebert R, Drescher I, Graef M. Lipid droplet-mediated ER homeostasis regulates autophagy and cell survival during starvation. J Cell Biol. 2016;212:621–631. doi: 10.1083/jcb.201508102. [DOI] [PMC free article] [PubMed] [Google Scholar]
- Wajner M, Amaral AU. Mitochondrial dysfunction in fatty acid oxidation disorders: insights from human and animal studies. Biosci Rep. 2015;36:e00281. doi: 10.1042/BSR20150240. [DOI] [PMC free article] [PubMed] [Google Scholar]
- Walther TC, Farese RV. Lipid droplets and cellular lipid metabolism. Annu Rev Biochem. 2012;81:687–714. doi: 10.1146/annurev-biochem-061009-102430. [DOI] [PMC free article] [PubMed] [Google Scholar]
- Wang H, Sreenivasan U, Sreenevasan U, Hu H, Saladino A, Polster BM, Lund LM, Gong D, Stanley WC, Sztalryd C. Perilipin 5, a lipid droplet-associated protein, provides physical and metabolic linkage to mitochondria. J Lipid Res. 2011;52:2159–2168. doi: 10.1194/jlr.M017939. [DOI] [PMC free article] [PubMed] [Google Scholar]
- Wang H, Becuwe M, Housden BE, Chitraju C, Porras AJ, Graham MM, Liu XN, Thiam AR, Savage DB, Agarwal AK, et al. Seipin is required for converting nascent to mature lipid droplets. Elife. 2016;5 doi: 10.7554/eLife.16582. [DOI] [PMC free article] [PubMed] [Google Scholar]
- Wilfling F, Wang H, Haas JT, Krahmer N, Gould TJ, Uchida A, Cheng JX, Graham M, Christiano R, Frohlich F, et al. Triacylglycerol synthesis enzymes mediate lipid droplet growth by relocalizing from the ER to lipid droplets. Dev Cell. 2013;24:384–399. doi: 10.1016/j.devcel.2013.01.013. [DOI] [PMC free article] [PubMed] [Google Scholar]
- Wolken GG, Arriaga EA. Simultaneous measurement of individual mitochondrial membrane potential and electrophoretic mobility by capillary electrophoresis. Anal Chem. 2014;86:4217–4226. doi: 10.1021/ac403849x. [DOI] [PMC free article] [PubMed] [Google Scholar]
- Xu G, Sztalryd C, Lu X, Tansey JT, Gan J, Dorward H, Kimmel AR, Londos C. Post-translational regulation of adipose differentiation-related protein by the ubiquitin/proteasome pathway. J Biol Chem. 2005;280:42841–42847. doi: 10.1074/jbc.M506569200. [DOI] [PubMed] [Google Scholar]
- Xu G, Sztalryd C, Londos C. Degradation of perilipin is mediated through ubiquitination-proteasome pathway. Biochim Biophys Acta. 2006;1761:83–90. doi: 10.1016/j.bbalip.2005.12.005. [DOI] [PubMed] [Google Scholar]
- Yang Z, Klionsky DJ. Mammalian autophagy: core molecular machinery and signaling regulation. Curr Opin Cell Biol. 2010;22:124–131. doi: 10.1016/j.ceb.2009.11.014. [DOI] [PMC free article] [PubMed] [Google Scholar]
- Yen CLE, Stone SJ, Koliwad S, Harris C, Farese RV. Thematic review series: glycerolipids. DGAT enzymes and triacylglycerol biosynthesis. J Lipid Res. 2008;49:2283–2301. doi: 10.1194/jlr.R800018-JLR200. [DOI] [PMC free article] [PubMed] [Google Scholar]
- Zoncu R, Efeyan A, Sabatini DM. mTOR: from growth signal integration to cancer, diabetes and ageing. Nat Rev Mol Cell Biol. 2011;12:21–35. doi: 10.1038/nrm3025. [DOI] [PMC free article] [PubMed] [Google Scholar]
Associated Data
This section collects any data citations, data availability statements, or supplementary materials included in this article.
Supplementary Materials
1. Movie S1. Dynamics of LDs and mitochondria in CM. Related to Figure 1.
Movie displays the cell (00:00–00:20) and the boxed region (00:21–00:40) shown in Figure S1A. LDs in living MEFs were stained with BODIPY 493/503 (green) and mitochondria were stained with mitotracker (red) following a 16 hr incubation in CM. Images were acquired every 5 seconds.
2. Movie S2. Dynamics of LDs and mitochondria following HBSS starvation. Related to Figure 1.
Movie displays the cell (00:00–00:20) and the boxed region (00:21–00:40) shown in Figure S1B. LDs in living MEFs were stained with BODIPY 493/503 (green) and mitochondria were stained with mitotracker (red) following a 16 hr incubation in HBSS. Images were acquired every 5 seconds.
3. Supplemental Figures 1-7.
4. Table S1. Metabolomic profiling of MEFs grown in complete media and treated with DGAT1i. Related to Figure 4.
Relative levels of all quantified lipids in MEFs grown in CM and treated with either vehicle or DGAT1i for 16 hr. Significantly altered lipids are highlighted.
5. Table S2. Metabolomic profiling of MEFs starved in HBSS and treated with DGAT1i. Related to Figure 4.
Relative levels of all quantified lipids in MEFs grown in HBSS and treated with either vehicle or DGAT1i for 16 hr. Significantly altered lipids are highlighted.
6. Table S3. Isotopic analysis of fatty acid incorporation in MEFs starved in HBSS and treated with DGAT1i. Related to Figure 5.
Relative levels of all lipids exhibiting significant incorporation of D4-C:16 fatty acid in MEFs grown in HBSS treated with vehicle or DGAT1i. Significantly altered lipids are highlighted.
7. Table S4. RT-qPCR primers employed in this study. Related to STAR Methods.