Single-cell RNA-seq reveals new types of human blood dendritic cells, monocytes and progenitors (original) (raw)
. Author manuscript; available in PMC: 2018 Jan 19.
Published in final edited form as: Science. 2017 Apr 21;356(6335):eaah4573. doi: 10.1126/science.aah4573
Abstract
Dendritic cells (DCs) and monocytes play a central role in pathogen sensing, phagocytosis and antigen presentation and consist of multiple specialized subtypes. However, their identities and interrelationships are not fully understood. Using unbiased single-cell RNA sequencing (RNA-seq) of ~2400 cells, we identified six human DCs and four monocyte subtypes in human blood. Our study reveals: a new DC subset that shares properties with plasmacytoid DCs (pDCs) but potently activates T cells, thus redefining pDCs; a new subdivision within the CD1C+ subset of DCs; the relationship between blastic plasmacytoid DC neoplasia cells and healthy DCs; and circulating progenitor of conventional DCs (cDCs). Our revised taxonomy will enable more accurate functional and developmental analyses as well as immune monitoring in health and disease.
Dendritic cells (DCs) are mononuclear phagocytes found in blood, lymphoid organs, and all tissues. One of their central functions is to ingest materials such as pathogens, present processed epitopes to T cells, and regulate innate and adaptive immune responses (1–3). DCs are heterogeneous and consist of multiple subtypes with unique functions that have been defined over the past decade in mice and humans. However, it is unclear how many DC subtypes exist, how they are related to each other, and how they differ from other mononuclear phagocytes.
Numerous studies have shown that human dendritic cells express high levels of major histocompatibility complex (MHC) class II (e.g., HLA-DR), a molecule essential for antigen presentation, and lack key markers of T cells, B cells, natural killer (NK) cells, granulocyte and monocytes. In the blood, DC subtypes include CD11C+ conventional DCs (cDCs), consisting of either CD141+ or CD1C+ cells, and plasmacytoid DCs (pDCs), consisting of CD123+ cells. cDCs are effective at antigen-specific stimulation of CD4+ and CD8+ T cells, whereas pDCs specialize in producing type I interferons in response to viruses. pDCs and cDC subtypes differ in their expression of numerous sensors, pathways and effectors, and play distinct roles in the immune response (1–3).
The different DC subtypes have historically been defined by a combination of morphology, physical properties, localization, molecular markers, functions and developmental origins, converging to the current model described above (1–3). However, the definition of DCs is still likely to be biased by the limited markers available to identify, isolate and manipulate the cells. Such biases, in turn, would alter the assignment of function and ontogeny to each DC subtype.
To overcome some of these limitations, we used single-cell RNA sequencing (scRNA-seq) (4,5) to better assess the diversity of blood DCs and monocytes, leading us to identify new subtypes of DCs and monocytes, refine their existing classification, and pinpoint a precursor of cDCs in the blood. Using discriminative markers associated with the newly defined DC subtypes, we also assessed the functions of some of the DC subtypes. Overall, our analysis provides a relatively unbiased and comprehensive map of human blood DCs and monocytes.
Strategy for discovery and validation of DC and monocyte subtypes
To determine the subtypes of DCs and monocytes in human blood, we developed an experimental and computational strategy to (i) perform single-cell RNA-sequencing on DCs and monocytes derived from a single healthy individual; (ii) identify clusters of cells that are similar to each other; (iii) find discriminative markers per cluster; (iv) prospectively isolate cells corresponding to key clusters using newly identified surface markers; (v) validate the identity of the sorted cells using scRNA-seq; (vi) confirm the existence of these cell types in up to 10 independent healthy individuals; and (vii) perform functional analyses for selected cell types.
Single-cell profiling of blood DCs and monocytes
We analyzed blood DC and monocyte populations from Ficoll-enriched cells that were isolated by fluorescence-activated cell sorting (FACS) (Fig. 1A) excluding cells expressing markers of B, T and NK cells (6). For DCs, we sampled LIN−HLA-DR+CD14− cells across the CD11C+ fraction (to enrich for CD141+ and CD1C+ cDCs) and the CD11C− fraction (to enrich for CD123+ pDCs) (Fig. 1B). For monocytes, we sampled LIN−CD14lo/++ cells (including classical CD14++CD16−, intermediate CD14++CD16+, and non-classical CD14+CD16++). We used additional markers (DCs: CD123, CD141, CD1C; monocytes: CD14, CD16) to create overlapping gates that comprehensively and evenly sample DCs and monocytes (6).
Figure 1. Human blood DC heterogeneity delineated by single-cell RNA-sequencing.
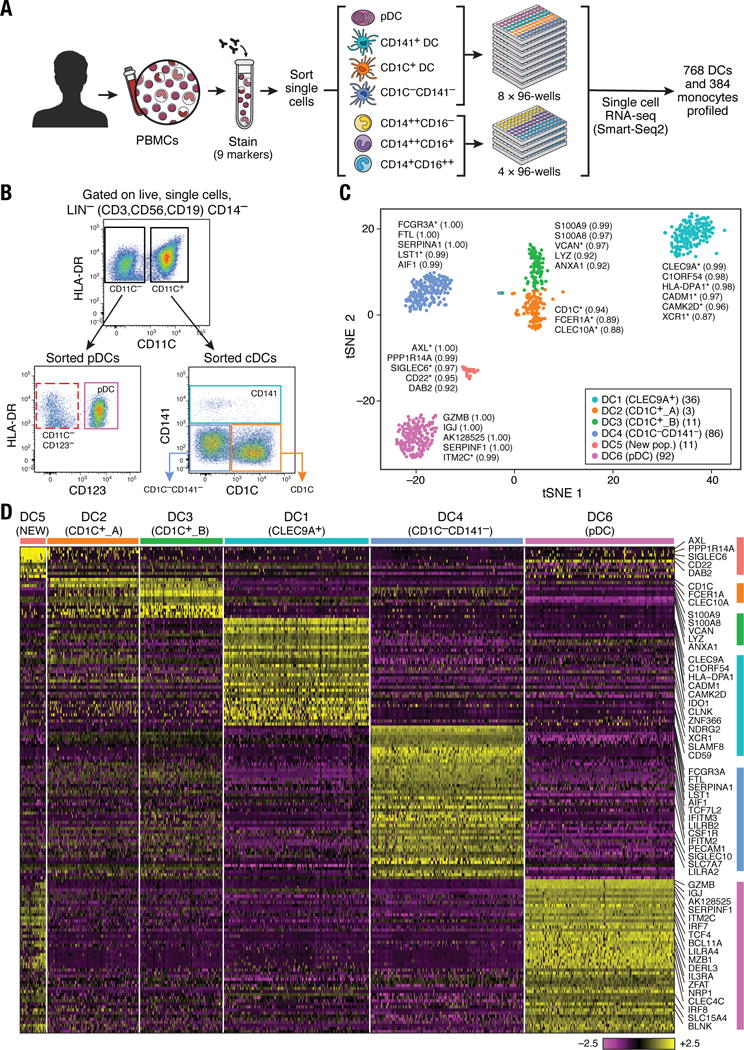
(A) Workflow of experimental strategy: (i) isolation of human PBMC from blood; (ii) sorting single DC (8×96-well plates) and monocytes (4×96-well plates) into single wells using an antibody cocktail to enrich for cell fractions; (iii) single cell transcriptome profiling. (B) Gating strategy for single-cell sorting: DCs were defined as live, LIN(CD3, CD19, CD56)−CD14−HLA-DR+ cells. Three loose overlapping gates were drawn as an enrichment strategy to ensure a comprehensive and even sampling of all populations: CD11C+CD141+ (CD141; turquoise), CD11C+CD1C+ (CD1C; orange), CD11C+CD141−CD1C− (“double negative”; blue), and CD11C−CD123+ plasmacytoid DCs (pDCs; purple). 24 single cells from these four gates were sorted per 96-well plate. A fifth gate (CD11C−CD123−; red dashed) was subsequently investigated (see Fig. 6). (C) _t_-SNE analysis of DCs (n = 742). Numbers of successfully profiled single cells per cluster: DC1 (n =166); DC2 (_n_=105); DC3 (_n_=95); DC4 (n =175); DC5 (_n_=30); DC6 (n =171). The number of discriminative genes with AUC cutoff ≥ 0.85 is reported in bracket next to each cluster ID. Up to five top discriminators are listed next to each cluster; number in bracket refers to AUC value. Colors indicate unbiased DC classification via graph-based clustering. Each dot represents an individual cell. (D) Heatmap reports scaled expression [log TPM (transcripts per million) values] of discriminative gene sets for each cluster defined in Fig. 1C with AUC cutoff ≥0.85. Color scheme is based on z-score distribution from −2.5 (purple) to 2.5 (yellow). Right margin color bars highlight gene sets specific to the respective DC subset.
To define subpopulations and identify useful markers for further isolation, we performed deep scRNA-seq using a modified version of Smart-Seq2 protocol (6), followed by sequencing of ~1–2 million paired-end reads per cell (7,8). Of 768 DCs and 372 monocytes initially profiled in the selected individual for discovering subsets, we focused on 742 DCs and 339 monocytes that passed quality control (QC) filters (6) with an average of 5326 unique genes detected per cell. In subsequent validation and characterization phases, we additionally profiled ~1200 cells.
Unbiased classification of LIN−HLA-DR+CD14− subsets
We defined six cell clusters within the LIN−HLA-DR+CD14− population using unsupervised analysis that did not rely on known markers of DCs. Briefly, we identified 595 genes exhibiting high variability across single cells, reduced the dimensionality of these data with principal components analysis (PCA), and identified five significant PCs using a previously described permutation test (6, 9). We used these PC loadings as input to _t_-distributed stochastic neighbor embedding (_t_-SNE) (10) for visualization, and clustered cells using a graph-based approach similar to one recently developed for mass cytometry data (6, 11). We observed six clusters numbered DC1 to DC6 as follows: two clusters mapping closely to the well-established DC subsets, with cluster DC1 mapping to CD141+ DCs and cluster DC6 to pDCs (based on the post hoc overlap of transcript and surface marker expression); two clusters containing the CD1C+ cDCs, cluster DC2 (CD1C_A) and cluster DC3 (CD1C_B); a cluster corresponding to the poorly characterized CD141−CD1C− population, cluster DC4; and one cluster that does not correspond to any of the known blood DC subtypes, cluster DC5 (Fig. 1C; fig. S1).
We identified 242 genes [area under curve (AUC) ≥ 0.85] that best classified cells into these six putative cell populations (Fig. 1D and fig. S2A; see tables S1 and S2 for a list of markers, including surface markers). Although cluster DC1 mapped most closely to CD141+ DCs, this commonly used CD141 (THBD/BDCA-3+) marker was a poor discriminator for this cluster, being also expressed by cells captured in clusters DC5 and DC6 (pDCs) (fig. S2B). Because CLEC9A appeared to be a perfect discriminative surface marker for the DC1 cluster, we refer to this subset henceforth as CLEC9A+ DCs. Clusters DC2 and DC3 mapped to CD1C+ DCs. CD1C was the best and sole marker uniquely shared by both clusters. The DC4 cluster mapped to the CD141−CD1C− population and was accurately delineated by FCGR3A/CD16. The DC5 cluster was best defined by the surface markers AXL and SIGLEC6. Finally, the DC6 cluster mapped to pDCs. However, several markers commonly used to identify pDCs (e.g. IL3RA/CD123, CLEC4C/CD303) were also expressed in the population defined by the DC5 cluster, leading us to define a new combination of markers that distinguish pDCs from the DC5 population. Altogether, we identified sets of discriminative markers that can be used in combination to isolate cell populations corresponding to known DC subsets (but with higher purity) as well as to previously uncharacterized subsets.
Two subpopulations within CD1C+ DCs
The CD1C+ DCs were distributed across two clusters with similar numbers of cells, which we termed CD1C_A (cluster DC2) and CD1C_B (cluster DC3). Comparing the two clusters, the CD1C_B cells were distinguished by their expression of a strong unique signature that includes acute and chronic inflammatory genes (12–14) such as CD14, S100A9 and S100A8, whereas CD1C_A cells were marked only by slightly higher levels of MHC class II genes (Fig. 2A and table S3).
Figure 2. Definition and validation of CD1C+ DC subsets.
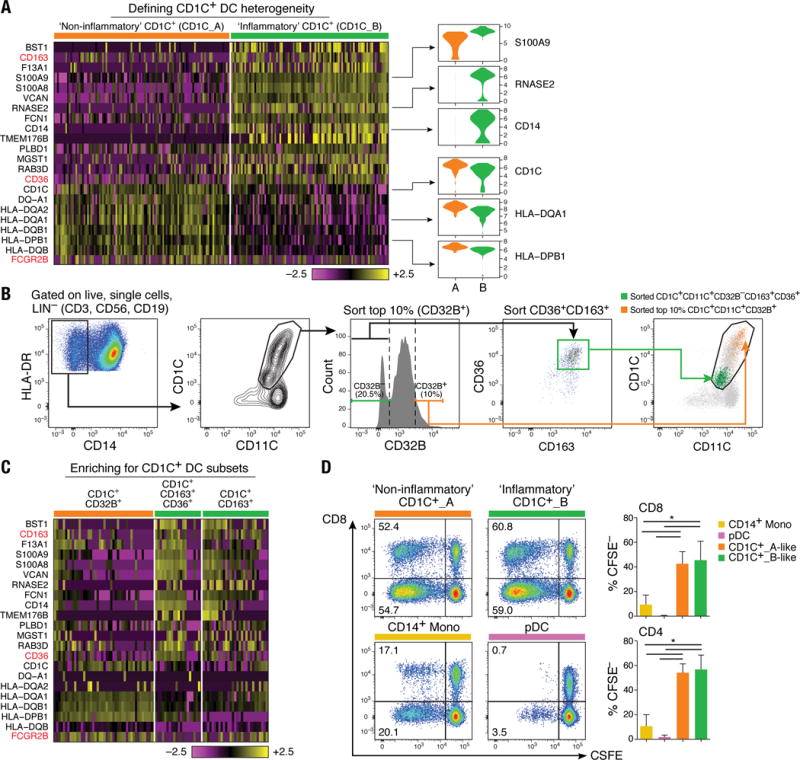
(A) Heatmap showing scaled expression (log TPM values) of discriminative gene sets defining each CD1C+ DC subset with AUC cutoff ≥ 0.75. Color scheme is based on z-score distribution, from −2.5 (purple) to 2.5 (yellow). Violin plots illustrate expression distribution of candidate genes across subsets on the x-axis (orange for CD1C_A/DC2; green for CD1C_B/DC3). In red are three markers used for subsequent enrichment strategy: CD163, CD36 and FCGR2B/CD32B (AUC =0.63). (B) Enrichment gating strategy of CD1C+ DC subsets [LIN(CD3, CD19, CD56)−HLA-DR+CD14−CD1C+CD11C+]. The CD1C_A/DC2 subset was further enriched by sorting on the 10% brightest CD32B+ cells (orange gate); the CD1C_B/DC3 subset was enriched by sorting on CD32B−CD163+CD36+ cells (green gate) or on CD32B−CD163+. Right: Overlay of the two sorted CD1C+ DC populations; 47 single cells were sorted from the green and orange gates in a 96-well plate for profiling. (C) Heatmap reporting scaled expression (log TPM values) of scRNAseq data from three cell subsets defined by CD1C+CD32B+, CD1C+CD36+CD163+, and CD1C+CD163+. Either CD1C+CD36+CD163+ or CD1C+CD163+ population recapitulated the CD1C_B/DC3 signature. (D) Proliferation of allogeneic CD4+ and CD8+ T cells 5 days after co-culture with CD14+ monocytes, pDCs, CD1C_A/DC2 DCs (CD1C+CD32B+), and CD1C_B DC3 (CD1C+CD163+). Left: Representative pseudocolor dot plot. Right: Bar graphs of composite data (n=3, mean ± SEM, *P<0.05, paired t-test).
We validated the presence of the two populations by prospective isolation based on newly identified markers, followed by scRNA-seq. To isolate these cells by flow sorting, we developed a panel incorporating surface markers derived from the set of uniquely expressed genes: FCGR2B/CD32B for CD1C_A, and CD163 and CD36 for CD1C_B subsets (Fig. 2B). scRNA-seq of prospectively isolated cells from each subset recapitulated the original split observed in CD1C+ DCs (Fig. 2C). Unlike monocytes and pDCs, both CD1C_A and CD1C_B subsets (isolated with the newly identified markers) were potent stimulators of naïve T cell proliferation (P < 0.05, paired t test), consistent with the known functional characteristics of cDCs (Fig. 2D). Activation of both CD1C subsets with lipopolysaccharide (LPS), R848 (a TLR7/TLR8 agonist), and polyinosine-polycytidine [poly(I:C)] highlighted functional differences between these subsets (fig. S3 and table S4), with CD1C_A secreting higher levels of the immune mediators CCL19, interleukin-10 (IL-10), IL-12B, and IL-18. Thus, scRNA-seq revealed unappreciated heterogeneity in this particular subset, leading to new hypotheses about the functions of CD1C+ DCs.
Discovering monocyte subsets and their relationships to DC subsets
Some key genes known to be associated with monocytes were also expressed by CD1C_B (cluster DC3) and CD141−CD1C− (cluster DC4) cells (e.g., CD14 and FCGR3A/CD16, respectively). To analyze the relationships between monocytes and DCs cells, we profiled 372 single blood monocytes (Fig. 1A and Fig. 3A). On the basis of 339 monocytes that passed QC, we identified four clusters (Fig. 3B and fig. S4A) distinguished by 102 classifier genes (AUC ≥0.85; Fig. 3C, fig. S4B, and table S5) upon analyzing them with the DC single cell data. The two largest clusters, Mono1 and Mono2, contained the CD14++CD16− (“classical”) and CD14+CD16++ (“non-classical”) monocytes, respectively. However, Mono1 and Mono2 also included 88 of the 124 cells derived from the “intermediate” monocyte gate (CD14++CD16+) (fig. S4A), demonstrating that the intermediate monocytes do not form a homogeneous population. The two smaller clusters, Mono3 and Mono4, contained 40 of the 124 intermediate cells and expressed many of the Mono1 (classical monocyte) signature genes. Mono3 expresses a unique combination of genes that have the potential to affect cell cycle, differentiation, and trafficking (e.g. MXD1, CXCR1, CXCR2, VNN2), whereas Mono4 distinctively expressed a cytotoxic gene signature (e.g. PRF1, GNLY, CTSW) resembling previously reported “natural killer dendritic cells,” in addition to co-expressing Mono1 gene set (15–17) (Fig. 3C and fig. S4B). We conclude that the previously defined classical and non-classical subtypes are contained in two distinct clusters (Mono1 and Mono2, respectively), but that the intermediate monocytes are far more heterogeneous than previously appreciated, being distributed across two known and two new clusters (fig. S4A).
Figure 3. Human blood monocyte heterogeneity.
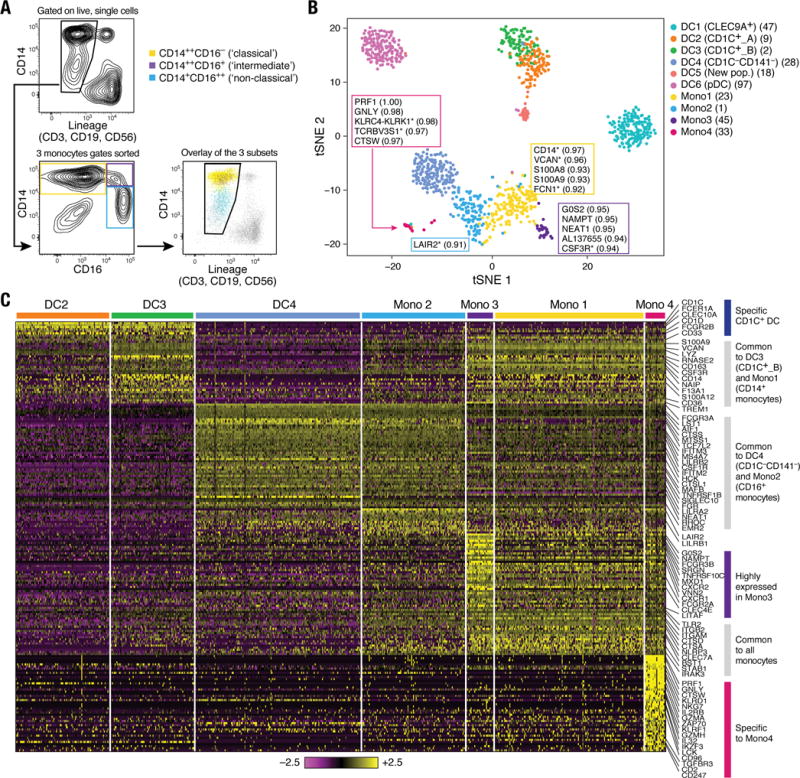
(A) Gating strategy for monocyte single cell sorting. Monocytes were enriched by first gating on LIN(CD3, CD19, CD56)−CD14+/lo, followed by three loose overlapping gates defined by relative expression of CD14 and CD16 for comprehensive sampling of CD14++CD16− (yellow), CD14++CD16+ (purple), and CD14+CD16++ (blue); 32 cells from each gate were sorted per 96-well plate profiled. Bottom right: Dot plot shows overlay of the sorted populations. (B) _t_-SNE analysis incorporating monocytes (_n_=337 successfully profiled) and DCs (_n_=742). Number of successfully profiled single monocytes per transcriptionally defined clusters includes Mono1 (_n_=148), Mono2 (_n_=137), Mono3 (_n_=31), and Mono4 (_n_=21). The number of discriminative genes with AUC cutoff ≥ 0.85 (combined analysis of DC and monocyte datasets) is reported in bracket next to cluster ID. Up to 5 top discriminators are listed next to each cluster; the number in bracket next to each gene refers to AUC value. Colors indicate unbiased DC and monocyte clustering from graph-based clustering. Each dot represents an individual cell. (C) Heatmap reporting scaled expression (log TPM values) of discriminative gene sets for each monocyte subsets with AUC cutoff ≥ 0.85 (see fig. S4B for detailed heatmap). Color scheme is based on _z_-score distribution, from −2.5 (purple) to 2.5 (yellow). Color bars in right margin highlight gene sets of interest.
All monocyte subtypes shared a signature that distinguishes them collectively from CD1C+ DC (cluster DC2 and DC3), CLEC9A+ DC (cluster DC1), and pDC (cluster DC6) populations (e.g., ITGAM/CD11B, ITGB2/CD18, TLR2, and CLEC7A) (Fig. 3, B and C, and fig. S4B). Thus, despite co-expressing genes such as CD14 and S100A8, Mono1 and CD1C_B/DC3 cells were part of distinct clusters (Fig. 3B and C). CD1C+ DCs (DC2 and DC3) expressed unique markers (e.g. CD1C, CLEC10A, FCER1A, FCGR2B, and CD1D) enriched for antigen processing (P < 2.66 × 10⁻¹⁰), MHC II (P < 1.79 × 10⁻⁸), and leukocyte activation (P < 1.14 × 10⁻⁶) gene ontology (GO) terms (Fig. 3C and table S6) (6). In contrast, Mono1 cells were enriched for defense response (P < 2.15 × 10⁻¹⁴), inflammatory response (P < 9.59 × 10⁻¹⁴), and chemotaxis (P < 6.77 × 10⁻¹⁰) genes.
Finally, we interrogated the relationship between CD16-expressing CD141−CD1C− cells (cluster DC4) and CD16+ monocytes (cluster Mono2). Although the two populations shared many genes (e.g., FCGR3A), they formed distinct clusters (Fig. 3B) defined by a unique discriminative gene set (Fig. 3C and tables S7 and S8). DC4 cells were enriched for type I interferon signaling pathway (P < 1.53 × 10⁻¹³) and response to virus (P < 4.77 × 10⁻⁹) GO terms, whereas Mono2 cells were enriched for immune system process (P < 1.09 × 10⁻¹⁴) and leukocyte migration (P < 3.57 × 10⁻⁸) GO terms. Although we conclude that monocytes and DCs are distinct from each other in the steady state, our data do not address potential interconversion between cell fates or distinct ontogeny.
AXL+SIGLEC6+ population and its relation to cDCs and pDCs
As described above, a population emerged from the unbiased cluster analysis (cluster DC5; Fig. 1), defined by co-expression of unique markers (e.g., AXL, SIGLEC1, SIGLEC6, and CD22/SIGLEC2_)_ (Fig. 4A, fig. S5A and tables S1–S2). Flow cytometry analysis of peripheral blood mononuclear cells (PBMCs) from 10 independent donors confirmed the existence of AXL+SIGLEC6+ cells (“AS DCs”) within the original DC gate (Fig. 4B) at a frequency of 2 to 3%, consistent with what was originally observed in the initial scRNA-seq analysis (30 of 768 DCs; Fig. 1C). scRNA-seq profiling of prospectively sorted AS DCs (isolated with the gating strategy in Fig. 4B) showed that the newly sorted cells clustered together with the original cluster (Fig.4C and fig. S5B), validating our enrichment strategy.
Figure 4. Identification of AXL+SIGLEC6+ DCs (AS DCs).
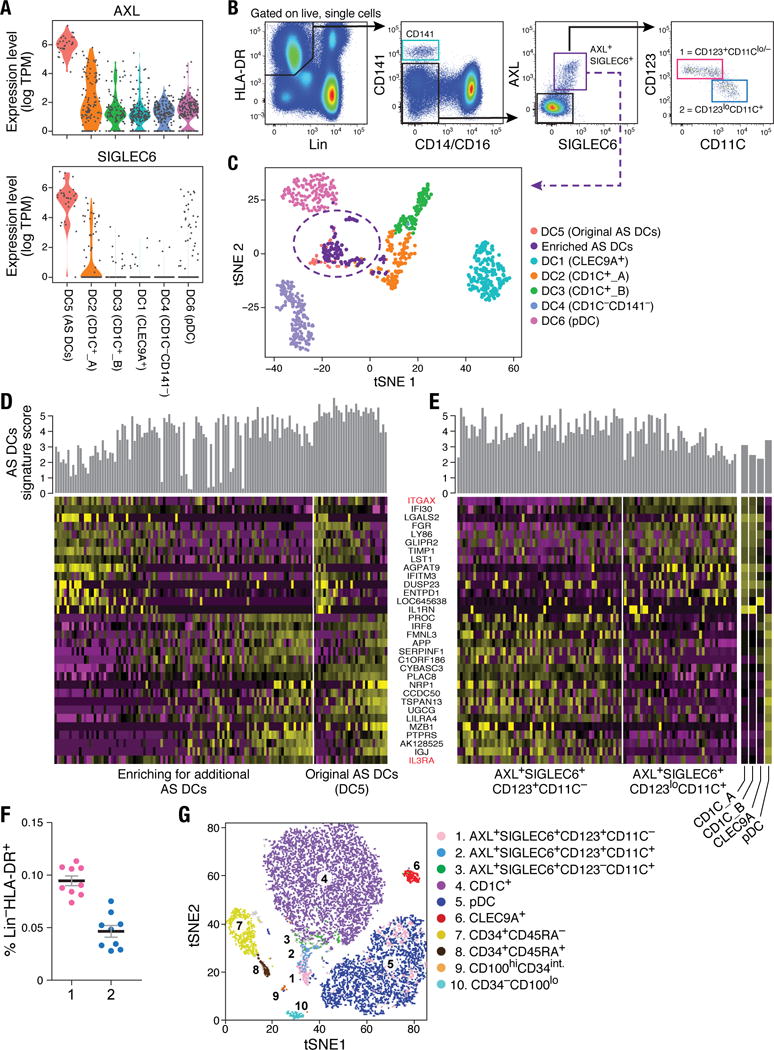
(A) Violin plots showing expression distribution of surface markers AXL and SIGLEC6. Other populations are depicted on the x axis; each dot represents an individual cell. (B) Flow cytometry gating strategy to identify AXL+SIGLEC6+ cells within human blood LIN(CD3, CD19, CD20, CD161)− and HLA-DR+ mononuclear fraction. AXL+SIGLEC6+ cells were further distinguished by the relative expression of IL3RA/CD123 and ITGAX/CD11C [1 = CD123+CD11c−/lo (pink); 2 = CD123loCD11c+ (blue)]. Data shown are a representative analysis of 10 healthy individuals. (C) _t_-SNE analysis of all DCs (_n_=742), along with prospectively profiled AXL+SIGLEC6+ single cells (_n_=105), using gating strategy in (B) (sorted from purple gate). Newly isolated AS DCs overlap with the originally identified DC5 cluster (_n_=30), indicated by purple dashed circle. (D) Heatmap reporting scaled expression (log TPM values) of discriminative gene sets (AUC cutoff ≥ 0.75), highlighting the expression continuum of AS DCs. Top bar graph defines the AS DCs population purity score based on the top 10 most discriminative genes (i.e., AXL, PPP1R14A, SIGLEC6, CD22, DAB2, S100A10, FAM105A, MED12L, ALDH2, and LTK). (E) Heatmap reporting scaled expression (log TPM values) of prospectively enriched AS DCs populations (_n_=90) isolated by relative ITGAX/CD11C and IL3RA/CD123 expression levels [red in (**D)**]; 43 single AXL+SIGLEC6+CD11C− [pink gate in (B)] and 47 single AXL+SIGLEC6+CD11C+ [blue gate in (B)] were sequenced. The average expression values of the original CD1C+ (combined DC2 and DC3), CD141+/CLEC9A+ (DC1) and pDC (DC6) single cells were used as reference to highlight enrichment of cDC-like and pDC-like gene sets. Top bar graph represents AS DC purity score. (F) Frequency (% mean ±SEM) of AXL+SIGLEC6+CD123+CD11C−/lo [population 1 (pink): 0.1 ± 0.014] and AXL+SIGLEC6+CD123loCD11C+ [population 2 (blue): 0.04 ± 0.01] as a percentage of LIN(CD3, CD19, CD20, CD161)−HLA-DR+ PBMCs. Scatter plot includes data from nine healthy individuals. (G) _t_-SNE analysis of flow cytometry data for LIN(CD3,CD19,CD20,CD161)−HLA-DR+CD14−CD16− PBMCs based on the protein expression levels of AXL, SIGLEC6, CD1C, CD11C, CD22, CD33, CD34, CD45RA, CD100, CD123, CD303 and HLA-DR (see Fig. 6 for CD100hiCD34int population). Overlay of populations defined by conventional flow cytometry gating on clusters derived by _t_-SNE analysis shown in the legend.
AS DCs exhibited a spectrum of states based on gene expression (Fig. 4D) defined by cells enriched for a pDC-like signature (e.g., IL3RA, IGJ, NRP1, MZB1) and cells enriched for a cDC-like signature (IFI30, ITGAX, LY86, GLIPR2, FGR, LYZ, ENTPD1). We validated this observation by flow cytometry, using the surface markers IL3RA/CD123 and ITGAX/CD11C that respectively correlated with pDC and cDC gene signatures (Fig. 4, B and D). We exploited the combinatorial expression of AXL, SIGLEC6, CD123 and CD11C (at both mRNA and protein levels) to prospectively isolate the ends of this spectrum representing two putative AS DC subtypes (see gating strategy in Fig. 4B), and further validated their identities by scRNA-seq (Fig. 4E and fig. S5, C to F). Across all 10 individuals tested, the two AS DC subpopulations represented a very small fraction of the Lin−HLA-DR+ populations (Fig. 4F). Notably, lower levels of AXL and SIGLEC6 protein were associated with increased HLA-DR, CD11C and CD1C, whereas higher levels of AXL and SIGLEC6 were associated with increased CD123, CD303, and CD141 and decreased HLA-DR (fig. S5, C to J). This latter relationship was also observed by _t_-SNE analysis of flow cytometry data, where a peninsula with graded expression of AS DCs was located at the base of the CD1C+ DC cluster and adjacent to the pDC cluster (Fig. 4G). Trajectory mapping of these cells across different levels of the surface markers CD123 and CD11C further indicated that AS DCs form a continuum from a pDC transcriptional state to a CD1C+ DC transcriptional state (fig. S5, C to F). Taken together, our data suggest that AXL+SIGLEC6+ DCs are related but not identical to cDCs or pDCs.
pDCs are phenotypically and functionally distinct from CD123+CD11C− AS DCs
Because pDCs and AXL+SIGLEC6+CD123+CD11C−/lo DCs shared expression of many genes (Fig. 4, D and E, and fig. S6A), we assessed whether these cell types also shared functional properties. We found that the genes specifically expressed by pDCs, but not by AS DCs, were associated with the known biological properties of pDCs. This includes, for example, genes associated with pathogen sensing and induction of type I interferons (IRF7, TLR7, SLC15A4, and PACSIN1), secretion (e.g. DERL3, LAMP5, and SCAMP5), and the pDC master regulator transcription factor TCF4, along with its binding targets (e.g. SLA2, PTCRA, PTPRCAP) (Fig. 5A and fig. S6A) (18–19). In contrast, CD123+CD11C−/lo AS DCs expressed cDC markers, including CD2, CX3CR1, CD33/SIGLEC3, CD5, and SIGLEC1/CD169, both at protein and mRNA levels (Fig. 5A and fig. S6, A to C). pDCs were also morphologically distinct from AS DCs. Both AS DC subsets possessed the same cerebriform nucleus and cytoplasmic features of cDCs (Fig. 5B). We hypothesized that although CD123+CD11C−/lo AS DCs expressed pDC markers, including IL3RA/CD123 and CLEC4C/CD303 (fig. S5, G to J), they are functionally distinct from pDCs.
Figure 5. Phenotypic and functional characterization of AS DCs and “pure” pDCs.
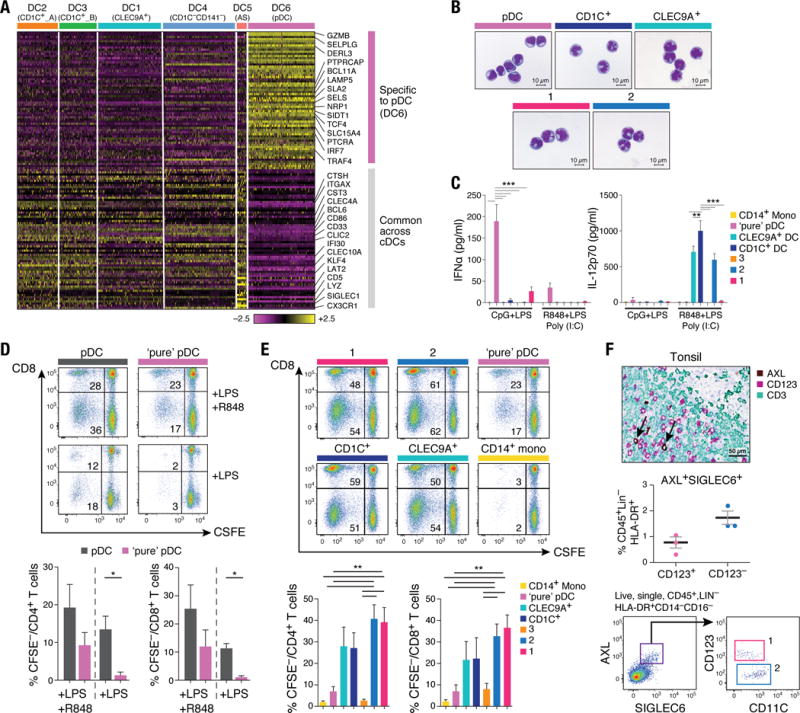
(A) Heatmap reporting scaled expression (log TPM values) of gene sets common between AS DCs (DC5) and cDCs (clusters DC1 to DC4), and genes uniquely expressed in pDCs (DC6). Gene sets were generated through K-means clustering using the doKmeans function in the Seurat package. (B) Morphology of pDCs, CD1C+ DCs, CLEC9A+ DCs, AXL+SIGLEC6+CD123+CD11C−/lo and AXL+SIGLEC6+CD123loCD11C+ by Giemsa-Wright stain. Scale bar, 10μm. (C) IFNα (left panel) and IL-12p70 (right panel) concentration in culture supernatant 24 hours after CpG and LPS stimulation (_n_=8) or after LPS, R848 and poly(I:C) stimulation (_n_=4) of CD14++CD16− monocytes, pDCs, CLEC9A+ DCs, CD1C+ DCs, AXL+SIGLEC6+CD123+CD11C−/lo (1, pink), AXL+SIGLEC6+CD123loCD11C+ (2, blue), and CD100hiCD34int cells (3, beige). Composite data from four to eight donors is shown (mean ±SEM; **P<0.01, *** P<0.001, Mann-Whitney U test). (D) Proliferation of allogeneic CD4+ and CD8+ T cells 5 days after co-culture with pDCs contaminated with AXL+SIGLEC6+ cells compared with pDCs devoid of AXL+SIGLEC6+cells, in the context of LPS or LPS+R848 stimulation. Top: Representative pseudocolor dot plot. Bottom: Bar graphs of composite data (_n_=4, mean ± SEM, *P<0.05, paired t-test). (E) Proliferation of allogeneic CD4+ and CD8+ T cells 5 days after co-culture with CD14++CD16− monocytes, pDCs, CLEC9A+ DCs, CD1C+ DCs, AXL+SIGLEC6+CD123+CD11C−/lo (1, pink), AXL+SIGLEC6+CD123loCD11C+ (2, blue) cells, and CD100hiCD34int (3, beige) cells. Top: Representative pseudocolor dot plot. Bottom: Bar graphs of composite data (_n_=7, mean ±SEM, **P<0.01, paired t-test). (F) Top: Immunohistochemical staining of human tonsil with AXL (brown), CD123 (purple) and CD3 (green). Brown arrows depict AXL+CD123+ cells adjacent to CD3+ T cells. Data shown are representative of four donors. Scale bar, 50μm. Middle: Frequency of AXL+SIGLEC6+CD123+ and CD123lo/− cells in human tonsil determined by flow cytometry analysis, as a percentage of CD45+LIN(CD3,CD19,CD20,CD56,CD161)−HLA-DR+ cells (mean ± SEM of three donors shown; AXL+SIGLEC6+CD123+, 0.7 ± 0.2%; AXL+SIGLEC6+CD123lo/−, 1.7 ± 0.2%). Bottom: Representative pseudocolor dot plot of AXL+SIGLEC6+CD123+ (pop. 1, pink) and AXL+SIGLEC6+CD123lo/− (pop. 2, blue) cells in human tonsil by flow cytometry analysis (_n_=3).
To compare the functional properties of “pure” pDCs to AS DCs and cDCs, we used the markers identified in our study to isolate pure pDCs by excluding AS DCs, CLEC9A+ DCs, CD1C+ DCs and monocytes by FACS. As expected, pure pDCs produced their hallmark cytokine, interferon-α (IFN-α), while AS DCs produced negligible amounts of IFN-α upon Toll-like receptor 9 (TLR9) stimulation (P < 0.001; Fig. 5C). In contrast, the CD123loCD11C+ AS DC subset secreted IL-12p70 at similar levels to other cDCs, while pure pDCs and CD123hiCD11C−/lo AS DCs did not produce IL-12p70 (P < 0.01; Fig. 5C). Other factors, such as IL-8, were produced at high levels by the CD123+CD11C−/lo AS DC subset but not by pDC (P < 0.001; fig. S6D). Finally, pure pDCs induced undetectable or low levels of T cell proliferation in response to LPS or LPS+R848 stimulation, respectively (P < 0.05; Fig. 5D). We conclude that “pure” IFN-α-producing pDCs (depleted of AS DCs) do not upregulate CD86 (fig. S6, C and E), are diminished in their ability to induce T cell proliferation, and that contamination of AS DCs within the traditionally defined pDC gate is likely responsible for T cell stimulation activities measured in prior reports (18–20).
AS DCs stimulate T cell proliferation and are present in tonsils
Because AS DCs expressed the costimulatory CD86 and components of antigen presentation, we hypothesized that they could stimulate T cell proliferation (fig. S6, A, C, and E). Strikingly, both AS DC subtypes were potent stimulators of allogeneic CD4+ and CD8+ T cell proliferation, unlike pDCs (P < 0.01), and were marginally superior to CD1C+ and CLEC9A+ DCs (Fig. 5E).
Similar to other DCs, AS DCs expressed CLA and CD62L but not CCR7 protein (fig. S6F), suggesting potential homing to peripheral tissue such as skin and lymph node from the circulation. Because CD123+ pDCs were observed in the T cell area of the human tonsil (21), we evaluated whether CD123+ AS DCs were also present by staining human tonsils with antibodies to CD123 and AXL. We found AS DCs adjacent to CD3+ T cells, admixed with CD123+AXL− pDCs (Fig. 5F). Flow cytometry confirmed this finding, showing that the CD123+CD11C−/lo AS DCs represented 0.7% and CD123−CD11C+ AS DCs represented 1.7% of the CD45+LIN−HLA-DR+ fraction (Fig. 5F). Thus, AS DCs are able to stimulate T cells and are present in the T cell zones of tonsils.
Identification of circulating CD100hiCD34int cDC progenitors
Finally, we interrogated CD11C−CD123− cells within the HLA-DR+CD14− gate used for isolating DCs that were not considered in the initial analysis because they were not previously thought to include DCs (red dashed gate in Fig. 1B and updated gate in Fig. 6A used for these experiments). Analysis of CD11C−CD123− scRNA-seq data revealed six clusters in this gate (fig. S7, A and B). Cells in cluster 6 expressed genes associated with hematopoiesis, DC progenitors, and genes essential for DC development (e.g. SATB1, RUNX2, KIT, HLX, ID2) (22–25) and were marked by high expression of the cell surface protein SEMA4D (CD100). We therefore hypothesized that cluster 6 could represent a progenitor population.
Figure 6. Identification and characterization of circulating CD100hiCD34int cDC progenitor.
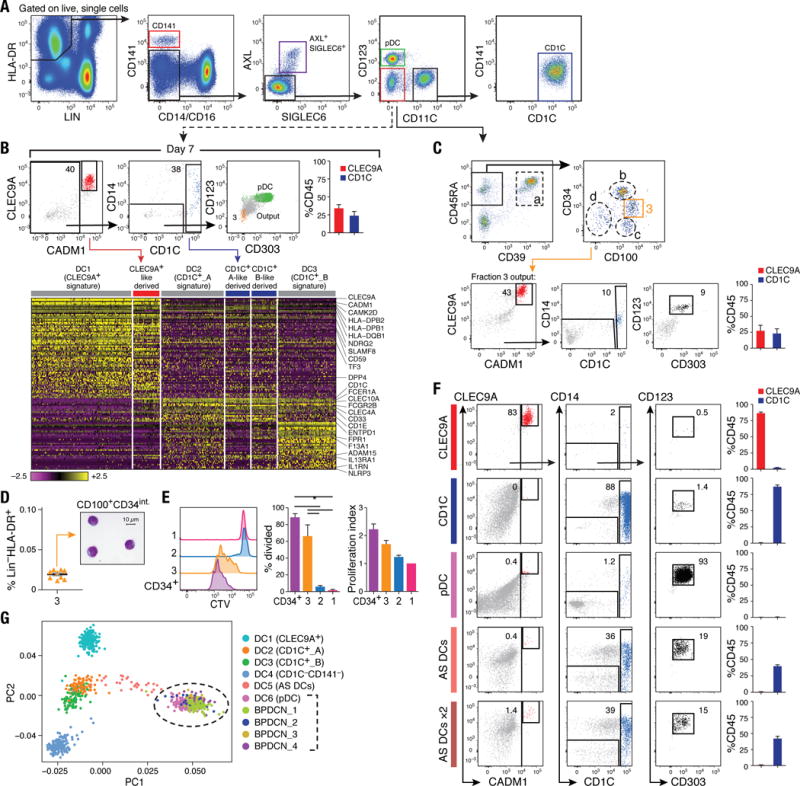
(A) Flow cytometry gating strategy to isolate DC subsets: CLEC9A+ DCs (red), CD1C+ DCs (blue), pDCs (green), AXL+SIGLEC6+ cells (purple), and CD123−CD11C− cells (red) for differentiation assays. Data shown are a representative analysis of at least 10 healthy individuals. (B) Differentiation assay readout (flow cytometry for CLEC9A+ DCs, CD1C+ DCs and pDC; scRNA-seq profiling of CD45+ cells) after 7 days of co-culturing LIN(CD3,CD19,CD20,CD161)−HLA-DR+CD14−CD16−AXL−SIGLEC6−CD123−CD11C− cells on MS5 stromal cell line supplemented with GM-CSF, SCF and FLT3LG. Top: Representative overlay dot plots. Overlay of pDC (green) and output cells (gray) for CD123 and CD303 expression is shown at far right (in green). Population 3 (in beige) represents CD100hiCD34int at day 0. Top right: Composite bar graphs for CLEC9A+ and CD1C+ DCs differentiated from culture by flow cytometry analysis (_n_=4, mean ± SEM). Heatmap in bottom panel reports scaled expression (log TPM values) signature from culture output by scRNA-seq (_n_=132), confirming differentiated CLEC9A+ (red) and CD1C+ (blue) DC transcriptional identities. Original transcriptional signatures from DC1 (CD141+/CLEC9A+ DC), DC2 (CD1C_A subset), and DC3 (CD1C_B subset) clusters are used as reference set. (C) Top: Flow cytometry gating strategy used to identify the CD100hiCD34int subset. All cell fractions in dashed gate were tested for differentiation potential (see fig. S7, A to F). Bottom: Output from CD100hiCD34int fraction (population 3, beige gate). (D) Frequency of CD100hiCD34int subset as of LIN(CD3,CD19,CD20,CD161)−HLA-DR+ PBMCs (_n_=9 healthy donors). Morphology of CD100hiCD34int cell by Giemsa-Wright stain. Scale bar, 10μm. (E) Proliferative capacity of peripheral blood Cell Trace Violet (CTV)-labeled CD34+ HSCs (purple), CD100hiCD34int (3, beige), AXL+SIGLEC6+CD123+CD11C−/lo (1, pink), and AXL+SIGLEC6+CD123loCD11C+ (2, blue), as measured by CTV dilution after 5 days in culture on MS5 stromal cell line supplemented with GM-CSF, SCF and FLT3LG. Left: Representative overlay histogram. Right: Composite bar graphs illustrating percentage of proliferated cells and number of proliferations undergone from three donors shown (*P<0.05, paired t-test). (F) Output from differentiation assays seeded with CLEC9A+ DCs, CD1C+ DCs, pDCs, and AXL+SIGLEC6+cells isolated using gating strategy in (A). AXL+SIGLEC6+x2 = double FLT3L concentration. Also shown in (C) and (F) are representative culture outputs on day 7 and composite bar graphs (mean ± SEM; _n_=6 donors). (G) PCA analysis incorporating monocytes (_n_=339), DCs (_n_=742), and four BPDCN patient samples (_n_=174) using the R software package Seurat. PC1 versus PC2 demonstrates the close transcriptional proximity between all four BPDCN samples and pDCs (dashed black circle); black bracket indicates overlapping cells. PC1 and PC2 variance is 3.8%. Each dot represents an individual cell; colored legend for each subset is shown at the right.
To assess the progenitor potential of this compartment, we cultured FACS-purified CD11C−CD123− cells with MS5 stromal cells and cytokines that induce DC differentiation (6), based on a published human DC progenitor differentiation assay (26). After several days in culture, the cells were evaluated by flow cytometry, using a panel of antibodies that identify pDCs and CD1C+ and CLEC9A+ DCs (6), and by scRNA-Seq profiling of CD45+ immune cells for a more comprehensive assessment. For comparison, under the same conditions, we monitored the differentiation potential of isolated pDCs, CD1C+ and CLEC9A+ DCs, and AS DC subtypes (see fig. S7, C and D).
After 7 days of culture, cells isolated from the CD11C−CD123− gate gave rise to CLEC9A+ and CD1C+ DCs but not pDCs, according to flow cytometry and scRNA-seq analyses (Fig. 6B). We narrowed down the search for the progenitor cells to the CD45RA+CD39−CD100+ pool of cells based on the unique cluster-6 marker CD100/SEMA4D (fig. S7B), along with candidate markers that we tested [based on DC progenitors in the bone marrow (CD45RA) and tissue DC (CD39) markers] (Fig. 6C, fig. S5J, fig. S6, B and F, and fig. S7, B to H). After iteratively testing each sorted population for differentiation potential, we discovered that only the CD100hiCD34int cells generated CLEC9A+ and CD1C+ DCs (Fig. 6C and fig. S7F). scRNA-seq of CD100hiCD34int cells mapped these cells to the original cluster 6, including the expression of the same DC differentiation and progenitor function genes (fig. S7B).
We validated the existence of CD100hiCD34int progenitors in 10 individuals, with a frequency of ~0.02% of the LIN−HLA-DR+ fraction of PBMCs (Fig. 6D). These cells were morphologically primitive, possessing high nuclear-to-cytoplasmic ratio and circular or indented nuclei (Fig. 6D), in contrast to AS DCs, pDCs, and CD1C+ and CLEC9A+ DCs (Fig. 5B). Although CD100hiCD34int cells expressed HLA-DR and low levels of the costimulatory molecule CD86 (fig. S6E) and lymph node homing gene CCR7 (Fig. S7, B and H), they had low T cell stimulatory potential (Fig. 5, C and E), which suggests that these cells are not functional cDCs. Furthermore, CD100hiCD34int cells retained significant proliferative capacity (P < 0.05; Fig. 6E), in accordance with their primitive morphology, phenotype and expression profile. Although CD100hiCD34int cells were KIT/CD117+CD45RA+ and CSF1R/CD115−, CD1C−, CD141−, CD123− – a profile similar to that of a previously reported circulating human DC progenitor (24, 27, 28) – they differ from the published progenitor in having a more primitive morphology and lacking CSF2R/CD116 and FLT3/CD135 expression (fig. S7, G and H).
Differentiation potential of AS DCs
When we seeded cultures with pDCs and CD1C+ and CLEC9A+ DCs, we found that they generally retained the same phenotype throughout the differentiation assay (Fig. 6F and fig. S7, I and J). Upon observing a gene expression spectrum of AS DC states that includes pDC-like and CD1C+-like DC signatures (fig. S5, C to F), we also seeded AS DCs to assess their potential to transition towards other DC subsets [ensuring no contamination with CD1C+ and CLEC9A+ DCs (fig. S7I and J)]. After 7 days in culture, we observed cells with high levels of CD1C (_n_=6 donors) and rare cells with surface CLEC9A and CADM1expression (Fig. 6F), irrespective of the FLT3L concentration used (Fig. 6F) or whether the culture was seeded with either of the two AS DC subpopulations representing both ends of the spectrum (fig. S7K). Notably, both AS DCs at day 0 and the cells differentiated from AS DC did not express BATF3 (a transcription factor required for terminal differentiation of CLEC9A+ DCs), CADM1 or XCR1, which are key CLEC9A+ DC discriminative markers (table S2) (23, 29–33) (fig. S5, D and E).
We found that AS DCs did not divide during the transition into CD1C+ DCs, in contrast to CD100hiCD34int cells that divided and differentiated into CD1C+ as well as CLEC9A+ DCs. Furthermore, CD100hiCD34int differentiation into CD1C+ DCs is not likely to transition through AS DCs, because CD100hiCD34int did not express AXL or SIGLEC6 genes at day 0 or during differentiation. AS DCs are thus functional cDCs that exist in a continuum of states in vivo (fig. S5, C to F), with the potential to transition toward CD1C+ DCs.
Mapping malignant cells from patients to the healthy DC atlas
We leveraged our human DC atlas to compare pathogenic cells driving blastic plasmacytoid dendritic cell neoplasm (BPDCN), a rare and aggressive hematological malignancy previously known as NK cell leukemia/lymphoma (34, 35), to healthy DC populations. Because the ontogeny of these cells remains unclear (34–38), we performed scRNA-seq on CD45+HLA-DR+CD123+ blasts from four BPDCN patients (n = 174 cells) (6). The first principal component highlighted gene sets clustering all four patients together with healthy blood pDCs (Fig. 6G). Analysis of BPDCN samples together with healthy DCs showed highest overlap with pDC and AS DC gene expression signatures (fig. S8A). Because pure pDC and AS DC subsets co-express many genes yet have distinct biological functions (Figs. 4 and 5), we further analyzed the genes overlapping among BPDCN, pure pDCs, and cDCs (fig. S8B). Despite sharing some pDC genes (e.g., NRP1, IL3RA, DERL3, LAMP5, PTCRA and PTPRCAP), several key genes essential for pDC function were missing or were expressed only slightly in patient cells (e.g. GZMB, IRF7, CLEC4C/CD303, IRF4, and SLC15A4; fig. S8B). Only a small number of cDC genes were expressed in patient cells, including SIGLEC6, LTK, FCER1A, CD59, CADM1, and TMEM14A. Note that all four patient samples shared a set of discriminative genes (fig. S8B and table S9) that included several genes expressed in B cells (e.g. FCRLA, IGLL1, TCL1A, and IGLL5; fig. S8C) or with hematopoietic progenitors (e.g. SOX4 and CLEC11A). Collectively, our analysis suggests that although BPDCN malignant cells express some key B cell markers, they are most closely related to pDCs.
Discussion
DCs and monocytes are defined according to a combination of molecular markers, functional properties and ontogeny (39). However, it remains unclear whether the expression of existing markers tracks with the more complex internal states of cells. To address this question, we determined the states of blood DC/monocytes through comprehensive profiling of gene expression at single cell resolution, empirically inferred cell subtypes, identified optimal surface markers for purifying the hypothesized cell subtypes, and showed that prospectively purified cell types corresponded to inferred subtypes based on scRNA-seq. Our study has generated a more accurate taxonomy that includes six DC subtypes and four monocyte subtypes, as well as a circulating, dividing progenitor of cDCs.
Previous studies classified human blood DCs into one pDC and two cDC populations. Our study identifies six DC populations: DC1 corresponds to the cross-presenting CD141/BDCA-3_+_ cDC1, which is best marked by CLEC9A; DC2 and DC3 correspond to new subdivisions of the CD1C/BDCA-1+ cDC2; DC4 corresponds to CD1C−CD141−CD11C+ DC, which is best marked by CD16 and shares signatures with monocytes; DC5 is a unique DC subtype, AS DCs; and DC6 corresponds to the interferon-producing pDC, purer than previously identified pDC population defined by standard markers (e.g., CD123, CD303/BDCA-2+) and contaminated with AS DCs. In the process of addressing how DCs resemble monocytes, we also identified four monocyte subtypes: the two known ones, as well as two new ones that have not been functionally characterized. Although DC2/3 and DC4 shared an expression signature with monocytes, our data do not suggest how they acquired these shared modules (e.g., common precursor, interconversion or independent convergence). Finally, we derived specific expression signatures for each DC and monocyte subtype, including transcription factors, cytokines, and cytokine receptors (fig. S9, A to F; table S10), providing a resource for further understanding of subtype functions and ontogeny.
The CD1C/BDCA-1+ DC subdivision (DC2 and DC3) is further supported by parallel observations in their murine CD11b+ DC homologs (40–43), which comprise an Esamlo subset with higher expression of myeloid genes such as CD14 and potent cytokine production, and an Esamhi subset with better MHC class II-dependent priming of CD4+ T cells (40–41).
AS DCs, which were found within the pDC gate, formed a continuum between pDC and CD1C+ DCs (fig. S5, C to F). Consistent with this observation, AS DCs were able to transition towards the CD1C+ DC state in vitro (with <1% of differentiated AS DCs phenotypically resembling CLEC9A+ DCs, which could be contaminants). However, because AS DCs (at both ends of the continuum) morphologically resemble cDCs and are able to stimulate T cell proliferation, yet do not proliferate themselves, they seem less likely to serve as a progenitor that generates cDCs and are more likely to be a functional DC variant that can be modulated to resemble CD1C+ DCs. Although AS DCs most closely resemble CD1C+ cDCs in basic functional properties and expression signatures, they are likely to have distinct functions because they localize to the T cell zone of tonsils and express several lectins, which recognize diverse glycans, and AXL, which interacts with apoptotic cells and Zika virus (44–46).
An unresolved question concerns the importance of AS DCs sharing an expression signature with pDCs. Consistent with our findings that AS DCs are found in the traditional pDC flow cytometry gate, a recently described human CD2hi pDC subset (20) appears to correspond to AS DCs based on expression of CD2, AXL, CX3CR1, LYZ and CD86 (fig. S6C), localization to tonsils, and a similar ability to trigger naïve T cell proliferation. Furthermore, a murine study identified non-canonical CX3CR1+CD8α+ cDCs (nc-cDCs), which express pDC and cDC signatures (e.g., CX3CR1, CD11c and MHCII), do not produce IFN-α, and activate T cell proliferation (47–48). Interestingly, pDC and nc-cDCs require E2-2/TCF4 to develop, and reduced levels of E2-2 lead to higher ID2 and expression of cDC genes (18, 47, 48). Consistent with this finding, we observed E2-2/TCF4 expression in human pDCs (Fig. 5A), with decreasing levels of E2-2/TCF4 and increasing levels of ID2 as AS DCs transition to CD1C+ DCs (fig. S5, C to F). These findings suggest that AS DCs are similar to human CD2hi pDCs and murine nccDCs.
The discovery of AS DCs led us to update the strategy for isolating pDCs. When we removed AS DCs from pDCs isolated with standard markers (e.g. CD123 and CD303), the resulting pDCs were highly attenuated in their ability to induce T cell proliferation and produce T cell stimulatory ligands (e.g. IL-12), consistent with reports that found several markers splitting pDCs into those that stimulate or do not stimulate T cells (18, 20, 49–52). We thus propose that our purer pDC population corresponds more closely to the “natural interferon-producing cells (IPCs)” (21, 53). These cells also appear to share more properties with plasma B cells than DCs, as indicated by morphology, higher expression of endoplasmic reticulum secretory machinery, known rearrangement at the Ig (immunoglobulin) locus, and expression of B-cell related transcripts. We also found that BPDCN cells share the pDC signature as well as additional B cell genes (e.g. IGLL1, IGLL5 and TCL1A). We conclude that even though pure pDCs fall into the MHC II-expressing gate, they have markers, gene signatures, and functions distinct from those of cDCs.
In contrast to AS DCs, the CD100hiCD34int cells appear to be cDC progenitors, judging by their primitive morphology, absence of cDC functions and signatures, and potent ability to proliferate and generate a large and equal number of CD1C+ DCs and CLEC9A+ DCs within 7 days of culture. The recently identified human pre-cDC (24–28), which has proliferative capacity and differentiates into CD1C+ and CD141+ DCs, appears to have some functional and phenotypical similarities to our CD100hiCD34int progenitors, even though our cells appear to be morphologically more primitive and lack the expression of CD116 and CD135, which were previously reported as markers (24). Single cell profiling studies are needed to determine whether and how these precursors are related.
CD100hiCD34int cells also appear to be different from peripheral blood CD34hi HSCs. Culturing of CD100hiCD34int cells gives rise only to CLEC9A+ DCs and CD1C+ DCs (and no other cell types) in 7 days. In contrast, peripheral blood CD34hi HSCs under the same culture conditions for up to 14 days did not give rise to CLEC9A+ cDCs. Furthermore, CD100hiCD34int cells have a transcriptional signature distinct from that of blood CD34hi HSCs. Mapping CD100hiCD34int to other bone marrow progenitors may help to resolve the origin of these cells.
Our results have several implications. The discovery of several DC subsets will enable a more complete understanding of DCs in tissues, inflammation, and disease. Furthermore, the identification of circulating CD100hiCD34int progenitors provides a well-defined cell type for generating DCs in vitro and for therapeutic targeting. Our new strategy for isolating pure pDCs, combined with the knowledge that the functions of contaminating AS DCs were incorrectly attributed to pDCs, should lead to more definitive annotation of pDC functions with implications for their therapeutic application (54–56). More generally, our use of the DC atlas to understand BPDCN cells illustrates how single cell analysis can pinpoint relationships of diseased cells to healthy cells. Finally, some susceptibility genes identified in human genetics association studies are expressed in the DCs and monocytes subsets defined in this study, suggesting new potential roles in disease (fig. S10, A and B and table S11, A to C).
Using single-cell transcriptome profiling, we deconvoluted admixtures of cell types (e.g., pDCs, “intermediate” monocytes, cDC progenitors), revealed rare cell types (e.g., AS DCs) and elucidated complex relationships between cell types (e.g., spectrum of states for AS DCs) – thus addressing limitations in the existing classification that relies on a small number of markers (39). Nonetheless, some DC/monocyte subtypes were likely missed because they do not express MHC class II at rest, can only be defined by non-RNA molecules, are distinguished by low-abundance transcripts, or are only present during inflammation, disease or within tissues. To build a comprehensive immune cell atlas, future studies will need to address these challenges as well as localize these cell types within lymphoid and non-lymphoid tissues.
Materials and Methods
Study subjects
The study was performed in accordance with protocols approved by the institutional review board at Partners (Brigham and Women’s Hospital, Massachusetts General Hospital, Dana-Farber Cancer Institute; Boston, USA) and Broad Institute (USA), as well as the Newcastle upon Tyne Hospitals (UK) Research Ethics Committee. All patients provided written informed consent for the genetic research studies and molecular testing. Healthy donors were recruited from the Boston-based PhenoGenetic project, a resource of healthy subjects that are re-contactable by genotype (57), and the Newcastle community. Individuals were excluded if they had a history of cancer, allergies, inflammatory disease, autoimmune disease, chronic metabolic disorders or infectious disorders. All healthy donors were nonsmokers, had a normal BMI and normal blood pressure, and were between 25 and 40 years of age.
Cell isolation, flow cytometry staining, cell sorting, and analysis
For profiling of healthy cells, PBMCs were isolated from fresh blood within 2 hours of collection, using Ficoll-Paque density gradient centrifugation as previously described (58). Single-cell suspensions were stained per manufacturer recommendations with different panels of antibodies (table S12) designed to enrich for certain population for single-cell sorting and single-cell RNA-sequencing (scRNA-seq) (6). Flow cytometry and FACS-sorting of PBMC was performed on a BD Fortessa or BD FACS Fusion instrument, and data analyzed using FlowJo v10.1. Single-cells were sorted into 96-well full-skirted Eppendorf plates chilled to 4°C, pre-prepared with lysis buffer consisting of 10μl of TCL buffer (Qiagen) supplemented with 1% β-mercaptoethanol. Single-cell lysates were sealed, vortexed, spun down at 300 g at 4°C for 1 min, immediately placed on dry ice and transferred for storage at −80°C. Tonsil was mechanically disrupted to obtain single-cell suspension.
Single-cell RNA-sequencing
Smart-Seq2 protocol was performed on single sorted cells as described (7, 8), with some modifications (6). For DCs, a total of 8 × 96-well plates (768 single DCs) were initially profiled from the same blood draw and sort from the index volunteer and subsequent validation performed on an additional 10 healthy individuals. For monocytes, a total of four plates were profiled (372 single monocytes and 12 population samples). An additional 975 single cells were profiled to further characterize the CD1C+ DC subsets (_n_=125), AXL+SIGLEC6+ cells (_n_=372), CD11C−CD123− compartment at day 0 (_n_=164), differentiation assay outputs (_n_=218), CD100hiCD34int cells (_n_=96), and BPDCN patient samples (_n_=269). Note that some of these single cells were excluded from the analysis after applying QC filters and analytically confirming cell type (6).
Single-cell RNA sequencing analyses
Raw sequencing data were processed as previously described (59) (see tables S13 to S16 for cell identities that accompany raw data and gene expression matrices). Briefly, short sequencing reads were aligned to the UCSC hg19 transcriptome. These alignments were used to estimate transcriptomic alignment rates, and were also used as input in RSEM v 1.2.1 to quantify gene expression levels (transcripts per million; TPM) for all UCSC hg19 genes in all samples. We filtered out low-quality cells from our data set based on a threshold for the number of genes detected (a minimum of 3000 unique genes per cell for cells sequenced at HiSeq depth, and 2000 unique genes per cell for cells sequenced at MiSeq depth). All genes that were not detected in at least 0.5% of all our single cells were discarded, leaving 21,581 genes for all further analyses. Data were log-transformed [log(TPM+1)] for all downstream analyses, most of which were performed using the R software package Seurat (https://github.com/satijalab/seurat; http://satijalab.org/seurat/). See (6) for further details, including R script used to generate clusters.
DC differentiation assay on MS5 stromal cells
DC differentiation assay was performed as described (23–25) with minor adaptation. Briefly, 1×10⁴ purified progenitors, DC, and monocyte subsets were cultured in 96-well flat bottom plates layered with 4×10⁴ murine MS5 stromal cells (DSMZ, Germany) in the presence of human FLT3 ligand (FL; 100 ng/ml; Miltenyi Biotec), recombinant human SCF (20 ng/ml; R&D Systems), and recombinant human granulocyte-macrophage colony-stimulating factor (GM-CSF) (10 ng/ml; Peprotech). MS5 stromal cells were seeded 24 hours prior to co-culture. Growth factors were replenished on day 3 of culture. Cells were in culture for up to 7 days prior to harvesting by physical dissociation on ice. Cells were then stained on ice either for flow cytometry analysis (see output panel in table S12) or single-cell index sorting of CD45+ cells for scRNA-seq of culture output analysis.
Cytokine production measurements
Purified subsets were cultured at 5×10³ cells per well in 96-well round-bottom plates in the presence of LPS (100ng/ml; Invivogen) and ODN2395 (1μM; Invivogen) or ODN5328 (ODN2395 control, 1μM; Invivogen), or in the presence of LPS, poly (I:C) (25μg/ml; Invivogen) and R848 (2.5μg/ml; Enzo Life Sciences). Culture supernatants were harvested after 24 hours and analyzed using a multiplexed cytokine assay (ProcartaPlex, eBioscience), or by leveraging the 92 inflammatory-related protein biomarker panel and four controls provided by Olink Proteomics (Uppsala, Sweden) (6).
Assessing T cell stimulatory potential
DC, monocyte, and progenitor subsets were purified from peripheral blood of healthy donors by FACS sorting (BD FACS Fusion; see table S12 for sorting panels and antibodies). For T cell stimulatory potential, purified DCs, monocytes, AXL+SIGLEC6+ subsets, and progenitor subset were cultured at cell density 5×10⁴ per well. All purified cell subsets were matured with LPS (100ng/ml, Sigma) and R848 (2.5μg/ml, Invivogen), or with just LPS (100ng/ml), for 24 hours prior to co-culture with 5×10⁵ CFSE-labeled allogeneic unfractionated CD3+ T cells at a 1:10 DC:T cell ratio. T cell proliferation was assessed by measuring CFSE dilution on day 5 of culture.
Cytospin and immunostaining
Cytospin of FACS-purified cells was prepared as described (60) using Shandon Cytospin 4 (Thermo Scientific). Giemsa-Wright staining was performed using Advia S60 (Siemens) and imaged using Axioimager.Z2 microscope with Axiovision software v4.8 (Carl Zeiss, Germany). Human tonsil paraffin sections were immunostained with the antibodies: anti-AXL (MM0098-2N33, Abcam), CD123 (BR4MS, Leica Biosystems) and CD3 (LN10, Leica Biosystems) using a Ventana Benchmark XT instrument.
Monitoring cell proliferation
PBMCs were labeled with Cell Trace Violet (CTV, Life Technologies) according to manufacturer’s protocol. CTV-labeled FACS-purified progenitors and DC subsets were cultured on murine MS5 stromal cells as described above and analyzed on day 5 to assess proliferation measured by CTV dilution.
Supplementary Material
Supplementary Materials & Methods
Supplementary Tables 1–16
One Sentence Summary.
Single cell RNA-sequencing and functional studies were used to revise the definitions of human blood dendritic cells and monocytes.
Acknowledgments
We thank the subjects in the PhenoGenetic Project for donating the blood used in our study; E. Segura, S. Amigorena, C. Benoist and D. Puyraimond-Zemmour for advice on the sorting strategy; M. Waring and the Ragon Institute Imaging Core-Flow Cytometry Facility [which is supported in part by the Harvard University Center for AIDS Research (CFAR), an NIH funded program (5 P30 AI060354-10)]; T. Booth and Newcastle University Bioimaging Unit for assistance with microscopy; L. Gaffney for illustrations; A. Long from MRC/EPSRC Molecular Pathology Node, J. Scott, K. Best, C. Jones, D. Lieb, C. Ford, D. Gennert, J. Trombetta, and A. Schnell for help and advice. Supported by National Human Genome Research Institute Centers of Excellence in Genomics Science grant P50 HG006193 (N.H. and A.R.), Manton Foundation (A.R. and N.H.), Howard Hughes Medical Institute (A.R.), NIH BRAIN grant (A.R.), Klarman Family Foundation (A.R. and N.H.), Banting Postdoctoral Fellowship (A.-C.V.), NIH Director’s New Innovator Award Program DP2-HG-009623 (R.S.), National Human Genome Research grant T32 HG002295 (S.S.; PI: Park, Peter J), American Society of Hematology Scholar grant (A.A.L), ISAC SRL-EL program (A.J.F), and Wellcome Trust grants WT088555 and WT107931/Z/15/Z (M.H.). A.-C.V., R.S., A.R., N.H., The Broad Institute, and Massachusetts General Hospital have filed a U.S. provisional patent application (62/376,007) that relates to products and methods useful for modulating and evaluating immune responses. A.R. is a scientific advisory board member for ThermoFisher Scientific and Syros Pharmaceuticals and a consultant for Driver Group. Processed scRNA-seq data are available through the Gene Expression Omnibus accession number GSE94820 and through the Broad Institute Single Cell Portal at https://portals.broadinstitute.org/single_cell/study/atlas-of-human-blood-dendritic-cells-and-monocytes. Raw RNA sequencing data are available through Database of Genotypes and Phenotypes (dbGaP) accession number phs001294.v1.p1.
Footnotes
References
- 1.Haniffa M, Bigley V, Collin M. Human mononuclear phagocyte system reunited. Semin Cell Dev Biol. 2015;41:59–69. doi: 10.1016/j.semcdb.2015.05.004. [DOI] [PubMed] [Google Scholar]
- 2.Mildner A, Jung S. Development and function of dendritic cell subsets. Immunity. 2014;40:642–656. doi: 10.1016/j.immuni.2014.04.016. [DOI] [PubMed] [Google Scholar]
- 3.Schraml BU, e Sousa C Reis. Defining dendritic cells. Curr Opin Immunol. 2015;32:13–20. doi: 10.1016/j.coi.2014.11.001. [DOI] [PubMed] [Google Scholar]
- 4.Trapnell C. Defining cell types and states with single-cell genomics. Genome Res. 2015;25:1491–1498. doi: 10.1101/gr.190595.115. [DOI] [PMC free article] [PubMed] [Google Scholar]
- 5.Grün D, van Oudenaarden A. Design and analysis of single-cell sequencing experiments. Cell. 2015;163:799–810. doi: 10.1016/j.cell.2015.10.039. [DOI] [PubMed] [Google Scholar]
- 6.See supplementary materials.
- 7.Picelli S, et al. Smart-seq2 for sensitive full-length transcriptome profiling in single cells. Nat Methods. 2013;10:1096–1098. doi: 10.1038/nmeth.2639. [DOI] [PubMed] [Google Scholar]
- 8.Trombetta JJ, et al. Curr Protoc Mol Biol. 2014;107:4.22.1–4.22.17. doi: 10.1002/0471142727.mb0422s107. [DOI] [PMC free article] [PubMed] [Google Scholar]
- 9.Macosko EZ, et al. Highly parallel genome-wide expression profiling of individual cells using nanoliter droplets. Cell. 2015;161:1202–1214. doi: 10.1016/j.cell.2015.05.002. [DOI] [PMC free article] [PubMed] [Google Scholar]
- 10.van der Maaten L, Hinton G. Visualizing data using t-SNE. J Machine Learn Res. 2008;9:2579–2605. doi: 10.1016/j.cell.2015.05.047. www.jmlr.org/papers/volume9/vandermaaten08a/vandermaaten08a.pdf. [DOI] [Google Scholar]
- 11.Levine JH, et al. Data-driven phenotypic dissection of AML reveals progenitor-like cells that correlate with prognosis. Cell. 2015;162:184–197. doi: 10.1016/j.cell.2015.05.047. [DOI] [PMC free article] [PubMed] [Google Scholar]
- 12.Liu H, Liu J, Toups M, Soos T, Arendt C. Gene signature based mapping of immunological systems and diseases. BMC Bioinformatics. 2016;17:171. doi: 10.1186/s12859-016-1012-y. [DOI] [PMC free article] [PubMed] [Google Scholar]
- 13.Pascual V, Chaussabel D, Banchereau J. A genomic approach to human autoimmune diseases. Annu Rev Immunol. 2010;28:535–571. doi: 10.1146/annurev-immunol-030409-101221. [DOI] [PMC free article] [PubMed] [Google Scholar]
- 14.Mesko B, Poliska S, Nagy L. Gene expression profiles in peripheral blood for the diagnosis of autoimmune diseases. Trends Mol Med. 2011;17:223–233. doi: 10.1016/j.molmed.2010.12.004. [DOI] [PubMed] [Google Scholar]
- 15.Welner RS, et al. Interferon-producing killer dendritic cells (IKDCs) arise via a unique differentiation pathway from primitive c-kitHiCD62L+ lymphoid progenitors. Blood. 2007;109:4825–4931. doi: 10.1182/blood-2006-08-043810. [DOI] [PMC free article] [PubMed] [Google Scholar]
- 16.Taieb J, et al. A novel dendritic cell subset involved in tumor immunosurveillance. Nat Med. 2006;12:214–219. doi: 10.1038/nm1356. [DOI] [PubMed] [Google Scholar]
- 17.Chan CW, et al. Interferon-producing killer dendritic cells provide a link between innate and adaptive immunity. Nat Med. 2006;12:207–213. doi: 10.1038/nm1352. [DOI] [PubMed] [Google Scholar]
- 18.Swiecki M, Colonna M. The multifaceted biology of plasmacytoid dendritic cells. Nat Rev Immunol. 2015;15:471–485. doi: 10.1038/nri3865. [DOI] [PMC free article] [PubMed] [Google Scholar]
- 19.Cheng M, et al. Characterization of species-specific genes regulated by E2-2 in human plasmacytoid dendritic cells. Sci Rep. 2015;5:10752. doi: 10.1038/srep10752. [DOI] [PMC free article] [PubMed] [Google Scholar]
- 20.Matsui T, et al. CD2 distinguishes two subsets of human plasmacytoid dendritic cells with distinct phenotype and functions. J Immunol. 2009;182:6815–6823. doi: 10.4049/jimmunol.0802008. [DOI] [PMC free article] [PubMed] [Google Scholar]
- 21.Grouard G, et al. The enigmatic plasmacytoid T cells develop into dendritic cells with interleukin (IL)-3 and CD40-ligand. J Exp Med. 1997;185:1101–1111. doi: 10.1084/jem.185.6.1101. [DOI] [PMC free article] [PubMed] [Google Scholar]
- 22.Miller JC, et al. Deciphering the transcriptional network of the dendritic cell lineage. Nat Immunol. 2012;13:888–899. doi: 10.1038/ni.2370. [DOI] [PMC free article] [PubMed] [Google Scholar]
- 23.Satpathy AT, Wu X, Albring JC, Murphy KM. Re(de)fining the dendritic cell lineage. Nat Immunol. 2012;13:1145–1154. doi: 10.1038/ni.2467. [DOI] [PMC free article] [PubMed] [Google Scholar]
- 24.Breton G, et al. Circulating precursors of human CD1c+ and CD141+ dendritic cells. J Exp Med. 2015;212:401–413. doi: 10.1084/jem.20141441. [DOI] [PMC free article] [PubMed] [Google Scholar]
- 25.Lee J, et al. Restricted dendritic cell and monocyte progenitors in human cord blood and bone marrow. J Exp Med. 2015;212:385–399. doi: 10.1084/jem.20141442. [DOI] [PMC free article] [PubMed] [Google Scholar]
- 26.Breton G, Lee J, Liu K, Nussenzweig MC. Defining human dendritic cell progenitors by multiparametric flow cytometry. Nat Protoc. 2015;10:1407–1422. doi: 10.1038/nprot.2015.092. [DOI] [PMC free article] [PubMed] [Google Scholar]
- 27.Notta F, et al. Distinct routes of lineage development reshape the human blood hierarchy across ontogeny. Science. 2016;351:aab2116. doi: 10.1126/science.aab2116. [DOI] [PMC free article] [PubMed] [Google Scholar]
- 28.Doulatov S, Notta F, Laurenti E, Dick JE. Hematopoiesis: A human perspective. Cell Stem Cell. 2012;10:120–136. doi: 10.1016/j.stem.2012.01.006. [DOI] [PubMed] [Google Scholar]
- 29.Hildner K, et al. Batf3 deficiency reveals a critical role for CD8a+ dendritic cells in cytotoxic T cell immunity. Science. 2008;322:1097–1100. doi: 10.1126/science.1164206. [DOI] [PMC free article] [PubMed] [Google Scholar]
- 30.Poulin LF, et al. Characterization of human DNGR-1+ BDCA3+ leukocytes as putative equivalents of mouse CD8a+ dendritic cells. J Exp Med. 2010;207:1261–1271. doi: 10.1084/jem.20092618. [DOI] [PMC free article] [PubMed] [Google Scholar]
- 31.Crozat K, et al. The XC chemokine receptor 1 is a conserved selective marker of mammalian cells homologous to mouse CD8a+ dendritic cells. J Exp Med. 2010;207:1283–1292. doi: 10.1084/jem.20100223. [DOI] [PMC free article] [PubMed] [Google Scholar]
- 32.Jongbloed SL, et al. Human CD141+ (BDCA-3)+ dendritic cells (DCs) represent a unique myeloid DC subset that cross-presents necrotic cell antigens. J Exp Med. 2010;207:1247–1260. doi: 10.1084/jem.20092140. [DOI] [PMC free article] [PubMed] [Google Scholar]
- 33.Haniffa M, et al. Human tissues contain CD141hi cross presenting dendritic cells with functional homology to mouse CD103+ nonlymphoid dendritic cells. Immunity. 2012;37:60–73. doi: 10.1016/j.immuni.2012.04.012. [DOI] [PMC free article] [PubMed] [Google Scholar]
- 34.Riaz W, Zhang L, Horna P, Sokol L. Cancer Contr. 2014;21:279–289. doi: 10.1177/107327481402100404. [DOI] [PubMed] [Google Scholar]
- 35.Garnache-Ottou F, Feuillard J, Saas P. Plasmacytoid dendritic cell leukaemia/lymphoma: Towards a well defined entity? Br J Haematol. 2007;136:539–548. doi: 10.1111/j.1365-2141.2006.06458.x. [DOI] [PubMed] [Google Scholar]
- 36.Sapienza MR, et al. Molecular profiling of blastic plasmacytoid dendritic cell neoplasm reveals a unique pattern and suggests selective sensitivity to NF-kB pathway inhibition. Leukemia. 2014;28:1606–1616. doi: 10.1038/leu.2014.64. [DOI] [PMC free article] [PubMed] [Google Scholar]
- 37.Osaki Y, et al. Characterization of CD56+ dendritic-like cells: A normal counterpart of blastic plasmacytoid dendritic cell neoplasm? PLOS ONE. 2013;8:e81722. doi: 10.1371/journal.pone.0081722. [DOI] [PMC free article] [PubMed] [Google Scholar]
- 38.Yu H, et al. Human BDCA2+CD123+CD56+ dendritic cells (DCs) related to blastic plasmacytoid dendritic cell neoplasm represent a unique myeloid DC subset. Protein Cell. 2015;6:297–306. doi: 10.1007/s13238-015-0140-x. [DOI] [PMC free article] [PubMed] [Google Scholar]
- 39.Guilliams M, et al. Dendritic cells, monocytes and macrophages: A unified nomenclature based on ontogeny. Nat Rev Immunol. 2014;14:571–578. doi: 10.1038/nri3712. [DOI] [PMC free article] [PubMed] [Google Scholar]
- 40.Lewis KL, et al. Notch2 receptor signaling controls functional differentiation of dendritic cells in the spleen and intestine. Immunity. 2011;35:780–791. doi: 10.1016/j.immuni.2011.08.013. [DOI] [PMC free article] [PubMed] [Google Scholar]
- 41.Satpathy AT, et al. Notch2-dependent classical dendritic cells orchestrate intestinal immunity to attaching-and-effacing bacterial pathogens. Nat Immunol. 2013;14:937–948. doi: 10.1038/ni.2679. [DOI] [PMC free article] [PubMed] [Google Scholar]
- 42.Schlitzer A, et al. IRF4 transcription factor-dependent CD11b+ dendritic cells in human and mouse control mucosal IL-17 cytokine responses. Immunity. 2013;38:970–983. doi: 10.1016/j.immuni.2013.04.011. [DOI] [PMC free article] [PubMed] [Google Scholar]
- 43.Persson EK, et al. IRF4 transcription-factor-dependent CD103+CD11b+ dendritic cells drive mucosal T helper 17 cell differentiation. Immunity. 2013;38:958–969. doi: 10.1016/j.immuni.2013.03.009. [DOI] [PubMed] [Google Scholar]
- 44.Macauley MS, Crocker PR, Paulson JC. Siglec-mediated regulation of immune cell function in disease. Nat Rev Immunol. 2014;14:653–666. doi: 10.1038/nri3737. [DOI] [PMC free article] [PubMed] [Google Scholar]
- 45.Rothlin CV, Carrera-Silva EA, Bosurgi L, Ghosh S. TAM receptor signaling in immune homeostasis. Annu Rev Immunol. 2015;33:355–391. doi: 10.1146/annurev-immunol-032414-112103. [DOI] [PMC free article] [PubMed] [Google Scholar]
- 46.Nowakowski TJ, et al. Expression analysis highlights AXL as a candidate Zika virus entry receptor in neural stem cells. Cell Stem Cell. 2016;18:591–596. doi: 10.1016/j.stem.2016.03.012. [DOI] [PMC free article] [PubMed] [Google Scholar]
- 47.Bar-On L, et al. CX3CR1+ CD8a+ dendritic cells are a steady state population related to plasmacytoid dendritic cells. Proc Natl Acad Sci USA. 2010;107:14745–14750. doi: 10.1073/pnas.1001562107. [DOI] [PMC free article] [PubMed] [Google Scholar]
- 48.Lau CM, et al. Leukemia-associated activating mutation of Flt3 expands dendritic cells and alters T cell responses. J Exp Med. 2016;213:415–431. doi: 10.1084/jem.20150642. [DOI] [PMC free article] [PubMed] [Google Scholar]
- 49.Wilhelm TR, et al. Siglec-1-positive plasmacytoid dendritic cells (pDCs) in human peripheral blood: A semi-mature and myeloid-like subset imbalanced during protective and autoimmune responses. Clin Immunol. 2016;163:42–51. doi: 10.1016/j.clim.2015.12.001. [DOI] [PubMed] [Google Scholar]
- 50.Schwab N, Zozulya AL, Kieseier BC, Toyka KV, Wiendl H. An imbalance of two functionally and phenotypically different subsets of plasmacytoid dendritic cells characterizes the dysfunctional immune regulation in multiple sclerosis. J Immunol. 2010;184:5368–5374. doi: 10.4049/jimmunol.0903662. [DOI] [PubMed] [Google Scholar]
- 51.Du Q, et al. Preferential depletion of CD2low plasmacytoid dendritic cells in HIV-infected subjects. Cell Mol Immunol. 2011;8:441–444. doi: 10.1038/cmi.2011.9. [DOI] [PMC free article] [PubMed] [Google Scholar]
- 52.Bryant C, et al. A CD2 high-expressing stress-resistant human plasmacytoid dendritic-cell subset. Immunol Cell Biol. 2016;94:447–457. doi: 10.1038/icb.2015.116. [DOI] [PubMed] [Google Scholar]
- 53.Cella M, et al. Plasmacytoid monocytes migrate to inflamed lymph nodes and produce large amounts of type I interferon. Nat Med. 1999;5:919–923. doi: 10.1038/11360. [DOI] [PubMed] [Google Scholar]
- 54.De Vries J, Figdor C. Immunotherapy: Cancer vaccine triggers antiviral-type defences. Nature. 2016;534:329–331. doi: 10.1038/nature18443. [DOI] [PubMed] [Google Scholar]
- 55.Tel J, et al. Human plasmacytoid dendritic cells are equipped with antigen-presenting and tumoricidal capacities. Blood. 2012;120:3936–3944. doi: 10.1182/blood-2012-06-435941. [DOI] [PubMed] [Google Scholar]
- 56.Tel J, et al. Natural human plasmacytoid dendritic cells induce antigen-specific T-cell responses in melanoma patients. Cancer Res. 2013;73:1063–1075. doi: 10.1158/0008-5472.CAN-12-2583. [DOI] [PubMed] [Google Scholar]
- 57.Xia Z, et al. A 17q12 allele is associated with altered NK cell subsets and function. J Immunol. 2012;188:3315–3322. doi: 10.4049/jimmunol.1102775. [DOI] [PMC free article] [PubMed] [Google Scholar]
- 58.Lee MN, et al. Common genetic variants modulate pathogen sensing responses in human dendritic cells. Science. 2014;343:1246980. doi: 10.1126/science.1246980. [DOI] [PMC free article] [PubMed] [Google Scholar]
- 59.Shalek AK, et al. Single-cell RNA-seq reveals dynamic paracrine control of cellular variation. Nature. 2014;510:363–369. doi: 10.1038/nature13437. [DOI] [PMC free article] [PubMed] [Google Scholar]
- 60.Haniffa M, et al. Differential rates of replacement of human dermal dendritic cells and macrophages during hematopoietic stem cell transplantation. J Exp Med. 2009;206:371–385. doi: 10.1084/jem.20081633. [DOI] [PMC free article] [PubMed] [Google Scholar]
Associated Data
This section collects any data citations, data availability statements, or supplementary materials included in this article.
Supplementary Materials
Supplementary Materials & Methods
Supplementary Tables 1–16