Context-Dependent and Disease-Specific Diversity in Protein Interactions within Stress Granules (original) (raw)
. Author manuscript; available in PMC: 2019 Jan 25.
SUMMARY
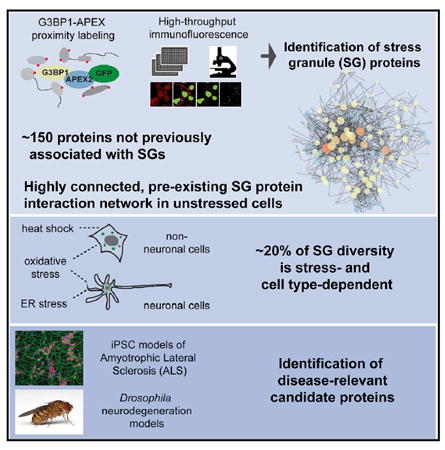
Stress granules (SGs) are transient ribonucleoprotein (RNP) aggregates that form during cellular stress and are increasingly implicated in human neurodegeneration. To study the proteome and compositional diversity of SGs in different cell types and in the context of neurodegeneration-linked mutations, we used ascorbate peroxidase (APEX) proximity labeling, mass spectrometry, and immunofluorescence to identify ~150 previously unknown human SG components. A highly integrated, pre-existing SG protein interaction network in unstressed cells facilitates rapid coalescence into larger SGs. Approximately 20% of SG diversity is stress or cell-type dependent, with neuronal SGs displaying a particularly complex repertoire of proteins enriched in chaperones and autophagy factors. Strengthening the link between SGs and neurodegeneration, we demonstrate aberrant dynamics, composition, and subcellular distribution of SGs in cells from amyotrophic lateral sclerosis (ALS) patients. Using three Drosophila ALS/FTD models, we identify SG-associated modifiers of neurotoxicity in vivo. Altogether, our results highlight SG proteins as central to understanding and ultimately targeting neurodegeneration.
Graphical abstract
INTRODUCTION
Cellular RNA molecules interact with a diverse array of nearly 2,000 RNA-binding proteins (RBPs) (Brannan et al., 2016) to form ribonucleoprotein particles (RNPs). Large numbers of RNPs frequently accumulate into microscopically visible RNP granules, which can measure up to several microns in size but remain highly dynamic. Neuronal transport granules, which mediate the transport of mRNA and other cargo along axons and dendrites (Ainger et al., 1993), are an example of RNP granules that are present in cells under physiological conditions. By contrast, exposure of cells to exogenous stresses can induce the rapid formation of cytoplasmic stress granules (SGs) and other induced RNP granules (Kedersha et al., 1999). The formation of SGs occurs concurrently with alterations in global RNA metabolism, primarily a near-complete shutdown in translation through sequestration of untranslated mRNAs within stalled translation initiation complexes (Kedersha and Anderson, 2002).
SG formation has been suggested as a two-step process, with initial formation of a dense stable SG “core” followed by accumulation of proteins containing intrinsically disordered regions (IDRs) and low-complexity domains (LCDs) into a peripheral “shell” through a process involving liquid-liquid phase separation (LLPS) (Jain et al., 2016; Molliex et al., 2015; Wheeler et al., 2016). Recently, SGs have been associated with human neurodegenerative disorders characterized by the presence of toxic insoluble protein aggregates. This link is most compelling in the case of amyotrophic lateral sclerosis (ALS) and frontotemporal dementia (FTD), where numerous disease-causing mutations are purported to interfere with LLPS-dependent growth and dynamics of SGs (Boeynaems et al., 2017; Lee et al., 2016; Lin et al., 2016; Mackenzie et al., 2017; Martinez et al., 2016; Murakami et al., 2015; Patel et al., 2015). A more complete description of how SG composition and behavior are affected in normal and disease conditions is required for the potential development of SG-targeting therapies. A few systematic approaches have been employed to catalog the protein content of SGs (Buchan et al., 2013; Jain et al., 2016; Ohn et al., 2008). However, these efforts need to be complemented with in vivo approaches that address potential loss or gain of SG protein interactions following cell lysis. Furthermore, there is an unmet need to systematically examine the extent to which SG composition is dependent on cell type, the nature of the stressor, and the presence of disease-linked mutations in SG proteins.
In this study, we use a combination of ascorbate peroxidase (APEX)-mediated in vivo proximity labeling (Rhee et al., 2013) with quantitative mass spectrometry (MS) and an RBP-focused immunofluorescence (IF) approach to comprehensively and significantly expand the repertoire of known SG proteins across different cell types, stress conditions, and disease states. We show that SG proteins form a dense protein interaction network (PIN) in unstressed cells that is poised to enable rapid SG assembly in response to stress. In addition, we find that SGs in neuronal cells are particularly diverse in composition and contain numerous protein quality control (PQC) factors. We reveal aberrant composition, behavior, and subcellular localization of SGs in motor neurons derived from stem cell models harboring ALS-associated mutations in HNRNPA2B1 and C9orf72. By systematically integrating our refined SG proteome with published neurodegeneration-relevant datasets, we provide a framework for further investigations into the molecular underpinnings of SG biology and how it relates to human disease. To underscore the potential of identifying unexpected disease-relevant factors among SG proteins, we show that known and previously unknown SG components modify neurotoxicity in Drosophila models of FUS-, TDP-43-, and C9orf72-mediated degeneration. We characterize one of these, UBAP2L, as an essential, disordered, and highly aggregation-prone SG protein that can modulate ALS phenotypes in vivo.
RESULTS
Endogenously Tagged G3BP1-APEX2-GFP Allows for Specific Biotin Labeling of SG Proteins
To investigate the protein composition of SGs in living cells, we performed proximity labeling using an engineered ascorbate peroxidase (APEX2) fused to the well-characterized SG protein G3BP1 (Figure 1A). We used CRISPR/Cas9-directed genome engineering to insert APEX2-GFP into the endogenous G3BP1 locus in HEK293T cells (Figure S1A). The resulting G3BP1- APEX2-GFP fusion protein allows visualization of SGs upon sodium arsenite (NaAsO2) exposure, as well as robust and rapid biotin labeling of SG proteins in the presence of biotin-phenol (BP) and hydrogen peroxide (H2O2) (Figures 1B and 1C). As a specificity control, cells with constitutive expression of cytoplasmic- localized APEX2 (NES-APEX2-GFP) (Figure S1B) show a diffuse GFP signal and a biotinylation pattern that is unaffected by NaAsO2 (Figures 1B and 1C).
Figure 1. G3BP1-APEX2 Mediates Specific Biotinylation of Stress-Granule-Associated Proteins.
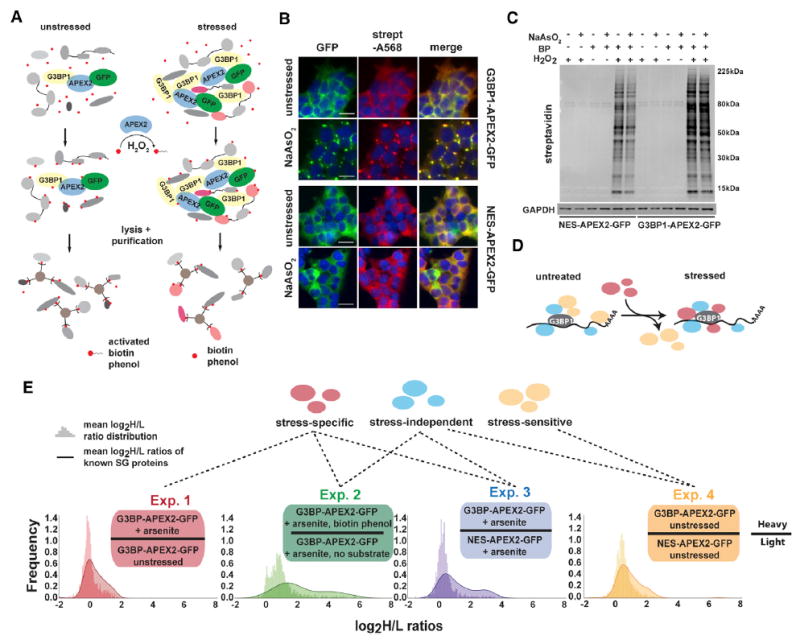
(A) Schematic of APEX proximity labeling to tag SG proteins with biotin.
(B) Streptavidin staining of unstressed and NaAsO2-treated HEK293T G3BP1-APEX2-GFP and hPGK-NES-APEX2-GFP cells. Scale bars, 25 μm.
(C) Streptavidin-HRP western blot analysis of induced protein biotinylation in lysates from NES-APEX2-GFP and G3BP1-APEX2-GFP cells.
(D) Schematic of G3BP1 interactome changes upon stress.
(E) Experimental designs for detecting the G3BP1 interactome changes under different conditions, including log2 H/L ratio distributions of all proteins detected, overlaid with log2 H/L ratio distributions of known SG proteins.
See also Figures S1 and S2 and Table S1.
Identification of Stress-Dependent and Independent SG Proteomes Using Quantitative Proteomics
Since G3BP1 is essential for SG formation and robustly localizes to SGs, we reasoned that defining the interactome proximal to G3BP1 under stress conditions approximates the SG proteome. We employed a series of quantitative proteomics experiments (Figure S1C) to systematically identify three classes of G3BP1- interacting proteins in stressed and unstressed cells: (1) stressindependent interactors, which associate with G3BP1 independently of stress; (2) stress-dependent partners, which associate with G3BP1 only under stress; and (3) stress-sensitive interactors, whose association with G3BP1 is lost or weakened during stress (Figure 1D).
To distinguish these interactors, we pursued four experimental schemes (Figure 1E). First, to identify stress-dependent G3BP1 interactors, we characterized biotinylated proteins in stressed versus unstressed G3BP1-APEX2-GFP cells (experiment 1). Next, we compared lysates from stressed G3BP1-APEX2-GFP cells incubated with BP to lysates of identically treated cells for which the BP substrate was omitted (experiment 2). Third, to control for diffuse cytoplasmic labeling by G3BP1-APEX2-GFP, we also compared lysates from stressed G3BP1-APEX2-GFP and NES-APEX2-GFP cells (experiment 3). Last, to define stress-independent as well as stress-sensitive G3BP1 interactors, we profiled lysates from unstressed G3BP1-APEX2-GFP and NES-APEX2-GFP cells (experiment 4). For each approach, we conducted biologically independent triplicate labeling reactions followed by mixing of lysates and streptavidin purification of biotinylated proteins. Affinity-purified samples and the corresponding input samples were analyzed by quantitative MS. In total, we detected 1,416 proteins across all input samples and 2,020 proteins across all streptavidin enrichments (Figure S1D), accounting for 64% (153) of a manually curated list of 238 annotated SG proteins (Table S2). Protein identification and quantification of heavy to light (H/L) ratios were highly reproducible across replicate experiments (Figure S2; Table S1). We compared the enrichment of known SG proteins to the background distribution of all detected proteins (Figures 1E and 2A). Known SG proteins were significantly enriched across all four approaches, with the greatest shift in log2 H/L ratios detected in experiments 2 and 3. Interestingly, we observed attenuated enrichment of known SG proteins in experiment 1 and that even in the absence of stress (experiment 4), known SG proteins appeared to be enriched in the IP samples (Figures 1E and 2A).
Figure 2. SG-APEX Identifies Known and Previously Unknown SG Proteins within a Dense Interaction Network.
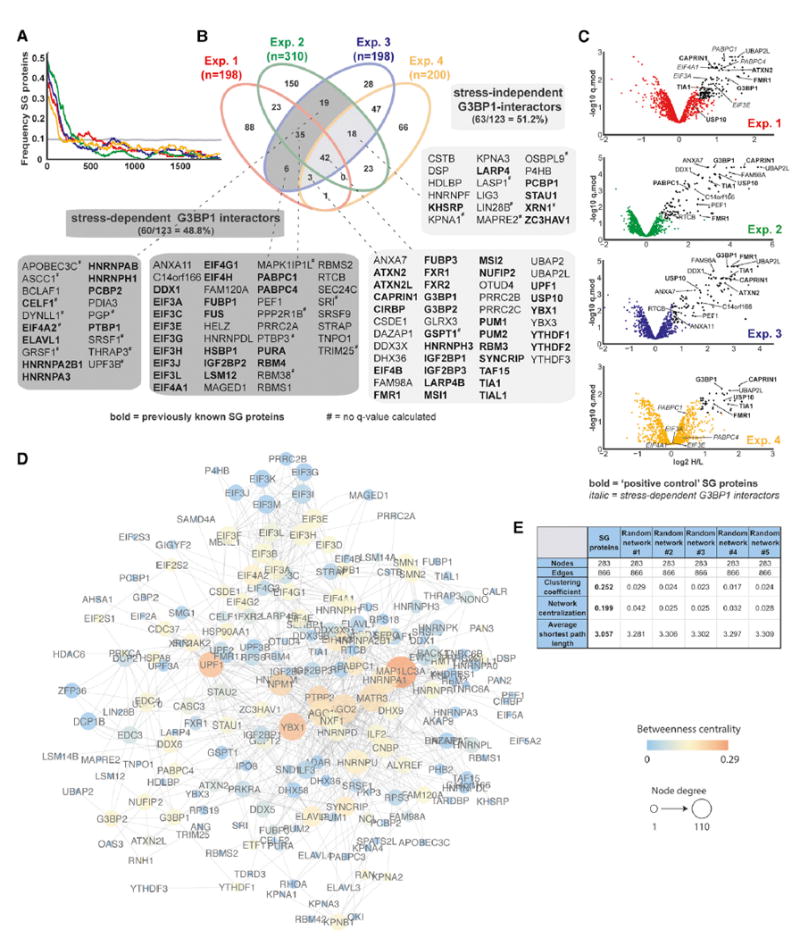
(A) Enrichment frequency distribution of known SG proteins in log2 H/L-ranked proteomics datasets. The dashed line represents 2 times the background frequency of SG proteins across all detected proteins.
(B) Venn diagram showing overlapping hits from four experimental designs, with previously known SG proteins highlighted in bold.
(C) Volcano plots showing statistically significant enrichment of selected known and previously unknown SG proteins across experiments.
(D) Protein interaction network (PIN) of 283 proteins identified as APEX hits in HEK293T cells or previously shown to associate with SGs. Network was visualized in Cytoscape using a force-directed layout.
(E) Common network parameters for the SG-PIN compared to five PINs from a randomly selected equal number of nodes and edges. See also Table S3.
G3BP1-APEX2-Mediated Biotinylation Identifies SG Proteins with High Specificity
We used a series of analysis steps to identify candidate SG proteins from our quantitative proteomics data (Figure S1E). We first leveraged our curated list of annotated SG proteins to determine log2 H/L ratio cutoffs in a non-parametric approach similar to previous ratiometric SILAC APEX experiments (Hung et al., 2014). We ranked identified proteins in each replicate by their log2 H/L ratio and calculated the frequency distribution of known SG proteins across the ranked lists (Figure 2A). We chose as a conservative cutoff the ratio at which the frequency of known SG proteins in a moving window fell below 2-fold the frequency across all detected proteins. In parallel, we applied an empirical Bayes method (Kammers et al., 2015) to identify proteins that were significantly enriched in heavy over light samples. This method is based on the linear models for microarray data (LIMMA) approach (Smyth, 2004), which is also applicable to quantitative proteomics data (Margolin et al., 2009). It uses the actual observed data to moderate individual protein variances through an estimated global sample variance, and thus enables a more robust identification of significant changes in protein abundance than ordinary t-statistics. The resulting moderated p values are corrected for multiple hypothesis testing using a modified Benjamini-Hochberg false discovery rate (FDR) approach to determine a moderated q-value (q.mod).
For the final list of SG candidates, we initially selected all proteins that were above the ratio cutoff in at least 2 out of 3 IP replicates. We defined a set of 123 proteins from the overlapping sets as shown in Figure 2B (shaded in gray). Of these, 80% (99/123) are also statistically significantly enriched (q.mod < 0.05) in at least one experiment. For most of the remaining 24 proteins, no significance values could be determined due to missing data in one of the biological replicates. However, as ~25% of these proteins were previously known SG proteins, we chose to retain them in our final list (marked by # in Figure 2B). Table S3 provides a detailed overview of all hit candidates across all four experimental designs.
Underscoring the robustness of the approach, many wellcharacterized SG proteins (e.g., G3BP1, TIA1, CAPRIN1, PABPC1, FMR1, and ATXN2) were identified as highly significant interactors across multiple experiments (Figure 2C). In summary, nearly 80% (96/123) of hits are known SG proteins (69/123), were verified by IF (13/123), or have additional data supporting SG association, such as closely related family members or interactions with known SG proteins (14/100; e.g., HNRNPDL, YTHDF3). For example, the DEAD-box helicase DDX1 is known to localize to SGs and was shown to form an RNA transport complex with C14ORF166, FAM98A/B, and RTCB (Pérez-González et al., 2014), all of which we identify as SG candidates (Figures 2B and 2C). Interestingly, our SG protein set also contains ANXA11, its closest paralog ANXA7, and their interactor PEF1 (Figures 2B and 2C). While none of these proteins had previously been implicated in SG biology, ANXA11 was recently shown to harbor ALS-associated mutations leading to abnormal protein aggregation (Smith et al., 2017). In summary, we demonstrate that APEX proximity labeling can be applied to dynamic RNP granules to identify known and previously unknown SG proteins with relevance to neurodegenerative disease.
Proximity Labeling Reveals a Pre-existing Network of SG Protein Interactions
Visible SGs only coalesce in response to cellular stress; however, our data suggested an enrichment of SG proteins in the G3BP1 interactome even in unstressed cells. Indeed, we found that less than half (48.8% [60/123]) of SG-APEX hits were stress-dependent interactors (Figure 2B), including 11 (out of 12 detected) individual subunits of the EIF3 and EIF4 translation initiation factors, which are thought to accumulate in stalled pre-initiation complexes in SGs. Remarkably, 51.2% (63/123) of APEX hits, including many well-studied SG proteins (e.g., CAPRIN1, FMR1, TIA1, and USP10), interact with G3BP1 in the absence of stress (Figures 2B and 2C).
To expand on these findings, we also retrieved publicly available direct protein-protein interaction (PPI) data for all proteins either detected by SG-APEX in HEK293T cells or previously annotated as SG proteins. The resulting SG-PIN contains 283 nodes and 866 non-redundant edges (Figure 2D) and is more densely connected than PINs built from an equal number of randomly selected nodes and edges (Figure 2E). In combination with our SG-APEX data, this suggests a pre-existing steadystate network of protein interactions that likely facilitates the rapid coalescence of microscopically visible SGs upon exposure of cells to environmental stress.
G3BP1-APEX2 Proximity Labeling in Human Neuronal Cells Reveals Cell-Type- and Stress-Specific SG Proteins
To enable analysis of SGs in more neurodegeneration-relevant cell types, we used CRISPR/Cas9-mediated genome engineering to generate G3BP1-APEX2-GFP-expressing human induced pluripotent stem cells (iPSCs). Upon differentiation to neural progenitor cells (NPCs) (Figure 3A), G3BP1-APEX2-GFP robustly localized to SGs upon NaAsO2 treatment and streptavidin staining overlapped well with the GFP signal (Figure S3A). We then used quantitative proteomics to compare NaAsO2-treated and unstressed G3BP1-APEX2-GFP expressing NPCs, as well as NaAsO2-treated G3BP1-APEX2-GFP cells with and without substrate (Figure S3B). To compare the effects of different stressors, we used thapsigargin in parallel experiments. In total, we detected 3,880 proteins across all streptavidin enrichments and input samples that account for 77% (183/238) of known SG proteins (Figure S3C; Table S4). Analysis of log2 H/L ratio distributions and enrichment of known SG proteins in the data gave similar results to those observed in HEK293T cells, with high enrichment of known SG proteins in all experiments (Figure 3B,C). Using a similar analysis strategy as in HEK293T cells, we designated 178 proteins from experiments with both stressors as candidate SG proteins in NPCs (Figure S3D; Table S4). Of these, 45.5% (81/178) are known SG proteins and another 21.3% (38/178) were either closely related to known SG proteins, also identified as SG candidates in HEK293T cells, or independently validated by IF (Figures 3D and 3E; Table S4).
Figure 3. NPCs and HEK293T Cells Contain Distinct but Overlapping Sets of SG Proteins.
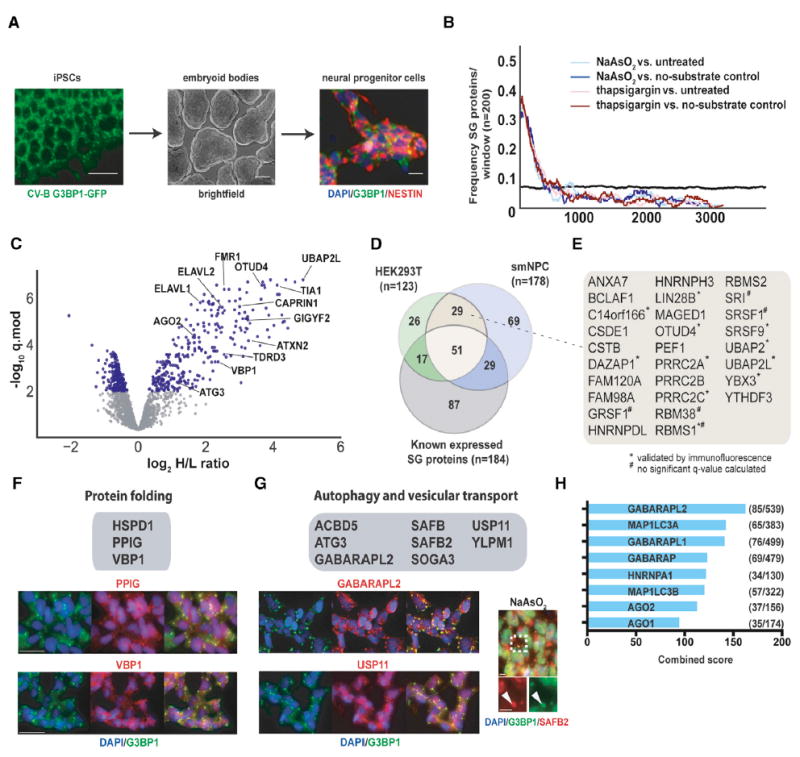
(A) Overview of NPC generation from induced pluripotent stem cells (iPSCs).
(B) Enrichment frequency distribution of known SG proteins in log2 H/L-ranked proteomics datasets. The dashed lines represent 2 times the background frequency of SG proteins across all detected proteins.
(C) Volcano plot showing statistically significant enrichment of selected known and previously unknown neuronal SG proteins in NPCs.
(D) Venn diagram showing the overlap between known SG proteins and SG-APEX hits identified in HEK293T cells and NPCs.
(E) Previously unknown SG proteins identified by SG-APEX in both HEK293T cells and NPCs.
(F) IF images of selected neuronal SG proteins with functions related to protein folding.
(G) IF images of selected neuronal SG proteins with functions in autophagy and vesicular transport.
(H) Ranked list of proteins with the greatest connectivity to SG proteins as determined by the Enrichr gene enrichment analysis tool. Scale bars in (A), (F), and (G), 25 μm. See also Figure S3 and Table S4.
Interestingly, of the combined 221 SG-APEX hits from NPCs and HEK293T cells, 64% (141/221) were identified in only one cell type (Figure 3D). Many of these proteins identified in only one cell type were not detected in sufficient experiments in the other cell line, likely due to incomplete capture of lowly expressed proteins and differences in protein abundance between cell types. Nevertheless, these findings suggested a potentially larger than anticipated cell-type-specific diversity of SG composition and called for further examination through complementary approaches.
Neuronal SG Proteins Function in Cellular Pathways Relevant to Neurodegeneration
We next wanted to evaluate whether the seemingly greater complexity of neuronal SG composition might contribute to rendering these cell types especially vulnerable to environmental stress and subsequent protein aggregation. As expected, several proteins with known neuronal expression and links to neurodegeneration (e.g., CELF2/3, ELAVL2/3/4, and GIGYF1/2) were among the neuronal SG proteins. In addition, we validated the SG association of several previously unknown candidates involved in the regulation of protein folding (HSPD1, PPIG, and VBP1) (Figure 3F). A second pillar of proteostasis is clearance of aggregates, and we identified numerous factors that function in autophagy and related vesicular transport processes (Figure 3G) among our neuronal SG proteins. Several of these (GABARAPL2, YLPM1, and SAFB2) cluster in the ULK-AMPK (AMP-activated protein kinase) subnetwork of the human autophagy system (Behrends et al., 2010), which also contains constitutive SG proteins (G3BP1, USP10, and CDC37) and may integrate aging and the cellular stress response (Salminen and Kaarniranta, 2012). The extent to which SG proteins are surveilled by autophagy factors is further highlighted by the finding that 5 of the 6 proteins with the highest connectivity to an extended list of SG candidates comprising all 361 APEX hits and previously known SG proteins are members of the ATG8 family of small ubiquitin-like modifiers (Figure 3H). Indeed, ~16% of all GABARAPL2 (85/539) and 17% of all MAP1LC3A (65/383) interactions are with SG proteins, which together represent ~2.5% (361/14,352) of all proteins in the PPI dataset (Figure 3H), suggesting that tight surveillance of SG proteins through interactions with ATG8 proteins may facilitate the important role of autophagy in SG clearance (Buchan et al., 2013).
High-Throughput Imaging of RBPs Reveals Stress- and Cell-Type-Specific SG Composition
As SG proteins are strongly enriched for RBPs, highly validated antibodies against >300 human RBPs (Sundararaman et al., 2016) were combined with a screening pipeline involving systematic IF labeling followed by high-content microscopy and image analysis (Figure 4A) to further characterize the repertoire of SG-associated RBPs. SGs have been known to exhibit stress-dependent variability in composition (Aulas et al., 2017), but to our knowledge, the extent of this variability has not been comprehensively evaluated. To systematically determine the degree to which SG composition varies by stress type, we exposed HeLa cells to either NaAsO2 or heat shock (30 min at 42°C) and performed a screen with our RBP antibody collection. Of the 313 RBP antibodies tested, 17% (52 RBPs) localized to SGs. Among these, 77% (40/52) localized to SGs under both stress conditions, while 23% (12/52) exhibited stress-type-specific SG targeting (Figures 4B–4D; Table S5). For example, UBAP2L robustly localized to SGs in both stress conditions, while SG-association of NOLC1 and SF1 was specific to NaAsO2 or heat shock, respectively (Figures 4B and 4D). We next conducted parallel screens in three different cell types (HepG2, HeLa, and NPCs) treated with NaAsO2. We identified a total of 77 SG-RBPs, with over half of these (42/77) localizing to SGs in all three cell types and the remaining 35/77 proteins exhibiting varying degrees of cell-type specificity (Figures 4E–4G; Table S5). For example, UBAP2L co-localized with SGs in all cell types, while SRSF9, EIF3A and SRP68 were selectively targeted to SGs in HepG2 cells, HeLa cells, or NPCs, respectively (Figures 4E and 4G). Notably, consistent with our APEX results, we found that about one third (28/77) of SG-RBPs localized to SGs in NPCs but failed to do so in at least one of the other cell types tested. To summarize, 120 proteins were found to associate with SGs in NPCs but were absent from SGs in at least one other cell type. While these proteins may not be exclusive to SGs in neuronal cells, we refer to them as neuronal SG proteins here because they show a neuronal preference due to either higher expression levels or cell-type-specific SG targeting. This systematic survey of celltype- specific SG-RBPs further extends our SG compendium and shows that neuronal cells exhibit a greater diversity in SG composition than non-neuronal cells. The observation that 75% (90/120) of neuronal SG proteins had not previously been associated with SGs further highlights that past studies using common immortalized cell lines have missed potentially important neuronal SG proteins.
Figure 4. An RBP-Centered Imaging Screen Identifies Stress- and Cell-Type-Specific SG Components.
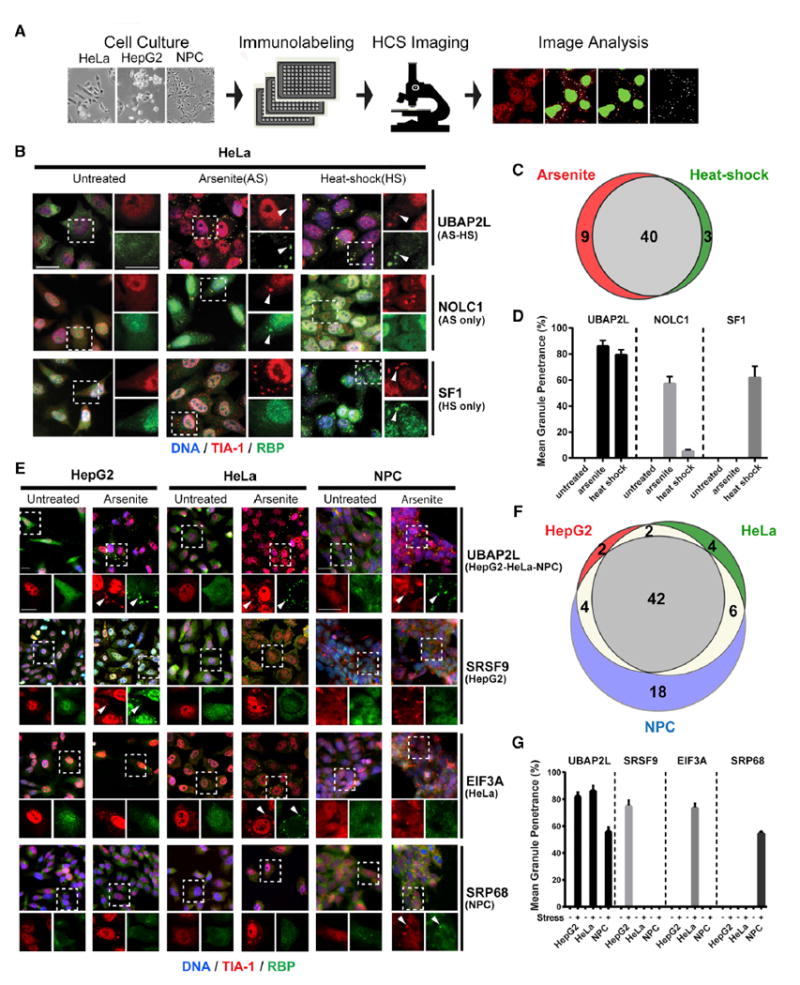
(A) High-content imaging (HCI) screen outline to identify SG-localized RBPs in HepG2 cells, HeLa cells, and NPCs.
(B) IF images showing examples of RBP localization in untreated, NaAsO2 (AS)-treated, and heat-shock (HS)-treated HeLa cells. UBAP2L is a common hit in both stress conditions; NOLC1 and SF1 are specific to NaAsO2 and heat shock, respectively. Left panels are merged lower-resolution views, and right panels represent zoomed-in views of the indicated selection separately showing TIA-1 (red) or the test RBP (green). Arrowheads indicate co-localization of the test RBP with TIA1.
(C) Venn diagram comparing SG proteins in HeLa cells treated with NaAsO2 versus heat shock.
(D) Quantification of the mean granule penetrance of proteins with either constitutive (UBAP2L) or stress-type-specific (NOLC1 and SF1) SG localization.
(E) IF images showing examples of RBP localization in untreated and NaAsO2-treated HeLa cells, HepG2 cells, or NPCs. UBAP2L is found in SGs in all three cell types, while SRSF9, EIF3A, and SRP68 are specific to HepG2 cells, HeLa cells, and NPCs, respectively. Top panels are merged lower-resolution views, while the bottom panels represent zoomed-in views of the indicated selection separately showing TIA-1 (red) or the test RBP (green). Arrowheads indicate examples of RBPs co-localized with TIA-1.
(F) Venn diagram comparing SG proteins in HepG2, HeLa and NPCs treated with NaAsO2.
(G) Mean granule penetrance of proteins with either cell-type-independent or cell-type-specific SG localization. Scale bars in (B) and (E), 20 μm. Error bars in (D) and (G) represent SD. See also Table S5.
SGs Vary in Composition and Subcellular Localization in iPSC-Derived Motor Neurons
The components of SGs, as well as the molecular interactions that determine SG dynamics are increasingly implicated in human neurological disorders, including ALS. As motor neurons (MNs) are the most severely affected cell type in ALS, we next characterized the SG-targeting behavior of RBPs in iPSCderived MNs (iPS-MNs; Figure S4A). We first carried out IF staining for 63 (of 77) SG-RBP hits in control iPS-MNs that were either untreated or treated with NaAsO2 or puromycin, which robustly induces SGs in iPS-MNs after a 24-hr treatment without overt toxicity (Martinez et al., 2016). In unstressed iPS-MNs, 57% (36/63) of RBPs localized primarily to cell bodies (e.g., IGF2BP3; Figures 5A and 5B), whereas 43% (27/63) of RBPs also showed clear localization to projecting neurites (e.g., SND1; Figures 5A and 5B). Following stress treatments, we identified 51 RBPs that co-localized with G3BP1-labeled SGs (Table S6), most of which (49/51) localized to SGs in both NaAsO2- or puromycintreated cells, while two (DAZAP1, ZC3H11A) were selectively targeted in response to puromycin. Both SND1 and IGF2BP3 colocalized with G3BP1-labeled SGs in cell bodies, while SND1 was also present in granules along neurites (Figure 5A). We conclude that stress-induced granules of varying composition form in a subcellular compartment-specific manner in human iPS-MNs.
Figure 5. SG Composition and Subcellular Distribution Is Altered in ALS-Patient-Derived iPS-MNs.
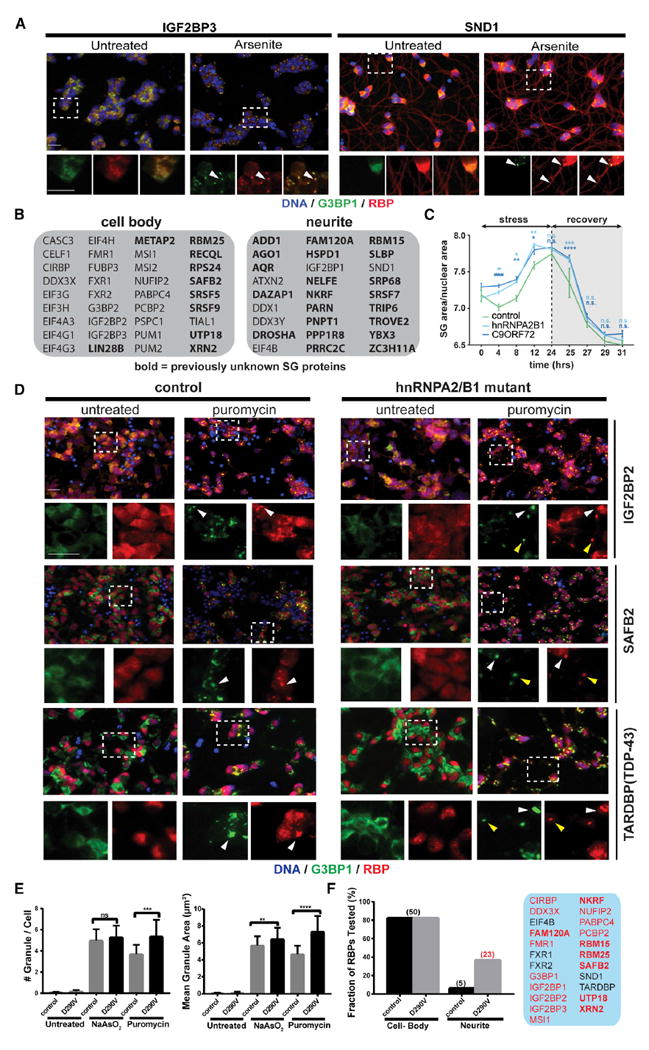
(A) IF images of SND1 and IGF2BP3 localization in unstressed or NaAsO2-treated iPS-MNs. Top panels are merged lower-resolution views, while the bottom panels represent zoomed-in views of the indicated selection separately showing G3BP1 (green) or the test RBP (red). Arrowheads indicate examples of RBPs co-localized with G3BP1.
(B) Overview of RBPs whose localization in unstressed iPS-MNs is either restricted to the cell body or extends into neuronal projections.
(C) Time-course analysis of SG formation in iPS-MNs from controls or from ALS patients bearing mutations in HNRNPA2B1 or C9orf72, respectively.
(D) IF images of control and HNRNPA2B1 mutant iPS-MNs that were either untreated or stressed with puromycin. Top panels are merged lower-resolution views, while the bottom panels represent zoomed-in views of the indicated selection separately showing G3BP1 (green) or the test RBP (red). White and yellow arrowheads indicate examples of SGs formed in cell bodies or neurites, respectively.
(E) Quantification of SG area and number in untreated or stressed control and HNRNPA2B1 mutant iPS-MNs.
(F) Quantification of RBPs that localize to SGs in cell bodies or dendritic projections in control versus HNRNPA2B1 mutant cells. The RBPs exhibiting targeting to SGs in projections in HNRNPA2B1 mutant cells are highlighted in the panel on the right.
Scale bars, 20 μm. Error bars in (C) and (E) represent SD. Statistical significance was calculated by 2-way ANOVA (C) or Student’s t test (E). *p ≤ 0.05; **p ≤ 0.01; ***p ≤ 0.001; ****p ≤ 0.0001. See also Figure S4 and Table S6.
SG Composition and Subcellular Distribution Are Affected in iPSC Models of ALS
ALS-associated mutant versions of FUS, hnRNPA2/B1, and TIA1, as well as dipeptide repeats (DPRs) derived from an expanded GGGGCC (G4C2) repeat in C9orf72, were recently reported to affect rate and dynamics of SG formation (Boeynaems et al., 2017; Lee et al., 2016; Lin et al., 2016; Mackenzie et al., 2017; Martinez et al., 2016; Murakami et al., 2015; Patel et al., 2015). Expanding on our previous study using iPS-MNs carrying the ALS-associated D290V mutation in HNRNPA2B1 (Martinez et al., 2016), we observed an increased rate of formation as well as impaired early clearance of puromycin-induced G3BP1-positive SGs in both HNRNPA2B1 and C9orf72 mutant iPS-MNs (Figure 5C). Surprisingly, in addition to an increased propensity to form SGs (Figure 5E), screening of HNRNPA2B1 mutant iPS-MNs with our SG-RBP antibodies also revealed mutation-specific differences in the subcellular distribution of SG-RBPs (Figures 5D and 5F). In control cells, most analyzed RBPs localize primarily to SGs in the cell body upon puromycin treatment. In contrast, almost half (23/50) of SG-RBPs also localized to prominent granules in neurites in HNRNPA2B1 mutant cells (such as IGF2BP1/2/3, SAFB2, PCBP2, NKRF, and FAM120A; shown in Figures 5D and 5F; Figure S4B). Additionally, even for proteins that were found in neurite-localized granules in both control and mutant cells (such as the ALS-associated protein TDP-43), their localization to neurite-localized SGs appeared more pronounced in HNRNPA2B1 mutant cells (Figure 5D). The RBPs found in neurite-localized SGs were enriched in functions such as RNA transport and translational suppression (Figure S4C), which is consistent with and extends previous studies reporting that axonal transport is impaired in ALS motor neurons (Alami et al., 2014; Yasuda and Mili, 2016). Altogether, our findings confirm aberrant SG dynamics across ALS-associated mutations and highlight abnormal SG distribution and composition in the projections of HNRNPA2B1 mutant iPS-MNs, which provide further insights into ALS pathogenesis.
Cross-Comparison with Related Datasets Identifies Disease-Relevant SG Proteins
Together, our APEX and IF screening approaches identified 260 SG proteins, including ~150 candidates that had not previously been associated with SGs. Consistent with known SG proteins, our hits are enriched for RBPs (201/260 [77.3%]; Figure 6A) with a range of RNA-binding domains (Figure 6B) and gene ontology (GO) terms associated with RNA metabolism and translational control (Figure 6C). They also contain a significantly higher proportion of amino acid residues in IDRs and LCDs (Figure 6D) than the background proteome, consistent with LLPS being a driver of SG assembly. To place in context how individual SG proteins might be connected to disease, we integrated our SG compendium with 11 published datasets related to protein aggregation in neurodegeneration (Figure 6E; Table S7) (Blokhuis et al., 2016; Freibaum et al., 2010; Jain et al., 2016; Kato et al., 2012; Lee et al., 2016; Lin et al., 2016; March et al., 2016). While these diverse datasets are not expected to overlap completely, their cross-comparison can nevertheless be useful for situating each individual study into a greater context. Furthermore, ranking the proteins by how frequently they occur across all datasets can help identify features of the most consistently observed proteins and prioritize candidate genes for follow-up studies.
Figure 6. Integrative Data Analysis Highlights Potential Disease-Relevant Proteins.
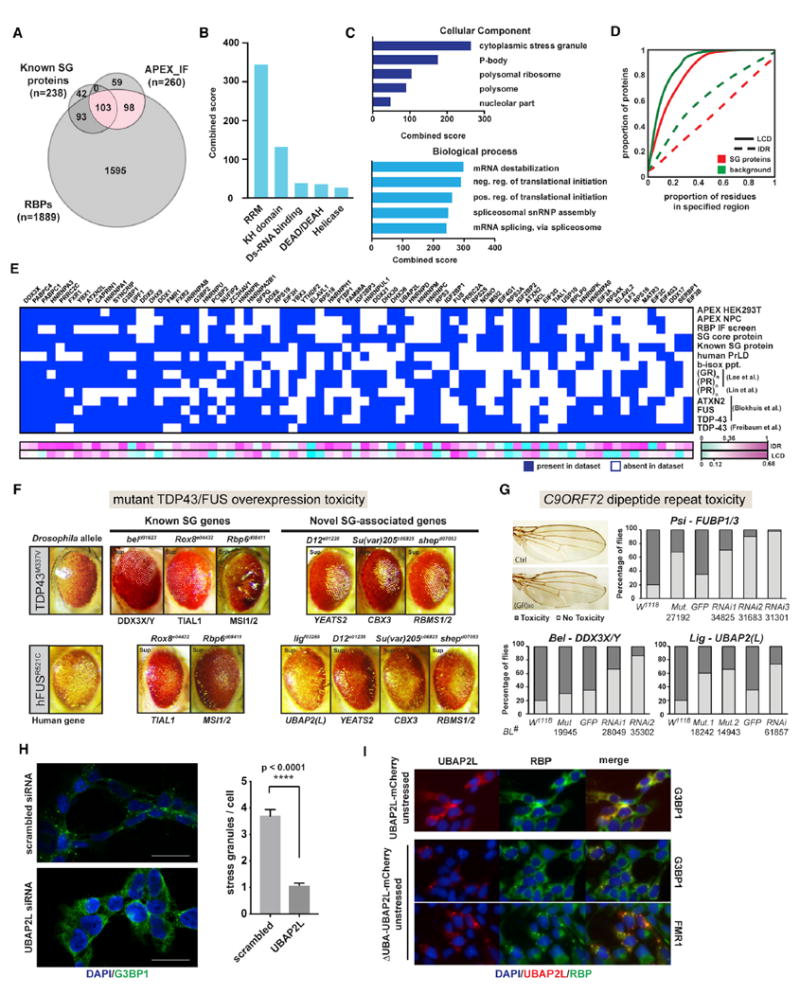
(A) Venn diagram showing overlap between proteins identified in our combined APEX-IF approach, known SG proteins, and RBPs.
(B) Protein domain enrichment analysis of 260 SG APEX-IF.
(C) Gene ontology analysis for 260 APEX-IF hits.
(D) Comparison of the proportion of amino acids in LCDs and IDRs between APEX-IF hits and background.
(E) Heatmap for the 75 proteins most broadly represented across selected SG and neurodegeneration-relevant datasets. Heatmap indicates whether a protein is present (blue box) or absent (white box) from each dataset, and proteins are ranked by the number of datasets they are part of in descending order from left to right.
(F) Images of Drosophila eye degeneration models crossed with the indicated strains.
(G) Images and quantitation of the wing notching phenotype caused by poly(GR) toxicity in flies. w1118 flies were used as the control for genetic mutant alleles, while UAS-GFP served as the control for different UAS-RNAi lines. Numbers indicate Bloomington stock numbers for each mutant or RNAi line.
(H) IF images of G3BP1 staining and quantification of SG numbers in HeLa cells treated with control siRNA or siRNA targeting UBAP2L. Data are presented as mean ± SEM, and statistical significance was determined by two-tailed unpaired t test.
(I) IF images of 293FITR cells with inducible expression of either a full-length UBAP2L-mCherry fusion protein (top panel) or a truncated UBAP2L-mCherry fusion protein missing the N-terminal UBA domain (middle and bottom panels).
Scale bars in (H) are 25 μm. See also Figure S5 and Table S7.
Of the 1,312 proteins found across the 14 datasets, almost two thirds (840/1,312) were present in only a single dataset (Figure S5B) and only 5% (71/1,312) were found in at least half of the datasets. Remarkably, all of these 71 proteins and indeed 96% (192/200) of the top 200 proteins are RBPs, many with higher proportions of LCDs and IDRs (Figure 6E) than the background proteome. Many well-studied SG proteins with roles in neurodegeneration (e.g., FUS, ATXN2, and FMR1) are broadly represented, as are several less well-characterized and previously unknown SG proteins that warrant further investigation.
SG Components Modify Disease Protein Toxicity in Drosophila ALS/FTD Models
To further confirm the disease-relevance of known and previously unidentified SG proteins in vivo, we used several Drosophila models of ALS/FTD to examine disease protein toxicity in both neuronal and non-neuronal cells. Mis-expression of ALS-linked mutated hTDP-43M337V or hFUSR521C, respectively, causes a neurodegenerative rough eye phenotype (unpublished data; Lanson et al., 2011; Ritson et al., 2010). We recently carried out a genome-wide screen for genetic modifiers of TDP-43 and FUS toxicity (unpublished data), which we intersected with our SG protein data. Not unexpectedly, we identified several SG-RBPs as modifiers of TDP-43 and FUS-mediated toxicity (Figure 6F). In addition to the TDP-43 and FUS models, we performed genetic interaction studies to test several selected SG proteins for their ability to modify toxicity caused by overexpression of a _C9orf72_-ALS/FTD associated poly(GR) in the Drosophila wing (Yang et al., 2015). We tested 9 candidate genes, either by multiple RNAi knockdown or through genetic mutant alleles, and found that partial loss of activity for more than half (5/9) significantly rescued poly(GR) toxicity (Figure 6G; Figure S5C). Although the detailed mechanisms underlying these genetic interactions remain to be further investigated, our Drosophila results identify several previously unknown SG proteins, such as CBX3, CSDE1, RBMS1/2, UBAP2(L), and YEATS2, as potentially disease-relevant factors (Figures 6F and 6G), underscoring again that alterations in SG components can affect neurodegenerative phenotypes.
We selected one of these previously unknown SG-associated disease-modifiers, UBAP2L, for evaluation in human cells, as it was consistently among the most robustly SG-associated proteins by both SG-APEX and IF across all cell types and stress conditions tested (Figures 4B and 4E). We found that depletion of UBAP2L by small interfering RNA (siRNA) in HeLa cells almost completely abolished NaAsO2-induced SG formation (Figure 6H), establishing UBAP2L as an essential regulator of SG assembly. It is among the most disordered proteins in the human proteome, with 99.4% of its 1,087 amino acids considered to fall within IDRs (Figure S5D), suggesting a potential for UBAP2L to undergo LLPS. Interestingly, while inducible expression of an UBAP2L-mCherry fusion protein recapitulated endogenous UBAP2L localization, a truncated version lacking the N-terminal ubiquitin-associated UBA domain (ΔUBA_UBAP2L-mCherry) led to widespread formation of aggregates containing the SG proteins G3BP1, FMR1, and ELAVL1 even in the absence of stress (Figure 6I; Figure S5E). Our findings reveal UBAP2L as an excellent future candidate to study how protein aggregation might be regulated both in the absence or presence of cellular stress.
DISCUSSION
In this study, we extend the application of in vivo APEX proximity labeling combined with quantitative proteomics to the study of highly dynamic, non-membranous RNP granules. In combination with an RBP-focused IF screen, we identify ~150 proteins not previously known to associate with SGs. We estimate that up to 20% of components may be recruited to SGs in a cell-typeor stress-type-specific manner. Interestingly, neuronal cells appear to contain compositionally more diverse SGs, and many of the components have reported functions in PQC pathways such as chaperone-assisted protein folding and aggregate clearance by autophagy. Defects in PQC have been implicated in the development of neurodegeneration (Ciechanover and Kwon, 2017), and our observation might help explain why neuronal cells are especially dependent on accurate regulation of protein homeostasis. We implemented our SG-APEX approach by tagging the endogenous G3BP1 locus in iPSCs, which not only minimizes potential artifacts from G3BP-APEX2-GFP overexpression but also opens the possibility of studying SGs in a wide range of differentiated cell types from a constant genetic background. Future studies using a combination of different APEX2-tagged proteins will make it possible to further dissect the molecular architecture of RNPs and enable the distinction of closely related subtypes of RNP granules such as P-bodies, as well as the characterization of cell-type-specific granules such as neuronal transport granules.
In addition to providing a resource of nearly 150 previously unknown candidate SG proteins for further validation, our study links many known and previously unidentified SG proteins to human disease and provides unexpected and exciting insights into SG biology and how it relates to neurodegeneration (Figure 7). First, our SG-APEX data in stressed and unstressed cells, combined with independent PPI data, show that much of the underlying network of SG protein interactions already exists in unstressed cells. This finding sharpens the picture of a highly evolved and dense network of RNPs that integrates the many steps of gene expression regulation. As a result, although SGs appear to form de novo in response to stress, their emergence represents a moderate and transient shift in a tightly controlled equilibrium of protein-protein and protein-RNA interactions (Figure 7A). Allocating high local concentrations of processing factors and substrates into interconnected RNP assemblies enables highly efficient processing to take place but at the same time increases the risk of uncontrolled protein aggregation. As a result, cells have evolved mechanisms for efficiently resolving transient higher-order RNP assemblies, especially in the context of a temporary stress response. Our results highlight how SG proteins are tightly integrated with PQC pathways, most strikingly through close surveillance by the ATG8 family of autophagy mediators. Interestingly, neuronal cells display a greater diversity in SG composition compared to non-neuronal cells, and numerous PQC factors localize specifically to neuronal SGs, potentially providing an explanation to why neurons are especially vulnerable to environmental stresses (Figure 7B). Lastly, we demonstrate that iPS-MNs harboring ALS-associated mutations in HNRNPA2B1 form SGs more readily and that mutant cells are more prone to forming SGs along neuronal projections, which differ in their composition from SGs found in the soma (Figure 7C). These neurite-localized SGs are enriched in proteins involved in RNA transport and translational repression, suggesting a mechanism by which genetic mutations could interact with environmental factors to widely impair axonal transport and contribute to axon degeneration in ALS.
Figure 7. SG Form from Pre-existing PPIs Are Especially Diverse in Neuronal Cells and Display Aberrant Characteristics in ALS Mutant Cells.
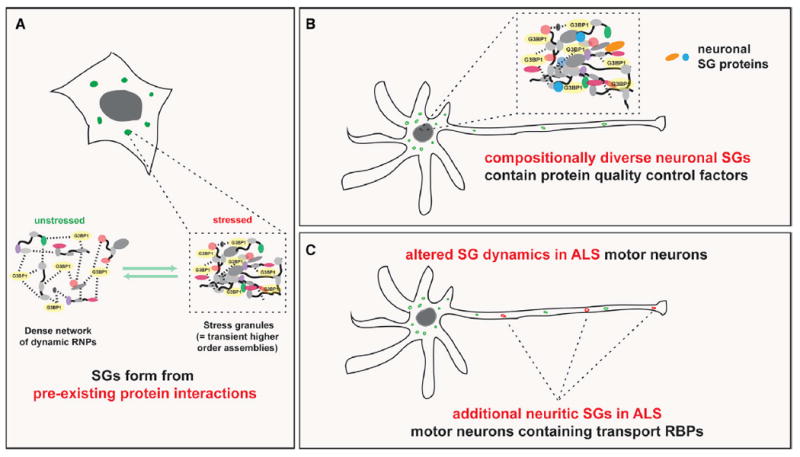
(A) Model of the relationships among normally functioning, dynamic RNPs, transient SGs, and permanent pathological protein inclusions.
(B) Schematic showing that neuronal SGs are diverse and contain proteins involved in protein quality control pathways.
(C) Schematic showing altered SG dynamics, composition, and subcellular distribution in ALS mutant motor neurons.
Much attention is currently being focused on understanding how exactly the known ALS-linked mutations in multifunctional RBPs alter the structure and function of these proteins to result in aberrant protein aggregation. However, as emphasized by the late onset and cell-type specificity of disease symptoms, these genetic factors only result in pathology once other components of the regulatory system that normally prevent long-lived RNP aggregation begin to fail. Future work should focus on identifying the critical factors and mechanisms in this system. The SG protein compendium we present here suggests possible future directions and provides a framework for identifying previously unknown important regulators. We present the example of UBAP2L, which is not only essential for SG formation but also can seed spontaneous protein aggregates when the ubiquitinassociated region of the protein is removed. It is likely that modulation of UBAP2L levels can have a similar effect as reduction of ATXN2, which was recently shown to ameliorate TDP-43 toxicity in mice (Becker et al., 2017). Beyond UBAP2L, many poorly characterized proteins with potential relevance to aggregation can be identified and prioritized from our cross-comparison of more than a dozen SG- and neurodegeneration-associated PPI datasets, combined with the added biological context of whether a specific RBP localizes to aberrant SG in ALS mutant iPS-MNs or can modify neurodegenerative phenotypes in flies.
In summary, it is critical to recognize that broad inhibition of the PPIs that underlie SG formation will also affect the dense RNP network in unstressed cells. Promising therapeutic strategies will therefore likely need to specifically target those mechanisms that only result in aberrant insoluble protein inclusions. Our work represents a step along this path, which so far has been hindered by a sparsity of promising targets as well as a lack of robust disease-associated phenotypes in living cells.
STAR★METHODS
CONTACT FOR REAGENT AND RESOURCE SHARING
Further information and requests for resources and reagents should be directed to and will be fulfilled by the Lead Contact, Gene W. Yeo (geneyeo@ucsd.edu). Important plasmids described in this study will be deposited in the Addgene plasmid respository and available under a standard MTA.
EXPERIMENTAL MODEL AND SUBJECT DETAILS
Immortalized human cell lines and human pluripotent stem cells (hiPSCs) were utilized in this study. The Lenti-X HEK293T cell line is derived from human female tissue, the HepG2 cell line is derived from human male hepatocellular carcinoma tissue and HeLa S3 cells are derived from human female cervical adenocarcinoma tissue. HEK293T and HeLa cells were maintained in DMEM and HepG2 cells in Hyclone growth medium both supplemented with 10% fetal bovine serum and 1% penicillin/streptomycin at 37°C in a humidified incubator under 5% CO2. hiPSCs were maintained under feeder-free conditions in mTeSR1 medium (Stem Cell Technologies) and propagated either by single-cell passaging using Accutase or clump-passaging using enzyme-free dissociation buffer (EDTA). Flies were reared on standard yeast-agar-cornmeal medium and crosses were performed at 25°C. The degenerative eye phenotype was assessed two weeks after the crosses were performed, while the wing margin notching phenotype was scored in 3-5 days old adult flies of the F1 generation.
METHOD DETAILS
Generation and maintenance of neural progenitor cells
Small molecule neural progenitor cells (smNPCs) were grown in medium consisting of DMEM/F12+Glutamax, 1:200 N2 supplement, 1:100 B27 supplement, penicillin/streptomycin (Life technologies), 100μM ascorbic acid (Sigma, A4544), 3μM CHIR99021 (CHIR, Tocris 4423) and 0.5μM Purmorphamine (PMA) (Tocris 4551 and passaged using Accutase. Generation of smNPCs from iPSCs was adapted from (Reinhardt et al., 2013). Briefly, human iPSCs at 70%–80% confluency were dissociated using accutase and resuspended at 1×10⁶ cells/ml in N2B27 medium (DMEM/F12+Glutamax, 1:200 N2 supplement, 1:100 B27 supplement, 150μM ascorbic acid and 1% Penicillin/Streptomycin) supplemented with 1μM Dorsomorphin, 10μM SB431542, 3μM CHIR99021, 0.5μM Purmorphamine (PMA) and 5μM Rock inhibitor (Y-26732). 3 million cells were transferred into one well of an uncoated 6-well tissue culture plate and incubated at 37°C, 5% CO2 on a shaker at 90rpm. Uniform small EBs formed within 24h and increased in size over the following days. After 48h a full media change was performed with N2B27 medium supplemented with D, SB, CHIR and PMA. At this time, about 2/3 of EBs were either discarded or EBs were split across 3 wells of a 6-well plate to reduce the high cell density required initially to ensure uniform formation of embryoid bodies. On days 3-5, half medium changes were performed with fresh N2B27 + D, SB, CHIR and PMA. On day 6, dorsomorphin and SB were withdrawn and a full medium change with smNPC medium (N2B27 + 3μM CHIR + 0.5μM PMA) was performed. At this stage, neuroepithelial folds were clearly visible in all EBs. On day 8, EBs were triturated by pipetting 10-15 times with a P1000 pipette and plated onto matrigel-coated 6-well or 10cm plates (~1 well of a 6-well plate per 10cm plate). After 3-4 days, attached EB fragments and outgrown cells were dissociated to single cells with accutase and split at a 1:6 to 1:8 ratio onto matrigel. After the first passage, cells were passaged at a 1:10 to 1:15 ratio every 3-6 days. For the first few passages, large flat non-smNPCs could be observed between smNPC colonies, but progressively disappeared no later than passages 3-6 in almost all cell lines.
Generation of iPSC-derived motor neurons
Motor neurons were differentiated from iPSCs as described in (Martinez et al., 2016). Briefly, human iPSCs were grown plated into matrigel-coated 6-well plates or 10cm culture dishes to reach 70%–90% confluency in mTeSR1 medium within 2-3 days. On day 1 of the differentiation protocol, medium was changed to N2B27 medium (DMEM/F12+Glutamax, 1:200 N2 supplement, 1:100 B27 supplement, 150μM ascorbic acid and 1% Penicillin/Streptomycin) supplemented with 1μM Dorsomorphin, 10μM SB431542, 3μM CHIR99021. Cells were maintained with daily medium changes in the same medium for 6 days. On day 7, medium was changed to N2B27 medium (DMEM/F12+Glutamax, 1:200 N2 supplement, 1:100 B27 supplement, 150μM ascorbic acid and 1% Penicillin/Streptomycin) supplemented with 1μM Dorsomorphin, 10μM SB431542, 200nM Smoothened Agonist (SAG) and 1.5uM retinoic acid (RA). Medium was changed daily with increasing volumes to adjust for cell density until day 18. At day 18 of differentiation, cells were dissociated using Accutase and either plated directly for continued differentiation or optionally expanded in motor neuron progenitor (MNP) medium as described in (Du et al., 2015). Optionally, after dissocation, cells were plated onto matrigel-coated 10cm plates at a density of 3-5 million cells per plate into N2B27 medium supplemented with 3 μM CHIR99021, 2 μM DMH1, 2 μM SB431542, 0.1 μM RA, 0.5 μM Purmorphamine and 0.5mM valproic acid (VPA). Cells were maintained for no more than 5 passages under these conditions with weekly splitting using Accutase at 1:8-1:12 before final differentiation. For continued differentiation, cells were plated at a density of ~10 million cells per plate into 10cm plates plate serially coated with 0.001% (= 0.01mg/ml) poly-D-lysine (PDL, Sigma, P6407) and poly-L-ornithine (PLO, Sigma, P3655) followed by 20ug/ml laminin (Life technologies, 23017015). Cells were plated into N2B27 medium supplemented with 200nM SAG and 1.5uM RA and 10uM rock inhibitor. Medium was changed on day 20 and cells transferred into N2B27 medium supplemented with 2uM DAPT on day 22. For imaging, cells were dissociated again at day 23 and plated into PDL/PLO/laminin-coated 96-well plates. Medium as changed into N2B27 medium without additional small molecules on day 25 and cells were maintained with medium changes every 2-3 days thereafter. Cells were stressed and fixed between day 29-32 of differentiation.
Plasmid construction
To generate the donor vectors used to tag the endogenous G3BP1 locus in human cells, we modified the HR120PA-1 targeting vector (System Biosciences (SBI)) by replacing GFP with an APEX2-(GGGGS)2-GFP fusion protein. ~1.5kb arms of homology were amplified from genomic DNA using primers that introduced ~35bp overhangs with the targeting vector template on each end. The final G3BP1-targeting vector was assembled by Gibson assembly. G3BP1-APEX2-GFP was co-transfected with Cas9 expression vector px458 (gift from Feng Zhang, Addgene plasmid #48138) into HEK293T cells using lipofectamine 2000 or electroporated into CV-B iPS cells using an Amaxa Nucleofector with Stem Cell Kit 1 and pulse setting B-016. 48-72h post-transfection, puromycin was added to the medium at 1ug/ml and cells kept in selective medium for 2-4 days. After 10-14 days, homogeneously green fluorescent single-cell derived colonies were manually picked under a stereomicroscope, expanded and tested for APEX2 activity.
For UBAP2L overexpression experiments, full-length and ΔUBA-UBAP2L-mCherry fusion constructs were cloned into pLIX_403 (gift from David Root, Addgene plasmid # 41395) and packaged into lentiviral particles. MNPs were transduced and selected with 2μg/ml puromycin (Life technologies, A1113803) for 7 days starting 2 days post-transduction. Expression was induced by adding 100ng/ml doxyxycline for 24h. To induce SG formation, cells were treated with 250μM (NPCs, MNs) or 500μM (HEK293T, HeLa, HepG2 cells) NaAsO2 for 30min (HeLa cells) or 1h (NPCs, MNs, HEK293T and HepG2 cells). Alternatively, SG formation was induced by treatment with 10ug/ml puromycin for 24h (MNs), 500nM thapsigargin (NPCs) or by heat shock for 30min at 45°C (HeLa, HepG2 cells).
SILAC labeling with isotopically modified amino acids
For SILAC experiments, DMEM without L-arginine and L-lysine (Pierce catalog no. PI88420) was supplemented with 10% dialyzed FBS (Pierce, PI88440), penicillin/streptomycin, and 0.4mM and 0.8mM, respectively, of either unlabeled L-Lysine:HCL and L-Arginine:HCl (Sigma, cat no. L8662 and A6969) or isotopically labeled L-Lysine: 2HCl (13C6, 15N2) and L-Arginine:HCl (13C6, 15N4) (Cambridge Isotope laboratories, cat no. CNLM-291 and CNLM-539). Both heavy and light medium were additionally supplemented with 200mg/ml L-Proline (Sigma, cat no. P5607).
For SILAC labeling of smNPCs, DMEM/F12 without L-arginine and L-lysine (Pierce catalog no. PI88215) was used instead of regular DMEM/F12 and supplemented with 0.7mM and 0.5mM, respectively, of either unlabeled L-Lysine:HCL and L-Arginine:HCl (Sigma, cat no. L8662 and A6969) or isotopically labeled L-Lysine: 2HCl (13C6, 15N2) and L-Arginine:HCl (13C6, 15N4) (Cambridge Isotope laboratories, cat no. CNLM-291 and CNLM-539).
APEX-mediated biotinylation
HEK293Ts and NPCs were grown in heavy or light SILAC medium for at least 5 passages prior to APEX labeling and isotope label incorporation efficiency was confirmed to be above 98%. Cells were seeded in 10cm culture dishes one day prior to labeling to be ~80% confluent the following day and either left unstressed or treated with either 250μM (NPCs) or 500μM (HEK293T) NaAsO2 or 500nM thapsigargin for 1h at 37°C. 500μM biotin-phenol (BP) was added to the medium at the same time as stressors except for the no-substrate control samples. APEX labeling was performed by adding hydrogen peroxide to a final concentration of 1mM for 60 s before quenching the biotinylation reaction by adding Trolox ((+/−)-6-Hydroxy-2,5,7,8-tetramethylchromane-2-carboxylic acid, Sigma 238813) and sodium L-ascorbate (Sigma A4034) to a final concentration of 5 and 10mM, respectively. Samples were washed once with cold PBS, collected using cell scrapers, pelleted for 3min at 300 g and immediately suspended in cold lysis buffer (8M urea, 150mM NaCl, 20mM Tris-HCl pH 8.0, Protease Inhibitor Cocktail Set III, EDTA-Free (EMD Millipore, cat no. 539134), 5mM Trolox and 10mM sodium L-ascorbate). Samples were sonicated and cleared by centrifugation at 12000rpm for 10min at 4°C. Protein concentration was determined using by 660nm protein assay (Pierce, PI22660) and equal amounts of protein from corresponding light and heavy labeled samples were mixed for a total of 2-4mg of protein. Samples were diluted to 2M urea by adding 3 volumes of 150mM NaCl, 20mM TrisHCl pH 8.0 with protease inhibitors and quenchers. For affinity purification, ~100ul of streptavidin magnetic beads (Pierce, PI88817) were washed once in 2M urea buffer, resuspended directly in the sample, incubated for 2h at room temperature and washed 8 times in 2M urea buffer. Following the washes, beads were centrifuged at 240 RCF for 5 min at 4°C. The supernatant was removed and a volume of 50mM Ammonium bicarbonate buffer equal to the volume of the beads was added. For the on-bead digestion of the IP samples, the ammonium bicarbonate buffer was removed and replaced with an equal volume of 20mM Tris pH8.0 with endoproteinase Lys-C (Wako) at a 1:100 (w/w) enzyme substrate ratio. Samples were incubated for 1hr at 37°C. Following the Lys-C digestion, CaCl2 was added to a final concentration of 1mM along with 500ng sequencing grade trypsin (Promega). The corresponding input samples for each IP were diluted to a final urea concentration of 1M using 50mM Ammonium bicarbonate. Lys-C digestion was done as described above for the IP samples followed by trypsin digestion with a 1:100 (enzyme: protein) ratio After trypsin addition, all samples were incubated at 37°C for overnight with agitation. After the digestion, an equal volume of 5% formic acid was added to the digestion mixture and incubated at room temperature for 10 minutes. The supernatant was transferred to a new 1.5mL tube and the elution step was repeated one more time. The trypsin-digested input and IP samples were concentrated and desalted using the Stage-Tip method and reconstituted in a 5%Formic acid/5% acetonitrile for MS analysis.
IF, imaging and image analysis
Cells were fixed for 20 min in 4% formaldehyde, 1X PBS, followed by permeabilization for 10 min with 0.5% Triton, 1X PBS. Cells were rinsed with 1X PBS and blocked with blocking buffer (1X PBS, 2% BSA, 0.02% Triton). Cells were incubated with the primary antibodies against SG marker like TIA1 (TIA1, dilution 1:100, cat.# sc-1751,Santacruz) and antibodies against RBPs Sundararaman et al., 2016) diluted in blocking buffer for 2 hour at room temperature or overnight at 4°C. Then, the cells were thoroughly washed with 1X PBS, 0.2% Tween 20, and incubated for 2 hour with secondary antibodies (Alexa Fluor 647, cat. # A21447, Alexa Fluor 594, cat. # A21207, Life technologies and Alexa Fluor 488, cat. # 111-546-144, JacksonImmuno, dilution 1:500) diluted in blocking buffer. Cells were washed, incubated for 5 min with DAPI and washed again. Cells were stored in the dark at 4°C in 1X PBS or 50% glycerol/PBS for long-term storage. All images were taken using high content screen microscopy, ImageXpress Micro.
Drosophila genetics
Flies were reared on standard yeast-agar-cornmeal medium and crosses were performed at 25°C. Drosophila transgenic strains carrying GAL4 inducible human ALS disease causing alleles of FUS/TLS and TDP-43 were previously described (Lanson et al., 2011; Ritson et al., 2010). Standard genetic procedures were used to generated the GMR-GAL4/CyO, tub-GAL80; UAS-FUS-hR521C/TM6B, Tb and GMR-GAL4, UAS-TDP-43-hM337V/CyO, tub-GAL80 transgenic strains (Periz et al., 2015). Drosophila strains containing the Exelixis insertional disruptions are publically available from the Department of Cell Biology, Harvard Medical School include Rox8e04432, Rbp6d08411, ligf03269, CG2889d07154, _D12_e01238, _Su(var)205_c06825 and _shep_d07053. The dominant effect of the introduction of these inserts on degenerative eye phenotypes of GMR-GAL4; UAS-FUS-hR521C and GMR-GAL4, UAS-TDP-43-hM337V was assessed two weeks after the crosses were performed. Qualitative changes in pigmentation, ommatidial structure and glossiness phenotypes were monitored for enhancement or suppression.
UAS-(GR)80 transgenic fly lines were generated previously (Yang et al., 2015). Vg-Gal4/Cyo; UAS-(GR)80/TM6B flies were crossed with individual genetic mutant or UAS-RNAi lines for a specific gene, which were obtained from the Bloomington Drosophila Stock Center. For crosses with genetic mutant alleles, _w_1118 flies were used as the control. For crosses with UAS-RNAi lines, UAS-GFP served as the control. After the cross, 3-5 days old adult flies of the F1 generation were scored under the dissecting microscope. The number of flies with or without the wing margin notching phenotype was counted.
Protein interaction network analysis
To retrieve protein interaction data and build protein-protein interaction networks, we queried the Proteomics Standard Initiative Common QUery InterfaCe (PSICQUIC) web portal (http://www.ebi.ac.uk/Tools/webservices/psicquic/view/main.xhtml) for PPI data form the mentha, IntAct and MINT databases. We restricted results to only human interactors that had been experimentally validated in AP-MS experiments (i.e., search terms MI:0006: anti bait coimmunoprecipitation and MI:0007: anti tag coimmunoprecipitation). The resulting data were combined with the most recently available dataset based on AP-MS interactions of ~5000 bait proteins from the Bioplex website (http://bioplex.hms.harvard.edu). We used Cytoscape to visualize the resulting PPI dataset consisting of 14,352 nodes and 102,551 non-redundant edges. We extracted PPI data for 361 SG proteins and used the Prefuse Force Directed Layout to visualize the network. The internal Cytoscape Network Analyzer plugin was used to calculate and visualize network parameters.
Protein domain and gene ontology analysis
Domain analysis was done by retrieving PFAM domains through the NCBI Conserved Domains Database (https://www.ncbi.nlm.nih.gov/Structure/cdd/cdd.shtml). Low complexity domains and intrinsically disordered regions were calculated as previously described (Beckmann et al., 2015; Conrad et al., 2016). Gene ontology enrichment analysis and PPI hub analysis was performed through the Enrichr Gene Ontology enrichment tool (http://amp.pharm.mssm.edu/Enrichr/) (Kuleshov et al., 2016). Results were ranked by the ‘combined score’, which combines p value and z-score by multiplication: c = log(p) * z.
QUANTIFICATION AND STATISTICAL ANALYSES
MS data collection and analysis
Samples were analyzed in triplicate using a Q-Exactive mass spectrometer (Thermo Scientific, San Jose, CA) with essentially the same nHPLC and instrument method as described previously (Gendron et al., 2016) with the following modifications: For input samples, peptides were eluted using a 60 min ACN gradient (45 minute 2%–30% ACN gradient, followed by a 5 minute 30%–60% ACN gradient, a 2 minute 60%- 95% gradient, with a final 8 minute isocratic step at 0% ACN) at a flow rate of 250 nl/min. A dynamic exclusion time of 20 s was used and singly charged ions, charge states above 6 and unassigned charge states were excluded. For IP samples, peptides were eluted using a 120 min ACN gradient (100 minute 2%–30% ACN gradient, followed by a 5 minute 30%–60% ACN gradient, a 5 minute 60%- 95% gradient, with a final 10 minute isocratic step at 0% ACN) at a flow rate of 250 nl/min. A dynamic exclusion time of 40 s was used and singly charged ions, charge states above 6 and unassigned charge states were excluded. The resultant RAWfiles were analyzed using Andromeda/MaxQuant (version 1.6.0.16) (Cox and Mann, 2008). Data were searched against a concatenated target-decoy database comprised of forward and reversed sequences from the reviewed UniprotKB/Swiss-Prot FASTA Human database (2015) with GFP and common contaminants appended (~22,000 entries). Arg10 and Lys8 were selected as isotope labels and trypsin was specified for protein digestion. Variable modifications for methionine oxidation and protein N terminus acetylation and a fixed modification for cysteine carbamidomethylation were allowed. A mass accuracy of ± 50ppm was specified for the first search and ± 4.5ppm for the main search. A maximum of 2 missed cleavages and 5 modifications were allowed per peptide and the maximum charge was set to 7. The minimum allowed peptide length was 7 amino acids and matching between runs was enabled for data obtained from the same cell line. The data were filtered using protein, peptide and site level false discovery rates of 0.01. Unique and razor peptides were used for quantification. Matches to common contaminants, reverse identifications and identifications based only on site-specific modifications were removed prior to further analysis.
To determine log2 H/L ratio cutoffs, proteins in each experimental replicate were ranked by descending log2H/L ratios and the fraction of known SG proteins in a rolling window (size = 200) was calculated. A cutoff was determined to be the point at which the frequency of known SG proteins fell below 2 times the background frequency. For each experimental design in HEK293T cells, proteins with log2 H/L ratios above the cutoff in at least 2/3 (Exp. 2-4) or all 3 replicates (Exp.1) were retained as candidates. A final list of 123 candidate SG proteins in HEK293T cells was assembled from all hit candidates in Exp. 3 (stressed G3BP1-APEX2-GFP versus stressed NES-APEX2-GFP) that overlapped with hit candidates from Exp.1 (stressed G3BP1-APEX2-GFP versus unstressed G3BP1-APEX2-GFP) or Exp. 2 (stressed G3BP1-APEX2-GFP versus stressed G3BP1-APEX2-GFP without biotin phenol).
In parallel, individual peptide intensities were analyzed by an empirical Bayes approach (Kammers et al., 2015)using an adaption of the original R script (http://www.biostat.jhsph.edu/~kkammers/software/eupa/R_guide.html) suitable for SILAC data. Briefly, individual heavy and light peptide intensities were log2-transformed and protein-level intensities were calculated from the median of all peptides identified and quantified for each protein. Global median intensity levels were normalized and a moderated two-sample t test was performed, comparing heavy and light intensities for each protein. The resulting moderated p values are corrected for multiple hypothesis testing using a modified Benjamini-Hochberg false discovery rate (FDR) approach to determine a moderated q-value (q.mod) (Storey and Tibshirani, 2003). Proteins identified at a false-discovery rate (moderated q-value) of 0.05 were annotated as significantly different in abundance.
For neural progenitor cells (NPCs), we only performed Exp.1 and 2 in biological duplicates, but using two different stressors (NaAsO2 or thapsigargin) for each experiment. To identify candidate SG proteins in NPCs, we determined log2 H/L ratio cutoffs for each experimental replicate using an identical procedure to that used in HEK293T cells. For each stressor, a candidate list was compiled from proteins with ratios above the cutoff in 3 out of 4 combined replicates of Exps. 1 and 2. The resulting lists were combined to yield an exploratory list of 178 NPC SG candidates. To obtain sufficient power for statistical testing, we combined all 4 replicates of each experimental design obtained with the two stressors. Only proteins with peptide intensity measurements across all 4 replicates were considered in the analysis, somewhat limiting the number of proteins for which statistical significance could be assessed.
Image analysis
MetaXpress v3.1 software was used for all image analysis and quantifications were carried out using an in-house script (see Methods S1).
DATA AND SOFTWARE AVAILABILITY
The accession number for the proteomics data reported in this paper is MassIVE MS data repository (https://massive.ucsd.edu/ProteoSAFe/static/massive.jsp): MSV000081554.
Supplementary Material
S1
S2
S3
S4
S5
S6
S7
S8
KEY RESOURCES TABLE.
| REAGENT or RESOURCE | SOURCE | IDENTIFIER |
|---|---|---|
| Antibodies | ||
| Rabbit polyclonal anti-G3BP1 | MBL International | Cat#RN048PW, RRID:AB_10794608 |
| Mouse monoclonal anti-G3BP1 | EMD Millipore | Cat#05-1938, RRID:AB_10561767 |
| Goat polyclonal anti-TIA1 | Santa Cruz Biotech | Cat#sc-1751, RRID:AB_2201433 |
| Rabbit polyclonal anti-TARDBP | Abnova | Cat#H00023435-A01, RRID:AB_461752 |
| Mouse monoclonal anti-VBP1 | Origene | Cat#UM500063, RRID:AB_2629076 |
| Rabbit polyclonal anti-GABARAPL2 | Genetex | Cat#GTX102006, RRID:AB_1240874 |
| Rabbit polyclonal anti-USP11 | Bethyl | Cat#A301-613A, RRID:AB_1211380 |
| Rabbit polyclonal anti-PPIG | Bethyl | Cat#A302-075A, RRID:AB_1604291 |
| Mouse monoclonal anti-Nestin | EMD Millipore | Cat#MAB5326, RRID:AB_2251134 |
| Rabbit polyclonal anti-Isl1/2 | Santa Cruz Biotech | Cat#sc-30200, RRID:AB_2126589 |
| Mouse monoclonal anti-SMI-31 | EMD Millipore | Cat#NE1022, RRID:AB_10690651 |
| Chemicals, Peptides, and Recombinant Proteins | ||
| Dorsomorphin | Tocris | Cat#3093 |
| SB431542 | Tocris | Cat#1614 |
| Retinoic Acid | Sigma | Cat#R2625 |
| SAG | EMD Millipore | Cat#566660 |
| DAPT | Tocris | Cat#2634 |
| CHIR 99021 | Tocris | Cat#4423 |
| Purmorphamine | Tocris | Cat#4551 |
| DMH-1 | Tocris | Cat#4126 |
| Valproic acid | Tocris | Cat#2815 |
| Puromycin | Thermo Fisher | Cat#A1113803 |
| Thapsigargin | Tocris | Cat#1138 |
| Deposited Data | ||
| Quantitative MS data | This paper | MassIVE repository (https://massive.ucsd.edu) accession MSV000081554 |
| SG core proteome dataset | (Jain et al., 2016) | N/A |
| Protein-protein interaction datasets for ATXN2, C9orf72 DPRs, FUS, OPTN, TDP-43 and UBQLN2 | (Blokhuis et al., 2016) | N/A |
| Protein-protein interaction datasets for TDP-43 | (Freibaum et al., 2010) | N/A |
| Protein-protein interaction datasets for GR dipeptide repeats | (Lee et al., 2016) | N/A |
| Protein-protein interaction datasets for GR dipeptide repeatsPR dipeptide repeats | (Lin et al., 2016) | N/A |
| Human proteins with prion-like domains | (March et al., 2016) | N/A |
| Proteins co-precipitated with biotinylated isoxazole | (Kato et al., 2012) | N/A |
| Experimental Models: Cell Lines | ||
| Human Lenti-X 293T cells | Clontech | Cat#632180 |
| Human HepG2 cells | ENCODE Project | N/A |
| Human HeLa-S3 cells | Lécuyer Lab | N/A |
| HEK293T G3BP1-APEX2-GFP | This paper | N/A |
| HEK293T hPGK-APEX2-GFP | This paper | N/A |
| CV-B iPSCs | (Gore et al., 2011) | N/A |
| CV-B G3BP1-APEX2-GFP | This paper | N/A |
| hnRNPA2/B1 D290V-1.1 hiPSC | Generated in-house (Martinez et al., 2016) | N/A |
| hnRNPA2/B1 D290V-1.2 hiPSC | Generated in-house, (Martinez et al., 2016) | N/A |
| C9-3.2 G4C2 repeat-expansion hiPSC | Generated in-house, fibroblasts described in (Lagier-Tourenne et al., 2013) | N/A |
| C9-5.2 G4C2 repeat-expansion hiPSC | Generated in-house, fibroblasts described in (Lagier-Tourenne et al., 2013) | N/A |
| C9-6.3 G4C2 repeat-expansion hiPSC | Generated in-house, fibroblasts described in (Lagier-Tourenne et al., 2013) | N/A |
| Experimental Models: Organisms/Strains | ||
| D. melanogaster: strain w[1118] | Gao Lab | N/A |
| D. melanogaster: UAS-GFP strain | Gao Lab | N/A |
| D. melanogaster: UAS-(GR)80 transgenic strain: Vg-Gal4/Cyo; UAS-(GR)80/TM6B | (Yang et al., 2015) | N/A |
| D. melanogaster: Mutant allele of Bel/DDX3X/Y | Bloomington Drosophila Stock Center | BDSC:19945; Flybase: FBst0019945 |
| y[1] w[67c23]; P{w[+mC] y[+mDint2] = EPgy2}bel[EY08943] | ||
| D. melanogaster: RNAi of Bel/DDX3X/Y | Bloomington Drosophila Stock Center | BDSC:28049; Flybase: FBst0028049 |
| y[1] v[1]; P{y[+t7.7] v[+t1.8] = TRiP.JF02884}attP2 | ||
| D. melanogaster: RNAi of Bel/DDX3X/Y | Bloomington Drosophila Stock Center | BDSC: 35302; Flybase: FBst0035302 |
| y[1] sc[*] v[1]; P{y[+t7.7] v[+t1.8] = TRiP.GL00205}attP2 | ||
| D. melanogaster: | Bloomington Drosophila Stock Center | BDSC: 18765; Flybase: FBst0018765 |
| Mutant allele of Hrb27C/DAZAP1 | ||
| w[1118];PBac{w[+mC] = WH}Hrb27C[f04375]/CyO | ||
| D. melanogaster: RNAi of Hrb27C/DAZAP1 | Bloomington Drosophila Stock Center | BDSC: 31684; Flybase: FBst0031684 |
| y[1] v[1]; P{y[+t7.7] v[+t1.8] = TRiP.JF01477}attP2 | ||
| D. melanogaster: RNAi of Hrb27C/DAZAP1 | Bloomington Drosophila Stock Center | BDSC: 31685;Flybase: FBst0031685 |
| y[1] v[1]; P{y[+t7.7] v[+t1.8] = TRiP.JF01478}attP2 | ||
| D. melanogaster: Mutant allele of Lig/UBAP2(L) | Bloomington Drosophila Stock Center | BDSC: 18242 ; Flybase: FBst0018242 |
| w[1118]; PBac{w[+mC] = RB}lig[e04268]/CyO | ||
| D. melanogaster: Mutant allele of Lig/UBAP2(L) | Bloomington Drosophila Stock Center | BDSC: 14943; Flybase: FBst0014943 |
| y[1]; P{y[+mDint2] w[BR.E.BR] = SUPor-P}lig[KG08209]/CyO; ry[506] | ||
| D. melanogaster: RNAi of Lig/UBAP2(L) | Bloomington Drosophila Stock Center | BDSC: 61857; Flybase: FBst0061857 |
| y[1] v[1]; P{y[+t7.7] v[+t1.8] = TRiP.HMJ23346}attP40 | ||
| D. melanogaster: Mutant allele of Psi/FUBP1/3 | Bloomington Drosophila Stock Center | BDSC: 27192 ; Flybase: FBst0027192 |
| y[1] w[*]; P{w[+mC] = EP}Psi[G5862] | ||
| D. melanogaster: RNAi of Psi/FUBP1/3 | Bloomington Drosophila Stock Center | BDSC:31301; Flybase: FBst0031301 |
| y[1] v[1]; P{y[+t7.7] v[+t1.8] = TRiP.JF01247}attP2 | ||
| D. melanogaster: RNAi of Psi/FUBP1/3 | Bloomington Drosophila Stock Center | BDSC: 31683; Flybase: FBst0031683 |
| y[1] v[1]; P{y[+t7.7] v[+t1.8] = TRiP.JF01247}attP2 | ||
| D. melanogaster: RNAi of Psi/FUBP1/3 | Bloomington Drosophila Stock Center | BDSC: 34825; Flybase: FBst0034825 |
| y[1] sc[*] v[1]; P{y[+t7.7] v[+t1.8] = TRiP.HMS00140}attP2 | ||
| D. melanogaster: Mutant allele of Unr/CSDE1 | Bloomington Drosophila Stock Center | BDSC: 17673 ; Flybase: FBst0017673 |
| y[1] w[*]; P{w[+mC] = EP}Psi[G5862] | ||
| D. melanogaster: Mutant allele of Unr/CSDE1 | Bloomington Drosophila Stock Center | BDSC: 10757 ; Flybase: FBst0010757 |
| w[1118]; PBac{w[+mC] = PB}Unr[c01923] | ||
| D. melanogaster: RNAi of Unr/CSDE1 | Bloomington Drosophila Stock Center | BDSC: 32432; Flybase: FBst0032432 |
| y[1] sc[*] v[1]; P{y[+t7.7] v[+t1.8] = TRiP.HMS00428}attP2 | ||
| D. melanogaster: RNAi of Unr/CSDE1 | Bloomington Drosophila Stock Center | BDSC: 29334; Flybase: FBst0029334 |
| y[1] v[1]; P{y[+t7.7] v[+t1.8] = TRiP.JF02496}attP2 | ||
| D. melanogaster: GMR-GAL4/CyO, tub-GAL80; UAS-FUS-hR521C/TM6B, Tb | (Periz et al., 2015) | N/A |
| D. melanogaster: GMR-GAL4, UAS-TDP-43-hM337V/CyO, tub-GAL80 | (Periz et al., 2015) | N/A |
| D. melanogaster: Rox8e04432 | Exelixis Collectiion at Harvard University | PBac{RB}Rox8e04432; Flybase: FBst1015699 |
| D. melanogaster: Rbp6d08411 | Exelixis Collectiion at Harvard University | P{XP}Rbp6d08411; Flybase: FBst1011661 |
| D. melanogaster: ligf03269 | Exelixis Collectiion at Harvard University | PBac{WH}ligf03269; Flybase: FBst1018357 |
| D. melanogaster: CG2889d07154 | Exelixis Collectiion at Harvard University | P{XP}CG2889d07154 mapped internally; Flybase: FBst1011297 |
| D. melanogaster: D12e01238 | Exelixis Collectiion at Harvard University | PBac{RB} D12e01238: mapped internally; Harvard Only |
| D. melanogaster: Su(var)205c06825 | Exelixis Collectiion at Harvard University | PBac{PB}Su(var)205c06825; Flybase: FBst1008382 |
| D. melanogaster: shepd07053 | Exelixis Collectiion at Harvard University | P{XP}shepd07053; Flybase: FBst1011268 |
| Oligonucleotides | ||
| Oligos for PCR, cloning and siRNA, see Table S8 | This paper | N/A |
| Recombinant DNA | ||
| Plasmid: pcDNA3 APEX2-NES | (Lam et al., 2015) | Addgene #49386 |
| Plasmid: GFP-Fusion HR Targeting Vector | System Biosciences (SBI) | Cat#HR120PA-1 |
| Plasmid: HR_G3BP1-V5-APEX2-GFP | This study | N/A |
| Plasmid: hPGK_V5-APEX2-GFP | This study | N/A |
| Plasmid: pSpCas9(BB)-2A-GFP (PX458) | Gift from Feng Zhang (Ran et al., 2013) | Addgene #48138 |
| Plasmid: pLIX403_UBAP2L_mCherry | This study | N/A |
| Plasmid: pLIX403_DUBA_UBAP2L_mCherry | This study | N/A |
| Plasmid: pRSV-Rev | Gift from Didier Trono (Dull et al., 1998) | Addgene #12253 |
| Plasmid: pMDLg/pRRE | Gift from Didier Trono (Dull et al., 1998) | Addgene #12251 |
| Plasmid: pCMV-VSV-G | Gift from Bob Weinberg (Stewart et al., 2003) | Addgene #8454 |
| Software and Algorithms | ||
| Enrichr Gene Set Enrichment Analysis | (Kuleshov et al., 2016) | http://amp.pharm.mssm.edu/Enrichr/ |
| Cytoscape | (Shannon et al., 2003) | http://www.cytoscape.org |
| Detecting significant changes in protein abundance | (Kammers et al., 2015) | http://www.biostat.jhsph.edu/~kkammers/software/eupa/R_guide.html |
In Brief.
Interactions between stress granule proteins exist ahead of a stress response and candidate SG proteins modify disease phenotypes in vivo.
Highlights.
- APEX proximity labeling reveals ~150 unknown SG proteins in a dense protein network
- SG composition varies by stress and cell type, especially in neuronal cells
- ALS motor neurons contain SGs with distinct content and subcellular distribution
- SG proteins modify ALS-mutant-mediated toxicity in fly models of neurodegeneration
Acknowledgments
We acknowledge members of the G.W.Y. lab for critical comments. We thank Shashank Sathe for help with bioinformatics analyses and K.G. Guruharsha and Maria D. Lalioti for valuable comments on the manuscript. S.M. was supported by a postdoctoral fellowship from the Larry L. Hillblom Foundation (2014-A-027-FEL). S.S. was supported by the IRCM Angelo Pizzagalli fellowship. J.M.W. was supported by an NIH Graduate Training in Cellular and Molecular Pharmacology Training Grant T32 GM007752. G.W.Y. is an Alfred P. Sloan Research Fellow, and E.L. is an FRQS Junior 2 Scholar. Work in the Lécuyer lab was supported by an ALS Canada/Brain Canada Discovery Grant. Work in the Gao lab was supported by the NIH (R01NS101986), the Packard Center for ALS Research, and the Target ALS Foundation. Work in the Bennett lab was supported by a Hellman Fellowship and the NIH (DP2GM119132). This work was partially supported by grants from the NIH (NS103172 and HG004659) and the ALS Association (to G.W.Y.).
Footnotes
AUTHOR CONTRIBUTIONS
Conceptualization, S.M. and G.W.Y; Methodology, S.M., E.J.B., E.L., and G.W.Y.; Formal Analysis, S.M., W.J., A.F., J.M.W., and E.J.B.; Investigation, S.M., S.S., K.L.S., R.M., M.Y.F., E.-C.L., E.L., F.K., D.Y., A.S., M.W.K. and F.-B.G.; Writing – Original Draft, S.M.; Writing – Review & Editing, S.M., E.J.B., E.L., and G.W.Y.; Visualization, S.M. and S.S.; Supervision, D.J.G., F.-B.G., E.J.B., E.L., and G.W.Y.; Funding Acquisition, E.J.B., E.L., and G.W.Y.
DECLARATION OF INTERESTS
G.W.Y. is a co-founder of Locana and Eclipse Bioinnovations and member of the scientific advisory boards of Locana, Eclipse Bioinnovations and Aquinnah Pharmaceuticals. The terms of this arrangement have been reviewed and approved by the University of California, San Diego in accordance with its conflict of interest policies. A.S. and M.W.K. are employees of Biogen. All other authors declare no competing interests
References
- Ainger K, Avossa D, Morgan F, Hill SJ, Barry C, Barbarese E, Carson JH. Transport and localization of exogenous myelin basic protein mRNA microinjected into oligodendrocytes. J Cell Biol. 1993;123:431–441. doi: 10.1083/jcb.123.2.431. [DOI] [PMC free article] [PubMed] [Google Scholar]
- Alami NH, Smith RB, Carrasco MA, Williams LA, Winborn CS, Han SSW, Kiskinis E, Winborn B, Freibaum BD, Kanagaraj A, et al. Axonal transport of TDP-43 mRNA granules is impaired by ALS-causing mutations. Neuron. 2014;81:536–543. doi: 10.1016/j.neuron.2013.12.018. [DOI] [PMC free article] [PubMed] [Google Scholar]
- Aulas A, Fay MM, Lyons SM, Achorn CA, Kedersha N, Anderson P, Ivanov P. Stress-specific differences in assembly and composition of stress granules and related foci. J Cell Sci. 2017;130:927–937. doi: 10.1242/jcs.199240. [DOI] [PMC free article] [PubMed] [Google Scholar]
- Becker LA, Huang B, Bieri G, Ma R, Knowles DA, Jafar-Nejad P, Messing J, Kim HJ, Soriano A, Auburger G, et al. Therapeutic reduction of ataxin-2 extends lifespan and reduces pathology in TDP-43 mice. Nature. 2017;544:367–371. doi: 10.1038/nature22038. [DOI] [PMC free article] [PubMed] [Google Scholar]
- Beckmann BM, Horos R, Fischer B, Castello A, Eichelbaum K, Alleaume AM, Schwarzl T, Curk T, Foehr S, Huber W, et al. The RNA-binding proteomes from yeast to man harbour conserved enigmRBPs. Nat Commun. 2015;6:10127. doi: 10.1038/ncomms10127. [DOI] [PMC free article] [PubMed] [Google Scholar]
- Behrends C, Sowa ME, Gygi SP, Harper JW. Network organization of the human autophagy system. Nature. 2010;466:68–76. doi: 10.1038/nature09204. [DOI] [PMC free article] [PubMed] [Google Scholar]
- Blokhuis AM, Koppers M, Groen EJ, van den Heuvel DM, Dini Modigliani S, Anink JJ, Fumoto K, van Diggelen F, Snelting A, Sodaar P, et al. Comparative interactomics analysis of different ALS-associated proteins identifies converging molecular pathways. Acta Neuropathol. 2016;132:175–196. doi: 10.1007/s00401-016-1575-8. [DOI] [PMC free article] [PubMed] [Google Scholar]
- Boeynaems S, Bogaert E, Kovacs D, Konijnenberg A, Timmerman E, Volkov A, Guharoy M, De Decker M, Jaspers T, Ryan VH, et al. Phase separation of C9orf72 dipeptide repeats perturbs stress granule dynamics. Mol Cell. 2017;65:1044–1055. doi: 10.1016/j.molcel.2017.02.013. [DOI] [PMC free article] [PubMed] [Google Scholar]
- Brannan KW, Jin W, Huelga SC, Banks CA, Gilmore JM, Florens L, Washburn MP, Van Nostrand EL, Pratt GA, Schwinn MK, et al. SONAR discovers RNA-binding proteins from analysis of large-scale proteinprotein interactomes. Mol Cell. 2016;64:282–293. doi: 10.1016/j.molcel.2016.09.003. [DOI] [PMC free article] [PubMed] [Google Scholar]
- Buchan JR, Kolaitis RM, Taylor JP, Parker R. Eukaryotic stress granules are cleared by autophagy and Cdc48/VCP function. Cell. 2013;153:1461–1474. doi: 10.1016/j.cell.2013.05.037. [DOI] [PMC free article] [PubMed] [Google Scholar]
- Ciechanover A, Kwon YT. Protein quality control by molecular chaperones in neurodegeneration. Front Neurosci. 2017;11:185. doi: 10.3389/fnins.2017.00185. [DOI] [PMC free article] [PubMed] [Google Scholar]
- Conrad T, Albrecht AS, de Melo Costa VR, Sauer S, Meierhofer D, Ørom UA. Serial interactome capture of the human cell nucleus. Nat Commun. 2016;7:11212. doi: 10.1038/ncomms11212. [DOI] [PMC free article] [PubMed] [Google Scholar]
- Cox J, Mann M. MaxQuant enables high peptide identification rates, individualized p.p.b.-range mass accuracies and proteome-wide protein quantification. Nat Biotechnol. 2008;26:1367–1372. doi: 10.1038/nbt.1511. [DOI] [PubMed] [Google Scholar]
- Du ZW, Chen H, Liu H, Lu J, Qian K, Huang CL, Zhong X, Fan F, Zhang SC. Generation and expansion of highly pure motor neuron progenitors from human pluripotent stem cells. Nat Commun. 2015;6:6626. doi: 10.1038/ncomms7626. [DOI] [PMC free article] [PubMed] [Google Scholar]
- Dull T, Zufferey R, Kelly M, Mandel RJ, Nguyen M, Trono D, Naldini L. A third-generation lentivirus vector with a conditional packaging system. J Virol. 1998;72:8463–8471. doi: 10.1128/jvi.72.11.8463-8471.1998. [DOI] [PMC free article] [PubMed] [Google Scholar]
- Freibaum BD, Chitta RK, High AA, Taylor JP. Global analysis of TDP-43 interacting proteins reveals strong association with RNA splicing and translation machinery. J Proteome Res. 2010;9:1104–1120. doi: 10.1021/pr901076y. [DOI] [PMC free article] [PubMed] [Google Scholar]
- Gendron JM, Webb K, Yang B, Rising L, Zuzow N, Bennett EJ. Using the ubiquitin-modified proteome to monitor distinct and spatially restricted protein homeostasis dysfunction. Mol Cell Proteomics. 2016;15:2576–2593. doi: 10.1074/mcp.M116.058420. [DOI] [PMC free article] [PubMed] [Google Scholar]
- Gore A, Li Z, Fung HL, Young JE, Agarwal S, Antosiewicz-Bourget J, Canto I, Giorgetti A, Israel MA, Kiskinis E, et al. Somatic coding mutations in human induced pluripotent stem cells. Nature. 2011;471:63–67. doi: 10.1038/nature09805. [DOI] [PMC free article] [PubMed] [Google Scholar]
- Hung V, Zou P, Rhee HW, Udeshi ND, Cracan V, Svinkina T, Carr SA, Mootha VK, Ting AY. Proteomic mapping of the human mitochondrial intermembrane space in live cells via ratiometric APEX tagging. Mol Cell. 2014;55:332–341. doi: 10.1016/j.molcel.2014.06.003. [DOI] [PMC free article] [PubMed] [Google Scholar]
- Jain S, Wheeler JR, Walters RW, Agrawal A, Barsic A, Parker R. ATPase-modulated stress granules contain a diverse proteome and substructure. Cell. 2016;164:487–498. doi: 10.1016/j.cell.2015.12.038. [DOI] [PMC free article] [PubMed] [Google Scholar]
- Kammers K, Cole RN, Tiengwe C, Ruczinski I. Detecting significant changes in protein abundance. EuPA Open Proteom. 2015;7:11–19. doi: 10.1016/j.euprot.2015.02.002. [DOI] [PMC free article] [PubMed] [Google Scholar]
- Kato M, Han TW, Xie S, Shi K, Du X, Wu LC, Mirzaei H, Goldsmith EJ, Longgood J, Pei J, et al. Cell-free formation of RNA granules: low complexity sequence domains form dynamic fibers within hydrogels. Cell. 2012;149:753–767. doi: 10.1016/j.cell.2012.04.017. [DOI] [PMC free article] [PubMed] [Google Scholar]
- Kedersha N, Anderson P. Stress granules: sites of mRNA triage that regulate mRNA stability and translatability. Biochem Soc Trans. 2002;30:963–969. doi: 10.1042/bst0300963. [DOI] [PubMed] [Google Scholar]
- Kedersha NL, Gupta M, Li W, Miller I, Anderson P. RNAbinding proteins TIA-1 and TIAR link the phosphorylation of eIF-2 alpha to the assembly of mammalian stress granules. J Cell Biol. 1999;147:1431–1442. doi: 10.1083/jcb.147.7.1431. [DOI] [PMC free article] [PubMed] [Google Scholar]
- Kuleshov MV, Jones MR, Rouillard AD, Fernandez NF, Duan Q, Wang Z, Koplev S, Jenkins SL, Jagodnik KM, Lachmann A, et al. Enrichr: a comprehensive gene set enrichment analysis web server 2016 update. Nucleic Acids Res. 2016;44(W1):W90–7. doi: 10.1093/nar/gkw377. [DOI] [PMC free article] [PubMed] [Google Scholar]
- Lagier-Tourenne C, Baughn M, Rigo F, Sun S, Liu P, Li HR, Jiang J, Watt AT, Chun S, Katz M, et al. Targeted degradation of sense and antisense C9orf72 RNA foci as therapy for ALS and frontotemporal degeneration. Proc Natl Acad Sci USA. 2013;110:E4530–E4539. doi: 10.1073/pnas.1318835110. [DOI] [PMC free article] [PubMed] [Google Scholar]
- Lam SS, Martell JD, Kamer KJ, Deerinck TJ, Ellisman MH, Mootha VK, Ting AY. Directed evolution of APEX2 for electron microscopy and proximity labeling. Nat Methods. 2015;12:51–54. doi: 10.1038/nmeth.3179. [DOI] [PMC free article] [PubMed] [Google Scholar]
- Lanson NA, Jr, Maltare A, King H, Smith R, Kim JH, Taylor JP, Lloyd TE, Pandey UB. A Drosophila model of FUS-related neurodegeneration reveals genetic interaction between FUS and TDP-43. Hum Mol Genet. 2011;20:2510–2523. doi: 10.1093/hmg/ddr150. [DOI] [PMC free article] [PubMed] [Google Scholar]
- Lee KH, Zhang P, Kim HJ, Mitrea DM, Sarkar M, Freibaum BD, Cika J, Coughlin M, Messing J, Molliex A, et al. C9orf72 dipeptide repeats impair the assembly, dynamics, and function of membrane-less organelles. Cell. 2016;167:774–788. doi: 10.1016/j.cell.2016.10.002. [DOI] [PMC free article] [PubMed] [Google Scholar]
- Lin Y, Mori E, Kato M, Xiang S, Wu L, Kwon I, McKnight SL. Toxic PR poly-dipeptides encoded by the C9orf72 repeat expansion target LC domain polymers. Cell. 2016;167:789–802. doi: 10.1016/j.cell.2016.10.003. [DOI] [PMC free article] [PubMed] [Google Scholar]
- Mackenzie IR, Nicholson AM, Sarkar M, Messing J, Purice MD, Pottier C, Annu K, Baker M, Perkerson RB, Kurti A, et al. TIA1 mutations in amyotrophic lateral sclerosis and frontotemporal dementia promote phase separation and alter stress granule dynamics. Neuron. 2017;95:808–816. doi: 10.1016/j.neuron.2017.07.025. [DOI] [PMC free article] [PubMed] [Google Scholar]
- March ZM, King OD, Shorter J. Prion-like domains as epigenetic regulators, scaffolds for subcellular organization, and drivers of neurodegenerative disease. Brain Res. 2016;1647:9–18. doi: 10.1016/j.brainres.2016.02.037. [DOI] [PMC free article] [PubMed] [Google Scholar]
- Margolin AA, Ong SE, Schenone M, Gould R, Schreiber SL, Carr SA, Golub TR. Empirical Bayes analysis of quantitative proteomics experiments. PLoS ONE. 2009;4:e7454. doi: 10.1371/journal.pone.0007454. [DOI] [PMC free article] [PubMed] [Google Scholar]
- Martinez FJ, Pratt GA, Van Nostrand EL, Batra R, Huelga SC, Kapeli K, Freese P, Chun SJ, Ling K, Gelboin-Burkhart C, et al. Protein- RNA networks regulated by normal and ALS-associated mutant HNRNPA2B1 in the nervous system. Neuron. 2016;92:780–795. doi: 10.1016/j.neuron.2016.09.050. [DOI] [PMC free article] [PubMed] [Google Scholar]
- Molliex A, Temirov J, Lee J, Coughlin M, Kanagaraj AP, Kim HJ, Mittag T, Taylor JP. Phase separation by low complexity domains promotes stress granule assembly and drives pathological fibrillization. Cell. 2015;163:123–133. doi: 10.1016/j.cell.2015.09.015. [DOI] [PMC free article] [PubMed] [Google Scholar]
- Murakami T, Qamar S, Lin JQ, Schierle GS, Rees E, Miyashita A, Costa AR, Dodd RB, Chan FT, Michel CH, et al. ALS/FTD mutation-induced phase transition of FUS liquid droplets and reversible hydrogels into irreversible hydrogels impairs RNP granule function. Neuron. 2015;88:678–690. doi: 10.1016/j.neuron.2015.10.030. [DOI] [PMC free article] [PubMed] [Google Scholar]
- Ohn T, Kedersha N, Hickman T, Tisdale S, Anderson P. A functional RNAi screen links O-GlcNAc modification of ribosomal proteins to stress granule and processing body assembly. Nat Cell Biol. 2008;10:1224–1231. doi: 10.1038/ncb1783. [DOI] [PMC free article] [PubMed] [Google Scholar]
- Patel A, Lee HO, Jawerth L, Maharana S, Jahnel M, Hein MY, Stoynov S, Mahamid J, Saha S, Franzmann TM, et al. A liquidto- solid phase transition of the ALS protein FUS accelerated by disease mutation. Cell. 2015;162:1066–1077. doi: 10.1016/j.cell.2015.07.047. [DOI] [PubMed] [Google Scholar]
- Pérez-González A, Pazo A, Navajas R, Ciordia S, Rodriguez-Frandsen A, Nieto A. hCLE/C14orf166 associates with DDX1-HSPC117- FAM98B in a novel transcription-dependent shuttling RNA-transporting complex. PLoS ONE. 2014;9:e90957. doi: 10.1371/journal.pone.0090957. [DOI] [PMC free article] [PubMed] [Google Scholar]
- Periz G, Lu J, Zhang T, Kankel MW, Jablonski AM, Kalb R, McCampbell A, Wang J. Regulation of protein quality control by UBE4B and LSD1 through p53-mediated transcription. PLoS Biol. 2015;13:e1002114. doi: 10.1371/journal.pbio.1002114. [DOI] [PMC free article] [PubMed] [Google Scholar]
- Ran FA, Hsu PD, Wright J, Agarwala V, Scott DA, Zhang F. Genome engineering using the CRISPR-Cas9 system. Nat Protoc. 2013;8:2281–2308. doi: 10.1038/nprot.2013.143. [DOI] [PMC free article] [PubMed] [Google Scholar]
- Reinhardt P, Glatza M, Hemmer K, Tsytsyura Y, Thiel CS, Höing S, Moritz S, Parga JA, Wagner L, Bruder JM, et al. Derivation and expansion using only small molecules of human neural progenitors for neurodegenerative disease modeling. PLoS ONE. 2013;8:e59252. doi: 10.1371/journal.pone.0059252. [DOI] [PMC free article] [PubMed] [Google Scholar]
- Rhee HW, Zou P, Udeshi ND, Martell JD, Mootha VK, Carr SA, Ting AY. Proteomic mapping of mitochondria in living cells via spatially restricted enzymatic tagging. Science. 2013;339:1328–1331. doi: 10.1126/science.1230593. [DOI] [PMC free article] [PubMed] [Google Scholar]
- Ritson GP, Custer SK, Freibaum BD, Guinto JB, Geffel D, Moore J, Tang W, Winton MJ, Neumann M, Trojanowski JQ, et al. TDP-43 mediates degeneration in a novel Drosophila model of disease caused by mutations in VCP/p97. J Neurosci. 2010;30:7729–7739. doi: 10.1523/JNEUROSCI.5894-09.2010. [DOI] [PMC free article] [PubMed] [Google Scholar]
- Salminen A, Kaarniranta K. AMP-activated protein kinase (AMPK) controls the aging process via an integrated signaling network. Ageing Res Rev. 2012;11:230–241. doi: 10.1016/j.arr.2011.12.005. [DOI] [PubMed] [Google Scholar]
- Shannon P, Markiel A, Ozier O, Baliga NS, Wang JT, Ramage D, Amin N, Schwikowski B, Ideker T. Cytoscape: a software environment for integrated models of biomolecular interaction networks. Genome Res. 2003;13:2498–2504. doi: 10.1101/gr.1239303. [DOI] [PMC free article] [PubMed] [Google Scholar]
- Smith BN, Topp SD, Fallini C, Shibata H, Chen HJ, Troakes C, King A, Ticozzi N, Kenna KP, Soragia-Gkazi A, et al. Mutations in the vesicular trafficking protein annexin A11 are associated with amyotrophic lateral sclerosis. Sci Transl Med. 2017;9 doi: 10.1126/scitranslmed.aad9157. [DOI] [PMC free article] [PubMed] [Google Scholar]
- Smyth GK. Linear models and empirical Bayes methods for assessing differential expression in microarray experiments. Stat Appl Genet Mol Biol. 2004;3 doi: 10.2202/1544-6115.1027. Article3. [DOI] [PubMed] [Google Scholar]
- Stewart SA, Dykxhoorn DM, Palliser D, Mizuno H, Yu EY, An DS, Sabatini DM, Chen IS, Hahn WC, Sharp PA, et al. Lentivirusdelivered stable gene silencing by RNAi in primary cells. RNA. 2003;9:493–501. doi: 10.1261/rna.2192803. [DOI] [PMC free article] [PubMed] [Google Scholar]
- Storey JD, Tibshirani R. Statistical significance for genomewide studies. Proc Natl Acad Sci USA. 2003;100:9440–9445. doi: 10.1073/pnas.1530509100. [DOI] [PMC free article] [PubMed] [Google Scholar]
- Sundararaman B, Zhan L, Blue SM, Stanton R, Elkins K, Olson S, Wei X, Van Nostrand EL, Pratt GA, Huelga SC, et al. Resources for the comprehensive discovery of functional RNA elements. Mol Cell. 2016;61:903–913. doi: 10.1016/j.molcel.2016.02.012. [DOI] [PMC free article] [PubMed] [Google Scholar]
- Wheeler JR, Matheny T, Jain S, Abrisch R, Parker R. Distinct stages in stress granule assembly and disassembly. eLife. 2016;5:e18413. doi: 10.7554/eLife.18413. [DOI] [PMC free article] [PubMed] [Google Scholar]
- Yang D, Abdallah A, Li Z, Lu Y, Almeida S, Gao FB. FTD/ALS-associated poly(GR) protein impairs the Notch pathway and is recruited by poly(GA) into cytoplasmic inclusions. Acta Neuropathol. 2015;130:525–535. doi: 10.1007/s00401-015-1448-6. [DOI] [PMC free article] [PubMed] [Google Scholar]
- Yasuda K, Mili S. Dysregulated axonal RNA translation in amyotrophic lateral sclerosis. Wiley Interdiscip Rev RNA. 2016;7:589–603. doi: 10.1002/wrna.1352. [DOI] [PMC free article] [PubMed] [Google Scholar]
Associated Data
This section collects any data citations, data availability statements, or supplementary materials included in this article.
Supplementary Materials
S1
S2
S3
S4
S5
S6
S7
S8