A molecular grammar governing the driving forces for phase separation of prion-like RNA binding proteins (original) (raw)
. Author manuscript; available in PMC: 2019 Jul 26.
SUMMARY
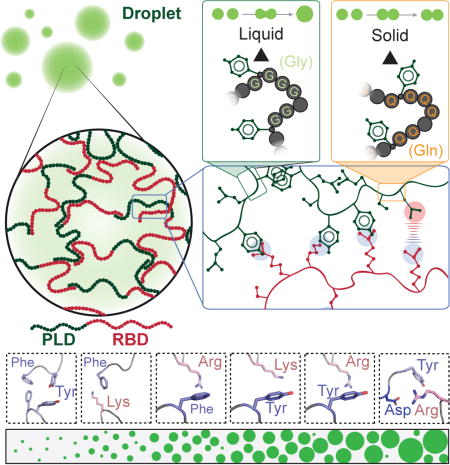
Proteins such as FUS phase separate to form liquid-like condensates that can harden into less dynamic structures. However, how these properties emerge from the collective interactions of many amino acids remains largely unknown. Here, we use extensive mutagenesis to identify a sequence-encoded molecular grammar underlying the driving forces for phase separation of proteins of the FUS family, and test aspects of this grammar in cells. Phase separation is governed primarily by multivalent interactions amongst tyrosine residues from prion-like domains and arginine residues from RNA binding domains, which are modulated by negatively charged residues. Glycine residues enhance the fluidity, whereas glutamine and serine residues promote hardening. We develop a model to show that the measured saturation concentrations of phase separation are inversely proportional to the product of the numbers of arginine and tyrosine residues. These results suggest it is possible to predict phase separation properties based on amino acid sequence.
ETOC BLURB
The phase separation behavior of FUS family proteins can be predicted from the prevalence and position of specific amino acids.
INTRODUCTION
The cellular environment includes numerous membraneless compartments that form and dissolve in response to a wide range of cellular signals (Banani et al., 2017; Hyman and Brangwynne, 2011; Shin and Brangwynne, 2017). Many of these compartments appear to form via intracellular phase transition (Bergeron-Sandoval et al., 2016; Brangwynne et al., 2009; Feric et al., 2016; Hyman et al., 2014). These membraneless compartments have been termed biomolecular condensates because their material properties resemble those of liquids, gels, or solids (Banani et al., 2017; Shin and Brangwynne, 2017). The protein components of condensates have been classified as either scaffolds, which have been defined as the proteins that drive reversible condensate formation, and clients that are defined as proteins that preferentially partition into condensates (Banani et al., 2017; Banani et al., 2016).
The macromolecular composition of condensates is specific. This implies that a cell can trigger phase separation of specific proteins, and that only certain clients partition into these condensates while others are kept out (Banani et al., 2016; Feric et al., 2016; Zhang et al., 2015). Furthermore, for certain condensates, the material properties can change after phase separation, and distinct material properties have been linked to distinct functions as well as pathologies (Franzmann et al., 2018; Kwon et al., 2013;Molliex et al., 2015; Patel et al., 2015; Riback et al., 2017; Woodruff et al., 2017). However, we do not fully understand which amino acids govern the threshold concentration of phase separation, the material properties of the formed condensates, or the partitioning of client proteins in condensates. This limits our ability to make targeted mutations that perturb specific aspects of protein phase separation. For this reason, it has been difficult to link the specific properties of condensates to their biological function.
Here, we investigate the phase separation properties of a class of intrinsically disordered scaffold proteins that we refer to as FUS family proteins because they share similar domain structures, and the first described member of this family was Fused in Sarcoma or FUS (Crozat et al., 1993; King et al., 2012). There are about 30 FUS family proteins in the human genome (King et al., 2012). These include the FET proteins (FUS and the related proteins EWSR1 and TAF15), TDP-43 and hnRNPA1 (Burke et al., 2015; Molliex et al., 2015; Patel et al., 2015). Aberrant phase transitions of many FUS family proteins have been associated with the onset of age-related neurodegenerative diseases (Lin et al., 2015; Molliex et al., 2015; Patel et al., 2015).
The amino acid sequences of FUS family proteins can be divided into two modules: a low sequence complexity domain also known as a prion-like domain (PLD) because of its association with the formation of prions in yeast (King et al., 2012), and a domain that binds RNA (RNA-binding domain or RBD). The PLDs of FUS family proteins are intrinsically disordered and have low complexity (Malinovska et al., 2013). Low complexity means that they contain a small subset of amino acids including polar residues such as glycine, glutamine, and serine, as well as aromatic residues, generally tyrosine (Alberti et al., 2009; Kato et al., 2012;Malinovska et al., 2015). The RBDs are comprised of one or more folded RNA recognition modules (RNA recognition motif, RRM), but they also carry regions of significant intrinsic disorder. The intrinsically disordered regions in RBDs are typically enriched in glycine and positively charged residues such as arginine. In vitro, some PLDs will drive condensate formation as autonomous units (Burke et al., 2015; Han et al., 2012; Lin et al., 2015; Molliex et al., 2015). As a result, there has been a focus on PLDs as the main determinants of phase transitions in cells. Despite the fact that FUS family proteins contain PLDs and RBDs, we do not understand the synergy between these different domains in driving phase separation. More generally we do not fully understand the sequence-intrinsic features that drive phase separation or control material properties of condensates of FUS family proteins.
RESULTS
We successfully cloned and expressed 22 members of the FUS family (Figures 1A and 1B) (See Tables S1 and S6 for all 76 proteins expressed as part of this study) and performed phase separation assays at physiological salt conditions at a protein concentration of 5 μM. In most cases, this concentration lies above the physiological concentration in HeLa cells (Hein et al., 2015; Patel et al., 2015) of these proteins (Table S2). We were able to drive phase separation of all the FUS family proteins either by increasing protein concentration (Figures 1Cand 1D) or by adding dextran, which is a molecular crowding agent (Figure S1A). However, only FUS, EWSR1 and TAF15, which constitute the FET family (Schwartz et al., 2015), showed robust phase separation in the absence of crowding agents at a protein concentration of 5 μM (Figure S1A). These data suggest that although the majority of the FUS family of proteins can phase separate, only the FET proteins possess the requisite sequence features to drive phase separation at low protein concentrations and physiologically relevant salt concentrations.
Figure 1. The saturation concentration of FUS family proteins can span orders of magnitude.
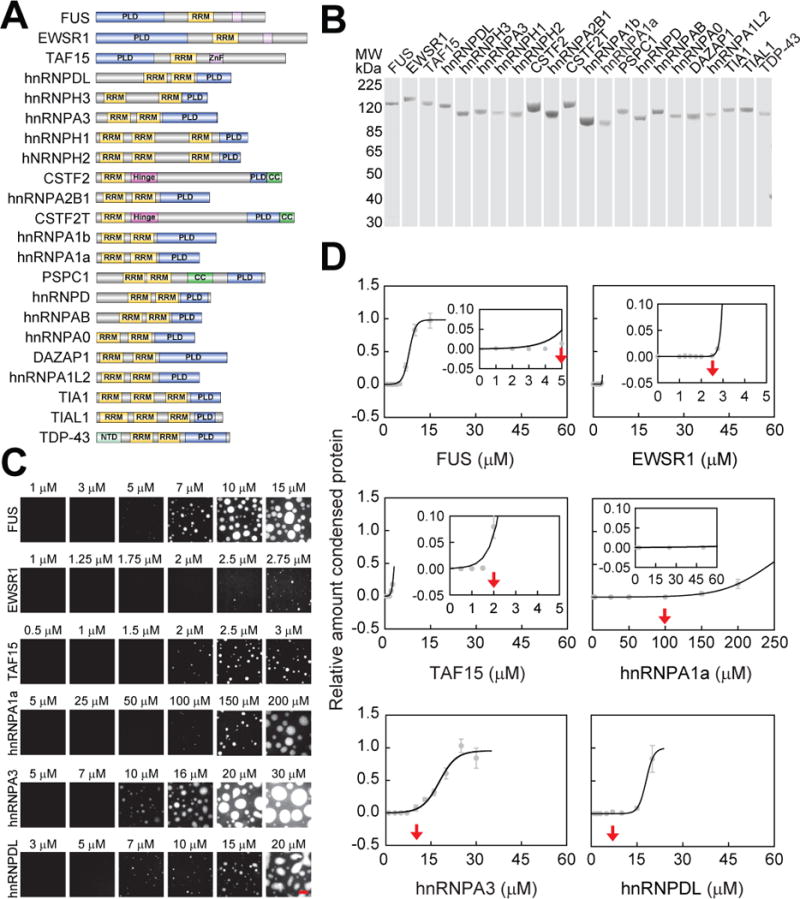
(A) Domain structures of FUS family proteins. PLD: prion-like domain; RRM: RNA recognition motif; ZnF: zinc finger; CC: coiled coil; NTD: N-terminal domain. The intrinsically disordered regions are colored in grey.
(B) SDS-PAGE of the 22 FUS family proteins tagged with MBP and GFP.
(C) Phase separation of FUS family proteins at the physiological salt concentration. Phase separation was induced by reducing the salt concentration from 500 mM to 150 mM through dilution. Bar, 5 μm.
(D) Phase separation quantified by the relative amount of condensed protein versus the protein concentration. For the definition of the relative amount of condensed protein, see STAR Methods. Images from (C) were used for the quantification. The saturation concentration is indicated by a red arrow. All data are expressed as the mean ± the standard deviation (SD).
See also Figure S1, Tables S1, S2 and S4.
Interactions amongst the PLD and RBD of FUS drive phase separation
To understand the role of the PLD in driving phase separation of the FET proteins, we compared phase separation of the full-length protein to that of the PLD alone, using FUS as a model (Figures 2Aand S2A). We used three different methods to obtain a saturation concentration of phase separation, which is defined as the threshold protein concentration that must be crossed to trigger phase separation (Figures S1B-S1F). In the first method, we used microscopy to measure the fluorescence intensity and determine the total protein amount inside and outside the droplets. In the second method, we measured the turbidity of the solution at two different wavelengths. In the third method, we used centrifugation to spin down the droplets and measure the concentration in the supernatant using a spectrophotometer (for details see STAR Methods). All assays produced comparable results. For simplicity and speed of experimental design we settled on measuring the amount of condensed protein by fluorescence microscopy (assay 1). We also tested whether tagging with SNAP or GFP affects the saturation concentration. For full-length proteins, the effects of tags were minimal on the inferred saturation concentrations (Figures S1G-S1I). However, for some mutants we observed up to a two-fold difference between tagged and non-tagged proteins although equivalent trends were preserved within tagged versus untagged proteins (Table S4). Because of the difficulty of working with non-tagged proteins, we report results from experiments with tagged proteins.
Figure 2. Saturation concentration of FUS is governed by the collective interactions amongst tyrosine residues in the PLD and arginine residues in the RBD.
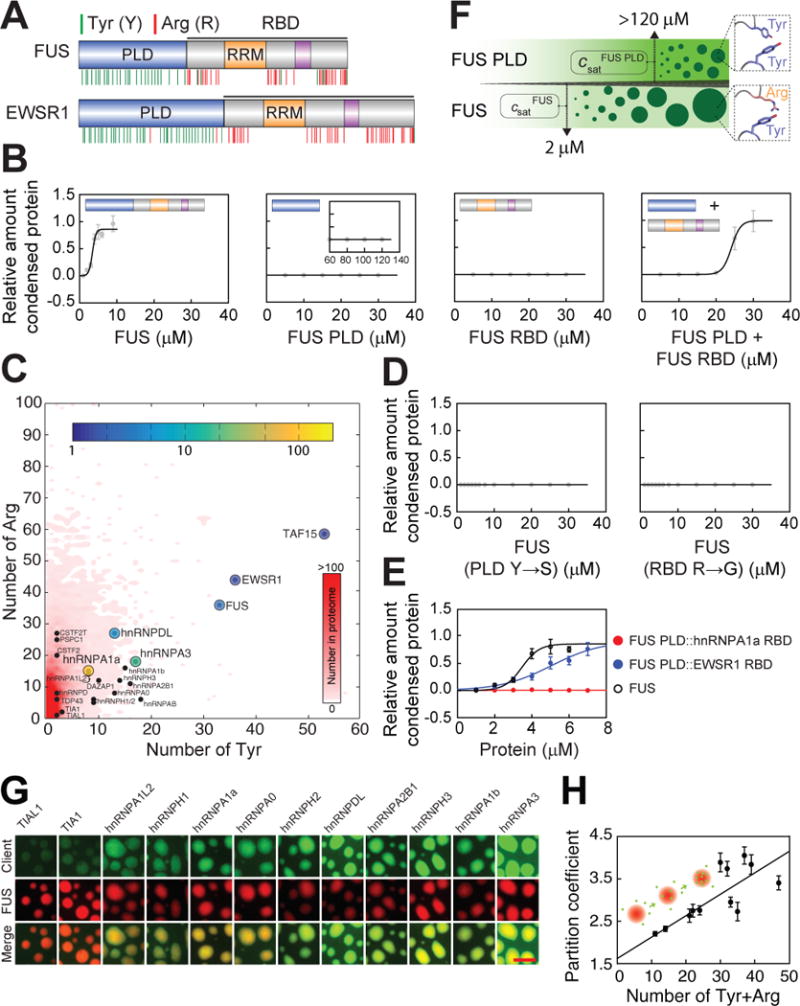
(A) Domain structures of FUS and EWSR1. RBD: RNA binding domain.
(B) RBD depletion significantly increases the saturation concentration. Unless specifically mentioned, all the phase separation assays in Figure 2 were conducted at 75 mM KCl. In the mixing assays, the PLD and RBD were mixed at a ratio of 1:1. All data are expressed as the mean ± the standard deviation (SD).
(C) Whole genome analysis for tyrosine and arginine number within the disordered regions of human proteins. Shown is a two-dimensional histogram quantifying the frequencies of the disordered regions with specific number of tyrosine and arginine residues.
(D) Tyrosine to serine substitution in the PLD or arginine to glycine substitution in the disordered regions of RBD increases the saturation concentration of the full-length FUS.
(E) RBDs with distinct arginine number modulate the saturation concentration differently.
(F) A cartoon summarizing the phase behavior of the prion-like domain and the full-length FUS. (G and H) Recruitment of clients by scaffold droplets appears to scale with the tyrosine and arginine number. Bar, 5 μm. To show the weak recruitment of some clients, we increased the signal from the clients by the same degree, and this caused the apparent layering of FUS and the clients in the merged channel. The clients are actually well mixed with FUS in the droplets.
See also Figures S2 and S3.
The measured saturation concentration of full-length FUS is ~2 μM in 75 mM KCl (Figure 2B). Surprisingly, the FUS PLD, expressed and purified from insect cells, does not drive phase separation as an independent module even for protein concentrations that are as high as 120 μM (Figures 2B, 2F and S2C). In accord with results from previous studies (Burke et al., 2015; Murray et al., 2017), crowding agents (Figure S2D) or PLD concentrations above 120 μM were necessary to drive phase separation. Therefore, the saturation concentration for the PLD is an order of magnitude higher than the saturation concentration for the full-length protein. The RBD alone did not phase separate. However, when the FUS PLD was mixed with the FUS RBD at a ratio of 1:1, the PLD phase separated at concentrations as low as 15 μM (Figures 2B, S2B and S2G). We obtained similar results for EWSR1 (Figure S2E). This suggests that interactions amongst PLDs and RBDs are required in vitro to drive phase separation at physiologically relevant protein concentrations.
Tyrosine and arginine residues govern the saturation concentration of phase separation
A characteristic hallmark of the FET proteins is that the PLDs are tyrosine-rich and the RBDs are arginine-rich (Figure 2A). We performed a proteome-wide analysis to assess the frequencies of proteins with long disordered regions that also have high tyrosine and arginine contents. The results, summarized inFigure 2C, show that proteins with PLD-RBD architectures, especially the FET proteins, stand out because of their high tyrosine and arginine contents in the disordered regions (69, 80 and 109 tyrosine and arginine residues for FUS, EWSR1 and TAF15, respectively) (Table S3). Importantly, the saturation concentrations appear to scale inversely with the number of tyrosine and arginine residues within a protein (Figure 2C). This suggests that collective interactions amongst tyrosine- _and_arginine-rich motifs might contribute directly to the driving forces for phase separation of FUS family proteins.
To test the role of tyrosine and arginine residues, we designed two different constructs. In one construct, we replaced all the tyrosine residues in the FUS PLD with serine residues (FUS (PLD Y→S)). In the other construct, we replaced most arginine residues in the disordered region of FUS RBD with glycine residues (FUS (RBD R→G)). Both substitutions abrogated observable phase separation up to concentrations as high as 30 μM (Figures 2D, S2F and S2H). We further investigated this relationship by quantifying the phase behaviour of chimeric constructs made between different FUS family members (Figures 2E and S2I). The RBD of hnRNPA1a has a low arginine content, whereas the RBD of EWSR1 has a high arginine content. As expected, the chimeric construct of the FUS PLD and EWSR1 RBD drives robust phase separation while the chimeric construct of the FUS PLD and the RBD from hnRNPA1a does not. Additional support for the importance of tyrosine-arginine interactions comes from data for the phase separation of TAF15, where we could vary the saturation concentration by varying the number of tyrosine residues (Figures S3A-S3G). Taken together, the results in Figure 2 suggest that for FET family proteins, the number of tyrosine and arginine and the complementarity of tyrosine-arginine interactions amongst the PLD and RBD contribute to the saturation concentrations.
FUS, EWSR1 and TAF15 are the only FUS family proteins that phase separate at near physiological concentrations (Figure 1). However, the majority of FUS family proteins are able to partition into preformed FUS droplets as clients even in the absence of crowding agents (Figure 2G). The partition coefficients show a positive correlation with the numbers of tyrosine_and_ arginine residues in these proteins (Figure 2H). This suggests that the specificity of client partitioning is driven in part by the presence of tyrosine-and arginine-rich motifs.
The numbers of tyrosine and arginine residues govern the saturation concentration of FUS in cells
To further test the idea that the number of tyrosine_and_ arginine residues governs the saturation concentration of FUS family proteins, we designed gain-of-function mutants that enriched the FUS PLD with arginine residues (Figure 3A). As expected, the substitution of 27 polar residues for arginine (FUS(27R)) lowered the saturation concentration by an order of magnitude (Figures 3B–3D and S4A-S4D). Similarly, hnRNPA1 normally phase separates at roughly 100 μM (Figure 1D), but by substituting 10 polar residues for arginine and converting 12 phenylalanine residues to tyrosine we reduced the saturation concentration to 15 μM (Figure 3F). This is similar to the physiological concentration (~ 8 μM) of hnRNPA1 (Table S2).
Figure 3. Manipulating arginine number bypasses the need for G3BP1 in formation of FUS granules in vivo.
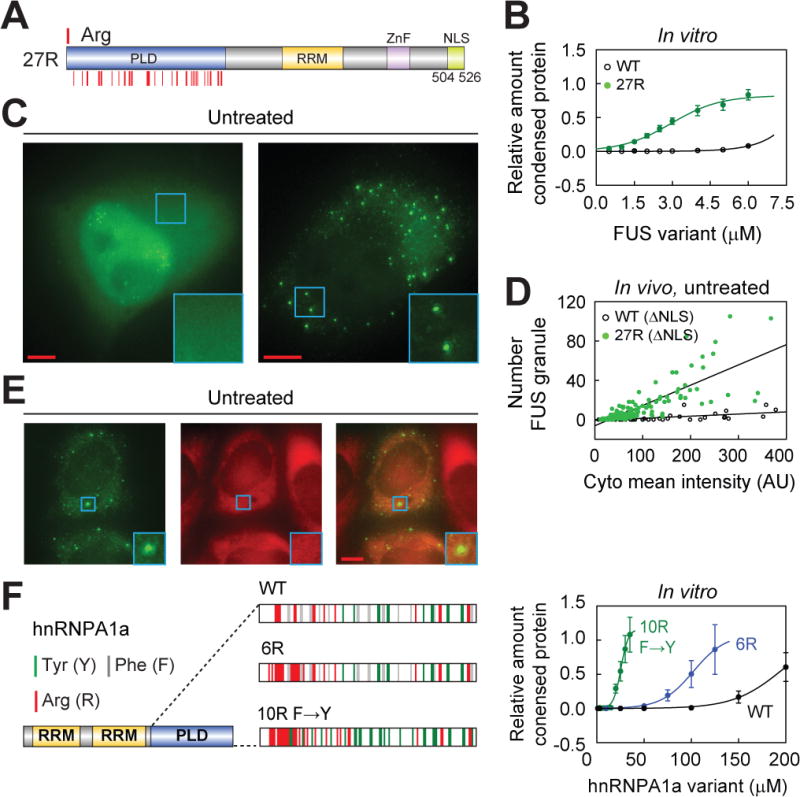
(A) Distribution of the newly added arginine residues in FUS(27R) mutant. NLS, nuclear localization signal. The mutant was designed according to the distribution of tyrosine and arginine residues in TAF15 RBD (Figure S3A), which has a relatively low saturation concentration.
(B) Addition of arginine residues in FUS lowers the saturation concentration of FUS in vitro. Phase separation assays were conducted at 150 mM KCl. All data are expressed as the mean ± the standard deviation (SD).
(C and D) Granule formation by FUS variants in the absence of stress. Shown are the images for HeLa cells transfected with GFP tagged FUS WT (∆NLS) or 27R (∆NLS), in which the NLS was deleted. We used the ∆NLS variants because unlike the full-length WT which dominantly localizes in the nuclear, full-length 27R localizes mainly in the cytoplasm. Bar, 5 m; (D), quantification of the granule number versus cyto mean intensity (mean intensity of the cytoplasm) of FUS variant. 189 and 134 cells were used to quantify the number of the preformed granules in the cells transfected with WT (∆NLS) and 27R (∆NLS), respectively.
(E) The stress granule nucleator G3BP1 is absent from the 27R (∆NLS) granules in the absence of stress. Stable HeLa cell line expressing C-terminal mCherry tagged human G3BP1 were transfected with the plasmid expressing the GFP tagged 27R (∆NLS). Bar, 5 μm.
(F) Addition of arginine residues and substitution of phenylalanine with tyrosine residues in hnRNPA1a PLD lower the saturation concentration. hnRNPA1a is the short isoform of hnRNPA1. Phase separation assays were conducted at 150 mM KCl. The positions of tyrosine and arginine residues for each construct are indicated by green and red lines, respectively. All data are expressed as the mean ± the standard deviation (SD).
See also Figure S4.
We then sought to test how tyrosine-arginine interactions govern the saturation concentration of FUS family proteins by studying the behavior of FUS(27R) in cells. Usually, FUS resides in the nucleus. Upon stress, it exits through the nuclear pores and forms stress granules in the cytoplasm, dependent on the protein G3BP1. However, even in unstressed cells, FUS(27R) formed constitutive condensates that do not associate with the stress granule marker G3BP1 (Figure 3E). This does not appear to engender a concomitant loss of function because in the presence of stress, the FUS(27R) variant co-localized with the stress granule marker G3BP1 (Figures S4E-S4G). Taken together, these results suggest that lowering the saturation concentration of FUS bypasses the requirement for G3BP1 to form FUS condensates. We did not test the effects of increasing tyrosine valence on phase separation because increasing tyrosine number in the PLD causes the oligomerization of FUS_in vitro_ (data not shown).
A code of aromatic and positively charged amino acids can govern the saturation concentrations
Interactions amongst aromatic amino acids such as tyrosine and basic residues such as arginine can be classified as cation-π interactions (Burley and Petsko, 1988; Dougherty, 1996, 2013; Gallivan and Dougherty, 1999; Nott et al., 2015). To distinguish between generic cation-π interactions and specific contributions from tyrosine and arginine, we made three distinct variants of FUS: a tyrosine to phenylalanine variant (FUS (PLD Y→F)), an arginine to lysine variant (FUS (PLD R→K)), and a construct with both tyrosine to phenylalanine and arginine to lysine mutations (FUS (PLD Y→F RBD R→K)) (Table S6). The driving forces for phase separation, quantified in terms of measured saturation concentrations, follow the order: tyrosine-arginine > tyrosine-lysine ≈ phenylalanine-arginine > phenylalanine-lysine (Figures 4A and 4B). This shows that the selective preference for tyrosine-arginine interactions cannot be solely due to generic cation-π interactions. Instead, the specific chemical structures of the tyrosine and the arginine side chains appear to be important determinants of the complementarity of tyrosine-arginine interactions (see discussion).
Figure 4. Distinct saturation concentration is governed by a code of associating aromatic and basic amino acids.
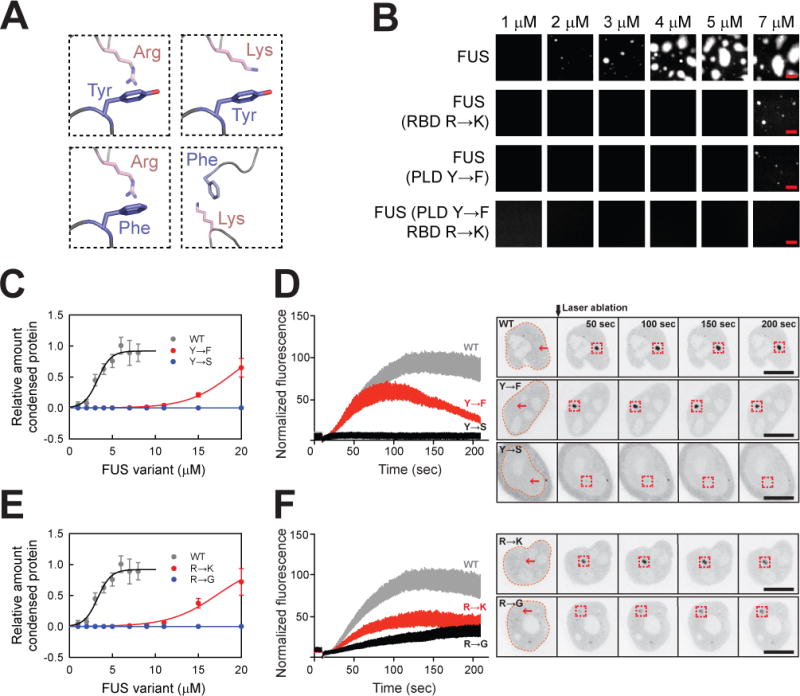
(A) Representative interactions amongst aromatic and basic amino acids in FUS family proteins.
(B) Tuning phase separation driving forces by different combinations of aromatic and basic amino acids. The in vitro phase separation assays in Figure 4 were conducted at 75 mM KCl. Bar, 5 μm.
(C) Phase separation of FUS tyrosine mutants quantified by the relative amount of condensed protein versus the protein concentration. All data are expressed as the mean ± the standard deviation (SD).
(D) Foci formation by FUS tyrosine mutants at DNA damage sites. Bar, 10 m. All data are expressed as the mean ± the standard deviation (SD).
(E) Phase separation of FUS arginine mutants quantified by the relative amount of condensed protein versus the protein concentration. All data are expressed as the mean ± the standard deviation (SD).
(F) Foci formation by FUS arginine mutants at DNA damage sites. Bar, 10 m. All data are expressed as the mean ± the standard deviation (SD).
See also Tables S3 and S4.
To test whether a similar grammar applies in vivo, we studied the assembly of FUS compartments at DNA damage sites. Previous data suggested that generation of double strand breaks using laser micro-irradiation leads to phase separation of FUS at sites of DNA damage (Aleksandrov et al., 2018; Altmeyer et al., 2015; Patel et al., 2015). We used plasmids to express FUS (PLD Y→F) and FUS (PLD Y→S) variants in a FUS knock out line. In a complementary set of experiments, we mutated most arginine residues in the RBD, excepting those in the NLS, to lysine or glycine residues (Table S6). In all cases, the recruitment of FUS to DNA damage sites followed the same trend as seen_in vitro_. The Y→F and the R→K variants showed significantly less recruitment than the wild type protein (Figures 4C–4F).
Phase separation of the PLD alone is likely driven by tyrosine-tyrosine interactions
The PLDs of the FET proteins do not contain any arginine residues. This raises an important question: what are the amino acid motifs that drive phase separation of the PLD alone? The FUS PLD contains a large number of tyrosine residues, and a FUS PLD mutant lacking tyrosine residues could no longer phase separate (Figure 5A), confirming previous data (Lin et al., 2017). Therefore, the tyrosine residues in the PLD likely involved in two types of interactions: they can either mediate networks of interactions among PLDs, or networks of interactions with arginine residues from RBDs. However, the saturation concentration necessary to drive phase separation based on tyrosine-based interactions is at least an order of magnitude higher than the saturation concentrations that are obtainable via networks of arginine-tyrosine based interactions (Figures 2F and S2D).
Figure 5. Tuning protein phase behavior by electrostatic interactions.
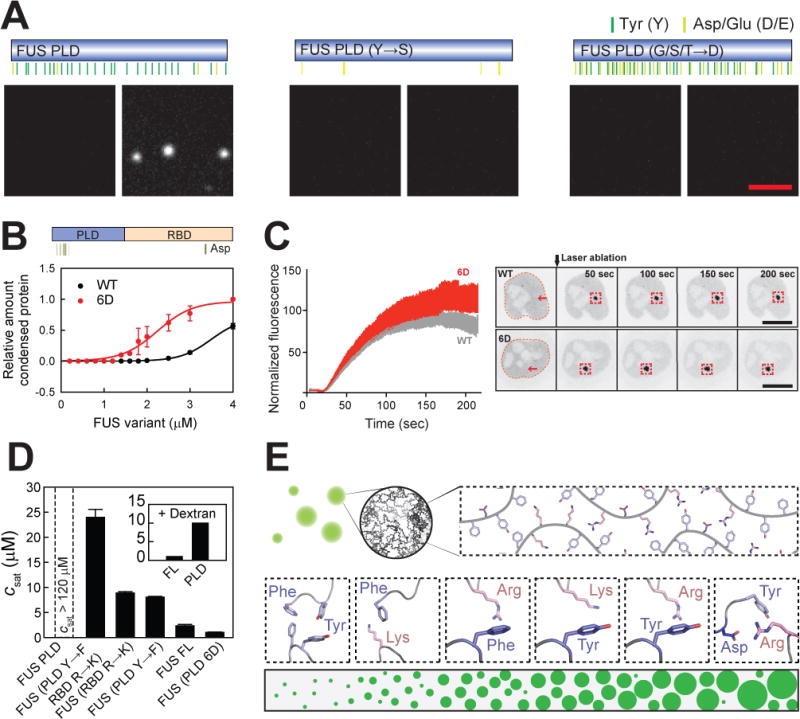
(A) Phase separation of FUS PLD variants in the absence or presence of crowding agents. Bar, 5 μm.
(B) Addition of negative charges promotes phase separation of FUS in vitro. The phase separation assays were conducted at 75 mM KCl. All data are expressed as the mean ± the standard deviation (SD).
(C) Foci formation by FUS 6D at DNA damage sites. Bar, 10 m. All data are expressed as the mean ± the standard deviation (SD). The images showing foci formation by WT are the same as those in Figures 4D and 4E, because the assays in Figures 5C, 4D and 4E were done in parallel.
(D) Comparison of _c_sat values of FUS variants determined by measuring the supernatant concentration at 75 mM KCl (see alsoTable S4). The inset shows the _c_sat values of FUS FL and PLD in the presence of dextran (Figure S2D).
(E) A hierarchy of interactions involving aromatic and charged residues governs the saturation concentration.
See also Figure S5 and Table S4.
Electrostatic interactions tune the protein phase behavior
We next tested the roles of electrostatic interactions in phase separation by introducing 16 aspartates in FUS PLD. Unlike the wild-type PLD of FUS, which can be forced to phase separate in the presence of dextran, dextran could not drive phase separation of the variant with high negative charges (Figures 5A and S5A). However, in the presence of 30 μM RBD, the PLD with high negative charges showed robust phase separation for PLD:RBD ratios as low as 1:15 (Figures S5C and S5D). TAF15 PLD variants showed similar behaviors (Figures S5E-S5G). Therefore, while increasing the negative charges in the PLD reduces the phase separation of PLDs alone, it enhances phase separation mediated by interactions amongst the PLDs and the RBDs.
To test these ideas in vivo we studied the recruitment of a variant containing 6 additional aspartates in the PLD. Remarkably, the recruitment of this variant to DNA damage sites was increased, suggesting that enhancing the interaction between the PLD and the RBD through additional electrostatic interactions also increases phase separation of FUS in living cells (Figures 5B, 5C and S5B). The effect on phase separation caused by addition of negative charges in the PLD supports regulation of FUS phase behavior by phosphorylation of serine residues in the PLD (Monahan et al., 2017).
Taken together, our combined in vitro and in vivo results show that at least two levels of interactions govern phase separation of full-length FET proteins. First, there are interactions amongst networks of aromatic (mainly tyrosine) and positively charged (mainly arginine) residues that govern the saturation concentration. Second, electrostatic repulsions inhibit non-productive self-interactions of PLDs, whereas electrostatic attractions further enhance productive interactions amongst aromatic residues in the PLD and positively charged amino acids in the RBD (Figures 5D and 5E). Our findings are consistent with results demonstrating a role for both complementary electrostatics and tyrosine-arginine interaction in complex coacervation of a high-complexity disordered protein (Lin et al., 2016; Pak et al., 2016).
A sequence code modulates material properties of condensates
Because FUS mainly consists of disordered regions, the theory of associative polymers (Rubinstein and Dobrynin, 1997; Semenov and Rubinstein, 1998) is of particular relevance for understanding the phase behavior of FUS. This theory predicts the phase behavior of polymers that interact through associative motifs called stickers. The stickers are separated from one another by spacers, which impart polymer flexibility and may weakly modulate the saturation concentration, but unlike the stickers, the spacers are not major determinants of the driving forces for phase separation (Semenov and Rubinstein, 1998). In the case of FUS family proteins, the stickers appear to be tyrosine and arginine residues. To identify potential spacer regions within FUS family proteins, we analyzed the compositional biases within each of the full-length proteins with PLD-RBD architectures. Figures S6A and S6Bsummarize the results from this analysis. Glycine (G) is the most frequently occurring amino acid in 20 of the 22 protein sequences as shown in Figure S6A. Glycine-rich regions would be optimal spacers because of the conformational flexibility of the peptide bond (Brady et al., 2017;Wei et al., 2017).
Addition of a single methyl group in the side chain by substituting glycine for alanine would lead to a substantial reduction in the local flexibility of the polypeptide backbone (Ramachandran et al., 1963). Consistent with its role as a spacer, substitution of glycine for alanine in FUS does not significantly affect the saturation concentration (Figures 6A, 6B, S6C and S6D). However, a glycine to alanine (G→A) variant changes the droplet fusion rate by more than two orders of magnitude (Figures 6C–6E; Movie S1) (for details see STAR Methods).
Figure 6. Glycine and serine/glutamine residues act oppositely to modulate the material property of droplets after phase separation.
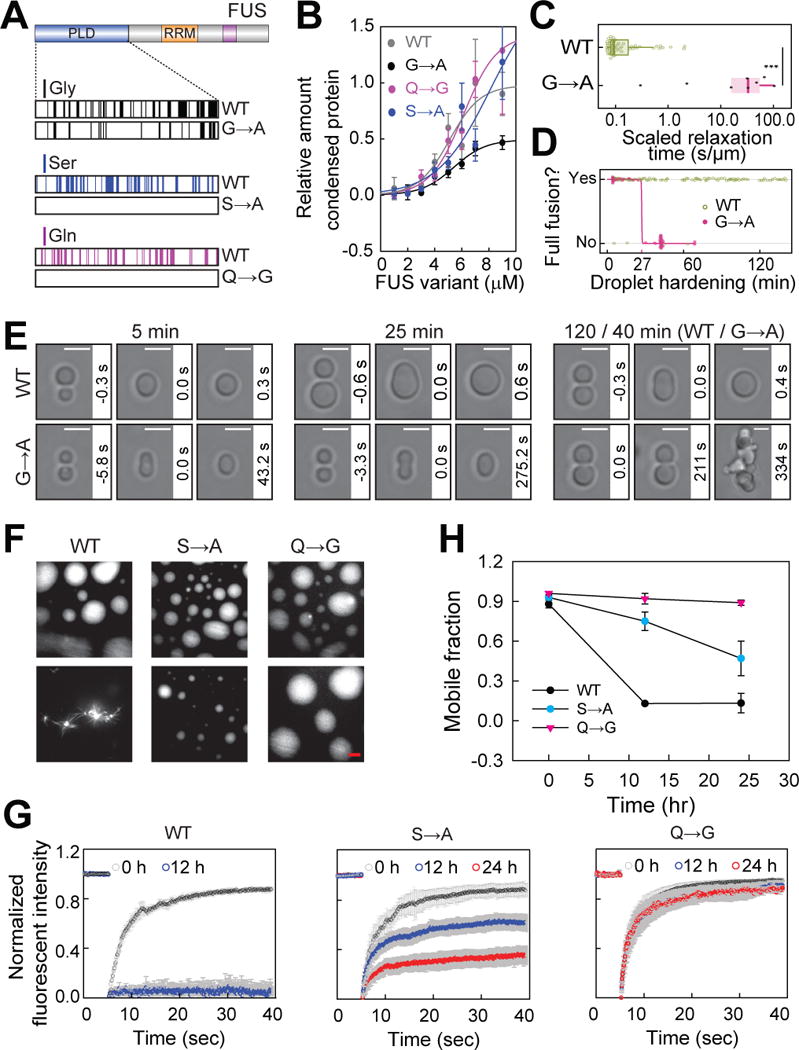
(A) Distribution of glycine, serine and glutamine residues within the PLD region of the full-length protein and the relative mutants used.
(B) Glycine, serine and glutamine residues have minor effects on the saturation concentrations for phase separation. Phase separation assays were conducted at 75 mM KCl. All data are expressed as the mean ± the standard deviation (SD).
(C) Droplets formed by G→A mutant fuse slower than those formed by WT. Size-normalized median fusion times are 32.9 s/μm for G→A and 0.093 s/μm for WT, respectively.
(D) Droplets formed by G→A mutant stop fusing after 40 min while WT droplets do not change dynamics (quantification). Fusion was monitored over time and was scored successful (1) or not (0) according to whether the resulting droplet relaxed to approximately spherical shape within 2 min.
(E) Glycine residues maintain droplet liquidity. Bar, 3 μm.
(F) Serine and glutamine residues promote hardening. Bar, 5 μm.
(G) Dynamic change of the condensates formed by WT, S→A or Q→G mutant over time. All data are expressed as the mean ± the standard deviation (SD).
(H) Mobile fraction of FUS variants over time. The mobile fraction of FUS variants was obtained from the FRAP experiments.
See also Figure S6 andMovie S1.
Among the 22 protein sequences, serine is the second most abundant amino acid on average (Figure S6A), and the contents of glutamine and glycine are negatively correlated (Figure S6B). As with the glycine to alanine substitution, the saturation concentration of a serine to alanine (S→A) variant and a glutamine to glycine (Q→G) variant did not change significantly. However, the hardening of the droplets slowed considerably. The (S→A) variant slowed hardening by a factor of two. More strikingly, the (Q→G) variant produced droplets that neither hardened nor underwent any morphological changes over 24 hours (Figures 6F–6H). Based on recent structural studies of the PLD (Murray et al., 2017), glutamine residues could also be required for the formation of labile cross-beta sheets, and therefore it seems likely that this mutation prevents hardening by preventing the formation of such higher order structures.
DISCUSSION
In this work, we show that phase separation of FUS family proteins is governed primarily by interactions between tyrosine and arginine residues. Productive interactions among tyrosine and arginine residues are regulated by complementary electrostatic interactions involving negatively charged amino acids, which reduce self-interaction among the PLDs (Monahan et al., 2017; Murray et al., 2017) and promote interactions amongst the PLDs and RBDs. The material properties of condensates are governed by serine, glutamine and glycine residues. These findings are summarized in Figures 7A and7B. Taken together, our results provide a framework for developing a molecular grammar that governs phase separation of the FUS family proteins.
Figure 7. Model to explain the phase behavior of FUS family proteins.
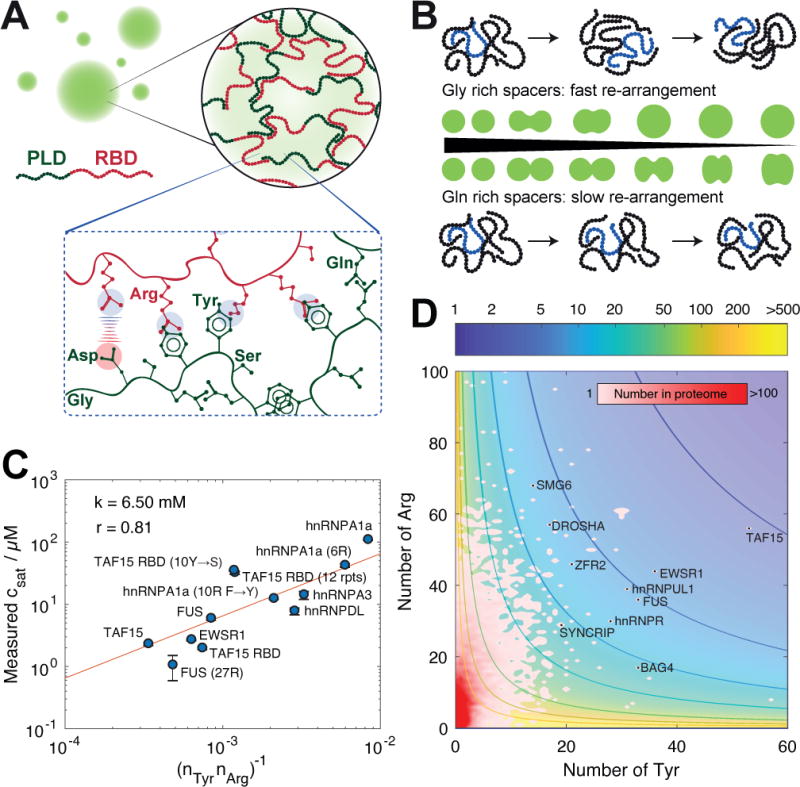
(A) Hierarchical organization that gives rise to formation of condensates depicted here as spherical droplets. Collective complementary interactions amongst the associative motifs such as tyrosine and arginine residues drive self-association, and electrostatic interactions play a modulatory role. The amino acid compositions of spacers, which are mainly enriched in glycine, glutamine and serine residues, largely determine intra-condensate dynamics of proteins. While the saturation concentration is governed by a code of associating aromatic and charged residues (Figure 5E), the spacers have little effect on the driving forces for droplet formation.
(B) Material properties are controlled mainly by glycine, serine and glutamine residues. Glycine-rich spacers yield highly dynamic droplets by imparting flexibility onto the amino acid backbone. This is manifest as droplets that undergo rapid internal re-arrangement and rapid macroscopic relaxation. The presence of serine and glutamine residues in spacers appears to reduce the internal re-arrangements and relaxation, leading to the reduction of droplet liquidity of droplets.
(C) Comparison of the inverse of the product of the numbers of tyrosine and arginine residues (ordinate) to the measured saturation concentrations (abscissa). The _c_sat values determined directly by measuring the supernatant concentrations were used (see Figure S1 and Table S4). The measured numbers were fit to a model of the form_c_sat =k(_n_Tyr _n_Arg)–1. Here,_n_Tyr and n_Arg denote the number of tyrosine and arginine residues, respectively. The only adjustable parameter in the fitting procedure was k, which places the valence on the same concentration scale as the experimental data. The fit shown here, which was performed on a logarithmic scale, uses a value of_k = 6.5 mM.
(D) Identifying potential scaffold proteins that could undergo phase separation at physiologically relevant concentrations. This figure includes a two-dimensional histogram quantifying the frequencies of the disordered regions with the specific number of tyrosine and arginine residues. Overlaid atop this histogram are contours showing the predicted values of saturation concentration (_c_sat) in μM. The plot shows the locations, in terms of numbers of tyrosine _and_arginine residues as well as the calculated values of_c_sat for proteins with predicted saturation concentrations that are on a par with the FET family of proteins.
See also Figure S7, Tables S4 and S5.
We have built on our understanding of the molecular grammar to design targeted mutations that modulate the phase behavior of proteins in cells. The relative ease with which we can modulate and independently tune the driving forces for phase separation and the material properties of FUS by mutation, and the correspondence between in vitro and _in vivo_properties, is remarkable and unexpected. Our results suggest that it will be possible to use detailed structure-function analysis to analyze the role of phase separation in cells.
Our experiments reinforce previous observations that isolated PLDs of the FET proteins have very different phase behavior than the full-length proteins (Burke et al., 2015; Han et al., 2012; Lin et al., 2015). They further suggest interactions among the prion-like domains are unlikely to drive of phase separation in the full-length protein on their own, although this could be modulated by post-translational modifications. Supporting this idea, mutants in serine and glutamine that should disrupt cross-beta sheet interaction only marginally influence phase separation in vitro.
However, once a condensate is formed, the concentration of the FET proteins inside the condensate is greatly elevated. This could promote interactions amongst PLDs, leading to different types of structures, including the cross-beta sheets (Murray et al., 2017), which may provide further physiological functions to the liquid-like condensates, such as stimulating transcription (Kwon et al., 2013), or shutting down biochemical reactions (Berchowitz et al., 2015; Boke et al., 2016; Franzmann et al., 2018; Woodruff et al., 2018). Because extensive PLD:PLD interactions only occur in the context of the condensate, any pathological interactions that then occur would be confined to that compartment, and this could be dealt with, for instance, by autophagy of the compartment itself. In this idea, cells use cross beta sheet interactions to form stable structures and deal with any pathological consequences by sequestering interactions amongst PLDs to the condensates. If true, this would be another example of a cell using phase separation to raise protein concentration and uncover new chemistry, as has been proposed for polymer dynamics and enzymatic reactions (Banani et al., 2017; Hernandez-Vega et al., 2017; Shin and Brangwynne, 2017;Woodruff et al., 2017).
The role of tyrosine and arginine residues in driving phase separation of FUS family proteins provides support for recent studies that highlight the importance of cation-π interactions as drivers of phase separation (Nott et al., 2015; Pak et al., 2016). Our studies build on this work by showing that there is a clear difference between arginine versus lysine as well as tyrosine versus phenylalanine. The central distinction between arginine and lysine lies in the chemical structure of the cationic side chain. The electron cloud is delocalized across the planar guanidinium group of arginine (Gobbi and Frenking, 1993). This enables specific directional preferences with aromatic moieties such as tyrosine and phenylalanine. In contrast, interactions involving the amine in lysine should have weaker directional preferences (Burley and Petsko, 1988; Gobbi and Frenking, 1993). Accordingly, arginine and lysine will not lead to equivalent interactions as cations. More generally, the molecular grammar described here refers to the FUS family proteins. However, there are numerous examples of non-prion-like intrinsically disordered regions that drive phase separation such as DDX4, LAF-1 and FIB1 (Elbaum-Garfinkle et al., 2015; Feric et al., 2016; Nott et al., 2015). There are also examples in which self-assembly is mediated by hydrophobicity (Simon et al., 2017), multivalent folded domains connected by flexible linkers (Banani et al., 2016), a coupling of folded oligomerizing domains and disordered regions (Feric et al., 2016; Protter and Parker, 2016), or coiled coil proteins (Woodruff et al., 2017). These differences could give rise to control of phase separation via specific sequence features, such as the creation of condensates with multiple phases as seen in the nucleolus and nuclear speckles, driving the formation of condensates with different identities (Fei et al., 2017; Feric et al., 2016).
If the interactions amongst arginine and tyrosine residues govern the saturation concentration, then it should be possible to predict the approximate saturation concentrations of FUS family proteins by adapting mean field theories that use the numbers of arginine and tyrosine residues as inputs (Flory, 1941; Semenov and Rubinstein, 1998; Stockmayer, 1943). Such theories predict that the saturation concentration should be inversely proportional to the product of the numbers of complementary stickers (for details see STAR Methods). In our case, the complementary stickers are tyrosine_and_ arginine residues. Indeed, this simple model shows that the measured saturation concentrations for all twelve constructs are positively correlated with the inverse of the product of the numbers of tyrosine_and_ arginine residues (Figure 7C). We used this model to predict the saturation concentration for a catalogue of proteins whose domains have similar lengths to those of PLDs and RBDs of FUS family proteins (Figures 7D, S7A and S7B, Table S5). These predictions identify interesting new proteins that may provide key scaffolding functions for numerous biochemical compartments inside cells.
STAR METHODS
CONTACT FOR REAGENT AND RESOURCE SHARING
Further information and requests for resources and reagents should be directed to and will be fulfilled by the Lead Contact, Anthony A. Hyman (hymanoffice@mpi-cbg.de).
EXPERIMENTAL MODEL AND SUBJECT DETAILS
HeLa Kyoto cells (female) were grown at 37 °C and 5 % CO2 in DMEM high glucose (4.5 g/L) medium supplemented with 100 U/mL streptomycin, 100 ug/mL penicillin and 10% fetal bovine serum. The cells were authenticated.
METHOD DETAILS
Domain and disorder prediction
The prion-like domains and the intrinsically disordered regions were identified using the PLAAC (http://plaac.wi.mit.edu/) (Lancaster et al., 2014). The minimal contiguous prion-like domain length for the hidden Markov model (HMM) was set to 60 and the background frequencies from S. cerevisiae was set to 100%. The boundary of the prion-like domains of FUS, EWSR1 and TAF15 were slightly modified according to the distribution of the charged residues.
To identify the structured regions, we adopted distinct method according to different situations. If the structures of the indicated domains are available in PDB (https://www.rcsb.org/pdb/home/home.do), the domain boundaries shown in the structures are used; if not, the domain boundaries are predicted by SMART (http://smart.embl-heidelberg.de/) or NCBI conserved domain (https://www.ncbi.nlm.nih.gov/Structure/cdd/wrpsb.cgi). In the cases that the homologue structures of certain domains are available, the domain boundaries are further optimized by structure-based sequence alignment.
Intrinsically disordered regions were identified using MobiDB-lite (Necci et al., 2017) and sequences were analyzed using localCIDER (Holehouse et al., 2017). MobiDB-lite provides a sequence-specific meta-prediction based on a number of independent disorder predictors. For a residue to be defined as disordered, three or more predictors (of 8) must predict a residue to be disordered. This is a relatively permissive threshold for identifying putative disordered regions, but is able to accurately identify the PLDs, which a number of disorder predictors fail to correctly designate as disordered.
Plot of domain structures/normalized occurrences
The domain structures of the proteins were generated using Illustrator for Biological Sequences (IBS) (Liu et al., 2015). To plot the normalized occurrences of distinct residues in the intrinsically disordered regions or the prion-like domains of FUS family proteins, the number of each residue in a given sequence was counted and divided by the length of the sequence. The value was further divided by the number of FUS family proteins. A color gradient was used to indicate the normalized amino acid occurrences.
Constructs, protein expression and purification
The construct information is listed in Table S1. We adopted different purification strategies according to different purposes. For a screen purpose, we purified proteins in small scale; while for normal experiments, we purified the proteins in large scale.
For large scale purification, all the proteins were first expressed in SF9 insect cells and harvested 72 hr post infection. Cells were collected by centrifugation for 5 min at 2,000 rpm. The pellets were re-suspended in lysis buffer (50 mM Tris-HCl pH 7.4, 1 M KCl, 5% Glycerol and 10 mM Imidazole). Protease inhibitors (Calbiochem, 1 mM PMSF, 100 μM AEBSF, 0.08 μM Aprotinin, 5 μM Bestatin, 1.5 μM E-64, 2 μM Leupeptin and 1 μM Pepstatin A) were added. The cells were lysed by sonication. The crude lysate was clarified by centrifugation for 20 min at 13,000 rpm. After centrifugation, the supernatant was incubated with Ni-NTA agarose (QIAGEN) for 1 hr. The agarose beads were collected by centrifugation for 5 min at 1,500 rpm and were transferred to the gravity columns. The protein-bound beads were further washed with 3 column volumes (CV, 1 CV = 20 ml) of lysis buffer. The proteins were eluted with the elution buffer (50 mM Tris-HCl pH 7.4, 1 M KCl, 5% Glycerol and 500 mM Imidazole). To cleave the His-MBP tag, 3C prescission protease was added to the eluted protein at a 1:50 ratio. The mixture was incubated at RT for 4 hr and was loaded to the amylose resin (NEB) columns. The flow through was collected and concentrated. The protein was further purified over the gel filtration chromatography (Superdex-200; GE Healthcare) equilibrated with storage buffer (50 mM Tris-HCl, 500 mM KCl, 1 mM DTT and 5% Glycerol). Peak fractions were pooled and aliquoted in PCR tubes, flash-frozen in liquid nitrogen and stored at −80 °C. Unless specifically mentioned, all the proteins used in this study were purified in this way.
In certain cases, we did small scale purification. We followed the same protocol up to the step in which the proteins were eluted from Ni-NTA agarose. The eluted proteins were then directly purified over the gel filtration chromatography equilibrated with storage buffer (50 mM Tris-HCl pH 7.4, 500 mM KCl, 1 mM DTT and 5% Glycerol). A tag cleavage step wasn’t included in the small-scale purification. Peak fractions were directly pooled and aliquoted in PCR tubes, flash-frozen in liquid nitrogen and stored at −80 °C. The His-MBP tag was cleaved off before the phase separation experiments to generate the proteins linked to GFP tag alone. Protein concentration was determined by measuring absorbance at 280 nm using a NanoDrop ND-1000 spectrophotometer (Thermo Scientific) before cleavage.
To visualize the SNAP tagged proteins, the proteins were mixed with SNAP-Surface Alexa Fluor 546 or 488 (NEB) at a 1:1.5 ratio at RT for 2 hr. Free dye was further removed by Zeba Spin Desalting Columns (Thermo Scientific, Lot # QH222764) equilibrated with the storage buffer.
Image collection
For the in vitro assays, images were taken using an IX71/IX81 inverted Spinning Disc Microscopes with an Andor Neo sCMOS/Andor Clara CCD camera and an UPlanSApo 60x oil-immersion objective or 100x oil-immersion objective (Olympus). To check the localization of FUS variants and G3BP1 in vivo, images were taken with an inverted Olympus IX71 microscope using 60x 1.42 NA or 100x 1.4 NA Plan Apochromat oil objectives, CoolSNAP HQ camera (Photometrics), and DeltaVision control unit (AppliedPrecision). To quantify the formation of FUS granules and the partition coefficient of FUS variants in stress granules, high-throughput imaging technique was used. The images were collected by a Yokogawa CV7000 high-content spinning disk confocal microscope equipped with a 60x 1.2 NA water immersion objective. Cells were fixed before imaging.
Phase separation assays
For droplet formation in the absence of crowding agents, proteins were diluted into various concentrations in the corresponding buffers in a total solution volume of 20 μL. For droplet formation in the presence of crowding agent, proteins at the indicated concentrations were tested for phase separation in the buffer containing 10% Dextran, 25 mM Tris-HCl 7.4, 150 mM KCl, 2.5% Glycerol and 0.5 mM DTT. The samples were added into the 384 well non-binding microplates (greiner bio-one). The images were taken after all the droplets had settled down to the bottom of the plate. For the assays in Figure S1A, before the experiment, the MBP tag was cleaved off. All the assays in other figures were done with the proteins tagged with either GFP or SNAP alone. To avoid the effect of the fluorescent tag on phase separation, the fluorescent tag is always positioned on the opposite side of the PLD (see also Table S1). Note that the fluorescent tag has minimal effect on the phase separation of the full-length protein (Figures S1G-S1I).
Analysis for tyrosine and arginine number within the disordered regions
The analysis was performed on disordered regions extracted from the complete non-redundant human proteome with a threshold of 650 or fewer disordered residues in a given protein (96% of proteins).
Determination of the saturation concentration
In the first method, we used microscopy to measure the fluorescence intensity and determine the total protein amount inside and outside the droplets. In the second method, we measured the turbidity of the solution at 340 nm or 450 nm. Phase separation will induce a significant change in the absorbance at these wavelengths. In a third assay, we used a centrifugation approach, in which we phase separated the samples at the indicated salt concentration, spun down the droplets and measured the concentration in the supernatant by determining the fluorescence intensity or using a spectrophotometer NanoDrop. All assays produced comparable results.
Client partitioning assays
10 μM unlabeled FUS-SNAP, 200 nM SNAP-Surface Alexa Fluor 546 labeled FUS-SNAP, and 1 μM GFP tagged client proteins were mixed and incubated in 15 mM Tris-7.4, 0.3 mM DTT, 1.6% Glycerol and 150 mM KCl. The images were taken after all the droplets settled down to the bottom of the plate. 19 out of 22 FUS family proteins were classified as clients according to their ability to undergo phase separation at the physiological salt concentration (Figure S1A). 12 out of 19 clients were able to partition into the scaffold droplets formed by FUS. Partition coefficients for the 12 clients were determined. To demonstrate the weak recruitment of some clients, we increased the contrast of the green channel by the same degree in Figure 2G. This caused an artificial layering effect when the signals from the two channels were merged (Panel G, bottom). The signals from the clients and FUS were in fact well mixed when the signal from the green channel was lowered. The plot shows the partition coefficient versus tyrosine and arginine number of the clients. A straight line was used to fit the data points.
Hardening assays
To estimate the material properties of different FUS mutants, controlled fusion experiments with phase separated FUS droplets were performed using a dual-trap optical tweezer instrument (Jahnel et al., 2011; Patel et al., 2015). Freshly formed droplets by 7.5 μM FUS variants in the phase separation buffer containing 10 mM Tris-HCl 7.4, 2% Dextran, 10 mM DTT, 100 mM KCl, and 1% Glycerol were applied to the sealed glass flow chambers (24 mm × 60 mm × 0.1 mm). Two droplets were trapped in two optical traps and brought into contact to induce droplet fusion.
Fusion times of successful fusion events were measured from the differential laser signal between the two traps (recorded throughout at 1 kHz) by fitting a stretched exponential relaxation model with decay time τ_st and stretch exponent β:
S(t)=offset+(plateau−offset)⋅[1−exp(−(t−tstart)τst)β]
The mean relaxation time, τ, – also denoted as fusion time in the main text – was extracted from the fitted stretched exponential decay function according to:
with Γ(…) being the Gamma function. Note that β=1 corresponds to the decay constant of a single exponential decay. Median stretch exponent of all fitted data (N = 63) was 1.69 (IQR = 1.30 – 2.05).
The radii of all droplets before fusion were extracted from bright-field images using custom written Python scripts for image processing and the geometric radius of two droplets was used to normalize the obtained fusion times.
Successful and unsuccessful droplet fusion events were recorded over time since the induction of phase separation and the resulting curve was fitted with a logistic regression model in R.
Droplets formed by G→A mutant fuse slower than those formed by WT. The assays were done with the freshly formed droplets. Mean relaxation times of recorded fusion events were scaled by characteristic droplet size. G→A droplets (magenta, N = 9) fuse at least 2 orders of magnitude slower than WT droplets (green, N = 55) (log-scale, p < 1e−5, Wilcoxon-Mann-Whitney test). Size-normalized median fusion times for the freshly formed droplets of G→A and WT are 32.9 s/μm (IQR = 15.7 – 54.6 s/μm) for G→A and 0.093 s/μm (IQR = 0.081 – 0.176 s/μm) for WT, respectively.
Droplets formed by G→A mutant stop fusing after 40 min while WT droplets do not change dynamics (quantification). Fusion was monitored over time and was scored successful (1) or not (0) according to whether the resulting droplet relaxed to approximately spherical shape within 2 min. G → A droplets (magenta, closed symbols, N = 50) solidified after 27 ± 9 min (logistic regression, 95% confidence) whereas WT droplets (green, open symbols, N = 118) remained fluid for the whole experimental time (2 h).
To test how glycine residues affect droplet liquidity, still images (see also Movie S1) of controlled fusion experiments at different time points were taken using dual-trap optical tweezers. 40 min after phase separation, droplets formed by G→A mutant did not fuse anymore, while the fusion dynamics of FUS WT did not change within 2 h. Collecting several droplets formed by G→A mutant resulted in a large gel-like assembly.
Fiber formation assays
To check the effect of distinct residues on fiber formation, 20 μL freshly formed droplets by 7.5 μM FUS variants in the phase separation buffer containing 10 mM Tris-HCl 7.4, 100 mM KCl and 1% Glycerol were added into the 384 well Nonbinding microplates. To induce fiber formation, the plate was shaken at 800 rpm on a benchtop shaker at RT. The images and the FRAP data were acquired at different time points. It should be noticed that, due to temperature fluctuation, the stock solution of FUS and certain mutants immediately underwent phase separation after being freshly thawed. The process was reversible since the solution turned transparent when the temperature reached RT. However, temporary phase separation induced by freeze and thaw could generate some fiber seeds. With those preformed seeds in the solution, the time-dependent transition of droplets into fibers could be affected (Murakami et al., 2015). To evaluate the effect of distinct residues precisely and avoid or minimize the effect of the preformed seeds on fiber formation, we took advantage of the MBP tag. It was shown that the N-terminal MBP tag can suppress phase separation of FUS (Burke et al., 2015). Indeed, we have not observed a long turbid state for the stock of the N-terminal MBP tagged FUS variants after thaw. Further aging experiments were done by freshly cleaving off MBP tag before the aging-related experiments. FUS proteins mixed with the cleaved MBP tag have slightly increased phase separation ability compared to the pre-cleaved versions, for which MBP tag was separated by gel filtration. This is probably due to the crowding effect of MBP. However, even in the presence of the free MBP tag, FUS variants showed distinct phase behavior as those identified with the proteins separated from MBP tag. This suggests the free MBP tag only has a minor crowding effect. The concentrations of the free MBP tag and prescission protease in the samples were 7.5 μM and 500 nM, respectively.
Prediction of potential scaffold proteins
In Figure 7D, shown is the application of the model from Figure 7Cin a proteome-wide analysis. The analysis was performed on disordered regions that were extracted from 13,354 proteins in the human proteome, as in Figure 2C. The figure shows two sets of data. This figure includes a two-dimensional histogram quantifying the frequencies of the disordered regions with the specific number of tyrosine and arginine residues. Overlaid atop this histogram are contours showing the predicted values of saturation concentration (_c_sat) in μM. The values of_c_sat decrease with increasing numbers of tyrosine and arginine residues. The plot shows the locations, in terms of numbers of tyrosine and arginine residues as well as the calculated values of _c_sat for proteins with predicted saturation concentrations that are on a par with the FET family of proteins. These predictions enable the identification of disordered regions that are likely to be scaffold molecules that undergo phase separation at physiologically relevant concentrations (Table S5). The top 10 prion-like proteins (Figure S7B) predicted to have the lowest saturation concentration are shown.
Fluorescence Recovery After Photobleaching (FRAP)
Droplets formed in vitro were photo-bleached with a spot 2 μm in diameter and the recovery of fluorescence intensity within the region of interest was obtained for each experiment. The recovery was recorded at the rate of 100 ms/frame. in vivo FRAP was performed at pixel resolution of x = 80 nm and y = 80 nm by a 100x oil immersion objective mounted on Olympus IX71/IX81 inverted confocal microscope with Andor spinning disc and Andor iXon EMCCD camera. Point bleach was performed for approximately 20 ns with 50-60% of maximum laser power of a 488 nm laser (3.5 mW). The recovery was recorded at the rate of 50 ms/frame for 50 seconds. The FRAP data were analyzed by easyFRAP.
DNA damage data acquisition and analysis
The indicated FUS variants were transfected into the FUS knock out HeLa cell line. DNA damage was induced by focusing 15 Hz cutter laser with 365 nm and 405 nm dye cells (MicroPoint laser Illumination and ablation system) on a spot in the nuclei using minimum laser power to induce FUS-GFP variant positive foci without disrupting nuclear morphology. Image was captured at a spinning disc microscope with inverted Olympus IX71 stand and Andor iXON EM+ DU-897 BV back illuminated EMCCD using Olympus UPlanSApochromat 100x 1.4 Oil objective. For comparison, only the cells with the similar expression level of FUS variant were selected for the DNA damage assay. The changes in the fluorescence intensity at the DNA damage sites was analyzed using FIJI. Fluorescence intensity plots are generated from n of 8 or more per genotype with error bars representing standard errors of the mean. All the data points were normalized to 0 being the lowest point of the dataset and 1 being the maximum intensity of the WT.
BAC constructs and cell lines
Stable HeLa cell line expressing C-terminal mCherry tagged human G3BP1 were generated by random integration into the genome via BAC recombineering technology, as previously reported (Poser et al., 2008). The cell line was kept under selection in Blasticidin (Life Technologies, 2 μg/ml).
Cell transfection and arsenate stress
50,000 indicated cells were plated in each well of 4 well 3.5 cm2 glass bottom culture plates (Greiner Bio-One, catalogue # 627870) two days before imaging. After 24 hours of plating the cells, plasmids expressing FUS-GFP variants were transfected using Lipofectamine 2000 (Life technologies), according to the manufacturer’s recommendations. The cells were washed with fresh cell culture medium the next day after transfection and imaged at 37 °C and 5% CO2. For the stressed condition, 1 mM sodium arsenate in culture media (diluted from a 100 mM stock solution, Sigma-Aldrich) was added to cells one hour before imaging.
Theoretical model
A Mean-field theory for networking of multivalent polymers with complementary pairs of associative motifs is used. The mean-field model we deploy in this work considers a solution of linear multivalent polymers, each with two types of associative motifs. The size of each motif is identical to that of an individual amino acid unit. We denote the motifs as Y and R for tyrosine and arginine. The interaction energy for a pair of Y and R residues may be written as ε_kBT_. Here, ε is a scaling parameter, kB is Boltzmann’s constant, and T is temperature. Each chain has _n_Y tyrosine and_n_R arginine residues separated by spacers. The concentration of residues is c and the number of polymers is: _N_pol = (cV/N) where N is the number of residues and V is the system volume. The number of interacting motifs of type i, where _i_is either Y or R, is given by:
| nmotif(i)=niNpol=nicVN; | (1) |
|---|
If the number of Y-R pairs is _N_pairs, then the fraction of associated motifs of type i is:
| pi=(npairsnmotif(i)); | (2) |
|---|
Following Semenov and Rubinstein, we separate the free energy of the system into two parts (Semenov and Rubinstein, 1998):
Here, _F_null is Flory’s expression for the free energy of non-associative polymers. In terms of the two- and three-body interaction coefficients viz.,_a_2 and _a_3, respectively this is written as:
| FnullkBT=cNln(ceN)+a2c22+a3c36; | (4) |
|---|
The term _F_motif is a distinct mean-field term that accounts for contributions from interacting motifs and is written in in terms of the partition function _Z_motif as:
| FmotifkBT=−(lnZmotifV); | (5) |
|---|
Here,
| Zmotif=Ωwexp(εNpairs); | (6) |
|---|
Equation (6) is written in terms of Ω, which denotes the number of unique ways of choosing _n_pairs of associative motifs out of_n_Y Y-motifs and_n_R R-motifs and w is the probability that the associative motifs are close to one another in order to form bonds with their partners. This implies that the bonds themselves are short-ranged. Accordingly,
Here, _v_b is the volume taken up by a single bond between associative motifs. The combinatorial parameter Ω is a product of the (i) the number of different ways of choosing_n_pairs out of _n_YY-motifs, (ii) the number of different ways of choosing_n_pairs out of _n_RR-motifs, and (iii) the number of different ways of forming_n_pairs of Y-R motifs. Therefore, the overall free energy expression takes the form:
| FkBT=cNln(eeN)+a2c22+a3c36−nYlnnY+(nY−npairs)ln(nY−npairs)−nRlnnR+(nR−npairs)ln(nR−npairs)+npairsln(npairsVVb)−(ℰ−1)npairs; | (8) |
|---|
Minimization of F with respect to_n_pairs yields:
| (nY−npairs)(nR−npairs)npairs=VVbexp(ε)=Vλ; | (9) |
|---|
As in the Flory-Stockmayer theories (Flory, 1941; Stockmayer, 1943), we assume tree-like clusters with no closed loops. Given this structure for the network formed by polymers with associative motifs, the gel point is defined as the point where a single polymer is connected to exactly two neighbors. Through a further simplification, we assume the absence of intramolecular interactions. These simplifications lead to the finding that: (npairs/_N_pol) ≈ 2 at the gel point. Combining this with equations (1) and (9) and making one last assumption that N[vbexp(ε)]−1≫ 1, which holds for sufficiently weak interactions that allow us to ignore higher order terms, we obtain the concentration at the gel point, our proxy for the saturation concentration, to be:
| cg≡csat≈N2λnYnR∝1nYnR; | (10) |
|---|
QUANTIFICATION AND STATISTICAL ANALYSIS
Images were analyzed with FIJI (http://fiji.sc/), origin 7 (OriginLab) and Sigmaplot (Systat Software Inc.,). All data are expressed as the mean ± the standard deviation (SD).
To plot the relative amount of condensed protein versus the protein concentration, a mask of the droplets is built by thresholding the images and applying a median filter to remove spurious noise detection. Median filter window radius is equal to 2 pixels. The threshold is determined in the same way for each condition as the mean intensity of the background plus k times the standard deviation of the background. This way the threshold is well defined even if no droplets are present in the image. The background signal appearing as a sharp peak in the images histogram, background mean, and standard deviation are estimated by the maximum and standard deviation of this peak. The user parameter k was set to the value 3 at the beginning of the analysis. The integrated intensity inside the droplet, Idroplet, and outside, Imedia, is measured by summing, respectively, the intensity of each pixel inside, outside the droplet mask. If no droplets appear, the ratio is set to 0. In case of non-zero camera offset, an image can be acquired with shutter closed and its average intensity removed from each pixel contribution.
To plot the relative amount of condensed protein versus the protein concentration, we first measured the amount condensed protein for a certain candidate. The amount condensed protein for a given candidate under a certain concentration is defined by the ratio of Idroplet to Imedia. To normalize this value, we measured the amount condensed FUS under different protein concentrations in the same buffer condition to find the maximal amount condensed FUS. The relative amount condensed protein for a given candidate is defined by the ratio: amount condensed candidate under distinct protein concentration/the maximal amount condensed FUS.
The measured data sets for the relative amount of condensed protein versus the protein concentration were fitted by the following equation:
where f is the relative amount condensed protein, and x is the corresponding protein concentration.
To analyze the partition of clients into FUS droplets, we report the average intensity of the client proteins in the droplet versus the bulk solution after background subtraction for individual droplet (Partition coefficient).
To analyse the in vivo granules, the image analysis consisted of four steps: 1) semiautomatic segmentation of cell cytoplasm, 2) local maxima detection to determine granules positions, 3) segmentation of the granules using region growing and 4) signal readout for the different derived regions of interest (ROI). All the steps were performed in the ImageJ/Fiji software. In detail, threshold-based segmentation of the nuclei in the first channel was performed using the default threshold. Afterwards, the cytoplasm was segmented in the second channel. Then, all pixels being marked as part of the nuclei were removed from the cytoplasm ROIs. Finally, the user had the chance to manually correct the segmentation. Detection of the granules was performed using the built-in method for local maxima detection. These point positions were then allocated to the cytoplasm segmentations derived before. Afterwards, every granule is segmented using a region growing approach starting at the local maximum position including all pixels where the intensity is above a certain threshold. This threshold was calculated by summing average signal intensity within the cytoplasm and the signal intensity at the detected local maximum and dividing the sum by two. Finally, signal intensities as well as pixel counts were derived from the cytoplasm ROI, all granule ROIs and the cytoplasm ROI excluding all granule ROIs.
Supplementary Material
10
Figure S1. Determination of the saturation concentration with different methods. Related to Figure 1.
(A) Phase separation of FUS family proteins at the physiological salt concentration requires further addition of crowding agents except the FET proteins. Phase separation assays were conducted with proteins purified in small scale (see STAR Methods). 5 μM proteins tagged with MBP and GFP were first mixed with prescission protease to cleave off MBP tag and then submitted to the phase separation assays in the absence or presence of 10% dextran at 150 mM KCl. Bar, 5 μm.
(B) An overall schematic of the various methods used.
(C) Results of six different approaches for identifying_c_sat. All six methods give almost identical values. These methods are: [top left] Measuring the amount of condensed protein (condensed protein only appears above_c_sat); [top right] Intensity ratio inside of droplet versus inside + outside of droplet; [middle left] Absorbance at 340 nm (condensed protein has a significantly different absorbance profile, leading to a pronounced uptick in A340 absorbance); [middle right] Absorbance at 405 nm (same as A340); [bottom left] Concentration in supernatant after spin-down (_c_out) as measured by NanoDrop. Above _c_sat the supernatant concentration should be fixed (excess protein will partition into condensates). [bottom right] Average fluorescence intensity for supernatant after spin. Above _c_sat the average fluorescence intensity should be fixed (excess protein will partition into condensates).
(D) An overall schematic of the _c_outmeasurement in the non-phase separation condition and the phase separation condition.
(E) Measured _c_out in the non-phase separation condition and the phase separation condition.
(F) Correlation of the _c_sat values determined by images or by measuring _c_out with NanoDrop. The Pearson correlation coefficient is determined to be 0.99.
(G) SDS-PAGE for the untagged hnRNPA3 and FUS.
(H) Phase separation of the SNAP-tagged and untagged FUS described by relative amount condensed protein versus FUS concentration. The phase separation assays were done at 150 mM KCl. All data are expressed as the mean ± the standard deviation (SD).
(I) Phase separation of the GFP-tagged and untagged hnRNPA1 quantified by relative amount condensed protein versus hnRNPA3 concentration. The phase separation assays were done at 150 mM KCl. All data are expressed as the mean ± the standard deviation (SD).
Figure S2. Low saturation concentrations of FUS and EWSR1 are determined by both the tyrosine-rich PLD and arginine-rich RBD. Related toFigure 2.
(A) SDS-PAGE for the fragments, mutants and fusion proteins of FUS and EWSR1.
(B) Colocalization of the PLD and RBD from FUS (top) and from EWSR1 (bottom). Droplets were formed at 75 mM KCl. The PLDs and RBDs were labeled with SNAP-Surface Alexa Fluor 488 and 546 dyes, respectively. Bar, 5 μm.
(C) The saturation concentration of FUS PLD is over 120 μM. The assays were conducted at 75 mM KCl in the absence of crowding agents. The saturation concentration of FUS is around 2 μM (Figure 2B). Bar, 5 μm.
(D) Phase separation of FUS full length (FL) or PLD in the presence of dextran. The assays were conducted at 150 mM KCl. Bar, 15 μm.
(E) The RBD of EWSR1 significantly promotes phase separation of the PLD. The assays were conducted at 75 mM KCl with 15 μM proteins in the absence of crowding agent. The PLD and RBD were mixed at a ratio of 1:1. Bar, 5 μm.
(F) Tyrosine residues in PLDs and arginine residues in RBDs contribute to co-phase separation. Phase separation assays were performed at 75 mM KCl. All data are expressed as the mean ± the standard deviation (SD).
(G-I) Representative images for the quantification in Figures 2B, 2D, 2E and S2E. Phase separation assays were conducted at 75 mM KCl. Bar, 5 μm.
Figure S3. Separation of tyrosine and arginine is not required for determining the saturation concentration. Related to Figure 2.
(A) Tyrosine and arginine residues are in an embedded pattern in the disordered regions of TAF15 RBD. The positions of tyrosine and arginine residues in the disordered regions of TAF15 are indicated with green and red lines, respectively.
(B) SDS-PAGE for the fragments and mutants of TAF15.
(C) Colocalization of PLD and RBD from TAF15. Droplets were formed at 100 mM KCl. The PLD and RBD were labeled with SNAP-Surface Alexa Fluor 488 and 546 dyes, respectively. Bar, 5 μm.
(D and E) TAF15 RBD with tyrosine and arginine embedded into each other has a low saturation concentration similar to that of the full-length protein. Phase separation assays were conducted at 100 mM KCl. (D), phase separation of TAF15 fragments at the indicated protein concentrations. Bar, 5 μm; (E), phase separation described by the relative amount of condensed protein versus the protein concentration. The saturation concentration is indicated by a red arrow. All data are expressed as the mean ± the standard deviation (SD).
(F and G) Decreasing the number of tyrosine or GGY[G/S]GDR repeats increases the saturation concentration. The positions of 19 GGY[G/S]DR repeats are indicated by the white triangles. The yellow triangle represents that the tyrosine residues inside the repeat are mutated to serine residues. Phase separation assays were conducted at 100 mM KCl. (F), phase separation of TAF15 RBD mutants and fragments at the indicated protein concentrations. Bar, 5 μm; (G), phase separation described by the relative amount of condensed protein versus the protein concentration. All data are expressed as the mean ± the standard deviation (SD).
Figure S4. Manipulating protein phase behavior in vitro and in vivo. Related to Figure 3.
(A) SDS-PAGE for FUS(27R), hnRNPA1 (PLD 6R) and hnRNPA1a (PLD 10R, F→Y).
(B) Representative images for the quantification in Figure 6B. Phase separation assays were conducted at 150 mM KCl. Bar, 5 μm.
(C) Representative images for the quantification in Figure 3D. The inset shows a zoomed-in area. Bar, 5 μm.
(D) In the absence of stress, preformed WT (∆NLS) granules were dynamic while 27R (∆NLS) granules were not. The dynamic of the preformed granules was measured by FRAP.
(D) Partitioning of WT (∆NLS) and 27R (∆NLS) into stress granules upon arsenate treatment. Bar, 5 μm.
(F) Inside stress granules, WT (∆NLS) is dynamic while 27R (∆NLS) is not. FRAP data was collected. All data are expressed as the mean ± the standard deviation.
(G) 27R (∆NLS) is enriched more in stress granules than WT (∆NLS) after arsenate treatment. Bar, 5 m. All data are expressed as the mean ± the standard deviation (SD).
Figure S5. Tuning protein phase behavior by distinct composition of electrostatic amino acids. Related to Figure 5.
(A) SDS-PAGE for FUS PLD and TAF15 PLD mutants.
(B) Representative images for the quantification in Figure 4B. Phase separation assays were conducted at 75 mM KCl in the absence of crowding agents. Bar, 5 μm. (C and D) Addition of negative charges promotes co-phase separation of FUS PLD and FUS RBD. WT FUS PLD has a low content of negative charges (4 aspartic acids/glutamate acids). Indicated amount of FUS PLD variant was titrated into 30 μM FUS RBD in the absence of crowding agents at 75 mM KCl. All data are expressed as the mean ± the standard deviation (SD). Bar, 5 μm.
(E) Substitution of aspartate and glutamate residues with glycine restores tyrosine-tyrosine interactions and leads to phase separation of TAF15 PLD in the presence of crowding agents. Phase separation assays were conducted in the absence or presence of 10% dextran at 150 mM KCl. Top, TAF15 PLD did not undergo phase separation even in the presence of 10% dextran; middle, replacement of aspartate and glutamate residues with glycine residues enables phase separation of TAF15 PLD in the presence of dextran; bottom, phase behavior of a TAF15 PLD variant with tyrosine residues mutated to serine residues. The positions of tyrosine and aspartate residues are indicated by green and yellow lines. Bar, 5 μm.
(F – G) Reduction of negative charges decreases co-phase separation of TAF15 PLD and FUS RBD. The wild-type TAF15 PLD has a high content of negative charges (20 aspartic acids/glutamate acids). Indicated amount of TAF15 PLD variant was titrated into 30 μM FUS RBD in the absence of crowding agents at 75 mM KCl. All data are expressed as the mean ± the standard deviation (SD). Bar, 5 μm.
Figure S6. Amino acid composition of the intrinsically disordered regions of FUS family proteins. Related to Figure 6.
(A) Amino acid composition of the intrinsically disordered regions of FUS family proteins (top) and FUS PLD (bottom). It is worth noting that FUS PLD has a strikingly limited set of amino acid alphabet, and only 4 types of residues, namely, glycine, glutamine, serine, and tyrosine residues, together account for ~ 82% residues in FUS PLD.
(B) Pearson correlation analysis for glycine content versus other residue contents of other amino acids in the PLDs intrinsically disordered regions of FUS family proteins.
(C) SDS-PAGE for FUS G→A, S→A and Q→G mutant.
(D) Representative images for the quantification in Figure 5B. Phase separation assays were conducted at 75 mM KCl. Bar, 5 μm.
Figure S7. Amino acid composition of the prion-like candidates with the predicted saturation concentration. Related to Figure 7.
(A) Amino acid composition of the prion-like candidates. The proteins are listed in an order based on the values of the saturation concentration (from low to high, Table S5). The absolute occurrence represents the absolute number of the indicated residues, whereas the normalized occurrence reflects the number of the indicated residues normalized by the sequence length (see method details). We used the absolute occurrence rather than the normalized occurrence for tyrosine or arginine residues since the saturation concentration is largely determined by the absolute numbers of tyrosine and arginine residues. The names of the proteins tested to be capable of phase separation in this study are colored in blue.
(B) Domain structures of the top 10 prion-like candidates predicted to have the lowest saturation concentration. The ranking number is shown behind the protein name. The domain structures of the FET proteins are not shown. SAP, domain shared by SAF-A/B, Acinus and PIAS; B30.2/SPRY: B30.2, domain encoded by exon B30-2; SPRY, domain named after SPla and Ryanodine receptor; RNase III, ribonuclease III; DRBM, dsRNA-binding motif; DZF, domain associated with zinc fingers; PINc, PilT N terminus, or PINc domain (SMART database); BAG, domain presented in Bcl-2-associated athanogene.
Table S5. List of prion-like proteins with the predicted saturation concentration of phase separation. Related to Figure 7.
Table S6. Sequences for the proteins used in this study. Related toFigure 1.
11
Movie S1. Fusion of droplets formed by FUS WT and GA mutant overtime. Related to Figure 6.
12
13
14
15
16
17
4
5
6
7
8
9
HIGHTLIGHTS.
- Phase separation of FUS requires both the N-terminal PLD and C-terminal RBD.
- Tyrosine and arginine govern the saturation concentration of phase separation.
- Glycine maintains liquidity, whereas glutamine and serine promote hardening.
- An associative polymer model predicts the phase behavior of FUS family proteins.
Acknowledgments
We would like to thank the following Services and Facilities of the MPI-CBG for their support: Protein Expression, Chromatography, Light Microscopy, Technology Development Studio and Scientific Computing Facility. We thank Frank Jülicher for critical comments; members of MPI-CBG for helpful discussions and comments on the manuscript; Avinash Patel and Titus Franzmann for help with the_in vitro_ assays; Nicola Maghelli and Dimitrios Papadopoulos for help with the in vivo assays; Barbara Borgonovo for help with FPLC; Martine Ruer for help with protein purification; Regina Wegner for insect cell culture; Aliona Bogdanova for vectors; Marit Leuschner and Andrea Ssykor for cell lines; Jan Peychl, Bert Nitzsche and Britta Schroth-Diez for help with light microscopy; Marc Bickle, Cordula Andree and Claudia Möbius for screen experiments in cells; Benoit Lombardot, Robert Haase and Beatriz Ferreira Gomes for image analysis; Naharajan Lakshmanaperumal for bioinformatics analysis; This work was funded by a direct grant from the Max Planck Society and the MaxSynBio Consortium, the US National Institutes of Health 5R01NS056114 (RVP), the St. Jude Research Collaborative on Membraneless Organelles (RVP), the ERC (No. 725836 and 643417) (SA), two BMBF grants (01ED1601A) (SA) and (031A359A) (AAH), the JPND (CureALS) (SA), and the Human Frontier Science Program RGP0034/2017 (SA and RVP).
Footnotes
Publisher's Disclaimer: This is a PDF file of an unedited manuscript that has been accepted for publication. As a service to our customers we are providing this early version of the manuscript. The manuscript will undergo copyediting, typesetting, and review of the resulting proof before it is published in its final citable form. Please note that during the production process errors may be discovered which could affect the content, and all legal disclaimers that apply to the journal pertain.
AUTHOR CONTRIBUTION
J.W. purified proteins from insect cells with help from D.D., R.L. and X.Z. J.W. performed the in vitro phase separation experiments with help from X.Z. H.O.L performed the in vivo DNA damage experiments with FUS, with help from J.W. and I.P. performed the in vivo_stress granule formation experiments. S.M. performed the in vivo photobleaching experiments. M.J. performed and analyzed the_in vitro fusion optical tweezer experiments. J.W. and S.M. analyzed the in vitro photobleaching experiments. D.D. designed vectors and helped with purification strategies. A.P. constructed all clones. I.P. designed, characterized and produced the cell lines. R.V.P introduced the stickers and spacers framework. J.M.C., J.W., A.S.H. and R.V.P. designed the mutations to distinguish stickers from spacers. J.M.C. and R.V.P. developed the theory. A.S.H and J.M.C performed the informatics analysis. A.A.H and S.A conceived the project. A.A.H., S.A. and R.V.P. wrote the paper with help from J.W., J.M.C, and A.S.H.
DECLARATION OF INTERESTS
The authors declare no competing interests.
References
- Alberti S, Halfmann R, King O, Kapila A, Lindquist S. A systematic survey identifies prions and illuminates sequence features of prionogenic proteins. Cell. 2009;137:146–158. doi: 10.1016/j.cell.2009.02.044. [DOI] [PMC free article] [PubMed] [Google Scholar]
- Aleksandrov R, Dotchev A, Poser I, Krastev D, Georgiev G, Panova G, Babukov Y, Danovski G, Dyankova T, Hubatsch L, et al. Protein Dynamics in Complex DNA Lesions. Molecular cell. 2018;69:1046–1061.e1045. doi: 10.1016/j.molcel.2018.02.016. [DOI] [PubMed] [Google Scholar]
- Altmeyer M, Neelsen KJ, Teloni F, Pozdnyakova I, Pellegrino S, Grofte M, Rask MB, Streicher W, Jungmichel S, Nielsen ML, et al. Liquid demixing of intrinsically disordered proteins is seeded by poly(ADP-ribose) Nat Commun. 2015;6:8088. doi: 10.1038/ncomms9088. [DOI] [PMC free article] [PubMed] [Google Scholar]
- Banani SF, Lee HO, Hyman AA, Rosen MK. Biomolecular condensates: organizers of cellular biochemistry. Nature reviews Molecular cell biology. 2017;18:285–298. doi: 10.1038/nrm.2017.7. [DOI] [PMC free article] [PubMed] [Google Scholar]
- Banani SF, Rice AM, Peeples WB, Lin Y, Jain S, Parker R, Rosen MK. Compositional Control of Phase-Separated Cellular Bodies. Cell. 2016;166:651–663. doi: 10.1016/j.cell.2016.06.010. [DOI] [PMC free article] [PubMed] [Google Scholar]
- Berchowitz Luke E, Kabachinski G, Walker Margaret R, Carlile Thomas M, Gilbert Wendy V, Schwartz Thomas U, Amon A. Regulated Formation of an Amyloid-like Translational Repressor Governs Gametogenesis. Cell. 2015;163:406–418. doi: 10.1016/j.cell.2015.08.060. [DOI] [PMC free article] [PubMed] [Google Scholar]
- Bergeron-Sandoval LP, Safaee N, Michnick SW. Mechanisms and Consequences of Macromolecular Phase Separation. Cell. 2016;165:1067–1079. doi: 10.1016/j.cell.2016.05.026. [DOI] [PubMed] [Google Scholar]
- Boke E, Ruer M, Wuhr M, Coughlin M, Lemaitre R, Gygi SP, Alberti S, Drechsel D, Hyman AA, Mitchison TJ. Amyloid-like Self-Assembly of a Cellular Compartment. Cell. 2016;166:637–650. doi: 10.1016/j.cell.2016.06.051. [DOI] [PMC free article] [PubMed] [Google Scholar]
- Brady JP, Farber PJ, Sekhar A, Lin YH, Huang R, Bah A, Nott TJ, Chan HS, Baldwin AJ, Forman-Kay JD, et al. Structural and hydrodynamic properties of an intrinsically disordered region of a germ cell-specific protein on phase separation. Proc Natl Acad Sci U S A. 2017;114:E8194–e8203. doi: 10.1073/pnas.1706197114. [DOI] [PMC free article] [PubMed] [Google Scholar]
- Brangwynne CP, Eckmann CR, Courson DS, Rybarska A, Hoege C, Gharakhani J, Julicher F, Hyman AA. Germline P granules are liquid droplets that localize by controlled dissolution/condensation. Science (New York, NY) 2009;324:1729–1732. doi: 10.1126/science.1172046. [DOI] [PubMed] [Google Scholar]
- Burke KA, Janke AM, Rhine CL, Fawzi NL. Residue-by-Residue View of In Vitro FUS Granules that Bind the C-Terminal Domain of RNA Polymerase II. Molecular cell. 2015;60:231–241. doi: 10.1016/j.molcel.2015.09.006. [DOI] [PMC free article] [PubMed] [Google Scholar]
- Burley SK, Petsko GA. Weakly polar interactions in proteins. Advances in protein chemistry. 1988;39:125–189. doi: 10.1016/s0065-3233(08)60376-9. [DOI] [PubMed] [Google Scholar]
- Crozat A, Aman P, Mandahl N, Ron D. Fusion of CHOP to a novel RNA-binding protein in human myxoid liposarcoma. Nature. 1993;363:640–644. doi: 10.1038/363640a0. [DOI] [PubMed] [Google Scholar]
- Dougherty DA. Cation-pi interactions in chemistry and biology: a new view of benzene, Phe, Tyr, and Trp. Science (New York, NY) 1996;271:163–168. doi: 10.1126/science.271.5246.163. [DOI] [PubMed] [Google Scholar]
- Dougherty DA. The cation-pi interaction. Accounts of chemical research. 2013;46:885–893. doi: 10.1021/ar300265y. [DOI] [PMC free article] [PubMed] [Google Scholar]
- Elbaum-Garfinkle S, Kim Y, Szczepaniak K, Chen CCH, Eckmann CR, Myong S, Brangwynne CP. The disordered P granule protein LAF-1 drives phase separation into droplets with tunable viscosity and dynamics. Proceedings of the National Academy of Sciences. 2015;112:7189–7194. doi: 10.1073/pnas.1504822112. [DOI] [PMC free article] [PubMed] [Google Scholar]
- Fei J, Jadaliha M, Harmon TS, Li ITS, Hua B, Sci HQJ. Quantitative analysis of multilayer organization of proteins and RNA in nuclear speckles at super resolution. Journal of cell science. 2017 doi: 10.1242/jcs.206854. [DOI] [PMC free article] [PubMed] [Google Scholar]
- Feric M, Vaidya N, Harmon TS, Mitrea DM, Zhu L, Richardson TM, Kriwacki RW, Pappu RV, Brangwynne CP. Coexisting Liquid Phases Underlie Nucleolar Subcompartments. Cell. 2016;165:1686–1697. doi: 10.1016/j.cell.2016.04.047. [DOI] [PMC free article] [PubMed] [Google Scholar]
- Flory PJ. Molecular Size Distribution in Three Dimensional Polymers. I. Gelation1. Journal of the American Chemical Society. 1941;63:3083–3090. [Google Scholar]
- Franzmann TM, Jahnel M, Pozniakovsky A, Mahamid J, Holehouse AS, Nuske E, Richter D, Baumeister W, Grill SW, Pappu RV, et al. Phase separation of a yeast prion protein promotes cellular fitness. Science (New York, NY) 2018;359 doi: 10.1126/science.aao5654. [DOI] [PubMed] [Google Scholar]
- Gallivan JP, Dougherty DA. Cation-pi interactions in structural biology. Proceedings of the National Academy of Sciences of the United States of America. 1999;96:9459–9464. doi: 10.1073/pnas.96.17.9459. [DOI] [PMC free article] [PubMed] [Google Scholar]
- Gobbi A, Frenking G. Y-Conjugated compounds: the equilibrium geometries and electronic structures of guanidine, guanidinium cation, urea, and 1,1-diaminoethylene. Journal of the American Chemical Society. 1993;115:2362–2372. [Google Scholar]
- Han TW, Kato M, Xie S, Wu LC, Mirzaei H, Pei J, Chen M, Xie Y, Allen J, Xiao G, et al. Cell-free formation of RNA granules: bound RNAs identify features and components of cellular assemblies. Cell. 2012;149:768–779. doi: 10.1016/j.cell.2012.04.016. [DOI] [PubMed] [Google Scholar]
- Hein MY, Hubner NC, Poser I, Cox J, Nagaraj N, Toyoda Y, Gak IA, Weisswange I, Mansfeld J, Buchholz F, et al. A human interactome in three quantitative dimensions organized by stoichiometries and abundances. Cell. 2015;163:712–723. doi: 10.1016/j.cell.2015.09.053. [DOI] [PubMed] [Google Scholar]
- Hernandez-Vega A, Braun M, Scharrel L, Jahnel M, Wegmann S, Hyman BT, Alberti S, Diez S, Hyman AA. Local Nucleation of Microtubule Bundles through Tubulin Concentration into a Condensed Tau Phase. Cell Rep. 2017;20:2304–2312. doi: 10.1016/j.celrep.2017.08.042. [DOI] [PMC free article] [PubMed] [Google Scholar]
- Holehouse AS, Das RK, Ahad JN, Richardson MO, Pappu RV. CIDER: Resources to Analyze Sequence-Ensemble Relationships of Intrinsically Disordered Proteins. Biophys J. 2017;112:16–21. doi: 10.1016/j.bpj.2016.11.3200. [DOI] [PMC free article] [PubMed] [Google Scholar]
- Hyman Anthony A, Brangwynne Clifford P. Beyond Stereospecificity: Liquids and Mesoscale Organization of Cytoplasm. Developmental Cell. 2011;21:14–16. doi: 10.1016/j.devcel.2011.06.013. [DOI] [PubMed] [Google Scholar]
- Hyman AA, Weber CA, Julicher F. Liquid-liquid phase separation in biology. Annual review of cell and developmental biology. 2014;30:39–58. doi: 10.1146/annurev-cellbio-100913-013325. [DOI] [PubMed] [Google Scholar]
- Jahnel M, Behrndt M, Jannasch A, Schaffer E, Grill SW. Measuring the complete force field of an optical trap. Opt Lett. 2011;36:1260–1262. doi: 10.1364/OL.36.001260. [DOI] [PubMed] [Google Scholar]
- Kato M, Han TW, Xie S, Shi K, Du X, Wu LC, Mirzaei H, Goldsmith EJ, Longgood J, Pei J, et al. Cell-free formation of RNA granules: low complexity sequence domains form dynamic fibers within hydrogels. Cell. 2012;149:753–767. doi: 10.1016/j.cell.2012.04.017. [DOI] [PMC free article] [PubMed] [Google Scholar]
- King OD, Gitler AD, Shorter J. The tip of the iceberg: RNA-binding proteins with prion-like domains in neurodegenerative disease. Brain Res. 2012;1462:61–80. doi: 10.1016/j.brainres.2012.01.016. [DOI] [PMC free article] [PubMed] [Google Scholar]
- Kwon I, Kato M, Xiang S, Wu L, Theodoropoulos P, Mirzaei H, Han T, Xie S, Corden JL, McKnight SL. Phosphorylation-regulated binding of RNA polymerase II to fibrous polymers of low-complexity domains. Cell. 2013;155:1049–1060. doi: 10.1016/j.cell.2013.10.033. [DOI] [PMC free article] [PubMed] [Google Scholar]
- Lancaster AK, Nutter-Upham A, Lindquist S, King OD. PLAAC: a web and command-line application to identify proteins with prion-like amino acid composition. Bioinformatics. 2014;30:2501–2502. doi: 10.1093/bioinformatics/btu310. [DOI] [PMC free article] [PubMed] [Google Scholar]
- Lin Y, Currie SL, Rosen MK. Intrinsically disordered sequences enable modulation of protein phase separation through distributed tyrosine motifs. The Journal of biological chemistry. 2017;292:19110–19120. doi: 10.1074/jbc.M117.800466. [DOI] [PMC free article] [PubMed] [Google Scholar]
- Lin Y, Protter DS, Rosen MK, Parker R. Formation and Maturation of Phase-Separated Liquid Droplets by RNA-Binding Proteins. Mol Cell. 2015;60:208–219. doi: 10.1016/j.molcel.2015.08.018. [DOI] [PMC free article] [PubMed] [Google Scholar]
- Lin YH, Forman-Kay JD, Chan HS. Sequence-Specific Polyampholyte Phase Separation in Membraneless Organelles. Phys Rev Lett. 2016;117:178101. doi: 10.1103/PhysRevLett.117.178101. [DOI] [PubMed] [Google Scholar]
- Liu W, Xie Y, Ma J, Luo X, Nie P, Zuo Z, Lahrmann U, Zhao Q, Zheng Y, Zhao Y, et al. IBS: an illustrator for the presentation and visualization of biological sequences. Bioinformatics. 2015;31:3359–3361. doi: 10.1093/bioinformatics/btv362. [DOI] [PMC free article] [PubMed] [Google Scholar]
- Malinovska L, Kroschwald S, Alberti S. Protein disorder, prion propensities, and self-organizing macromolecular collectives. Biochimica et biophysica acta. 2013;1834:918–931. doi: 10.1016/j.bbapap.2013.01.003. [DOI] [PubMed] [Google Scholar]
- Malinovska L, Palm S, Gibson K, Verbavatz JM, Alberti S. Dictyostelium discoideum has a highly Q/N-rich proteome and shows an unusual resilience to protein aggregation. Proceedings of the National Academy of Sciences of the United States of America. 2015;112:E2620–2629. doi: 10.1073/pnas.1504459112. [DOI] [PMC free article] [PubMed] [Google Scholar]
- Molliex A, Temirov J, Lee J, Coughlin M, Kanagaraj AP, Kim HJ, Mittag T, Taylor JP. Phase separation by low complexity domains promotes stress granule assembly and drives pathological fibrillization. Cell. 2015;163:123–133. doi: 10.1016/j.cell.2015.09.015. [DOI] [PMC free article] [PubMed] [Google Scholar]
- Monahan Z, Ryan VH, Janke AM, Burke KA, Rhoads SN, Zerze GH, O’Meally R, Dignon GL, Conicella AE, Zheng W, et al. Phosphorylation of the FUS low-complexity domain disrupts phase separation, aggregation, and toxicity. EMBO J. 2017;36:2951–2967. doi: 10.15252/embj.201696394. [DOI] [PMC free article] [PubMed] [Google Scholar]
- Murakami T, Qamar S, Lin JQ, Schierle GS, Rees E, Miyashita A, Costa AR, Dodd RB, Chan FT, Michel CH, et al. ALS/FTD Mutation-Induced Phase Transition of FUS Liquid Droplets and Reversible Hydrogels into Irreversible Hydrogels Impairs RNP Granule Function. Neuron. 2015;88:678–690. doi: 10.1016/j.neuron.2015.10.030. [DOI] [PMC free article] [PubMed] [Google Scholar]
- Murray DT, Kato M, Lin Y, Thurber KR, Hung I, McKnight SL, Tycko R. Structure of FUS Protein Fibrils and Its Relevance to Self-Assembly and Phase Separation of Low-Complexity Domains. Cell. 2017;171:615–627 e616. doi: 10.1016/j.cell.2017.08.048. [DOI] [PMC free article] [PubMed] [Google Scholar]
- Necci M, Piovesan D, Dosztanyi Z, Tosatto SCE. MobiDB-lite: fast and highly specific consensus prediction of intrinsic disorder in proteins. Bioinformatics. 2017;33:1402–1404. doi: 10.1093/bioinformatics/btx015. [DOI] [PubMed] [Google Scholar]
- Nott TJ, Petsalaki E, Farber P, Jervis D, Fussner E, Plochowietz A, Craggs TD, Bazett-Jones DP, Pawson T, Forman-Kay JD, et al. Phase transition of a disordered nuage protein generates environmentally responsive membraneless organelles. Molecular cell. 2015;57:936–947. doi: 10.1016/j.molcel.2015.01.013. [DOI] [PMC free article] [PubMed] [Google Scholar]
- Pak CW, Kosno M, Holehouse AS, Padrick SB, Mittal A, Ali R, Yunus AA, Liu DR, Pappu RV, Rosen MK. Sequence Determinants of Intracellular Phase Separation by Complex Coacervation of a Disordered Protein. Mol Cell. 2016;63:72–85. doi: 10.1016/j.molcel.2016.05.042. [DOI] [PMC free article] [PubMed] [Google Scholar]
- Patel A, Lee HO, Jawerth L, Maharana S, Jahnel M, Hein MY, Stoynov S, Mahamid J, Saha S, Franzmann TM, et al. A Liquid-to-Solid Phase Transition of the ALS Protein FUS Accelerated by Disease Mutation. Cell. 2015;162:1066–1077. doi: 10.1016/j.cell.2015.07.047. [DOI] [PubMed] [Google Scholar]
- Protter DS, Parker R. Principles and Properties of Stress Granules. Trends in cell biology. 2016;26:668–679. doi: 10.1016/j.tcb.2016.05.004. [DOI] [PMC free article] [PubMed] [Google Scholar]
- Ramachandran GN, Ramakrishnan C, Sasisekharan V. Stereochemistry of polypeptide chain configurations. Journal of molecular biology. 1963;7:95–99. doi: 10.1016/s0022-2836(63)80023-6. [DOI] [PubMed] [Google Scholar]
- Riback JA, Katanski CD, Kear-Scott JL, Pilipenko EV, Rojek AE, Sosnick TR, Drummond DA. Stress-Triggered Phase Separation Is an Adaptive, Evolutionarily Tuned Response. Cell. 2017;168:1028–1048576000. doi: 10.1016/j.cell.2017.02.027. [DOI] [PMC free article] [PubMed] [Google Scholar]
- Rubinstein M, Dobrynin AV. Solutions of Associative Polymers. Trends in Polymer Science. 1997;5:181–186. [Google Scholar]
- Schwartz JC, Cech TR, Parker RR. Biochemical Properties and Biological Functions of FET Proteins. Annual review of biochemistry. 2015;84:355–379. doi: 10.1146/annurev-biochem-060614-034325. [DOI] [PMC free article] [PubMed] [Google Scholar]
- Semenov AN, Rubinstein M. Thermoreversible Gelation in Solutions of Associative Polymers. 1. Statics. Macromolecules. 1998;31:1373–1385. [Google Scholar]
- Shin Y, Brangwynne CP. Liquid phase condensation in cell physiology and disease. Science (New York, NY) 2017;357 doi: 10.1126/science.aaf4382. [DOI] [PubMed] [Google Scholar]
- Simon JR, Carroll NJ, Rubinstein M, Chilkoti A, López GP. Programming molecular self-assembly of intrinsically disordered proteins containing sequences of low complexity. Nature Chemistry. 2017;9:509. doi: 10.1038/nchem.2715. [DOI] [PMC free article] [PubMed] [Google Scholar]
- Stockmayer WH. Theory of Molecular Size Distribution and Gel Formation in Branched-Chain Polymers. The Journal of Chemical Physics. 1943;11:45–55. [Google Scholar]
- Wei MT, Elbaum-Garfinkle S, Holehouse AS, Chen CCH, Feric M, Arnold CB, Priestley RD, Pappu RV, Brangwynne CP. Phase behaviour of disordered proteins underlying low density and high permeability of liquid organelles. Nature Chemisty advance online publication. 2017 doi: 10.1038/nchem.2803. [DOI] [PMC free article] [PubMed] [Google Scholar]
- Woodruff JB, Ferreira Gomes B, Widlund PO, Mahamid J, Honigmann A, Hyman AA. The Centrosome Is a Selective Condensate that Nucleates Microtubules by Concentrating Tubulin. Cell. 2017;169:1066–1077 e1010. doi: 10.1016/j.cell.2017.05.028. [DOI] [PubMed] [Google Scholar]
- Woodruff JB, Hyman AA, Boke E. Organization and Function of Non-dynamic Biomolecular Condensates. Trends in biochemical sciences. 2018;43:81–94. doi: 10.1016/j.tibs.2017.11.005. [DOI] [PubMed] [Google Scholar]
- Zhang H, Elbaum-Garfinkle S, Langdon EM, Taylor N, Occhipinti P, Bridges AA, Brangwynne CP, Gladfelter AS. RNA Controls PolyQ Protein Phase Transitions. Molecular cell. 2015;60:220–230. doi: 10.1016/j.molcel.2015.09.017. [DOI] [PMC free article] [PubMed] [Google Scholar]
Associated Data
This section collects any data citations, data availability statements, or supplementary materials included in this article.
Supplementary Materials
10
Figure S1. Determination of the saturation concentration with different methods. Related to Figure 1.
(A) Phase separation of FUS family proteins at the physiological salt concentration requires further addition of crowding agents except the FET proteins. Phase separation assays were conducted with proteins purified in small scale (see STAR Methods). 5 μM proteins tagged with MBP and GFP were first mixed with prescission protease to cleave off MBP tag and then submitted to the phase separation assays in the absence or presence of 10% dextran at 150 mM KCl. Bar, 5 μm.
(B) An overall schematic of the various methods used.
(C) Results of six different approaches for identifying_c_sat. All six methods give almost identical values. These methods are: [top left] Measuring the amount of condensed protein (condensed protein only appears above_c_sat); [top right] Intensity ratio inside of droplet versus inside + outside of droplet; [middle left] Absorbance at 340 nm (condensed protein has a significantly different absorbance profile, leading to a pronounced uptick in A340 absorbance); [middle right] Absorbance at 405 nm (same as A340); [bottom left] Concentration in supernatant after spin-down (_c_out) as measured by NanoDrop. Above _c_sat the supernatant concentration should be fixed (excess protein will partition into condensates). [bottom right] Average fluorescence intensity for supernatant after spin. Above _c_sat the average fluorescence intensity should be fixed (excess protein will partition into condensates).
(D) An overall schematic of the _c_outmeasurement in the non-phase separation condition and the phase separation condition.
(E) Measured _c_out in the non-phase separation condition and the phase separation condition.
(F) Correlation of the _c_sat values determined by images or by measuring _c_out with NanoDrop. The Pearson correlation coefficient is determined to be 0.99.
(G) SDS-PAGE for the untagged hnRNPA3 and FUS.
(H) Phase separation of the SNAP-tagged and untagged FUS described by relative amount condensed protein versus FUS concentration. The phase separation assays were done at 150 mM KCl. All data are expressed as the mean ± the standard deviation (SD).
(I) Phase separation of the GFP-tagged and untagged hnRNPA1 quantified by relative amount condensed protein versus hnRNPA3 concentration. The phase separation assays were done at 150 mM KCl. All data are expressed as the mean ± the standard deviation (SD).
Figure S2. Low saturation concentrations of FUS and EWSR1 are determined by both the tyrosine-rich PLD and arginine-rich RBD. Related toFigure 2.
(A) SDS-PAGE for the fragments, mutants and fusion proteins of FUS and EWSR1.
(B) Colocalization of the PLD and RBD from FUS (top) and from EWSR1 (bottom). Droplets were formed at 75 mM KCl. The PLDs and RBDs were labeled with SNAP-Surface Alexa Fluor 488 and 546 dyes, respectively. Bar, 5 μm.
(C) The saturation concentration of FUS PLD is over 120 μM. The assays were conducted at 75 mM KCl in the absence of crowding agents. The saturation concentration of FUS is around 2 μM (Figure 2B). Bar, 5 μm.
(D) Phase separation of FUS full length (FL) or PLD in the presence of dextran. The assays were conducted at 150 mM KCl. Bar, 15 μm.
(E) The RBD of EWSR1 significantly promotes phase separation of the PLD. The assays were conducted at 75 mM KCl with 15 μM proteins in the absence of crowding agent. The PLD and RBD were mixed at a ratio of 1:1. Bar, 5 μm.
(F) Tyrosine residues in PLDs and arginine residues in RBDs contribute to co-phase separation. Phase separation assays were performed at 75 mM KCl. All data are expressed as the mean ± the standard deviation (SD).
(G-I) Representative images for the quantification in Figures 2B, 2D, 2E and S2E. Phase separation assays were conducted at 75 mM KCl. Bar, 5 μm.
Figure S3. Separation of tyrosine and arginine is not required for determining the saturation concentration. Related to Figure 2.
(A) Tyrosine and arginine residues are in an embedded pattern in the disordered regions of TAF15 RBD. The positions of tyrosine and arginine residues in the disordered regions of TAF15 are indicated with green and red lines, respectively.
(B) SDS-PAGE for the fragments and mutants of TAF15.
(C) Colocalization of PLD and RBD from TAF15. Droplets were formed at 100 mM KCl. The PLD and RBD were labeled with SNAP-Surface Alexa Fluor 488 and 546 dyes, respectively. Bar, 5 μm.
(D and E) TAF15 RBD with tyrosine and arginine embedded into each other has a low saturation concentration similar to that of the full-length protein. Phase separation assays were conducted at 100 mM KCl. (D), phase separation of TAF15 fragments at the indicated protein concentrations. Bar, 5 μm; (E), phase separation described by the relative amount of condensed protein versus the protein concentration. The saturation concentration is indicated by a red arrow. All data are expressed as the mean ± the standard deviation (SD).
(F and G) Decreasing the number of tyrosine or GGY[G/S]GDR repeats increases the saturation concentration. The positions of 19 GGY[G/S]DR repeats are indicated by the white triangles. The yellow triangle represents that the tyrosine residues inside the repeat are mutated to serine residues. Phase separation assays were conducted at 100 mM KCl. (F), phase separation of TAF15 RBD mutants and fragments at the indicated protein concentrations. Bar, 5 μm; (G), phase separation described by the relative amount of condensed protein versus the protein concentration. All data are expressed as the mean ± the standard deviation (SD).
Figure S4. Manipulating protein phase behavior in vitro and in vivo. Related to Figure 3.
(A) SDS-PAGE for FUS(27R), hnRNPA1 (PLD 6R) and hnRNPA1a (PLD 10R, F→Y).
(B) Representative images for the quantification in Figure 6B. Phase separation assays were conducted at 150 mM KCl. Bar, 5 μm.
(C) Representative images for the quantification in Figure 3D. The inset shows a zoomed-in area. Bar, 5 μm.
(D) In the absence of stress, preformed WT (∆NLS) granules were dynamic while 27R (∆NLS) granules were not. The dynamic of the preformed granules was measured by FRAP.
(D) Partitioning of WT (∆NLS) and 27R (∆NLS) into stress granules upon arsenate treatment. Bar, 5 μm.
(F) Inside stress granules, WT (∆NLS) is dynamic while 27R (∆NLS) is not. FRAP data was collected. All data are expressed as the mean ± the standard deviation.
(G) 27R (∆NLS) is enriched more in stress granules than WT (∆NLS) after arsenate treatment. Bar, 5 m. All data are expressed as the mean ± the standard deviation (SD).
Figure S5. Tuning protein phase behavior by distinct composition of electrostatic amino acids. Related to Figure 5.
(A) SDS-PAGE for FUS PLD and TAF15 PLD mutants.
(B) Representative images for the quantification in Figure 4B. Phase separation assays were conducted at 75 mM KCl in the absence of crowding agents. Bar, 5 μm. (C and D) Addition of negative charges promotes co-phase separation of FUS PLD and FUS RBD. WT FUS PLD has a low content of negative charges (4 aspartic acids/glutamate acids). Indicated amount of FUS PLD variant was titrated into 30 μM FUS RBD in the absence of crowding agents at 75 mM KCl. All data are expressed as the mean ± the standard deviation (SD). Bar, 5 μm.
(E) Substitution of aspartate and glutamate residues with glycine restores tyrosine-tyrosine interactions and leads to phase separation of TAF15 PLD in the presence of crowding agents. Phase separation assays were conducted in the absence or presence of 10% dextran at 150 mM KCl. Top, TAF15 PLD did not undergo phase separation even in the presence of 10% dextran; middle, replacement of aspartate and glutamate residues with glycine residues enables phase separation of TAF15 PLD in the presence of dextran; bottom, phase behavior of a TAF15 PLD variant with tyrosine residues mutated to serine residues. The positions of tyrosine and aspartate residues are indicated by green and yellow lines. Bar, 5 μm.
(F – G) Reduction of negative charges decreases co-phase separation of TAF15 PLD and FUS RBD. The wild-type TAF15 PLD has a high content of negative charges (20 aspartic acids/glutamate acids). Indicated amount of TAF15 PLD variant was titrated into 30 μM FUS RBD in the absence of crowding agents at 75 mM KCl. All data are expressed as the mean ± the standard deviation (SD). Bar, 5 μm.
Figure S6. Amino acid composition of the intrinsically disordered regions of FUS family proteins. Related to Figure 6.
(A) Amino acid composition of the intrinsically disordered regions of FUS family proteins (top) and FUS PLD (bottom). It is worth noting that FUS PLD has a strikingly limited set of amino acid alphabet, and only 4 types of residues, namely, glycine, glutamine, serine, and tyrosine residues, together account for ~ 82% residues in FUS PLD.
(B) Pearson correlation analysis for glycine content versus other residue contents of other amino acids in the PLDs intrinsically disordered regions of FUS family proteins.
(C) SDS-PAGE for FUS G→A, S→A and Q→G mutant.
(D) Representative images for the quantification in Figure 5B. Phase separation assays were conducted at 75 mM KCl. Bar, 5 μm.
Figure S7. Amino acid composition of the prion-like candidates with the predicted saturation concentration. Related to Figure 7.
(A) Amino acid composition of the prion-like candidates. The proteins are listed in an order based on the values of the saturation concentration (from low to high, Table S5). The absolute occurrence represents the absolute number of the indicated residues, whereas the normalized occurrence reflects the number of the indicated residues normalized by the sequence length (see method details). We used the absolute occurrence rather than the normalized occurrence for tyrosine or arginine residues since the saturation concentration is largely determined by the absolute numbers of tyrosine and arginine residues. The names of the proteins tested to be capable of phase separation in this study are colored in blue.
(B) Domain structures of the top 10 prion-like candidates predicted to have the lowest saturation concentration. The ranking number is shown behind the protein name. The domain structures of the FET proteins are not shown. SAP, domain shared by SAF-A/B, Acinus and PIAS; B30.2/SPRY: B30.2, domain encoded by exon B30-2; SPRY, domain named after SPla and Ryanodine receptor; RNase III, ribonuclease III; DRBM, dsRNA-binding motif; DZF, domain associated with zinc fingers; PINc, PilT N terminus, or PINc domain (SMART database); BAG, domain presented in Bcl-2-associated athanogene.
Table S5. List of prion-like proteins with the predicted saturation concentration of phase separation. Related to Figure 7.
Table S6. Sequences for the proteins used in this study. Related toFigure 1.
11
Movie S1. Fusion of droplets formed by FUS WT and GA mutant overtime. Related to Figure 6.
12
13
14
15
16
17
4
5
6
7
8
9