The infiltration kinetics of simian immunodeficiency virus-specific T cells drawn to sites of high antigenic stimulation determines local in vivo viral escape (original) (raw)
Abstract
Despite vigorous cell-mediated immune responses to human and simian immunodeficiency viruses (HIV/SIV) the immune system is unable to clear latently infected resting T cells. These infected cells are reactivated by antigenic stimulation, leading to viral replication. By using the SIV/macaque model of HIV pathogenesis, the dynamics of T cell infiltration into delayed type hypersensitivity sites specific for the purified protein derivative of bacillus Calmette–Guérin have been studied. Early viral mRNA synthesis coincided with the infiltration of antigen-specific T cells. When the infiltration of anti-SIV-specific T cells was rapid compared with the kinetics of viral assembly, the sites were sterilized before the transition to late viral mRNA synthesis occurred. When their infiltration was slow, ephemeral foci of replication were identified. These findings were paralleled by plasma viremia; low viremia coincided with rapid sterilization of the delayed type hypersensitivity sites, whereas high load was found in association with local replication and delayed sterilization. These data suggest that although effective local control of SIV is possible once antiviral T lymphocytes have arrived on site, the slower deployment of these T cells may allow the virus to escape and thus to reseed the pool of memory T cells.
Human and simian immunodeficiency virus (HIV/SIV) replication is particularly apparent in the immunocompetent structures of secondary lymphoid organs such as spleen, lymph nodes, or Peyer's patches, where antigenic stimulation is intense. These structures are extensively infiltrated by CD8+ T cells (1), which strongly control viremia at a local level (ref. 2; unpublished data). Thus, depletion of macaque CD8 cells by treatment with monoclonal antibodies in vivo resulted in massive SIV expansion as evidenced by a 10- to 100-fold increase in plasma viremia (3). Yet, despite strong CD8 T cell responses, viremia and the proportion of infected cells increase remorselessly over time, indicating that the virus is able to overcome antiviral immunity. Many explanations accounting for the progression to AIDS have been proffered, including the high-level replication in sanctuaries (4) or mutation within epitopes (5–7).
The persistence of the virus can be partly attributed to the presence of latently infected CD4 T cells, in which the provirus, being transcriptionally silent, is invisible to specific immunity (8). However, these cells can be recruited to sites of immune responses and activated, thus resulting in proviral transcription (9, 10) and leading to strong founder effects (11). In this way, HIV or SIV enters into the center of an immunological reaction, in a manner described as a “Trojan horse” mechanism (12, 13). After activation of latently infected, antigen-specific T cells, there is a window of ≈10 h between the onset of early protein synthesis and the shedding of virus (14). Some of these proteins are catabolized to peptides and presented in the context of cell surface MHC class I molecules. These complexes are recognized by anti-SIV CD8 T cells, resulting in destruction of the infected target cells.
Although infected cells may be destroyed before producing virus, the killing efficiency of this process depends on the relative dynamics of virus assembly and the infiltration of anti-SIV cytotoxic T lymphocytes (CTLs) in the sites of antigen-induced immune responses. Here the relative kinetics of antigen-specific CD4 T cell infiltration, activation of SIV replication, and its restriction by infiltrating CTLs are explored in delayed type hypersensitivity (DTH) reactions to serial intradermal injection of purified protein derivative (PPD) of bacillus Calmette–Guérin (BCG) as a model for local immune activation.
Materials and Methods
Experimental Protocol.
Two rhesus macaques (Macaca mulatta), 94057 and 94005, were inoculated i.v. with BCG (107 plaque-forming units) at weeks 0, 6, and 13. At week 30, both were infected by i.v. injection of 10 animal ID50 units of SIVmac251 strain, followed at week 37 by an i.v. injection of the previous dose of BCG. Before euthanasia, at week 46 (macaque 94057) and 136 (macaque 94005), DTH reactions were generated by intradermal injection of 3,000 units of PPD in 0.1 ml in the skin on the back of the animals. PPD injections were performed in duplicate at 18, 25, 36, and 60 h and in triplicate at 12, 18, 25, 36, and 60 h before sacrifice of monkeys 94057 and 94005, respectively. Skin patches from the DTH sites, and one normal skin patch from the abdomen, were removed, and dermal zones were dissected under a stereomicroscope.
PCR and Reverse Transcription (RT)-PCR on Skin Patches.
Total DNA or RNA extraction was performed on 50% and 25% of each dissected derma, respectively, by using Masterpure extraction kit (Epicentre Technologies, Madison, WI). DNA was used to amplify CD3γ, SIV (2), and T cell antigen receptor (TCR) loci. RNA extraction included two DNase steps. The absence of DNA contamination was confirmed by CD3γ chain PCR as described (2). cDNAs were generated and then amplified by nested RT-PCR as described (9). Primers were as follows:
SIV-out3′, 5′-TAAGCAAAGCATAACCTGGAGGTG;
SIV-out5′, 5′-GAGGACGTATGGCAACTCTTTGAG;
SIV-in3′, 5′-CAAGATTCTTGGATAACAGAAGTG;
SIV-in5′, 5′-TTGAGACCTCAATAAAGCCTTGTG;
mRNA leader-out5′, 5′-CGGAGAGGCTGGCAGATTG;
mRNA leader-out3′, 5′-CCTTACTGCCTTCACTCAG;
mRNA leader-in5′, 5′-GTTCTCTCCAGCACTAGCAG;
mRNA leader-in3′, 5′-TTCGGGCGCCAATCTGCTA;
CD3γRNA-out3′, 5′-GAGAAAGCCAGATATGGTGG;
CD3γRNA-out5′, 5′-GACATGGAACAGGGGAAGGG,
CD3γRNA-in3′, 5′-ACTTCTGTAATACACTTGGAGTGG;
CD3γRNA-in5′, 5′-CTTCTTCAAGGTACTTTGG;
Perforin-out5′, 5′-GCAATGTGCATGTGTCTGTG;
Perforin-out3′, 5′-GAAGTGGGTGCCGTAGTTGG;
Perforin-in3′, 5′-GATAAGCCTGAGGTAGGCG;
Perforin-in5′, 5′-CTCACACTCACAGGCAG;
Granzyme-out3′, 5′-TACACACAAGAGGGCCTCCAGAGT;
Granzyme-out5′, 5′-GGGAAGCTTCCATAAATGTCACCT;
Granzyme-in 3′, 5′-CACAACTCAATGGTACTGTCG;
Granzyme-in5′, 5′-GGCCCACAATATCAAAGAACAGG.
PPD-Specific and Anti-SIV Stimulation Ex Vivo.
Peripheral blood mononuclear cells (PBMCs) were obtained after isolation on a Ficoll/Paque gradient. For PPD stimulation, PBMCs were activated with 1.5 μg/ml PPD and cultivated for 15 days with IL-2 (20 units/ml). For SIV stimulation, 15 × 106 PBMCs were cocultivated in RPMI medium 1640/10% FCS/20 units of IL-2 per ml for 15 days with 3 × 10⁶ irradiated (5,000 rads) phytohemagglutinin-P (2 μg/ml)-activated autologous PBMCs sampled at week 32. For both cultures, aliquots of 106 cells were lysed in Nonidet P-40 (0.05%)/Tween 20 (0.05%), treated by proteinase K (100 μg/ml), and submitted to TCR β repertoire analysis.
T Cell Repertoire Analysis.
Amplification of TCR β sequences was performed on 1 μg DNA aliquots as described (9). DNA was used for specific amplification with SJβ1.3–30, SJβ1.6–30, SJβ2.3–30, and SJβ2.7–100 primers in combination with primers for the 10 major TCRBV segments. Approximately 80% of the repertoire was covered (15). PCRs were performed for 35 cycles (95°C for 30 s, 55°C for 30 s, 72°C for 5 min) by using hot-start PCR conditions. A fragment of the CD3γ chain gene was PCR amplified as an amplification control; all the samples were positive. Linear amplification (run-off) was performed with each of the 13 TCRBJ-specific primers labeled with the Fam fluorophore. PCR products were separated on 6% acrylamide denaturing gel on an ABI373 DNA Sequencer. Data were collected and analyzed by using the GENESCAN data collection and analysis software (Applied Biosystems). In this type of analysis, each T cell clone is defined as a peak at a specific molecular weight related to the length of the TCR β CDR3 region. In general, a discrete peak represents a single T cell clone as confirmed by sequencing (ref. 11; data not shown). The clonality (>80% of clones showing the same CDR3 region) of the peaks presented in this study was confirmed in two different skin patches by molecular cloning and sequencing.
In Situ Hybridization.
In situ hybridization (ISH) was performed with a 35S-labeled SIVmac142 env-nef RNA probe as described (16). Slides were treated so as to detect productively infected cells. At least 20 mm2 was examined per dermal sample.
Results
Inoculation Protocol.
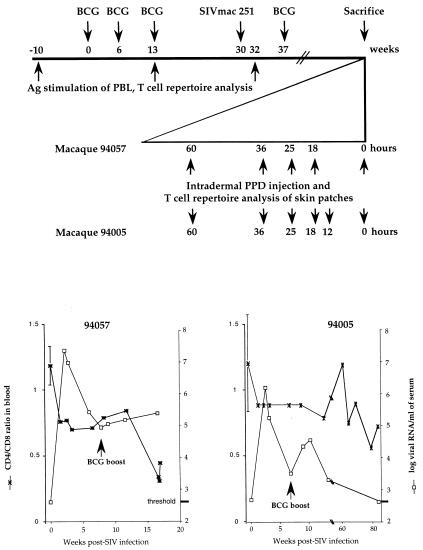
After BCG vaccination two macaques (94057 and 94005) were infected with SIVmac251 (Fig. 1 Upper). After peak viremia and seroconversion, both animals received a further boost of BCG to channel SIV into BCG-specific CD4 T cells. In terms of viral load, macaque 94005 had undetectable viremia at the time of sacrifice (Fig. 1 Lower Right). By contrast, macaque 94057 showed high-peak viremia, an order of magnitude greater than for 94005, with a set point >105 SIV RNA copies per ml. The CD4/CD8 ratio remained stable for macaque 94005, whereas it declined rapidly for macaque 94057. The increase in plasma viremia after BCG inoculation at 7 weeks after SIV infection shows that a proportion of BCG-specific T cells harbored SIV.
Figure 1.
Experimental procedure. (Upper) BCG, PPD, and SIV inoculation schedule. Time is expressed in weeks, with the first BCG inoculation serving as reference (week 0). On an expanded scale, for the series of intradermal PPD injections, time is given in hours before sacrifice. (Lower) Plasma viral loads (right ordinates) and CD4/CD8 ratios (left ordinates) for the two macaques. Baseline levels were calculated as the mean of five samples drawn during the 5 weeks before BCG vaccination.
Starting 3 days before sacrifice, the macaques were subjected to a series of intradermal PPD injections to induce DTH reactions (Fig. 1 Upper). Injections were performed in duplicate or triplicate (macaques 94057 and 94005, respectively). At necropsy, skin patches corresponding to the different DTH sites and normal patches (referred to as 0 hours, Fig. 1 Upper) were sampled. In this way, it was possible to analyze, in reverse order, the kinetics of DTH formation—a skin patch sampled after 18 h was “younger” than one initiated at 60 h. Maximal thickness or induration was observed 2 days after inoculation, at the same time as massive lymphocyte and macrophage infiltration (data not shown). The kinetic data of the DTH reaction were similar to those triggered by PPD antigen in BCG-vaccinated humans (17).
Kinetics of SIV Replication in DTH Sites.
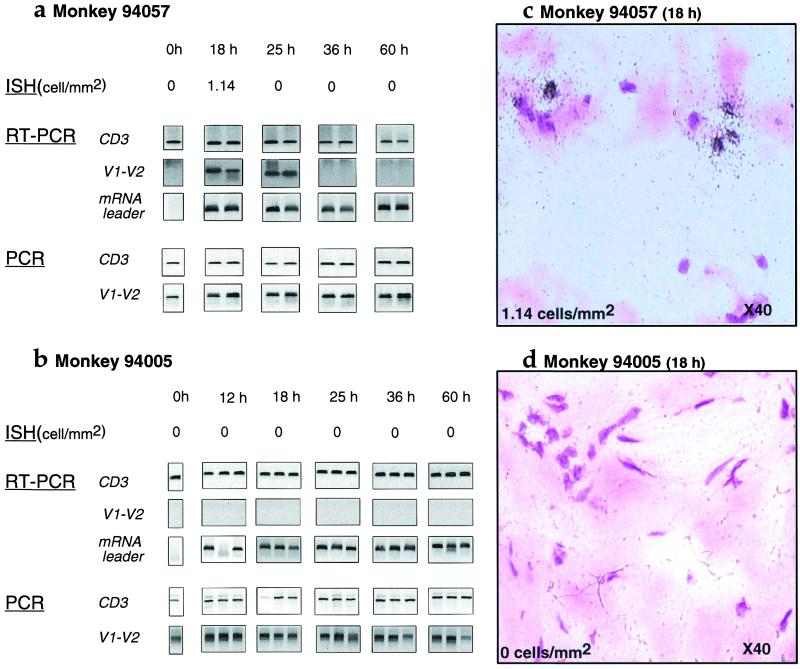
Because DTH reactions are mediated inter alia by activated memory CD4 T cells, this reaction should provide a milieu conducive to SIV replication (9, 10). The DTH reaction was studied by RT-PCR and ISH of 5-μm dermal sections (Fig. 2). For macaque 94057, productive viral infection, as evidenced by grains over cells, was evident at 18 h but restricted by 25 h and thereafter (Fig. 2a). In terms of RT-PCR, late mRNA SIV transcripts (env V1-V2) were detected at 18 and 25 h, but not subsequently, despite the high sensitivity of the technique (nested env V1-V2 sensitivity, one infected cell per reaction). The presence of SIV-producing cells was confirmed by ISH. By contrast, SIV leader mRNA sequences were detected throughout the series of DTH reactions. Late mRNA sequences were absent from samples collected more than 25 h after PPD injection, which indicated that detection of leader mRNA was synonymous with early mRNA transcripts. Even though viral replication was restricted at later time points, cells harboring viral DNA [nested _env V1-V2_ sensitivity, one to two copies per reaction (18)] were present throughout (Fig. 2a). Hence, detection of leader sequences probably reflects de novo proviral transcription because 1–2 h after integration is sufficient to detect early viral transcripts (19, 20). For the low-viremia animal, 94005, there was no evidence of viral production between 12 and 60 h after PPD inoculation, either by ISH or by late mRNA synthesis (Fig. 3b). Just as for the high-viremia macaque, SIV leader mRNA sequences could be detected throughout, as could proviral and CD3γ DNA controls.
Figure 2.
Viral replication in skin patches in monkeys 94057 (a and c) and 94005 (b and d). Viral detection was performed either by ISH on 5 μm sections with an _env-nef_-specific probe (all sections stained with hematoxylin/eosin; objective ×40), by PCR using the env V1-V2 region, or by RT-PCR for the env V1-V2 or mRNA leader (U5) region. A region of the CD3γ gene served as a control for both PCR and RT-PCR.
Figure 3.
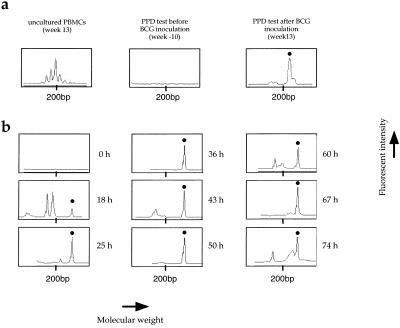
Collection of BV14BJ1S6 T cell clones after ex vivo (a) and in vivo (b) PPD stimulation. The histograms are for macaque 94057 and were generated by GENESCAN analysis of CDR3 lengths by using BV14 and BJ1S6 primers. (a) Ex vivo studies were performed on 15-day PBMC cultures stimulated by PPD antigen. Uncultured PBMCs at week 13 are shown on the left. (b) Histograms obtained for skin patches. The y axis represents fluorescence intensity in arbitrary units, whereas the x axis represents the molecular weight (length in base pairs) of the PCR products. Dots above peaks show the PPD-specific TCRBV14BJ1S6 clone characterized by a molecular weight corresponding to 217 bp. It was present in peripheral blood only after BCG inoculation. It was not found in the control skin patch but was present in all DTH sites.
SIV transcription was undetectable in control dermal samples, demonstrating that the DTH reaction results in the activation of resident-infected T cells and/or infiltration of SIV-infected cells leading to viral transcription (9, 10). Although the production of virus by 18 h after PPD injection in macaque 94057 is consistent with the kinetics of virion assembly (14), the extinction of late viral mRNA by 36 h is surprising because the recruitment of activated CD4 T cells into DTH reaction is maximal after 60 h, as shown by immunohistochemistry (ref. 17; data not shown). Furthermore, data for macaque 94005 are indicative of abortive activation of viral replication despite occurring in DTH sites.
Kinetics of PPD- and SIV-Specific T Cell Infiltration in DTH Sites.
Such ephemeral viral replication suggests that it may be curtailed by the infiltration of anti-SIV T cells. Previous work has shown that BCG- and SIV-specific T cell clones, as defined by the CDR3 region of their rearranged TCR β chains, can be identified in PPD-specific DTH sites (9).
The PPD-specific TCR repertoires were first analyzed on PBMCs stimulated ex vivo. As defined by peaks in a GENESCAN analysis, four (macaque 94057) and six (macaque 94005) T cell clones were identified in the PPD-stimulated PBMC cultures at week 13 (after BCG inoculation), but not at week −10 and in uncultured week 13 PBMCs, indicating that they were PPD-specific T cells (a typical example is shown in Fig. 3a). Likewise, anti-SIV T cells were expanded ex vivo. Duplicate cultures of PBMCs sampled before (week 13) or after (week 32) SIV infection were performed by using SIV-infected autologous phytohemagglutinin-activated lymphoblasts as stimuli (sampled at week 32). This protocol has led to preferential expansion of SIV-specific CD8+ CTLs (21). As defined by peaks in a GENESCAN analysis, 8 (94057) and 10 (94005) T cell clones were identified in cultures from week 32 PBMCs. Their absence in the pre-SIV infection blood samples and cultures shows that they represent anti-SIV CD8 T cells. Together these PPD-specific and anti-SIV T cell clones constitute reference sets allowing the kinetics of T cell infiltration into the DTH sites to be determined.
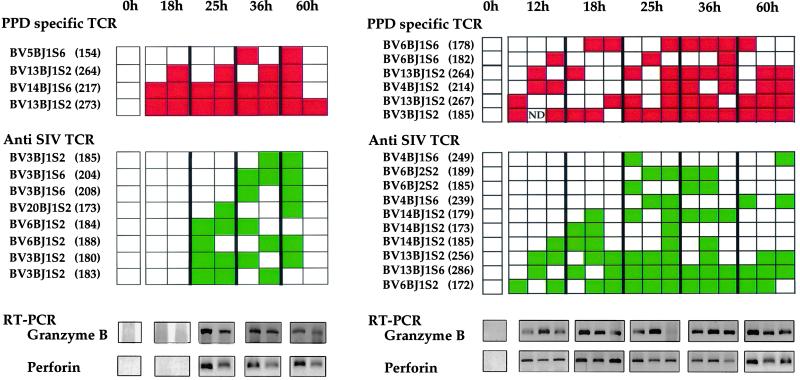
The dynamics of T cell infiltration was assessed by using TCR repertoire analysis on DNA extracted from dermal samples, an example of a PPD-specific T cell clone in DTH sites being shown in Fig. 3b. By 18 h, PPD-specific clones were detected correlating with an obvious induration of the skin. A checkerboard representation of all PPD- and SIV-specific clones is given in Fig. 4. For both animals the number of PPD-specific clones detected in the skin patches generally increased with the development of the DTH reaction. Their absence in the control dermal samples, together with the presence of some unrelated T cell clones, indicates that the profusion of PPD-specific cells in the DTH sites was linked to in situ infiltration and/or proliferation. The collection of rearranged TCR β genes was unique for each DTH site, which indicates that there was little infiltration of T cells between skin patches.
Figure 4.
Checkerboard representation of PPD-specific and anti-SIV T cell clones over time in skin patches of macaque 94057 (a) or 94005 (b). Each skin patch is represented as a column of rectangles. For each time point, DTH reactions were performed in duplicate (macaque 94057) or triplicate (macaque 94005). Green and red rectangles represent anti-SIV and anti-PPD clones, respectively; an empty rectangle indicates lack of detection. The TCRBV-J usage of the clones and the characteristic length of the corresponding PCR products are shown on the left (number of base pairs in parentheses). Shown below each checkerboard are the detected granzyme B and perforin RT-PCRs, CD3γ serving as amplification control (see Fig. 2). ND, not determined.
By contrast, the infiltration kinetics of SIV-specific T cell clones differed between animals. For the high-viremia macaque 94057, they were first detected by 25 h (Fig. 4a) and remained thereafter. Their infiltration coincided with the decline of SIV replication, as shown in Fig. 2. For the low-viremia macaque 94005, 4 of 10 SIV-specific clones were present by 12 h (Fig. 4b), their frequency increasing to 10 of 10 by 25 h. As noted above, there was no evidence of productively infected cells in the DTH sites, as determined by in situ hybridization or RT-PCR of late mRNA, in this animal. Because CTLs typically express granzyme B and perforin molecules associated with the cytolytic granules, RT-PCR specific for granzyme B and perforin mRNA was also performed on RNA extracted from dermal samples. By the time SIV-specific T cells had infiltrated the DTH sites, the samples were positive for both granzyme B and perforin (Fig. 4), consistent with the presence of functional anti-SIV CTLs.
Discussion
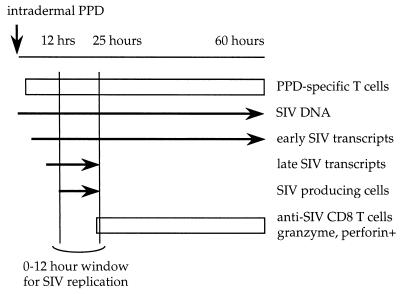
The series of DTH reactions, elicited in BCG-vaccinated, SIV-infected macaques, characterize a sequence of events initiated by the recruitment of PPD-specific CD4 T cells supporting the induction of SIV transcription (9, 10). After the expression of SIV antigens, a second wave of T cell infiltration occurs, this time SIV-specific CTLs. In these circumstances successful viral replication depends on the interval between the onset of proviral transcription and the infiltration of anti-SIV CD8 T cells. If there is a delay of the order of 10–20 h between the two, then there is a narrow window during which SIV production is possible. This window of opportunity should allow viral particles to reseed the pool of memory CD4+ T cells. If, by contrast, infiltration is rapid, perhaps because of higher CTL precursor frequencies, then productive infection is abolished. These findings agree with the observation of an inverse correlation between peripheral CTL frequencies and plasma HIV load (22); the high plasma SIV was inversely related to retarded rates of CTL infiltration into DTH sites. Although two animals were studied, it is expected that the extent of replication and the speed of infiltration of anti-SIV T cells will form spectra, notably the extent of SIV replication and the breadth of the window. Regardless of the relative kinetics, once the wave of SIV-specific CD8 T cells was complete, the DTH sites were sterilized of productively infected cells. In this case, the presence of early transcripts could be indicative of in situ activation of newly recruited, PPD-specific T cells with subsequent proviral transcription. These features are summarized schematically in Fig. 5.
Figure 5.
Schema of the kinetics of T cell infiltration and detection of SIV nucleic acids in DTH sites. The short window of about 10 h between the onset of proviral transcription and the recruitment of anti-SIV T cells allows ephemeral replication of the virus. Obviously, if infiltration of anti-SIV T cells is very rapid, the length of the window would be reduced and may even collapse, as exemplified by macaque 94005.
The sterilization of the DTH sites is indicative of efficient control of viral replication. These microscopic phenomena correlate well with the overall viremia. For macaque 94057, for which there was ephemeral local replication, the plasma viral load was 2.4 × 10⁵/ml at sacrifice, whereas for the second animal, 94005, virus was undetectable in the serum. Yet even in this latter case, where SIV-specific T cell infiltration was rapid, the persistence of infection means that SIV was replicating in the host, perhaps in some other anatomical sites. These findings are consistent with the observation that even within splenic germinal centers there was little productive infection (18).
SIV infection is seen as an endless series of rounds of replication with relatively few productively infected cells at any moment. Elimination of nonproductively infected cells, albeit mainly short-lived effector lymphocytes, may contribute to pathology and loss of antigen-specific T cells over the long run. When averaged over numerous discrete sites, it is apparent that a window of only a few hours allows SIV to escape dynamically from immune responses capable of blocking productive viral infection. In this sense, the virus does not need genetic variation to escape from immune responses (5–7). These findings highlight the magnitude of the problem of eliminating a virus that spreads by stealth as a Trojan horse inside antigen-specific T cells drawn to inflammatory sites.
The wave of infiltrating SIV-specific T cells and other inflammatory responses does not block proviral transcription, suggesting that the restriction is either by cytolysis or by action on some early event in the virus life cycle, thus prohibiting expression of late mRNA transcripts. The early HIV-1 Tat, Rev, and Nef proteins are frequently targets for CTLs (23), immunization with Tat and Rev proteins inducing the attenuation of virus replication and disease (24–26). It is thus distinctly possible that SIV replication in the DTH sites is restricted by CTLs. In this event, the role of the early SIV Nef protein, which partly down-regulates antigen-presenting MHC class I molecules at the cell surface (27), in terms of its ability to help the virus evade cell-mediated immunity, needs to be addressed. Given that SIV replication may be rapidly restricted, it would be interesting to find out whether stimulation of cell-mediated immunity to all early proteins (i.e., Tat, Rev, and Nef) would result in better control of SIV.
Acknowledgments
We thank Anne-Marie Aubertin for providing SIVmac251 stock, Maryse Hurtrel for anatomopathological studies, Delphine Bosh and Valérie Monceau for their help in handling monkeys, and Peter Hale for comments on the manuscript. This work was supported by grants from the Institut Pasteur and the Agence Nationale de Recherche sur le SIDA.
Abbreviations
SIV
simian immunodeficiency virus
CTL
cytotoxic T lymphocyte
DTH
delayed type hypersensitivity
BCG
bacillus Calmette–Guérin
PPD
purified protein derivative
PBMC
peripheral blood mononuclear cell
ISH
in situ hybridization
RT-PCR
reverse transcription–PCR
TCR
T cell antigen receptor
Footnotes
This paper was submitted directly (Track II) to the PNAS office.
References
- 1.Castan J, Tenner-Racz K, Racz P, Fleischer B, Broker B. Immunology. 1997;90:265–271. doi: 10.1046/j.1365-2567.1997.00162.x. [DOI] [PMC free article] [PubMed] [Google Scholar]
- 2.Hosmalin A, Samri A, Dumaurier M-J, Dudoit Y, Oksenhendler E, Karmochkine M, Autran B, Wain-Hobson S, Cheynier R. Blood. 2001;97:2695–2701. doi: 10.1182/blood.v97.9.2695. [DOI] [PubMed] [Google Scholar]
- 3.Schmitz J E, Kuroda M J, Santra S, Sasseville V G, Simon M A, Lifton M A, Racz P, Tenner-Racz K, Dalesandro M, Scallon B J, et al. Science. 1999;283:857–860. doi: 10.1126/science.283.5403.857. [DOI] [PubMed] [Google Scholar]
- 4.Schrager L, D'Souza M. J Am Med Assoc. 1998;280:67–71. doi: 10.1001/jama.280.1.67. [DOI] [PubMed] [Google Scholar]
- 5.Allen T, O'Connor D, Jing P, Dzuris J, Mothe B, Vogel T, Dunphy E, Liebl M, Emerson C, Wilson N, et al. Nature (London) 2000;407:386–390. doi: 10.1038/35030124. [DOI] [PubMed] [Google Scholar]
- 6.Mortara L, Letourneur F, Villefroy P, Beyer C, Gras-Masse H, Guillet J G, Bourgault-Villada I. Virology. 2000;278:551–561. doi: 10.1006/viro.2000.0671. [DOI] [PubMed] [Google Scholar]
- 7.Price D, Goulder P, Klenerman P, Sewell A, Easterbrook P, Troop M, Bangham C, Phillips R. Proc Natl Acad Sci USA. 1997;94:1890–1895. doi: 10.1073/pnas.94.5.1890. [DOI] [PMC free article] [PubMed] [Google Scholar]
- 8.Chun T W, Fauci A S. Proc Natl Acad Sci USA. 1999;96:10958–10961. doi: 10.1073/pnas.96.20.10958. [DOI] [PMC free article] [PubMed] [Google Scholar]
- 9.Cheynier R, Gratton S, Halloran M, Stahmer I, Letvin N L, Wain-Hobson S. Nat Med. 1998;4:421–427. doi: 10.1038/nm0498-421. [DOI] [PubMed] [Google Scholar]
- 10.Ostrowski M A, Krakauer D C, Li Y, Justement S J, Learn G, Ehler L A, Stanley S K, Nowak M, Fauci A S. J Virol. 1998;72:7772–7784. doi: 10.1128/jvi.72.10.7772-7784.1998. [DOI] [PMC free article] [PubMed] [Google Scholar]
- 11.Cheynier R, Henrichwark S, Hadida F, Pelletier E, Oksenhendler E, Autran B, Wain-Hobson S. Cell. 1994;78:373–387. doi: 10.1016/0092-8674(94)90417-0. [DOI] [PubMed] [Google Scholar]
- 12.Peluso R, Haase A, Stowring L, Edwards M, Ventura P. Virology. 1985;147:231–236. doi: 10.1016/0042-6822(85)90246-6. [DOI] [PubMed] [Google Scholar]
- 13.Sonigo P, Alizon M, Staskus K, Klatzmann D, Cole S, Danos O, Retzel E, Tiollais P, Haase A, Wain-Hobson S. Cell. 1985;42:369–382. doi: 10.1016/s0092-8674(85)80132-x. [DOI] [PubMed] [Google Scholar]
- 14.Reddy B, Yin J. AIDS Res Hum Retroviruses. 1999;15:273–283. doi: 10.1089/088922299311457. [DOI] [PubMed] [Google Scholar]
- 15.Chen Z W, Kou Z-C, Shen L, Reimann K A, Letvin N L. J Immunol. 1993;151:2177–2187. [PubMed] [Google Scholar]
- 16.Chakrabarti L, Cumont M C, Montagnier L, Hurtrel B. J Med Primatol. 1994;23:117–124. doi: 10.1111/j.1600-0684.1994.tb00111.x. [DOI] [PubMed] [Google Scholar]
- 17.Tsicopoulos A, Hamid Q, Haczku A, Jacobson M R, Durham S R, North J, Barkans J, Corrigan J, Meng Q, Moqbel R, Kay A B. J Allergy Clin Immunol. 1994;94:764–772. doi: 10.1016/0091-6749(94)90185-6. [DOI] [PubMed] [Google Scholar]
- 18.Gratton S, Cheynier R, Dumaurier M J, Oksenhandler E, Wain-Hobson S. Proc Natl Acad Sci USA. 2000;97:14566–14571. doi: 10.1073/pnas.97.26.14566. [DOI] [PMC free article] [PubMed] [Google Scholar]
- 19.Kim S, Byrn R, Groopman J, Baltimore D. J Virol. 1989;63:3708–3713. doi: 10.1128/jvi.63.9.3708-3713.1989. [DOI] [PMC free article] [PubMed] [Google Scholar]
- 20.Hewlett I, Geyer S, Hawthorne C, Ruta M, Epstein J. Oncogene. 1991;6:491–493. [PubMed] [Google Scholar]
- 21.Nixon D F, Townsend A R, Elvin J G, Rizza C R, Gallwey J, McMichael A J. Nature (London) 1988;336:484–487. doi: 10.1038/336484a0. [DOI] [PubMed] [Google Scholar]
- 22.Ogg G S, Jin X, Bonhoeffer S, Dunbar P R, Nowak M A, Monard S, Segal J P, Cao Y, Rowland-Jones S L, Cerundolo V, et al. Science. 1998;279:2103–2106. doi: 10.1126/science.279.5359.2103. [DOI] [PubMed] [Google Scholar]
- 23.Addo M, Altfeld M, Rosenberg E, Eldridge R, Philips M, Habeeb K, Khatri A, Brander C, Robbins G, Mazzara G, et al. Proc Natl Acad Sci USA. 2001;98:1781–1786. doi: 10.1073/pnas.98.4.1781. [DOI] [PMC free article] [PubMed] [Google Scholar]
- 24.Osterhaus A, van Baalen C, Gruters R, Schutten M, Siebelink C, Hulskotte E, Tijhaar E, Randall R, van Amerongen G, Fleuchaus A, et al. Vaccine. 1999;17:2713–2714. doi: 10.1016/s0264-410x(98)00498-8. [DOI] [PubMed] [Google Scholar]
- 25.Cafaro A, Caputo A, Fracasso C, Maggiorella M, Goletti D, Baroncelli S, Pace M, Sernicola L, Koanga-Mogtomo M, Betti M, et al. Nat Med. 1999;5:643–650. doi: 10.1038/9488. [DOI] [PubMed] [Google Scholar]
- 26.Pauza C D, Trivedi P, Wallace M, Ruckwardt T J, Le Buanec H, Lu W, Bizzini B, Burny A, Zagury D, Gallo R C. Proc Natl Acad Sci USA. 2000;97:3515–3519. doi: 10.1073/pnas.070049797. . (First Published March 21, 2000; 10.1073/pnas.070049797) [DOI] [PMC free article] [PubMed] [Google Scholar]
- 27.Schwartz O, Marechal V, Le Gall S, Lemonnier F, Heard J. Nat Med. 1996;2:338–342. doi: 10.1038/nm0396-338. [DOI] [PubMed] [Google Scholar]
