TGF-β receptor 1 regulates progenitors that promote browning of white fat (original) (raw)
Abstract
Objective
Beige/brite adipose tissue displays morphological characteristics and beneficial metabolic traits of brown adipose tissue. Previously, we showed that TGF-β signaling regulates the browning of white adipose tissue. Here, we inquired whether TGF-β signals regulated presumptive beige progenitors in white fat and investigated the TGF-β regulated mechanisms involved in beige adipogenesis.
Methods
We deleted TGF-β receptor 1 (TβRI) in adipose tissue (TβRIAdKO mice) and, using flow-cytometry based assays, identified and isolated presumptive beige progenitors located in the stromal vascular cells of white fat. These cells were molecularly characterized to examine beige/brown marker expression and to investigate TGF-β dependent mechanisms. Further, the cells were transplanted into athymic nude mice to examine their adipogenesis potential.
Results
Deletion of TβRI promotes beige adipogenesis while reducing the detrimental effects of high fat diet feeding. Interaction of TGF-β signaling with the prostaglandin pathway regulated the appearance of beige adipocytes in white fat. Using flow cytometry techniques and stromal vascular fraction from white fat, we isolated presumptive beige stem/progenitor cells (iBSCs). Upon genetic or pharmacologic inhibition of TGF-β signaling, these cells express high levels of predominantly beige markers. Transplantation of TβRI-deficient stromal vascular cells or iBSCs into athymic nude mice followed by high fat diet feeding and stimulation of β-adrenergic signaling via CL316,243 injection or cold exposure promoted robust beige adipogenesis in vivo.
Conclusions
TβRI signals target the prostaglandin network to regulate presumptive beige progenitors in white fat capable of developing into beige adipocytes with functional attributes. Controlled inhibition of TβRI signaling and concomitant PGE2 stimulation has the potential to promote beige adipogenesis and improve metabolism.
Keywords: Beige/brite adipogenesis, Progenitors, Metabolism, Diabetes, Obesity, TGF-beta, Prostaglandin E2, Cyclooxygenase 2
Graphical abstract
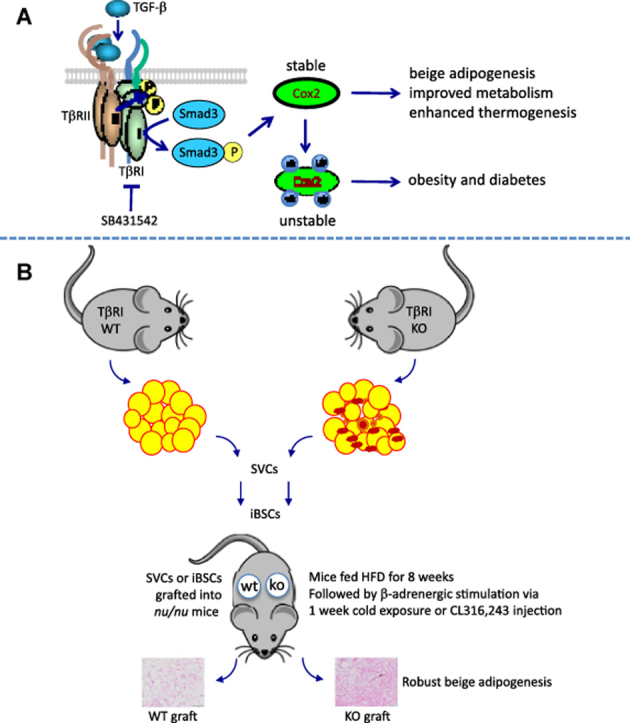
Wankhade et al. show that loss of TβRI in adipose tissue promotes beige adipogenesis. Interaction between the TGF-β and prostaglandin pathways regulates presumptive progenitors in white fat that develop into beige adipocytes with functional attributes. These findings provide mechanistic insight into signals regulating beige adipogenesis.
Highlights
- •
Loss of TβRI in adipose tissue promotes beige adipogenesis. - •
TβRI regulates presumptive beige adipocyte progenitors in white fat. - •
TβRI signals interact with the PGE2/Cox2 pathway during beige adipogenesis. - •
TβRI regulates thermogenesis, mitochondrial bioenergetics and beige adipogenesis.
1. Introduction
Adipose tissue dysfunction is at the core of the obesity and diabetes epidemic [16], [28], [46], [53]. White adipose tissue (WAT) stores fat while brown adipose tissue (BAT) dissipates it via thermogenesis [7], driven primarily by the inner mitochondrial membrane protein UCP1. Landmark findings that metabolically active BAT exists in humans [10], [38] renewed interest in its therapeutic potential to combat metabolic diseases [13], [39]. In addition, beige or brite adipocytes appear in response to cold exposure or upon stimulation by β-adrenergic pathways [9], [18]. Importantly, like brown adipocytes, presence of beige adipocytes is correlated with improvements in glucose and energy homeostasis, providing a strong therapeutic rationale for their study.
Brown and beige adipocytes may have a distinct origin [43], [62] with evidence favoring the existence of specialized progenitors [5], [49], [58], [61], although a role for trans-differentiation has also been proposed [3], [8], [22], [31], [47]. A bi-potential progenitor that differentiates towards white or brown adipocytes has been identified [32], although its ability to promote beige adipocyte differentiation is unknown. Given our limited understanding into molecular control of brown and beige cell fate and function [24], further research into understanding beige adipogenesis is needed [4], [20], [26].
The TGF-β ligand transmits its signals via dual serine/threonine kinase receptors and transcription factors called Smads [36]. TGF-β receptor I (TβRI) phosphorylates Smad3, the main signal transducer of TGF-β signals, at key serine/threonine residues. We previously reported that TGF-β signaling regulates the browning of white fat, associated with improvements in glucose homeostasis [63]. Here, we describe an important role of TβRI in regulating glucose and energy homeostasis via targeting of putative beige stem cells in white fat. These progenitor cells express key beige/brown signature markers and upon transplantation demonstrate the capacity to undergo beige adipogenesis in response to β-adrenergic pathway stimulation. Finally, we demonstrate a mechanistic interaction between the TGF-β and prostaglandin signaling pathways in regulation of beige adipogenesis.
2. Material and methods
2.1. Mouse experimentation
C57BL6 mice were purchased from Jackson Laboratory (Bar Harbor, ME). Six-week-old male mice (n = 5) were fed either normal chow (NC) or 60% high fat diet (HFD; Research Diets) for 8 weeks, 16 weeks or 24 weeks. Adipose tissue-specific TβRI knockout (TβRIAdKO) mice and littermate control TβRI wild type (TβRIAdWT) mice were generated by breeding TβRI floxed mice [29] with aP2-Cre mice [21]. All mice were maintained in 12 h light and dark cycle with ad libitum access to food. Body weights, food intake, and glucose tolerance tests were performed as previously described [63]. The NIDDK/NIH Animal Care and Use Committee approved all animal studies.
2.2. RNA isolation and real time quantitative PCR
RNA extraction, cDNA synthesis, and RT-PCR were performed as described previously [63] using gene specific primers (Table S3) by using Applied Biosystems 7500 Fast Real Time PCR System and using Fast SYBR® Green Master Mix.
2.3. Histology, immunohistochemistry, immunoprecipitation, western blot analyses
Histology and immunohistochemistry and western blot methods were performed as previously described [63]. For immunoprecipitation (IP), FLAG-Ubiquitin was transiently expressed in 3T3-L1 cells. After 48 h, the cells were treated with TGF-β1, SB431542 with or without MG132 for additional 24 h and pre-cleared lysates were immunoprecipitated overnight at 4 °C with antibody against the FLAG-tag. Non-immune IgG was included as a negative control. The immune complex was then subjected to SDS–PAGE followed by immunoblotting (IB). Antibody information is listed in Table S4.
2.4. Isolation of primary preadipocytes, adipogenesis and cell culture assay
Primary white preadipocytes were isolated from EWAT of 14–16-week HFD fed TβRIAdWT and TβRIAdKO mice. Mice were fed HFD for 8 weeks for preadipocyte, SVCs and presumptive progenitor cells unless otherwise mentioned. To harvest optimum amount of adipose tissue, three mice on HFD for 14–16 weeks and of same genotype were pooled for cell isolation. SVCs and 3T3L1 cells were treated overnight with TGFβ (10 ng/ml), SB431542 (10 uM) and MG132 (20 uM). To measure the PGE2 production, SVCs were treated overnight with TGFβ (2 ng/ml), SB431542 (10 uM) and Celecoxib (10 uM). For iBSCs, TβRIAdWT and TβRIAdKO iBSCs were cultured overnight and supernatant media was collected to measure the PGE2 production by ELISA Assay (Cayman Chemicals). To measure oxygen consumption rate (OCR), SVCs and iBSCs were treated overnight with TGFβ (2 ng/ml), SB431542 (10 uM). Next morning, OCR was measured using the Seahorse X24 analyzer (Seahorse Bioscience Inc.). Oxygen consumption and extracellular acidification rate were measured in basal conditions and after the addition of oligomycin (0.5 μM), FCCP (1 μM) and antimycin A (0.25 μM).
2.5. Isolation of presumptive progenitor cell (iBSC) population
Epididymal adipose tissue depots were excised from three mice of the same genotype that were on a HFD for 14–16 weeks. The tissues were minced and digested with buffered Collagenase-I at 1 mg/ml (Worthington) for 45 min at 37 °C in shaking water bath. After digestion, the slurry was filtered through a 100um filter followed by centrifugation of the filtered portion at 250gX5 for 5 min. The cell pellet was washed with ACK buffer (NH4Cl 150 mM, KHCO3 10 mM, Na2EDTA 0.1 mM) to remove red blood cells. Collected cells were washed two times with FACS buffer (PBS supplemented with 1% BSA and 0.25 mM EDTA). Collected cells were stained with antibodies listed in Table S4 for 45 min on ice. Stained samples were washed twice and sorted on FACS-Aria sorter (BD Biosciences, USA) equipped with 407, 488, 532, and 633 LASER lines using DIVA v6.1.3 software. Populations were identified and sorted as per the gating strategy displayed in Figure 2C.
Figure 2.

TGF-β signaling regulates inducible beige progenitor cells. (A) TGF-β represses whereas the TGF-β receptor 1 inhibitor SB431542 stimulates the expression of brown/beige marker genes in normal wild type SVCs differentiated using brown adipocyte differentiation cocktail. SVCs were isolated from six-week aged male mice fed HFD for 14–16 weeks. Levels shown in TGF-β (open columns) and SB431542 (shaded columns) treated samples are statistically compared to Control (closed columns) treated samples. (n = 3 each) (B) Treatment of wild type undifferentiated SVCs with TGFβ leads to reduced basal and maximal respiration, whereas SB431542 treatment reverses the effect and leads to significantly higher respiration capacity. SVCs were treated with oligomycin (0.5 μM), FCCP (1 μM) and antimycin A (0.25 μM) as described in the methods section. (n = 3 each) (C) SVCs were sorted using flow cytometry and specific cell surface antibodies to identify putative beige stem cells. The boxed regions within the panels indicate the percentage of cells sorted using specific antibodies as identified in the top right corner of the panel. (n = 3 each) (D) SB431542, but not TGF-β, stimulates the expression of brown/beige marker genes (Dio2, Pgc-1α, Tmem26, Tbx1, Prdm16, and Ucp1) in normal undifferentiated wild type iBSCs. Levels shown in TGF-β (open columns) and SB431542 (shaded columns) treated samples are statistically compared to Control (closed columns) treated samples. (n = 3 each). (E) Compared to undifferentiated iBSCs isolated from TβRIAdWT adipose tissue, the undifferentiated TβRIAdKO iBSCs exhibit increased expression of brown/beige specific markers Tbx1, Prdm16, Lhx8, and Cox8b. WAT specific markers Tcf21 and Tle3 are repressed. Brown specific Zic1 transcript and levels of functional brown/beige markers Ucp1, Dio2, and Pgc-1α are not changed. Epididymal adipose tissue depots were collected and pooled from n = 3 mice for iBSC isolation. Levels of Prdm16 protein are elevated in TβRIAdKO iBSCs (see inset); equal tubulin protein levels are shown as protein loading control. (F) Undifferentiated TβRIAdKO iBSCs exhibit increased expression of nine beige specific markers. Epididymal adipose tissue depots were collected and pooled from n = 3 mice of each genotype for iBSC isolation. (G) Compared to undifferentiated TβRIAdWT iBSCs, the undifferentiated TβRIAdKO iBSCs exhibit increased expression of mitochondrial specific markers. Data are analyzed by one-way ANOVA and group wise differences were assessed by post-hoc Tukey HSD test wherever appropriate. Error Bars are expressed as ± Standard Errors, *p < 0.05; **p < 0.005; ***p < 0.001.
2.6. Presumptive progenitor iBSC and SVC transplantation
SVCs (1.5 × 10⁶ cells) and iBSCs (3 × 10⁵ cells) were subcutaneously injected into both flank sites in 8-week old male nude mice (Foxn1 nu (nude) mice n = 6 mice, 3 per treatment i.e. CL316,243 and cold exposure) (The Jackson Laboratories) under anesthesia. Mice were fed HFD before and after cells transplantation. Mice were anaesthetized and surgically transplanted with an IPTT-300 transponder (Biomedic Data Systems). Before the cell transplantation, mice could recover from the procedure for 2 weeks. SVCs and iBSCs were injected in left and right flank (TβRIAdWT and TβRIAdKO respectively) and grafts could grow for 8 weeks. During the 9th week, mice were challenged with either cold exposure (4 °C, 90 min/day for seven consecutive days) or administered CL316,243 (1 mg/kg bw per day for seven consecutive days) injection. During cold exposure the local and core body temperature of the mice was monitored. Surface temperature was monitored with IPTT-300 transponder and DAS-7006/7s wand (Biomedic Data Systems) and core body temperature was monitored by rectal probe (TH-5 Thermalert Monitoring Thermometer). The transplant experiments were conducted two separate times on two separate groups of donor and recipient mice followed by treatments and analyses as described.
2.7. Microarray analyses
Microarray analyses protocols were described previously [63].
2.8. Statistical analysis
Data are expressed, as mean ± SEM. Statistical significance between two groups was determined using two-tailed Student's t test. Multiple groups statistical significance was tested by one-way ANOVA and group wise differences were determined by post hoc Tukey HSD test by using statistical and visualization software R. A p value of <0.05 was considered statistically significant, and all tests were two sided. See Table S5 for details. Error Bars are expressed as ± Standard Errors, *p < 0.05; **p < 0.005; ***p < 0.001.
3. Results
3.1. Adipose-tissue specific deletion of TβRI promotes beige adipogenesis that is associated with improved metabolism
We observed a time-dependent and depot-specific increase in Smad3 and TβRI expression in the stromal vascular cells (SVC) of epididymal (EWAT) and anterior-subcutaneous (AWAT) white fat depots (Figure 1A–D) from high fat diet (HFD) mice. To investigate the role of TGF-β signaling, we generated adipose tissue-specific TβRI knockout (TβRIAdKO) mice by breeding TβRI floxed mice [29] with aP2-Cre mice [21]. While the aP2-Cre model has been widely used to study adipose tissue specific roles of many genes, recent reports have advocated careful characterization of models generated using this system [30]. We have elaborated on this point and the considerations for our selecting this model in the discussion. Abundant aP2 protein was seen in mature adipocytes from EWAT and AWAT depots (Figure S1a). Using the aP2-Cre recombineering approach allowed effective excision of TβRI in majority of cells within the stromal vascular fraction (SVF) and in mature adipocytes (Figure S1b). SVF contains several types cells including immune cells, endothelial cells, fibroblasts and preadipocytes. We believe that the residual TbR1 expression is from non-adipocyte cells where aP2-cre is not active.
Figure 1.

Adipose tissue specific deletion of TGFβ receptor 1 promotes browning of white fat and protects from obesity, glucose intolerance and hepatic steatosis. (A-D) Normal mice (6-week-old, males, n = 4) were fed either normal chow diet (NC) or HFD for 8 weeks or 16 weeks and SVCs and adipocytes from the EWAT (A, C) and AWAT (B, D) were examined for activation of TGF-β/Smad3 signaling. Increase in Smad3 transcripts (A, B) was seen in SVCs isolated from EWAT (A) and AWAT (B), but not in mature adipocytes, in response to 8 weeks of HFD feeding. Increased levels of phosphorylated Smad3 protein was also seen in the SVC fraction of EWAT (C) and AWAT (D) in response to 8 weeks of HFD feeding. Levels of TβRI were also increased under those conditions (C and D). Total Smad3 and loading control Tubulin protein are shown. (E–G) HFD fed TβRIAdKO mice (male, n = 6), compared to similarly fed age-matched TβRIAdWT mice (male, n = 9) exhibit reduced weight gain (E), improved glucose tolerance (F) and are protected from hepatic steatosis (G). (H) EWAT depots from HFD fed TβRIAdKO mice exhibit smaller sized multilocular adipocytes and increased UCP1 positive cells as detected via immunofluorescence (using Sigma antibody) and immunohistochemistry (using Abcam antibody). T-test, one-way ANOVA and group wise differences were assessed by post-hoc Tukey HSD test wherever appropriate. Error Bars are expressed as ± Standard Errors, *p < 0.05; **p < 0.005; ***p < 0.001.
No significant differences in body weight and glucose tolerance were observed in regular diet fed TβRIAdKO mice, compared to age and sex-matched control (TβRIAdWT) mice (Figure S1c and d). When challenged for 24 weeks on HFD, the severity of body weight gain, glucose intolerance and hepatic steatosis was reduced in TβRIAdKO mice (Figure 1E–G). Body weight reduction in the TβRIAdKO mice was observed after 10–12 weeks of HFD diet challenge, a period that follows the 8-week timepoint when elevated TβRI and Smad3 levels were observed during HFD feeding (Figure 1A–D). The blunted weight gain around week 12 could be due to cage manipulations, animal handling or variations in the batch of HFD during the 24-week feeding regimen. Interestingly, Seale et al., observe a similar weight reduction during the mid-point of HFD feeding, albeit within a different time frame [50].
No difference was observed in food intake during HFD feeding between the two genotypes (Figure S1e and f). H&E staining of EWAT from TβRIAdKO mice revealed the presence of smaller sized adipocytes that stained positive for UCP1 (Figure 1H), features consistent with beige/brite adipocytes. Two different sources of UCP1 antibodies were used for immunoblotting and immunohistochemistry and we observed similar results using either antibody (Figure S2). Other white adipose tissue depots, specifically anterior subcutaneous, mesenteric, inguinal, and retroperitoneal depots did not exhibit major histological differences between genotypes although adipocyte cell diameter was modestly changed (Figure S3a and b). UCP1 protein levels were elevated in inguinal and anterior subcutaneous WAT depots and in brown adipose tissues from HFD-fed TβRIAdKO mice (data not shown). Levels of UCP1 mRNA were similar in BAT from mice of either genotype fed regular diet (RD) and exposed to cold or when RD-fed mice were maintained at a thermoneutral temperature (data not shown). Further, minimal changes in total energy expenditure were observed when RD-fed mice were exposed to cold or injected with the β-adrenergic agonist CL316,243 (data not shown). Thus, based on this data we believe that TβRI deletion has minimal effects on basal BAT function. Further detailed studies are needed to reveal if any role exists for TGF-β signaling in BAT function.
3.2. Identification of TβRI regulated beige adipocyte progenitors
Adipose tissue comprises a heterogeneous mixture of adipocytes and stromal vascular cells (SVC) that are a complex milieu of preadipocytes, fibroblasts, endothelial cells, and immune cells. The elevated TβRI and Smad3 expression in the SVC (Figure 1A–D) prompted us to test the notion that TβRI signals might regulate putative beige/brite progenitors residing in the SVC fraction. TGF-β suppressed, whereas TGFβ receptor 1 kinase inhibitor (SB431542) enhanced, expression levels of brown/beige adipocyte marker genes (Dio2, PGC-1a, PRDM16, Ucp1, Cox8b and Cidea) when wild-type SVCs were cultured under a brown adipocyte differentiation protocol (Figure 2A). In agreement, the basal respiration rate was higher in WT SVCs treated with SB431542 and suppressed in cells treated with TGF-β (Figure 2B). Addition of FCCP demonstrated a higher maximal respiratory capacity in SB431542 treated cells whereas the maximal respiratory capacity was reduced in cells treated with TGF-β.
Recent studies have reported identification of putative brown/beige progenitors [45], [49], [61]. Fluorescence-activated cell-sorting (FACS) of the SVC fraction yielded CD45−CD31−CD105−CD34+CD90.2+ cells (Figure 2C) that we propose are presumptive inducible beige stem/progenitor cells (iBSCs). This interpretation is based on expression analyses of beige, brown, and white adipocyte specific markers (Figure 2D,E – new figure) using recently reviewed classifications [4], [11], [20], [34], [57]. The rationale for choosing the array of cell surface antibodies used during the FACS is discussed later in the manuscript. Under a brown adipocyte differentiation protocol, treatment of wild type iBSCs with SB431542 resulted in a robust induction of multiple beige/brown markers (Figure 2D). Tbx1 was highly induced in the undifferentiated iBSCs from TβRIAdKO mice whereas the WAT specific markers (Tcf21 and Tle3) were repressed (Figure 2E). The BAT specific marker Zic1 was unchanged and Prdm16, Lhx8, and Cox8b were induced (Figure 2E), suggesting that the cells were preferentially expressing beige and not brown adipocyte markers. To further validate the marker expression, we surveyed nine beige adipocyte markers in a separate experiment using a different set of FACs sorted iBSCs from SVCs harvested from EWAT of a separate group of mice. Five of nine beige adipocyte-specific markers were induced in the undifferentiated TβRIAdKO iBSCs (Figure 2F). Of these, Tbx1, Tmem26 and Tnfsrf9/Cd137 have been extensively used as beige markers. Although the trend is similar, the quantitative difference in levels of Tbx1 gene expression in Figure 2E,F is likely due to the iBSCs being FACs sorted from different populations of SVCs from different groups of mice in the independent experiments. Based on the higher proportion of positive beige markers, we labeled these cells as presumptive beige stem/progenitor cells. Paucity of multiple bonafide markers that faithfully discriminate between the brown and beige adipocytes limits our ability to further classify these progenitors more comprehensively. PRDM16 protein was highly induced in TβRIAdKO iBSCs (Figure 2E, inset). Interestingly, Ucp1 and Ppargc1a (also known as PGC-1α), levels were not increased in the TβRIAdKO iBSCs (Figure 2E), despite the presence of progenitor markers, suggesting the possibility of naïve unstimulated iBSCs. Indeed, culturing of the iBSCs with CL316,243 induced Ucp1 and PGC-1α expression, consistent with functional activation (Figure S3c). Furthermore, TβRIAdKO iBSCs showed increased expression of mitochondrial marker genes Ndufa6, Sod2, Uqcrb, Oxa1, Cyc, and Gpx1 indicative of improved mitochondrial bioenergetics (Figure 2G). Together, these findings are consistent with the identification of TGF-β regulated iBSCs in white fat.
3.3. Interaction of TβRI and prostaglandin pathways during beige adipogenesis
Unbiased gene expression analyses of RNA samples derived from HFD-fed EWAT tissues from TβRIAdKO mice and TβRIAdWT mice revealed significant changes in genes representing mitochondrial bioenergetics, muscle biology, brown fat development, fever and heat physiology, and the prostaglandin pathway (Tables S1 and S2). Among the top genes significantly induced in all the groups were Ptgs2/Cox-2 (Figure 3A), suggestive of a role for the Cox-2/prostaglandin pathway. WAT, SVCs, and iBSCs from TβRIAdKO mice showed increased expression of Cox-2 (Figure 3B,D). To further examine the TGF-β/Cox2 interactions, we used the 3T3-L1 preadipocytic cell line that can differentiate to either white or brown/beige adipocytes [2], [37]. Consistent with the data, levels of Cox-2 and intermediates Pgi2, and EP2 were increased in 3T3L1-shS3 cells, a preadipocytic cell line where Smad3 expression is knocked down using a lentivirus expressing short hairpin RNA against Smad3 (Figure 3C,E). Levels of prostaglandin E2 (PGE2) trended higher in culture media of TβRIAdKO iBSCs (Figure 3F). Moreover, wild type SVCs treated with SB431542 exhibited elevated PGE2 levels, whereas those levels were repressed in response to TGF-β to levels observed upon treatment with the Cox-2 inhibitor, Celecoxib (Figure 3G). Interestingly, Cox-2 protein levels were reduced in control mice fed HFD (Figures 3H). Treatment of 3T3L1 cells with TGF-β reduced Cox-2 protein expression, whereas, SB431542 treatment restored or increased its expression (Figure 3I). Importantly, treatment with the ubiquitin-proteasome pathway inhibitor, MG132, restored Cox-2 protein levels, indicating a role for proteasome-mediated degradation of Cox-2 (Figure 3I).
Figure 3.

TGF-β/Smad3 signaling regulates proteasomal degradation of Cox-2 and interaction between TGF-β and prostaglandin pathways regulate beige marker genes. (A) Ptgs2/Cox-2 gene expression is increased 17-fold in HFD-fed EWAT tissues from TβRIAdKO mice. (B, C) SVCs and iBSCs from TβRIAdKO mice (B) and 3T3L1-ShS3 cells (C) exhibit increased expression of Cox-2 mRNA. (D, E) Increased protein expression of Cox-2 and prostaglandin pathway intermediates (Pgi-2, EP-2) in TβRIAdKO EWAT tissue (D) and in 3T3L1-shSmad3 cells (E). α-tubulin and GAPDH levels are shown as loading control. Smad3 protein expression is observed in control 3T3L1 cells, but not in 3T3L1-shSmad3 cells. (F) Levels of prostaglandin E2 are elevated in cell culture media of TβRIAdKO iBSCs (n = 3 each treatment). (G) TGF-β treatment suppressed, whereas SB431542 increased, prostaglandin E2 levels in control wild-type SVCs. Treatment with the Cox-2 inhibitor Celecoxib suppressed prostaglandin E2 levels. Treated samples are statistically compared to vehicle-treated samples (first column) (n = 3 each treatment). (H) Reduced Cox-2 protein level in diet-induced obese (DIO) mice. (I) Control 3T3L1 cells were transfected with Flag-tagged ubiquitin plasmids followed by treatment with TGFβ or SB431542 in the presence or absence of MG132. Cells were harvested for protein followed by immunoblot of the lysates to detect relative expression of Flag-tagged ubiquitin, Cox-2 and GAPDH control (lower three panels). Additionally, equal amounts of lysates were subjected to immunoprecipitation with anti-Flag antibodies followed by immunoblot with anti-Cox-2 antibodies to detect ubiquitinated Cox-2 in cells treated with TGF-β or SB431542 with or without the presence of MG132 (upper two panels). (J) Interaction between the TGF-β and prostaglandin pathways on Pgc-1α, Cidea, Prdm16, and Ucp1 gene expression. SVCs were isolated from EWAT of WT mice and cultured with ligands TGF-β1 (5 ng/ml) and PGE2 (10 ug/ml) or inhibitors SB431542 (10 uM) and Celecoxib (Cx) (10 uM) either singly or in combination as outlined in the figure for 16 h after which the cells were harvested and analyzed for gene expression (n = 3 each per treatment). Data are analyzed by one-way ANOVA and group wise differences were assessed by post-hoc Tukey HSD test wherever appropriate. Error Bars are expressed as ± Standard Errors, *p < 0.05; **p < 0.005; ***p < 0.001 (among the groups indicated) and p values #p < 0.05, ##p < 0.01 ###p < 0.001 for values compared between control vs PGE2 and Cx groups. NS represents not-significant.
To better understand the role of TGF-β/Smad3 in regulating the ubiquitination and proteasomal degradation of Cox-2, we conducted co-immunoprecipitation assays using 3T3L1 cells. Increased levels of Cox-2 were detected in cells treated with SB431542 with or without MG132 compared to the levels of Cox-2 in cells treated with TGF-β, with or without MG132, which is suggestive of added SB431542-mediated protection of Cox-2 from degradation. Further, in co-immunoprecipitation assays using Flag-tagged ubiquitin and Flag antibodies, higher levels of ubiquitinated Cox-2 were detected in MG132 treated cells upon SB431542 incubation, compared to those incubated with TGF-β, suggesting that SB431542 protects Cox-2 from degradation, while TGF-β promotes Cox-2 degradation (Figure 3I). A point to note is that despite the presence of MG132, the levels of Cox-2 in TGF-β treated cells were lower than that seen in cells treated with MG132 alone (Figure 3I). Taken together, these observations suggest that TGF-β degrades Cox-2 via both MG132-dependent and independent pathways. Further detailed studies will reveal the identity of the ubiquitin ligase involved and whether that ligase is under TGF-β regulation.
We next studied potential interactions between TGF-β and prostaglandin signaling pathways in EWAT SVCs from normal wild type mice. Undifferentiated SVCs from normal wild-type mice were cultured with agonists (TGF-β1 and PGE2) and antagonists (SB431542 and Celecoxib) either singly or in combination to evaluate effects on beige/brown marker gene expression (Figure 3J). As expected, TGF-β repressed and SB431542 stimulated beige/brown markers. Further, PGE2 stimulated and Celecoxib repressed the same marker genes. Interestingly, we observed interaction between the TGF-β and prostaglandin pathways with respect to expression levels of the beige/brown markers. Thus, addition of PGE2 rescued TGF-β-dependent suppression of marker gene expression, whereas, Celecoxib blunted SB431542 stimulated marker expression. Co-addition of TGF-β and Celecoxib dramatically suppressed the markers, while a significant additive effect on gene expression was seen upon co-stimulation with PGE2 and SB431542. The experiments were done on undifferentiated SVCs to target presumptive progenitors in the milieu, which is consistent with the observations that PRDM16, Cidea and PGC-1a, but not Ucp1, gene expression was affected by the various combinatorial stimulations mentioned above.
3.4. TβRI regulated progenitors undergo functional beige adipogenesis in vivo
We next assessed the functionality of the SVCs and iBSCs from TβRIAdKO and TβRIAdWT mice by determining their capacity to undergo beige adipogenesis in response to metabolic stress induced by HFD challenge followed by β-adrenergic stimulation. Our rationale was application of metabolic pressure to allow growth and development of the grafts followed by functional stimulation via β-adrenergic stimulation. SVCs (1.5 × 10⁶ cells) and iBSCs (3 × 10⁵ cells) were transplanted subcutaneously into the right and left flanks of recipient nu/nu mice. Prior to the transplant, representative mice were implanted with an IPTT-300 transponder sutured at the site of transplant that would allow monitoring of the local temperature of the graft (Figure S4a). So that each mouse would serve as its own control in the transplant experiment, we injected equal numbers of SVCs or iBSCs from either the TβRIAdKO (right flank) or the TβRIAdWT (left flank) mice (Figure 4A). The transplanted mice were fed HFD and observed daily for 8 weeks after which mice were either (a) exposed 90 min to 4 °C temperature for seven consecutive days or (b) injected with the β3-adrenergic receptor agonist CL316,243 daily for a period of seven days. During cold exposure, the implanted IPTT-300 transponder measured the local surface temperature of the graft. The local surface temperature at the site of the TβRIAdKO graft dropped at a significantly slower rate compared to the TβRIAdWT graft (Figure 4B), suggestive of better thermogenic potential of TβRIAdKO iBSCs, although we cannot exclude the possible effects of differences in vascular flow or skin permeability contributing to the observed temperatures changes [40]. After the experimental period, the grafts were recovered for further analyses. Grafts from the TβRIAdKO iBSCs and SVCs showed increased Pgc-1α, Ucp1, and Prdm16 gene expression and UCP1 protein levels (Figure 4C,D). Moreover, histological analysis revealed abundant smaller sized multilocular UCP1 positive cells in the TβRIAdKO grafts (Figure 4E and Figure S4b and c). A point of note being that expression of Ucp1 and Pgc-1α were relatively low in freshly isolated unstimulated iBSCs (Figure 2F). Furthermore, the relative levels of Ucp1, Pgc-1α, and Prdm16 in the isolated grafts, after the nine-week transplant and β-adrenergic pathway stimulation regimen were like that seen in the classical brown fat tissue dissected from the same mice (Figure S4d). Absence of a LacZ or a fluorescence guide in the transplanted cells precludes us from lineage-tracing their fate and offer direct proof of de novo beige adipogenesis from the transplanted cells. However, the robust UCP1 protein expression in the recovered grafts is strongly suggestive of functional maturation of the transplanted cells, given the knowledge that native white adipose tissue is typically devoid of UCP1 protein. Taken together, these studies demonstrate the capacity of TβRIAdKO iBSCs to undergo functional beige adipogenesis in vivo.
Figure 4.

TβRIAdKO iBSCs undergo functional beige adipogenesis in vivo. (A) Schematic representation of the transplant protocol. iBSCs and SVCs isolated from TβRIAdWT and TβRIAdKO adipose tissue were transplanted into the flanks of athymic nu/nu mice (n = 6 mice, 3 per treatment i.e. CL316,243 and cold exposure). FACS sorted cells isolated from TβRIAdWT and TβRIAdKO mice were transplanted into opposite flanks as shown to allow comparison of graft development within the same recipient mouse. Upon transplantation, the mice were fed HFD for eight weeks after which they were either subjected to 4 °C cold exposure (90 min/day for seven consecutive days) or injected with the β-adrenergic receptor agonist CL316,243 (1 mg/kg bw per day for seven consecutive days). (B) During cold exposure, the local surface temperature of the TβRIAdKO iBSCs graft was significantly warmer compared to the TβRIAdWT iBSCs graft. (C) Transcript levels of Ucp1, Prdm16 and Pgc-1α were increased in TβRIAdKO iBSCs grafts upon cold exposure and stimulation by CL316,243. (D) UCP1 protein expression was highly elevated in TβRIAdKO iBSC and SVC grafts, compared to that seen in the TβRIAdWT iBSC graft. Levels of UCP1 protein seen in the TβRIAdKO iBSC graft were comparable to levels of UCP1 seen in the BAT harvested from the same recipient mouse. In comparison, EWAT shows undetectable UCP1 expression. (E) Analysis of the grafts following the 8-week growth and 1-week β-adrenergic receptor pathway stimulation. Compared to grafts from TβRIAdWT donors, H&E staining and UCP1 immune staining of the SVC and iBSC grafts from TβRIAdKO donors exhibited abundant UCP1 positive small-sized multilocular adipocytes. Data are analyzed by T-test. Error Bars are expressed as ± Standard Errors, *p < 0.05.
4. Discussion
The data presented here demonstrate an important role of the TGF-β receptor signaling in regulating a specific pool of progenitors in white fat depots with potential to undergo beige adipogenesis. Brown adipocytes and beige adipocytes appear to have different origins given their distinct gene signatures [4], [20], although they possess both common and unique features that may bear functional significance [23]. We propose that the cells we have identified are presumptive beige progenitors based on expression of markers that are unique or shared between brown and beige/brite adipose tissues. Having said that, it needs to be stressed here that there is ongoing discussion as to the specificity and validity of these markers, with respect to expression patterns, developmental origins, anatomical localization, and, perhaps, functional state [11]. In TβRIAdKO iBSCs, we observed elevated levels of Tbx1, a beige adipocyte marker protein [4], and several other beige markers, while levels of Zic1, a classical brown adipocyte specific marker [33], were unchanged. Further, we observed reduced levels of Tcf21 and Tle3 genes specific to white adipocytes [4]. Interestingly, levels of Prdm16 and Tbx1, but not Ucp1 or Pgc-1α, were significantly high in unstimulated SVCs and TβRIAdKO iBSCs suggestive of a potentially committed but unstimulated beige adipocyte precursor. In agreement with that notion, β-adrenergic stimulation in culture induced Ucp1 levels, consistent with conversion to an activated state. Further, transplanted TβRIAdKO iBSCs when stimulated by metabolic stress followed by β-adrenergic pathway stimulation showed significantly elevated levels of UCP1 – like that seen in BAT - and exhibited enhanced thermogenic capacity suggestive of functional beige adipogenesis. Due to technical limitations, we were unable to test the differentiation capacity of the sorted cells to undergo white adipocyte differentiation. Rodeheffer et al., also used flow-based sorting to identify and isolated adipocyte progenitor cells [45]. Their FACS strategy excluded Lin-expressing cells and used a combination of CD29, CD34 and Sca-1 and CD24 to identify white adipose progenitor cells. In principle, both the methods first focus on removing lineage positive cells from live single cells, and then identify potential stem cells with the help of commonly expressed stem cell markers such as CD34 and Sca-1 vs CD34 and CD90.1. In our protocol, we added CD31 and CD105 to gate out cells having endothelial lineage and smooth muscle cells, respectively, to enrich iBSCs.
TGF-β superfamily ligands TGF-β, BMP4, BMP7, BMP8b, and Activin are implicated in white, brown, and beige adipogenesis [15], [26], [27], [44], [48], [49], [60], [63], [64]. BMP7 and BMP8b promote brown adipocyte differentiation [48], [55], [60] while BMP4 stimulates adipogenesis and differentiation to white and beige adipocytes in the inguinal depots [44]. Inhibition of the Activin receptor IIB (ActRIIB) via a soluble ActRIIB-Fc protein, prevented HFD-induced obesity where the protective effect was associated with browning of epididymal WAT [27]. Similarly, myostatin null mice and wild type mice treated with the soluble ActRIIB demonstrate reduced fat accumulation in response to HFD challenge and exhibited epididymal white fat browning [64]. However, Fournier et al., using a similar ActRIIB-Fc antibody approach observed functional brown adipogenesis and thermogenesis, without any associated browning of either inguinal or epididymal white fat depots [15]. Our prior studies [63] and the results presented here support a role for TβRI-Smad3 signaling in browning of the epididymal white adipose tissue depot. The browning potential of the epididymal depot is markedly lower than that of the inguinal depot. We also observed increased browning and elevated UCP1 in inguinal WAT of TβRIAdKO mice (data not shown). The findings that TGFβ signaling can regulate the browning capacity of the epididymal white fat depot, that is generally refractory to browning, might reveal important insights into (i) depot-dependent differences in white fat browning and (ii) avenues that promote browning of white fat depots that have a relatively poor thermogenic potential.
Since the nature and origin of beige/brown stem cells are incompletely understood, the use of available Cre-drivers to genetically manipulate genes is accompanied by caveats with regards to their appropriateness to identify and isolate stem cells. We used aP2-Cre driver in this study, and while we could identify stem cells in the adipose tissue depots, we cannot completely exclude the effect of aP2-Cre deletion in other cells. aP2-Cre mice have been generated by at least four independent laboratories and widely used in studies targeting adipose tissue in vivo [30] that resulted in seminal findings about the adipose-tissue specific roles of several key genes, including the insulin receptor (FIRKO mouse), Glut4, _PKC_λ, etc. [1], [6], [19], [30], [52]. Over the past few years, studies have reported the observations of aP2-Cre activity in other cell types. A recent systematic study has shed light on the nature of aP2-Cre targeted recombination in mice [30]. Thus, Lee et al., observe little or no recombination in many tissues where prior reports have shown Fabp4/aP2 expression [30]. Importantly, they show that adipose tissue macrophages also do not express significant levels of Fabp4/aP2, which agrees with their finding of absence of recombination in the macrophages of the aP2-Cre mice [30]. aP2-cre promoted recombination in the endothelial cells of the heart and nonendothelial, nonmyocyte cells in the skeletal muscle [30]. It is worth mentioning here a study from the Scherer laboratory [59] which showed that adiponectin-Cre expression is restricted to mature adipocytes and is undetectable in the stromal vascular fraction of epididymal fat depots, a key source for the cells we describe in this study. Thus, we decided to use the aP2-Cre driver which is effective in targeting both adipocyte progenitors and mature adipocytes [51], in contrast to other informative models that might selectively target mature adipocytes [12], [25], [59]. We agree however that follow-up studies using Cre drivers such as adiponectin-Cre [12], [59] will allow comparison of the findings reported here with respect to effects of targeting TβRI in mature adipocytes.
The interaction between the TGF-β and prostaglandin pathways is intriguing in that both are linked to beige fat development [35], [56], [63]. Cyclooxygenase-2 (Cox-2/Ptgs2) is a rate-limiting enzyme in prostaglandin biosynthesis. In addition to its role in inflammation, Cox-2 is induced upon sympathetic stimulation and recruits beige adipocytes in the subcutaneous and intra-abdominal visceral white fat depots [35], [56] and overexpression of Cox2 protects from diet-induced obesity. In contrast, loss of Cox-2 or inhibition of its activity results in a muted response to β3-adrenergic stimulation. Consistent with this, Cox-2 heterozygosity in mice results in obesity [14]. We show that TGF-β regulates Cox-2 stability in the adipose tissue. Whether these observations are unique to TβRI or extend to other ligand–receptor complexes within the TGF-β superfamily with known effects on adipose tissue browning remain to be studied. Ohno et al. showed that PPARγ agonists stabilize PRDM16 protein during browning of white fat [42]. Whether PPARγ agonists stabilize Cox-2 or if TGF-β regulates the half-life of PRDM16 remains to be investigated.
In summary, the burgeoning literature supporting the browning of white fat has potential therapeutic implications for combating metabolic diseases [4], [54]. Administration of BMP7 or antibodies directed against TGF-β and activin promote adipose tissue browning [15], [27], [55], [63], [64]. Furthermore, PGE2/Cox-2 has been implicated in stem and progenitor cell homeostasis and regeneration [17], [41]. Our findings are supportive of TGF-β-dependent negative regulation of PGE2/Cox-2 in recruitment and activation of beige adipocyte progenitors, that show potential to undergo functional beige adipogenesis in white fat depots. Despite the potential systemic effects of elevating prostaglandin synthesis or blocking TGF-β signaling these findings thus provide a fundamental basis for inducing PGE2/Cox-2 via inhibiting TGF-β/Smad3 signaling to recruit beige progenitors and promote metabolic benefit.
Acknowledgements
UDW performed majority of the experiments. JL performed mouse transplantation studies. PKD and JPM helped with flow cytometry assays. HY and MS helped with cell culture studies. WC performed microarray studies. ABK provided TβR1 mice. TF and AMC consulted on various aspects of the paper. SGR conceived of the project, wrote the paper and is the guarantor of the work. The authors appreciate the support of members of the Rane laboratory, Jie Liu, Mohammed Wiese, Yanling Wang, and Alice Franks for technical assistance. The authors declare that they have no conflict of interest. This work was supported by funds from the NIH intramural program (DIA DK055106).
Footnotes
Conflict of interest
None declared.
Appendix A. Supplementary data
The following are the supplementary data related to this article:
Multimedia component 1
Multimedia component 2
Multimedia component 3
Multimedia component 4
Multimedia component 5
Multimedia component 6
References
- 1.Abel E.D., Peroni O., Kim J.K., Kim Y.B., Boss O., Hadro E. Adipose-selective targeting of the GLUT4 gene impairs insulin action in muscle and liver. Nature. 2001;409:729–733. doi: 10.1038/35055575. [DOI] [PubMed] [Google Scholar]
- 2.Asano H., Kanamori Y., Higurashi S., Nara T., Kato K., Matsui T. Induction of beige-like adipocytes in 3T3-L1 cells. Journal of Veterinary Medical Science. 2014;76:57–64. doi: 10.1292/jvms.13-0359. [DOI] [PMC free article] [PubMed] [Google Scholar]
- 3.Barbatelli G., Murano I., Madsen L., Hao Q., Jimenez M., Kristiansen K. The emergence of cold-induced brown adipocytes in mouse white fat depots is determined predominantly by white to brown adipocyte transdifferentiation. American Journal of Physiology. Endocrinology and Metabolism. 2010;298:E1244–E1253. doi: 10.1152/ajpendo.00600.2009. [DOI] [PubMed] [Google Scholar]
- 4.Bartelt A., Heeren J. Adipose tissue browning and metabolic health. Nature Reviews Endocrinology. 2014;10:24–36. doi: 10.1038/nrendo.2013.204. [DOI] [PubMed] [Google Scholar]
- 5.Berry D.C., Jiang Y., Graff J.M. Mouse strains to study cold-inducible beige progenitors and beige adipocyte formation and function. Nature Communications. 2016;7:10184. doi: 10.1038/ncomms10184. [DOI] [PMC free article] [PubMed] [Google Scholar]
- 6.Bluher M., Michael M.D., Peroni O.D., Ueki K., Carter N., Kahn B.B. Adipose tissue selective insulin receptor knockout protects against obesity and obesity-related glucose intolerance. Developmental Cell. 2002;3:25–38. doi: 10.1016/s1534-5807(02)00199-5. [DOI] [PubMed] [Google Scholar]
- 7.Cannon B., Nedergaard J. Brown adipose tissue: function and physiological significance. Physiological Reviews. 2004;84:277–359. doi: 10.1152/physrev.00015.2003. [DOI] [PubMed] [Google Scholar]
- 8.Cinti S. Transdifferentiation properties of adipocytes in the adipose organ. American Journal of Physiology. Endocrinology and Metabolism. 2009;297:E977–E986. doi: 10.1152/ajpendo.00183.2009. [DOI] [PubMed] [Google Scholar]
- 9.Cousin B., Cinti S., Morroni M., Raimbault S., Ricquier D., Penicaud L. Occurrence of brown adipocytes in rat white adipose tissue: molecular and morphological characterization. Journal of Cell Science. 1992;103(Pt 4):931–942. doi: 10.1242/jcs.103.4.931. [DOI] [PubMed] [Google Scholar]
- 10.Cypess A.M., Lehman S., Williams G., Tal I., Rodman D., Goldfine A.B. Identification and importance of brown adipose tissue in adult humans. New England Journal of Medicine. 2009;360:1509–1517. doi: 10.1056/NEJMoa0810780. [DOI] [PMC free article] [PubMed] [Google Scholar]
- 11.de Jong J.M., Larsson O., Cannon B., Nedergaard J. A stringent validation of mouse adipose tissue identity markers. American Journal of Physiology. Endocrinology and Metabolism. 2015;308(12) doi: 10.1152/ajpendo.00023.2015. E1085–E1105. [DOI] [PubMed] [Google Scholar]
- 12.Eguchi J., Wang X., Yu S., Kershaw E.E., Chiu P.C., Dushay J. Transcriptional control of adipose lipid handling by IRF4. Cell Metabolism. 2011;13:249–259. doi: 10.1016/j.cmet.2011.02.005. [DOI] [PMC free article] [PubMed] [Google Scholar]
- 13.Enerback S. Human brown adipose tissue. Cell Metabolism. 2010;11:248–252. doi: 10.1016/j.cmet.2010.03.008. [DOI] [PubMed] [Google Scholar]
- 14.Fain J.N., Ballou L.R., Bahouth S.W. Obesity is induced in mice heterozygous for cyclooxygenase-2. Prostaglandins & Other Lipid Mediators. 2001;65:199–209. doi: 10.1016/s0090-6980(01)00136-8. [DOI] [PubMed] [Google Scholar]
- 15.Fournier B., Murray B., Gutzwiller S., Marcaletti S., Marcellin D., Bergling S. Blockade of the activin receptor IIb activates functional brown adipogenesis and thermogenesis by inducing mitochondrial oxidative metabolism. Molecular and Cellular Biology. 2012;32:2871–2879. doi: 10.1128/MCB.06575-11. [DOI] [PMC free article] [PubMed] [Google Scholar]
- 16.Gesta S., Tseng Y.H., Kahn C.R. Developmental origin of fat: tracking obesity to its source. Cell. 2007;131:242–256. doi: 10.1016/j.cell.2007.10.004. [DOI] [PubMed] [Google Scholar]
- 17.Goessling W., North T.E., Loewer S., Lord A.M., Lee S., Stoick-Cooper C.L. Genetic interaction of PGE2 and Wnt signaling regulates developmental specification of stem cells and regeneration. Cell. 2009;136:1136–1147. doi: 10.1016/j.cell.2009.01.015. [DOI] [PMC free article] [PubMed] [Google Scholar]
- 18.Guerra C., Koza R.A., Yamashita H., Walsh K., Kozak L.P. Emergence of brown adipocytes in white fat in mice is under genetic control. Effects on body weight and adiposity. Journal of Clinical Investigation. 1998;102:412–420. doi: 10.1172/JCI3155. [DOI] [PMC free article] [PubMed] [Google Scholar]
- 19.Habegger K.M., Matzke D., Ottaway N., Hembree J., Holland J., Raver C. Role of adipose and hepatic atypical protein kinase C lambda (PKClambda) in the development of obesity and glucose intolerance. Adipocyte. 2012;1:203–214. doi: 10.4161/adip.20891. [DOI] [PMC free article] [PubMed] [Google Scholar]
- 20.Harms M., Seale P. Brown and beige fat: development, function and therapeutic potential. Nature Medicine. 2013;19:1252–1263. doi: 10.1038/nm.3361. [DOI] [PubMed] [Google Scholar]
- 21.He W., Barak Y., Hevener A., Olson P., Liao D., Le J. Adipose-specific peroxisome proliferator-activated receptor gamma knockout causes insulin resistance in fat and liver but not in muscle. Proceedings of the National Academy of Sciences USA. 2003;100:15712–15717. doi: 10.1073/pnas.2536828100. [DOI] [PMC free article] [PubMed] [Google Scholar]
- 22.Himms-Hagen J., Melnyk A., Zingaretti M.C., Ceresi E., Barbatelli G., Cinti S. Multilocular fat cells in WAT of CL-316243-treated rats derive directly from white adipocytes. American Journal of Physiology - Cell Physiology. 2000;279:C670–C681. doi: 10.1152/ajpcell.2000.279.3.C670. [DOI] [PubMed] [Google Scholar]
- 23.Ikeda K., Maretich P., Kajimura S. The common and distinct features of Brown and beige adipocytes. Trends in Endocrinology and Metabolism. 2018;29(3):191–200. doi: 10.1016/j.tem.2018.01.001. [DOI] [PMC free article] [PubMed] [Google Scholar]
- 24.Inagaki T., Sakai J., Kajimura S. Transcriptional and epigenetic control of brown and beige adipose cell fate and function. Nature Reviews Molecular Cell Biology. 2016;17:480–495. doi: 10.1038/nrm.2016.62. [DOI] [PMC free article] [PubMed] [Google Scholar]
- 25.Jeffery E., Berry R., Church C.D., Yu S., Shook B.A., Horsley V. Characterization of Cre recombinase models for the study of adipose tissue. Adipocyte. 2014;3:206–211. doi: 10.4161/adip.29674. [DOI] [PMC free article] [PubMed] [Google Scholar]
- 26.Jin W., Takagi T., Kanesashi S.N., Kurahashi T., Nomura T., Harada J. Schnurri-2 controls BMP-dependent adipogenesis via interaction with Smad proteins. Developmental Cell. 2006;10:461–471. doi: 10.1016/j.devcel.2006.02.016. [DOI] [PubMed] [Google Scholar]
- 27.Koncarevic A., Kajimura S., Cornwall-Brady M., Andreucci A., Pullen A., Sako D. A novel therapeutic approach to treating obesity through modulation of TGFbeta signaling. Endocrinology. 2012;153:3133–3146. doi: 10.1210/en.2012-1016. [DOI] [PMC free article] [PubMed] [Google Scholar]
- 28.Kusminski C.M., Bickel P.E., Scherer P.E. Targeting adipose tissue in the treatment of obesity-associated diabetes. Nature Reviews Drug Discovery. 2016;15:639–660. doi: 10.1038/nrd.2016.75. [DOI] [PubMed] [Google Scholar]
- 29.Larsson J., Blank U., Helgadottir H., Bjornsson J.M., Ehinger M., Goumans M.J. TGF-beta signaling-deficient hematopoietic stem cells have normal self-renewal and regenerative ability in vivo despite increased proliferative capacity in vitro. Blood. 2003;102:3129–3135. doi: 10.1182/blood-2003-04-1300. [DOI] [PubMed] [Google Scholar]
- 30.Lee K.Y., Russell S.J., Ussar S., Boucher J., Vernochet C., Mori M.A. Lessons on conditional gene targeting in mouse adipose tissue. Diabetes. 2013;62:864–874. doi: 10.2337/db12-1089. [DOI] [PMC free article] [PubMed] [Google Scholar]
- 31.Lee Y.H., Petkova A.P., Konkar A.A., Granneman J.G. Cellular origins of cold-induced brown adipocytes in adult mice. FASEB Journal. 2015;29:286–299. doi: 10.1096/fj.14-263038. [DOI] [PMC free article] [PubMed] [Google Scholar]
- 32.Lee Y.H., Petkova A.P., Mottillo E.P., Granneman J.G. In vivo identification of bipotential adipocyte progenitors recruited by beta3-adrenoceptor activation and high-fat feeding. Cell Metabolism. 2012;15:480–491. doi: 10.1016/j.cmet.2012.03.009. [DOI] [PMC free article] [PubMed] [Google Scholar]
- 33.Lidell M.E., Betz M.J., Dahlqvist Leinhard O., Heglind M., Elander L., Slawik M. Evidence for two types of brown adipose tissue in humans. Nature Medicine. 2013;19:631–634. doi: 10.1038/nm.3017. [DOI] [PubMed] [Google Scholar]
- 34.Lidell M.E., Betz M.J., Enerback S. Two types of brown adipose tissue in humans. Adipocyte. 2014;3:63–66. doi: 10.4161/adip.26896. [DOI] [PMC free article] [PubMed] [Google Scholar]
- 35.Madsen L., Pedersen L.M., Lillefosse H.H., Fjaere E., Bronstad I., Hao Q. UCP1 induction during recruitment of brown adipocytes in white adipose tissue is dependent on cyclooxygenase activity. PLoS One. 2010;5 doi: 10.1371/journal.pone.0011391. [DOI] [PMC free article] [PubMed] [Google Scholar]
- 36.Massague J. TGFbeta signalling in context. Nature Reviews Molecular Cell Biology. 2012;13:616–630. doi: 10.1038/nrm3434. [DOI] [PMC free article] [PubMed] [Google Scholar]
- 37.Miller C.N., Yang J.Y., England E., Yin A., Baile C.A., Rayalam S. Isoproterenol increases uncoupling, glycolysis, and markers of Beiging in mature 3T3-L1 adipocytes. PLoS One. 2015;10 doi: 10.1371/journal.pone.0138344. e0138344. [DOI] [PMC free article] [PubMed] [Google Scholar]
- 38.Nedergaard J., Bengtsson T., Cannon B. Unexpected evidence for active brown adipose tissue in adult humans. American Journal of Physiology. Endocrinology and Metabolism. 2007;293:E444–E452. doi: 10.1152/ajpendo.00691.2006. [DOI] [PubMed] [Google Scholar]
- 39.Nedergaard J., Cannon B. The changed metabolic world with human brown adipose tissue: therapeutic visions. Cell Metabolism. 2010;11:268–272. doi: 10.1016/j.cmet.2010.03.007. [DOI] [PubMed] [Google Scholar]
- 40.Nedergaard J., Cannon B. The browning of white adipose tissue: some burning issues. Cell Metabolism. 2014;20:396–407. doi: 10.1016/j.cmet.2014.07.005. [DOI] [PubMed] [Google Scholar]
- 41.North T.E., Goessling W., Walkley C.R., Lengerke C., Kopani K.R., Lord A.M. Prostaglandin E2 regulates vertebrate haematopoietic stem cell homeostasis. Nature. 2007;447:1007–1011. doi: 10.1038/nature05883. [DOI] [PMC free article] [PubMed] [Google Scholar]
- 42.Ohno H., Shinoda K., Spiegelman B.M., Kajimura S. PPARgamma agonists induce a white-to-brown fat conversion through stabilization of PRDM16 protein. Cell Metabolism. 2012;15:395–404. doi: 10.1016/j.cmet.2012.01.019. [DOI] [PMC free article] [PubMed] [Google Scholar]
- 43.Petrovic N., Walden T.B., Shabalina I.G., Timmons J.A., Cannon B., Nedergaard J. Chronic peroxisome proliferator-activated receptor gamma (PPARgamma) activation of epididymally derived white adipocyte cultures reveals a population of thermogenically competent, UCP1-containing adipocytes molecularly distinct from classic brown adipocytes. Journal of Biological Chemistry. 2010;285:7153–7164. doi: 10.1074/jbc.M109.053942. [DOI] [PMC free article] [PubMed] [Google Scholar]
- 44.Qian S.W., Tang Y., Li X., Liu Y., Zhang Y.Y., Huang H.Y. BMP4-mediated brown fat-like changes in white adipose tissue alter glucose and energy homeostasis. Proceedings of the National Academy of Sciences USA. 2013;110:E798–E807. doi: 10.1073/pnas.1215236110. [DOI] [PMC free article] [PubMed] [Google Scholar]
- 45.Rodeheffer M.S., Birsoy K., Friedman J.M. Identification of white adipocyte progenitor cells in vivo. Cell. 2008;135:240–249. doi: 10.1016/j.cell.2008.09.036. [DOI] [PubMed] [Google Scholar]
- 46.Rosen E.D., Spiegelman B.M. What we talk about when we talk about fat. Cell. 2014;156:20–44. doi: 10.1016/j.cell.2013.12.012. [DOI] [PMC free article] [PubMed] [Google Scholar]
- 47.Rosenwald M., Perdikari A., Rulicke T., Wolfrum C. Bi-directional interconversion of brite and white adipocytes. Nature Cell Biology. 2013;15:659–667. doi: 10.1038/ncb2740. [DOI] [PubMed] [Google Scholar]
- 48.Schulz T.J., Huang P., Huang T.L., Xue R., McDougall L.E., Townsend K.L. Brown-fat paucity due to impaired BMP signalling induces compensatory browning of white fat. Nature. 2013;495:379–383. doi: 10.1038/nature11943. [DOI] [PMC free article] [PubMed] [Google Scholar]
- 49.Schulz T.J., Huang T.L., Tran T.T., Zhang H., Townsend K.L., Shadrach J.L. Identification of inducible brown adipocyte progenitors residing in skeletal muscle and white fat. Proceedings of the National Academy of Sciences USA. 2011;108:143–148. doi: 10.1073/pnas.1010929108. [DOI] [PMC free article] [PubMed] [Google Scholar]
- 50.Seale P., Conroe H.M., Estall J., Kajimura S., Frontini A., Ishibashi J. Prdm16 determines the thermogenic program of subcutaneous white adipose tissue in mice. Journal of Clinical Investigation. 2011;121:96–105. doi: 10.1172/JCI44271. [DOI] [PMC free article] [PubMed] [Google Scholar]
- 51.Shan T., Liu W., Kuang S. Fatty acid binding protein 4 expression marks a population of adipocyte progenitors in white and brown adipose tissues. FASEB Journal. 2013;27:277–287. doi: 10.1096/fj.12-211516. [DOI] [PMC free article] [PubMed] [Google Scholar]
- 52.Shepherd P.R., Gnudi L., Tozzo E., Yang H., Leach F., Kahn B.B. Adipose cell hyperplasia and enhanced glucose disposal in transgenic mice overexpressing GLUT4 selectively in adipose tissue. Journal of Biological Chemistry. 1993;268:22243–22246. [PubMed] [Google Scholar]
- 53.Sun K., Kusminski C.M., Scherer P.E. Adipose tissue remodeling and obesity. Journal of Clinical Investigation. 2011;121:2094–2101. doi: 10.1172/JCI45887. [DOI] [PMC free article] [PubMed] [Google Scholar]
- 54.Tseng Y.H., Cypess A.M., Kahn C.R. Cellular bioenergetics as a target for obesity therapy. Nature Reviews Drug Discovery. 2010;9:465–482. doi: 10.1038/nrd3138. [DOI] [PMC free article] [PubMed] [Google Scholar]
- 55.Tseng Y.H., Kokkotou E., Schulz T.J., Huang T.L., Winnay J.N., Taniguchi C.M. New role of bone morphogenetic protein 7 in brown adipogenesis and energy expenditure. Nature. 2008;454:1000–1004. doi: 10.1038/nature07221. [DOI] [PMC free article] [PubMed] [Google Scholar]
- 56.Vegiopoulos A., Muller-Decker K., Strzoda D., Schmitt I., Chichelnitskiy E., Ostertag A. Cyclooxygenase-2 controls energy homeostasis in mice by de novo recruitment of brown adipocytes. Science. 2010;328:1158–1161. doi: 10.1126/science.1186034. [DOI] [PubMed] [Google Scholar]
- 57.Walden T.B., Hansen I.R., Timmons J.A., Cannon B., Nedergaard J. Recruited vs. nonrecruited molecular signatures of brown, "brite," and white adipose tissues. American Journal of Physiology. Endocrinology and Metabolism. 2012;302:E19–E31. doi: 10.1152/ajpendo.00249.2011. [DOI] [PubMed] [Google Scholar]
- 58.Wang Q.A., Tao C., Gupta R.K., Scherer P.E. Tracking adipogenesis during white adipose tissue development, expansion and regeneration. Nature Medicine. 2013;19:1338–1344. doi: 10.1038/nm.3324. [DOI] [PMC free article] [PubMed] [Google Scholar]
- 59.Wang Z.V., Deng Y., Wang Q.A., Sun K., Scherer P.E. Identification and characterization of a promoter cassette conferring adipocyte-specific gene expression. Endocrinology. 2010;151:2933–2939. doi: 10.1210/en.2010-0136. [DOI] [PMC free article] [PubMed] [Google Scholar]
- 60.Whittle A.J., Carobbio S., Martins L., Slawik M., Hondares E., Vazquez M.J. BMP8B increases brown adipose tissue thermogenesis through both central and peripheral actions. Cell. 2012;149:871–885. doi: 10.1016/j.cell.2012.02.066. [DOI] [PMC free article] [PubMed] [Google Scholar]
- 61.Wu J., Bostrom P., Sparks L.M., Ye L., Choi J.H., Giang A.H. Beige adipocytes are a distinct type of thermogenic fat cell in mouse and human. Cell. 2012;150:366–376. doi: 10.1016/j.cell.2012.05.016. [DOI] [PMC free article] [PubMed] [Google Scholar]
- 62.Xue B., Rim J.S., Hogan J.C., Coulter A.A., Koza R.A., Kozak L.P. Genetic variability affects the development of brown adipocytes in white fat but not in interscapular brown fat. The Journal of Lipid Research. 2007;48:41–51. doi: 10.1194/jlr.M600287-JLR200. [DOI] [PubMed] [Google Scholar]
- 63.Yadav H., Quijano C., Kamaraju A.K., Gavrilova O., Malek R., Chen W. Protection from obesity and diabetes by blockade of TGF-beta/Smad3 signaling. Cell Metabolism. 2011;14:67–79. doi: 10.1016/j.cmet.2011.04.013. [DOI] [PMC free article] [PubMed] [Google Scholar]
- 64.Zhang C., McFarlane C., Lokireddy S., Masuda S., Ge X., Gluckman P.D. Inhibition of myostatin protects against diet-induced obesity by enhancing fatty acid oxidation and promoting a brown adipose phenotype in mice. Diabetologia. 2012;55:183–193. doi: 10.1007/s00125-011-2304-4. [DOI] [PubMed] [Google Scholar]
Associated Data
This section collects any data citations, data availability statements, or supplementary materials included in this article.
Supplementary Materials
Multimedia component 1
Multimedia component 2
Multimedia component 3
Multimedia component 4
Multimedia component 5
Multimedia component 6