CRISPR Activation Screens Systematically Identify Factors that Drive Neuronal Fate and Reprogramming (original) (raw)
. Author manuscript; available in PMC: 2019 Nov 1.
Published in final edited form as: Cell Stem Cell. 2018 Oct 11;23(5):758–771.e8. doi: 10.1016/j.stem.2018.09.003
SUMMARY
Comprehensive identification of factors that can specify neuronal fate could provide valuable insights into lineage specification and reprogramming, but systematic interrogation of transcription factors, and their interactions with each other, has proven technically challenging. We developed a CRISPR activation (CRISPRa) approach to systematically identify regulators of neuronal fate specification. We activated expression of all endogenous transcription factors and other regulators via a pooled CRISPRa screen in embryonic stem cells, revealing genes including epigenetic regulators such as Ezh2 that can induce neuronal fate. Systematic CRISPR-based activation of factor pairs allowed us to generate a genetic interaction map for neuronal differentiation, with confirmation of top individual and combinatorial hits as bona fide inducers of neuronal fate. Several factor pairs could directly reprogram fibroblasts into neurons, which shared similar transcriptional programs with endogenous neurons. This study provides an unbiased discovery approach for systematic identification of genes that drive cell fate acquisition.
eTOC
Liu and colleagues developed a high-throughput CRISPR activation screening approach to systematically identify transcription factors that efficiently promote neuronal fate from ESCs. Some of these single and pairwise factors can further reprogram fibroblasts into neurons, showing that this approach may have broad utility for engineering cell lineages.
Graphical Title

INTRODUCTION
Cell identity is established through the activity of core transcription factors and other regulators (Takahashi and Yamanaka, 2006; Vierbuchen et al., 2010; Xu et al., 2015). It has remained a challenge to systematically profile how genetic drivers determine cell lineage phenotypes, which is critical to interrogate the regulatory network of cell fate. Approaches that allow us to determine casual contributions of individual factors and their interactions to cell fate on a large-scale will greatly advance our understanding of cell identity regulation and facilitate rational engineering of clinically useful cell types.
Systematic profiling of gene-cell fate relationship has relied on comparative genome- wide gene expression analyses across multiple cell types (Cahan et al., 2014; D’Alessio et al., 2015; Heinäniemi et al., 2013). These approaches provide valuable information but cannot establish causality between genes and phenotypes. Small-scale ectopic overexpression of genes that are specifically expressed in desired tissues, or implicated with important roles in relevant developmental processes, is often used to define factors for inducing a desired cell identity. While factor combinations that induce a given cell fate have been identified through trial and error (Takahashi and Yamanaka, 2006; Tsunemoto et al., 2018; Vierbuchen et al., 2010), this approach cannot provide a systematic understanding of how the whole set of transcription factors and other DNA- binding factors contribute to cell fate determination.
CRISPR activation (CRISPRa)-based gain-of-function perturbation offers a powerful approach to activate genes on a large-scale in a pooled manner (Black et al., 2016; Chavez et al., 2015; Gilbert et al., 2014; Gilbert et al., 2013; Konermann et al., 2015; Mali et al., 2013). While screens based on CRISPR-Cas9 gene knockout or CRISPRi/a transcriptional repression/activation have been demonstrated, no CRISPR-based screen has been used to establish a causal relationship between gene expression and cell fate determination (Koike-Yusa et al., 2014; Parnas et al., 2015; Shalem et al., 2014; Wang et al., 2014).
Here we developed a CRISPRa approach to profile the contribution of transcription factors and other DNA-binding factors to cell fate, both individually and in combination. We used serial pooled CRISPR activation screens to first generate an individual factor map, and then a factor genetic interaction (GI) map for genes that promote neuronal differentiation. These maps revealed many factors that previously have been unknown to promote neuronal differentiation. We validated the top factor hits, both when activated alone and in combination, by assessing their neuronal-promoting capacities. Importantly, several discovered factor pairs efficiently induced neuron formation from fibroblasts, including a novel combination of Ezh2 and Mecom. The function of the induced neurons was confirmed by electrophysiology. We performed a large set of whole-genome RNA sequencing (RNA-seq) and found that the differentiated and directly reprogrammed neurons shared very similar transcriptional profiles to endogenous neurons. Our study provides an approach to systematically discover lineage-promoting factors, offering a useful method to study gene functions related to cell fate determination.
RESULTS
Establishing an Efficient CRISPRa System in Mouse Embryonic Stem Cells to Study Differentiation
To enable systematic evaluation of whether individual factors promote neuronal fate, we first generated a stable mouse embryonic stem (ES) cell line that could express CRISPRa components after Doxycycline (Dox) induction. We transduced lentiviral vectors that expressed Streptococcus pyogenes nuclease-dead Cas9 (dCas9) fused to the polypeptide SunTag system into E14 ES cells (Tanenbaum et al., 2014), and generated a clonal CRISPRa cell line (named CRISPR-activating mouse ES, or CamES) (Figures S1A).
We verified that CamES cells expressed the pluripotency gene Oct4 (Figure S1B) and could efficiently activate previously silenced endogenous genes using single sgRNAs (Figure S1C). We next tested if a single sgRNA could induce neuronal differentiation in CamES cells. Using a single sgRNA targeting known neuronal-promoting factors Ascl1 or Ngn2, we observed robust induction of neurons on day 12 (Figure S1D). These differentiated neurons were Tuj1 and Map2 positive, same as the neurons generated by overexpression of Ascl1 cDNA in ES cells (Figure S1D). All negative controls showed no neuronal morphology or gene expression (Figure S1E), confirming that neurons were indeed induced by CRISPRa-mediated target gene activation. We also observed similar differentiation kinetics of neuronal differentiation when comparing the sgAscl1 in CamES cells and Ascl1 cDNA overexpression in ES cells (Figure S1F).
To facilitate isolation of differentiated neuronal cells, we further inserted a human CD8 (hCD8) gene downstream of endogenous Tubb3 in the CamES cells (Figure S1G). We verified the Tubb3-hCD8 knockin CamES cells allowed enrichment of Tuj1 (Tubb3)+ cells: after 12 days differentiation of CamES using CRISPRa to activate Ascl1, a hCD8+ cell population enriched by magnetic activated cell sorting (MACS) highly expressed neuronal markers Tuj1 and Map2 (Figure S1H). The Tubb3-hCD8 CamES cells were used for both individual and combinatorial CRISPRa screens.
Genome-Wide Profiling of Transcription Factors and Other Regulators that Promote Neuronal Fate
We created a sgRNA library (containing 55,561 sgRNAs) that targeted all computationally predicted transcription factors (TFs) and other DNA-binding factors from the Transcription Factor Database TRANSFAC (total number = 2,428) (Wingender et al., 1996). sgRNAs targeting Ascl1 and Ngn2 were manually excluded, as we were concerned that including them might drown out signals from novel factors. The library also contained thousands of non-targeting sgRNAs as negative controls (Figure 1A).
Figure 1. Systematic evaluation of transcription factors’ and other regulators’ contribution to neuronal-fate acquisition.
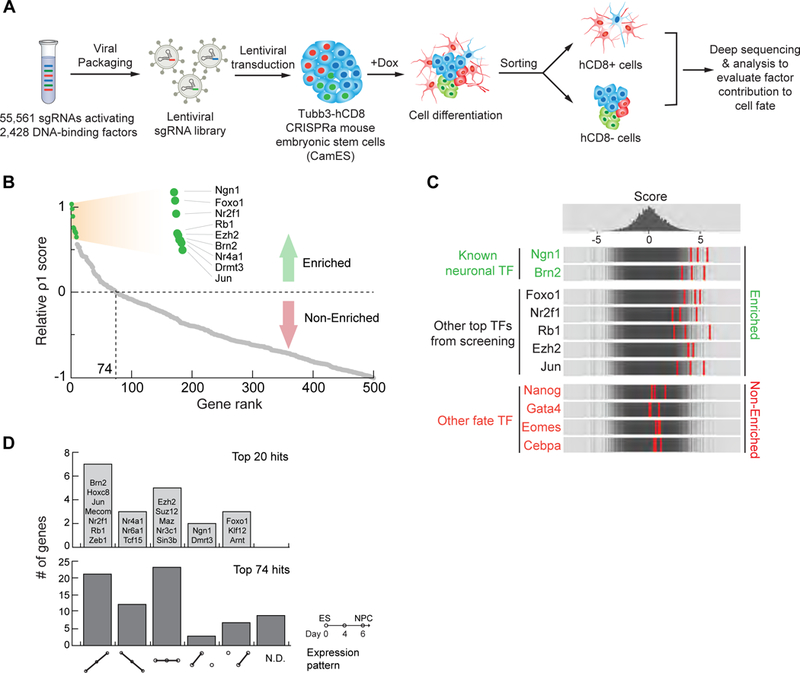
(A) Schematic representation of our CRISPRa gain-of-function screens to systematically evaluate factors contributing to neuronal differentiation. (B) A map of the contribution of the top 500 factor hits to neuronal fate according to the calculated ρ1 score. The top 9 hits are shown in green. The top 74 hits showed enrichment for neuronal differentiation. (C) Frequency histograms of the negative control guides (top), and the top 3 enriched sgRNAs for indicated factors. (D) Analysis of factor expression pattern during neuronal differentiation for the top 20 and top 74 hits according to RNA- seq (W.H.W.: unpublished data). Six categories are considered: up, down, no change, up-and-down, down-and-up, and no data (N.D.). See also Figures S1, S2, and Table S1.
We transduced the sgRNA library into CamES cells, induced CRISPRa activity and differentiation (Figure 1A and S2A). After 12 days, the cell population showed expression of neuronal markers Tuj1 and Map2 (Figure S2B). We performed MACS to sort hCD8+ and hCD8- populations, followed by next-generation sequencing (NGS) to characterize the sgRNA presentation in each population (Figures S2C and S2D).
Unlike cell viability/fitness screens that directly compare sgRNA presentation in final and initial populations (Chen et al., 2015; Konermann et al., 2015), we developed an algorithm that accounted for the probabilistic contribution of each factor to neuronal differentiation (Figure S2E). We defined a numerical cell-fate contribution score (ρ1), calculated by the relative enrichment of the top 3 sgRNAs for each gene when comparing the Tubb3-hCD8+ and Tubb3-hCD8- populations. The ρ1 score is an enrichment score that represents the probability that one cell becomes a neuron in the presence of the a gene-perturbing guide relative to the negative control guides: a higher ρ1 score represents a greater chance that this factor could induce neuronal fate. Using ρ1=0 as a cutoff value, we identified 74 factors that positively contributed to neuronal fate (Figure 1B and Table S1). Within this 74-factor list, we observed many factors that were known to induce neuronal fate. In contrast, other genes that were known to be important for alterative fates (pluripotency, mesoderm, and endoderm) were not enriched (Figure 1C, and Table S1).
Notably, our CRISPRa screening strategy identified potential neuronal-promoting genes that were not biased towards differentially expressed genes (Figure 1D): among the top 20 and 74 hits, 7 and 41 genes respectively showed no differential expression between neurons and ES cells. This likely suggests that CRISPRa screening is a more systematic unbiased approach to identify genes that could promote a certain cell fate formation compared to the gene expression profiling approach.
Validating Hit Genes that Promote Neuronal Differentiation
To validate whether the hit genes induced neuronal phenotype, and for simplicity of analyses and manageability of experimental validation, we focused on the top 20 factors as the core factors for validation. For each factor, we cloned the most enriched sgRNA, and measured their effects for inducing neuronal differentiation by staining Map2 (Figure 2A), Tuj1 and NeuN (Figure S2F). Nineteen out of 20 factors showed distinct neuronal marker expression (Figures 2A and2B). To further confirm the discovered hits and rule out off-target effects, we transduced lentiviral vectors that expressed the cDNA of each of the top 14 genes in E14 ES cells and observed similar neuronal induction (Figure 2C).
Figure 2. Top hits are validated to drive neuronal differentiation.
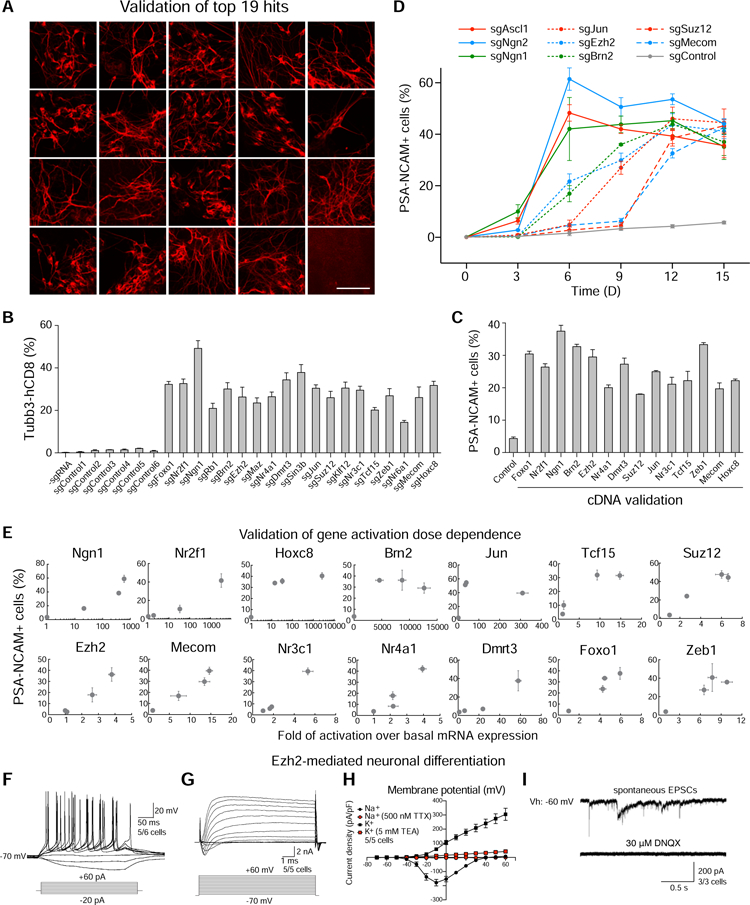
(A) Validation of 19 top hits for neuronal differentiation. Microscopic images of Map2- stained neurons transduced with individual sgRNAs for 19 top hits and a negative control sgRNA in CamES cells after 12-day differentiation. Scale bar, 100 µm. (B) Validation of 19 top hits using Tubb3-hCD8+ expression. Tubb3-hCD8 expression was assayed on day 12 by flow cytometry. (C) Validation of 14 top hits for neuronal differentiation by cDNA overexpression. Quantification of PSA-NCAM+ neurons was assayed on day 12 by flow cytometry. (D) Differentiation kinetics of CamES cells transduced with individual hit sgRNAs or a negative control sgRNA. PSA-NCAM percentages were quantified by flow cytometry at different time points with Dox addition. (E) A quantitative map between neuronal differentiation (phenotype) and gene activation (genotype). PSA-NCAM percentage of cells induced by three individual sgRNAs for each gene and a negative control sgRNA were measured by flow cytometry. The mRNA expression was measured by real-time quantitative PCR, and fold change was calculated by normalizing to the expression level of cells containing a negative control sgRNA. (B–E) Error bars, s.d. ± the mean of three biological replicates. (F–I) Electrophysiological properties of Ezh2-differentiated neurons. (F) Representative traces showing action potentials elicited. Step current injection protocols were used from −20 to +60 pA at 10-pA intervals (lower panel). (G) Representative traces of whole- cell currents in voltage-clamp mode; cells were held at −80 mV. Step depolarization from −70 mV to +60 mV at 10-mV intervals was delivered (lower panel). (H) Current density plot of voltage activated currents. The graph shows current density (y-axis, pA/pF) for peak outward (potassium, squares) and inward currents (sodium, circles) plotted against voltage step (x-axis, mV) in the absence (black) and presence of either TEA (red squares) or TTX (red circles). The holding potential was −80mV. (I) Representative traces of evoked EPSCs recorded. Application of DNQX blocked the response of EPSCs (right panel). Cells were recorded at a holding potential (Vh) of −60 mV. Error bars indicate ± SEM of cell counts. See also Figure S2 and S3.
Neuronal-promoting factors may directly induce neuron generation or maintain neuronal survival. To deconvolve these two possibilities for our hits, we quantified the percentage of PSA-NCAM+ neurons for 6 factors (Figure 2D) in a time-course experiment. Among these factors, Ngn1 showed similar neuronal differentiation kinetics as known neuronal- inducing factors Ascl1 and Ngn2, with a high percentage of PSA-NCAM+ cell population appearing at early time points (Figure 2D). This expression pattern was also observed for other neuronal markers (Figure S2G), which together suggested that Ngn1 acts in a manner similar to Ascl1 and Ngn2 by directly inducing neuronal generation. In contrast, Suz12 and Mecom showed much slower neuronal differentiation kinetics with an abrupt increase of PSA-NCAM+ cell population after 9 days. These suggested that Suz12 and Mecom increased the number of neurons likely through the promotion of neuronal survival. Other factors, including Ezh2, Jun, and Brn2, showed intermediate differentiation kinetics, suggesting that their mechanism of action is through both weak neuronal induction and increased neuronal survival (Figure 2D and S2G).
We further investigated the relationship between the efficiency of neuronal differentiation (phenotype) and the activation fold of the factors (genotype). For the above cDNA-validated factors, we tested the 3 most enriched sgRNAs (Figure 2E). Quantitative PCR results showed that different genes exhibited wide dynamic ranges of endogenous gene activation. A majority of genes showed positive correlation between neuronal differentiation and gene activation level (Figure 2E). Using 3 sgRNAs to verify the dosage-dependence of neuronal differentiation further confirmed the observed phenotype was not due to off-target CRISPRa effects.
To validate if our screening approach identifies factors that induce functional neurons, we characterized the electrophysiological functions of neurons induced by CRISPRa- mediated expression of Ezh2 and Ngn1. We observed that differentiated neurons could generate action potentials upon current injection (Figures 2F and S3A). In voltage- clamp mode we observed both fast, inactivating inward and outward currents, which probably correspond to opening of voltage-dependent potassium- (K+-) and sodium- (Na+-) channels, respectively (Figures 2G and S3B). Outward, presumably potassium, currents were inhibited by the addition of tetraethylammonium (TEA), a blocker of voltage-gated K+-channels. Inward, presumably sodium, currents were inhibited by the addition of tetrodotoxin (TTX), a blocker of voltage-gated Na+-channels (Figures 2H and S3C). We also observed and recorded spontaneous excitatory postsynaptic currents (EPSCs) in differentiated neurons. These currents could be blocked by the addition of 6,7-dinitroquinoxaline-2,3-dione (DNQX), an AMPA and kainate receptor antagonist (Figures 2I and S3D). This data demonstrated that functional synapses can be formed with differentiated neurons driven by Ezh2 and Ngn1. Together these validations confirmed the function of the discovered factors for neuronal fate determination.
Generation of a Quantitative Genetic Interaction (GI) Map for Neuronal Fate
The cell identity regulatory network is governed by a combination of core factors. Genetic interaction (GI) mapping between pairs of factors, which indicates how strongly the function of one factor depends on the presence of a second (Adamson et al., 2016; Bassik et al., 2013; Dixit et al., 2016), offers a powerful approach to reveal molecular interactions in a given regulatory network. We sought to systematically profile how pairs of factors contribute to neuronal phenotype.
We developed a combinatorial CRISPRa gene activation strategy to determine the genetic interactions among the top 19 core factors. We generated a library of lentiviral constructs that co-expressed two sgRNAs (Figures 3A and S4A). We included two sgRNAs for each gene that were validated to activate the target gene to high or low levels. The library also included pairs of a targeting sgRNA and a non-targeting sgRNA, which were used to compare effects of combinatorial factors to individual factors.
Figure 3. A genetic interaction (GI) map for core factors contributing to neuronal-fate and validation.
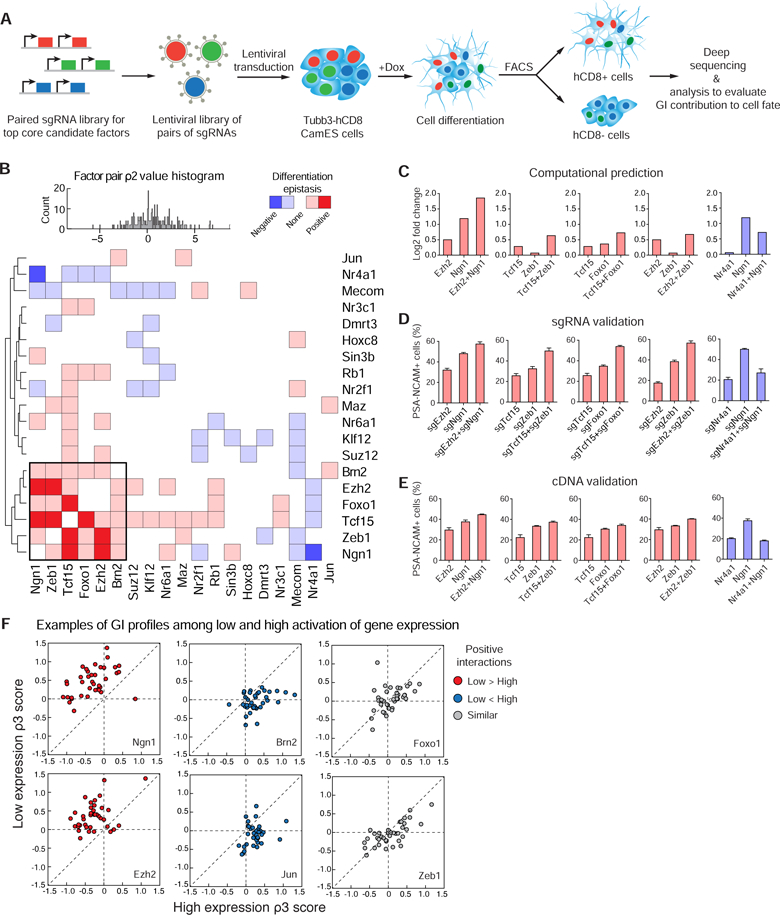
(A) Schematic representation of our double CRISPRa screen to evaluate GIs between factors for their contribution to neuronal differentiation. (B) A GI map of the core factor pairs showing their contribution to neuronal fate according to the computed ρ2 scores, and genes were clustered hierarchically based on the correlation of their GIs. A cluster of factors with mutually positive interactions is highlighted in a black box. A ρ2 histogram for all interactions and color key are shown on the top. (C) For 5 lowest local FDR GIs, average log2 fold changes are plotted for the selected genes against negative control guides and the corresponding gene pairs. (D) Validation of 4 top positive GIs and 1 negative GI for neuronal differentiation by sgRNAs. Quantification of PSA-NCAM+ neurons was measured on day 12 by flow cytometry. Error bars, s.d. ± the mean of three biological replicates. (E) Validation of 4 top positive GIs and 1 negative GI for neuronal differentiation by cDNAs. Quantification of PSA-NCAM+ neurons was measured by flow cytometry on day 12 of single or double cDNAs in ES cells. Error bars, s.d. ± the mean of three biological replicates. (F) Scatter plots of the ρ3 score for low expression sgRNAs and high expression sgRNAs of factors paired with the same common sgRNAs. For each dot, its coordinate on horizontal axis represent the ρ3 score (guide interaction) of GI between this gene’s high-expression sgRNA and an independent sgRNA. Its coordinate on vertical axis represent the ρ3 score of GI between this gene’s low-expression sgRNA and the same independent sgRNA. Red, low expression showing more positive GIs; blue, high expression showing more positive GIs; grey, low and high expression showing similar GIs. The dashed line indicates the expectation under no effect of a gene’s expression level on GIs with other genes. See also Figure S4.
We transduced the double sgRNA library into CamES cells, added Dox to induce differentiation, sorted Tubb3-hCD8 positive and negative populations by FACS, and characterized the double sgRNA presentation in each population (Figure 3A). We observed a high correlation score (R = 0.902) between two independent experimental replicates (Figure S4B).
To quantify pairwise interactions of factors relative to individual factors for neuronal induction, we generated quantitative interaction scores (defined as ρ2 and ρ3 scores) for each factor pair (Figure 3B). The gene-level interaction score ρ2 was computed under the assumption that a single factor of the pair likely drives the majority of the cells to differentiate towards neurons. This assumption was validated by examining the empirical distribution of interaction scores (Figure 3B, histogram) and verifying that it was centered at zero, corresponding to no interaction. The guide-level interaction score ρ3 was computed after subtracting off gene level interactions and pooling information by putting a standard normal prior on the expected interactions (Figure S4G).
Hierarchical clustering of factors based on the correlation of their interactions revealed that a number of factors formed positive or negative interactions for neuronal differentiation. Deviations toward the neuronal fate relative to the individual factors were defined as positive GIs, and deviations away from the neuronal fate were defined as negative GIs. Interestingly, a core cluster of 6 genes (Ngn1, Zeb1, Tcf15, Foxo1, Ezh2, Brn2) showed mutually positive effects (Figure 3B). Meanwhile, a few combinations of factors appeared to negate their function as neuronal-fate inducers, for example, co- expression of Nr4a1 and Ngn1 reduced neuronal differentiation.
To validate these pairs, we first calculated the local false discovery rate (FDR) for each interaction (Efron, 2012), and then chose 5 interactions that showed the lowest local FDR for experimental validation. Computational analysis of the 4 positive interactions showed additive effects for the pairwise factors compared to individual factors (Figure 3C), while one interaction showed a negative effect (Figure 3C). We generated sgRNA constructs that activated individual or both factors, transduced them into CamES cells, and characterized neuronal differentiation by PSA-NCAM staining (Figure 3D). In parallel, we also transduced lentiviral vectors that expressed the cDNA of these genes in ES cells (Figure 3E). Both methods confirmed the double CRISPRa profiling experimental results and the computed positive and negative interactions between these factor pairs.
We then tested if differentiated cells exhibited neuronal functions, using Ezh2+Ngn1 cells as an example. Electrophysiological properties such as eliciting action potential, recording inward and outward currents, and firing spontaneous EPSCs demonstrated that differentiated neurons were functional (Figure S4C–F). Together these results demonstrated that the combinatorial CRISPRa screens could be used to reveal GIs for cell fate determination.
Interestingly, our approach also revealed that GI profiles for neuronal fate determination could be dependent on the quantitative expression level of factors (Figures 3F and S4G). Our combinatorial CRISPRa approach has a unique feature that each gene is activated by different sgRNAs to high or low levels, which allows us to characterize how high or low expression of one factor interacts with another factor. GI profiles revealed genes could have different interactions when highly or lowly expressed (Figures 3F and S4G). For example, high expression of Ngn1 or Ezh2 formed weaker interactions with most other factors, likely because their high expression level already induced saturated neuronal differentiation, making their function less dependent on another factor (Figures 3F and S4G). On the other hand, high expression of Brn2 or Jun showed more interactions compared to their low expression, likely because these genes are limiting factors for neuronal differentiation (Figures 3F and S4G). These results provided evidence that the type (positive or negative) and intensity of GIs could be dependent on gene expression levels. Different from the cDNA approach, the CRISPRa screening strategy provides a useful strategy to characterize the relationship between GI and quantitative gene expression levels.
Characterization of Differentiated Neurons using Transcriptome Profiling
To better identify the characteristics of neurons generated by hit factors, we analyzed their transcriptomes using RNA-seq. We chose four single hit factors (Jun, Ngn1, Ezh2, and Suz12) and one combination (Ezh2+Ngn1), using Ascl1 and Ngn2 as positive controls. RNA-seq analysis revealed the differentiated neurons possessed a core neuronal transcriptional program (Figure 4A): the gene ontology (GO) terms associated with neuronal development were highly enriched in commonly expressed genes (Figure 4B), while genes associated with the cell cycle were highly down-regulated (Figure 4C).
Figure 4. Transcriptional and subtype specification analysis of differentiated neurons driven by identified factors.
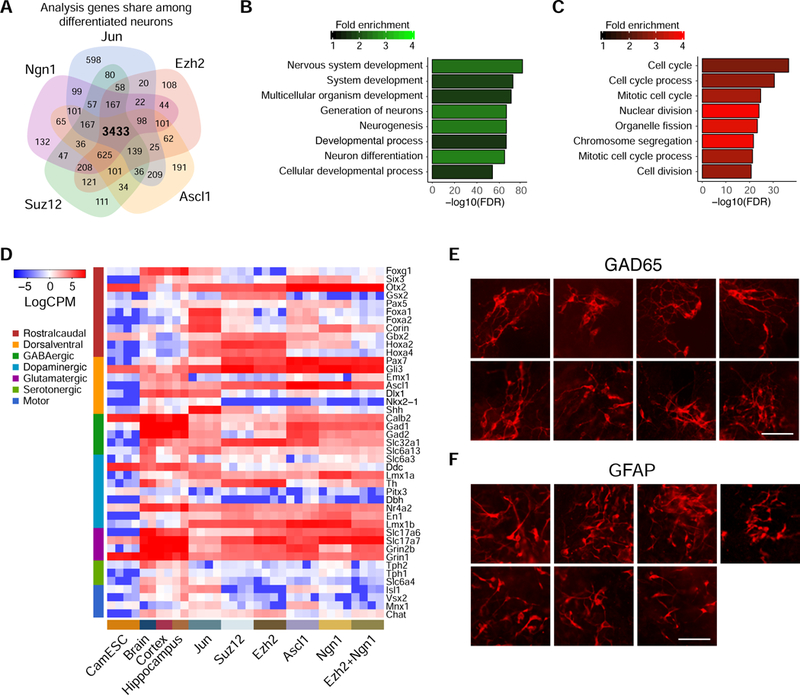
(A) Venn diagram of the differentially up-regulated genes (Bonferroni corrected p < 0.01) for the neurons driven by identified factors. (B) Top enriched GO terms for the genes commonly up-regulated in neuron samples derived by 4 identified factors (Ngn1, Jun, Ezh2, and Suz12) and a positive control factor (Ascl1). (C) Top enriched GO terms for the genes commonly down-regulated in neuron samples derived by 4 identified factors (Ngn1, Jun, Ezh2, and Suz12) and a positive control factor (Ascl1). (D) Expression in normalized log count per million (CPM) in the day-12 differentiated CamES cells transduced with individual sgRNAs targeting indicated factors and somatic samples for neuronal regional and subtype specific genes. (E–F) Staining of GAD65 (E) or GFAP (F) in day-12 differentiated CamES cells transduced with individual sgRNAs targeting identified factors. Scale bar, 100 µm. See also Figure S5.
We sought to find why Ezh2, a global epigenetic regulator and a core component of PRC2 complex, promoted neuronal differentiation. To explore this finding, we focused on genes that expressed specifically in the Ezh2-induced cells (Figure S5A). Compared to Ascl1- or Ngn1-induced neurons, genes related to the development of endodermal and mesodermal lineages were significantly downregulated in Ezh2-induced neurons (Figure S5A). These results may suggest that Ezh2 could enhance neuronal differentiation partly through the inhibition of alternative endodermal and mesodermal lineages. Together, these experiments provided insights into potential roles of the intriguing finding that Ezh2 promotes neuronal generation.
To explore potential regional separation and subtype specification of neurons generated by the identified factors, we next characterized the regional and subtype specific gene expression (Figure 4D and S5B). We compared the RNA-seq data of differentiated neurons to ES cell data and to public available RNA-seq datasets of brain, cortex, and hippocampus samples (Tsunemoto et al., 2018). Overall, our differentiated neurons exhibited a highly similar core transcriptional signature as endogenous neuronal samples (Figure 4D). Diverse subtypes of neurons were generated, and different factors induced different transcriptional signatures. Interestingly, neurons driven by the two PRC2 factors, Ezh2 or Suz12, showed elevated expression of the hindbrain markers, Gbx2, Hoxa2, and Hoxa4. Neurons generated by Jun expressed the floor plate markers, Foxa1, Foxa2, and Corin.
As for subtypes, our RNA-seq results showed that none of the factors we tested induced motor neuron and serotonergic neurons. On the contrary, all factors induced a strong glutamatergic neurons transcriptional program, indicating an excitatory phenotype (Figure 4D). Meanwhile, several factors induced GABAergic neuron-specific genes. This inhibitory phenotype was confirmed by the staining of GAD65, a marker of GABAergic neurons (Figure 4E). Taken together, these results suggested that our identified factors were able to induce distinct regional and subtype specification of neurons.
We also measured several layer markers to assay cortical layer specification (Figure S5B). Ngn1 and Ezh2+Ngn1 neurons had the highest expression level of layer 6 marker Tbr1 among our hits, although its expression was lower than the positive control Ngn2 (Figure S5B).
To examine the potential glial specification, we characterized the expression of glial marker genes in differentiated cells. Two hit factors, Zeb1 and Nr3c1, induced strong GFAP expression (Figures 4F and S5B). Glt-1, another astrocyte marker, was also highly expressed in these cells. In addition, Olig2 and Sox10 were expressed in Zeb1 and Ezh2+Zeb1 cells, which suggested the existence of oligodendrocyte precursors.
To understand the glial specification in more depth, we measured neural stem cell (NSC) markers, as well as astrocyte and oligodendrocyte markers throughout the differentiation process (Figure S5C). Nestin and Pax6, two NSC markers, were upregulated early in all samples and showed a downward trend after day 9. Sox10 expression was greatly increased in Zeb1 cells on day 9, while Zeb1 in combination with Ezh2 induced high Olig2 expression. These data suggested the transient existence of NSCs during differentiation, with sequential glial specification driven by several hit factors.
Validation of Factor Combinations for Neuronal direct reprogramming
We asked whether the identified factor combinations were able to drive direct reprogramming of neurons from fibroblasts, which was a more stringent test of neuronal fate determination (Vierbuchen et al., 2010). We first transduced the top 14 individual factors into mouse embryonic fibroblasts (MEFs), and found only Ngn1 was able to moderately generate Map2+ and Tuj1+ neurons 14 days after infection (Figure 5A and 5B). This suggested individual factors had weak activity for inducing neurons from other somatic cells.
Figure 5. Efficient induction of neurons from fibroblasts using identified factor combinations.
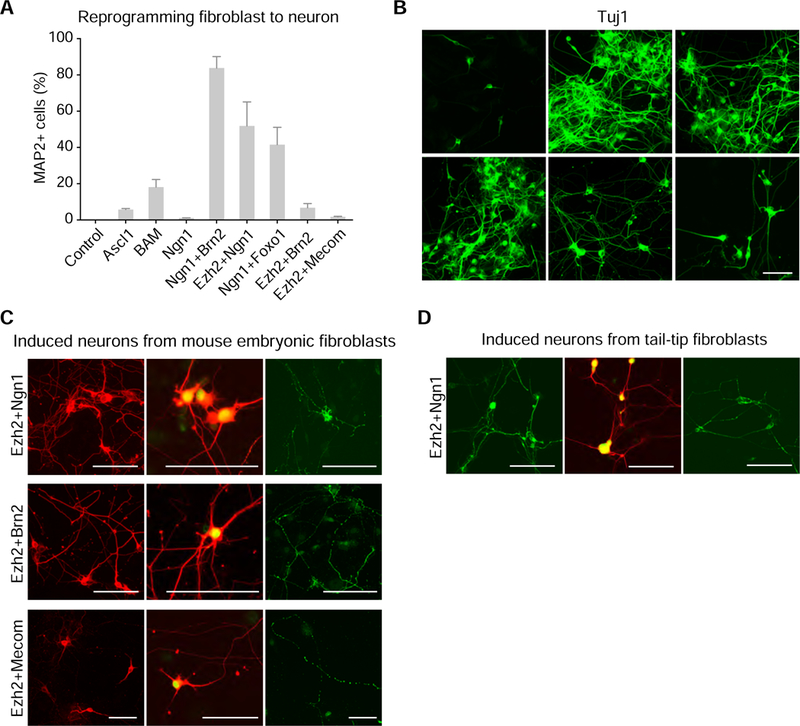
(A) Measurement of neuronal direct reprogramming from mouse embryonic fibroblasts (MEFs) using the individual factors and factor combinations. Quantification of MAP2+ neurons from MEF transduced with individual cDNA or pairwise of cDNAs. Efficiencies are computed by averaging 20 randomly selected visual fields. Error bars, s.d. ± the mean of three biological replicates. (B) Representative microscopic images of stained Tuj1 neurons 14 days after transduction of Ngn1, Ngn1+Brn2, Ezh2+Ngn1, Ngn1+Foxo1, Ezh2+Brn2, or Ezh2+Mecom in MEFs. (C) Microscopic images of staining Map2, Tuj1 (red)/NeuN (green), and Synapsin staining 14 days after transduction of Ezh2+Ngn1, Ezh2+Brn2 or Ezh2+Mecom in MEFs. (D) Microscopic images of staining Map2, Tuj1 (red)/NeuN (green), and Synapsin 26 days after transducing Ezh2+Ngn1 in neonatal tail-tip fibroblast (TTF). Scale bar, 100 µm. See also Figure S6 and S7.
We next validated 15 possible combinations within the cluster of 6 mutually synergistic factors. Notably, four pairs caused significant induction of Map2+ and Tuj1+ neurons from fibroblasts (Figure 5A and 5B): the presence of Brn2, Ezh2, and Foxo1 significantly increased the efficiency of Ngn1 for neuronal direct reprogramming, from 1% to up to 83%. Interestingly, the Ezh2+Brn2 combination also efficiently generated neurons from fibroblasts, whereas either alone could induce neuronal direct reprogramming. Because of the strong synergistic effects between Ezh2 and Brn2, and our previous findings that Ezh2 promoted neuronal differentiation, we were intrigued to test additional Ezh2 combinations in this direct reprogramming context. We found that Ezh2+Mecom also induced neurons from fibroblasts (Figure 5A). Unlike the effects of factor pairs on neuronal differentiation from ES cells, the factor pairs showed non-linear synergistic effects for direct reprogramming. These distinct behaviors may suggest that the underlying regulatory networks between ES cells and fibroblasts present different barriers to neuron generation, and that a higher degree of synergism between driver genes is often required for more stringent cell identity conversion (such as from fibroblast instead of stem cells).
Further staining showed that neurons induced by these combinations expressed other neuronal markers (Figures 5C and S6A). Moreover, we also generated neuronal cells from tail tip fibroblasts using three combinations (Ngn1+Brn2, Ngn1+Ezh2, Ngn1+Foxo1) after 26 days of infection (Figures 5D and S6B). Together, these results demonstrate that our approach is a useful system to discover factor combinations for direct reprogramming and define gene pairs for more efficient cell fate engineering.
To characterize our directly reprogrammed neurons, we analyzed their transcriptomes by RNA-seq. As expected, these neurons shared a core regulatory program with endogenous neuron samples (Tsunemoto et al., 2018; Wapinski et al., 2013; Figure 6A). GO analysis of the core gene cluster showed categories associated with neuronal generation and synaptic transmission were highly enriched (Figures 6B and 6C). Comparison of our directly reprogrammed neurons with the brain samples showed that, similar to neurons generated by Ascl1 expression, our neurons showed a strong glutamatergic profile (Figure 6D). Meanwhile, the Ezh2+Brn2 combination induced neurons with high expression of hindbrain markers, Gbx2, Hoxa2, and Hoxa4. These data suggested that our directly reprogrammed neurons acquired a global transcriptional program that resembles the endogenous neurons with subtype diversification.
Figure 6. Transcriptional analysis of directly reprogrammed neurons driven by factor combinations.
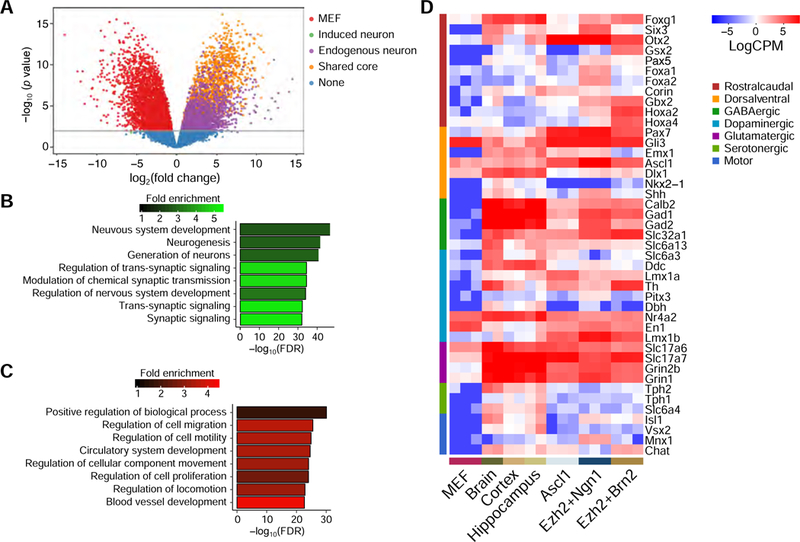
(A) Volcano plot of the log fold change versus minus log10 Bonferonni corrected _p_- values for MEFs vs endogenous neuron. Plotted are the enriched common genes among our trans-differentiated neurons (50.3% of all differentially up-regulated genes in the endogenous neurons and 61.6% of all trans-differentiated up-regulated genes at the 0.01 Bonferrroni corrected level), endogenous specific genes, MEF specific genes, and trans-differentiated neuron specific genes. The line indicates 0.01 Bonferonni corrected FDR level. (B–C) Top enriched GO terms for the genes commonly up-regulated (B) or downregulated (C) in Ascl1-, Ezh2+Ngn1-, and Ezh2+Brn2-directly reprogrammed neurons and endogenous neurons samples. (D) Expression in normalized log count per million (CPM) in the directly reprogrammed cells induced by indicated factors and somatic samples for neuronal regional and subtype specific genes.
To more rigorously characterize these induced neurons derived from fibroblasts, we next examined electrophysiological properties of neurons induced by Ezh2+Ngn1, Ezh2+Mecom, and Ngn1+Brn2. We observed and recorded eliciting action potentials, inward and outward currents, and spontaneous EPSCs in these neurons (Figures 7A–7L, S6C–S6H). In addition, in the presence of Bicuculline, a GABAA receptor antagonist, the observed frequency and amplitude of the spontaneous postsynaptic currents slightly increased (Figures 7H and S6H). These experiments demonstrated that functional synapses could be formed in directly reprogrammed neurons induced by Ezh2+Ngn1, Ezh2+Mecom, or Ngn1+Brn2.
Figure 7. Electrophysiological characterization of directly reprogrammed neurons driven by identified factor combinations.
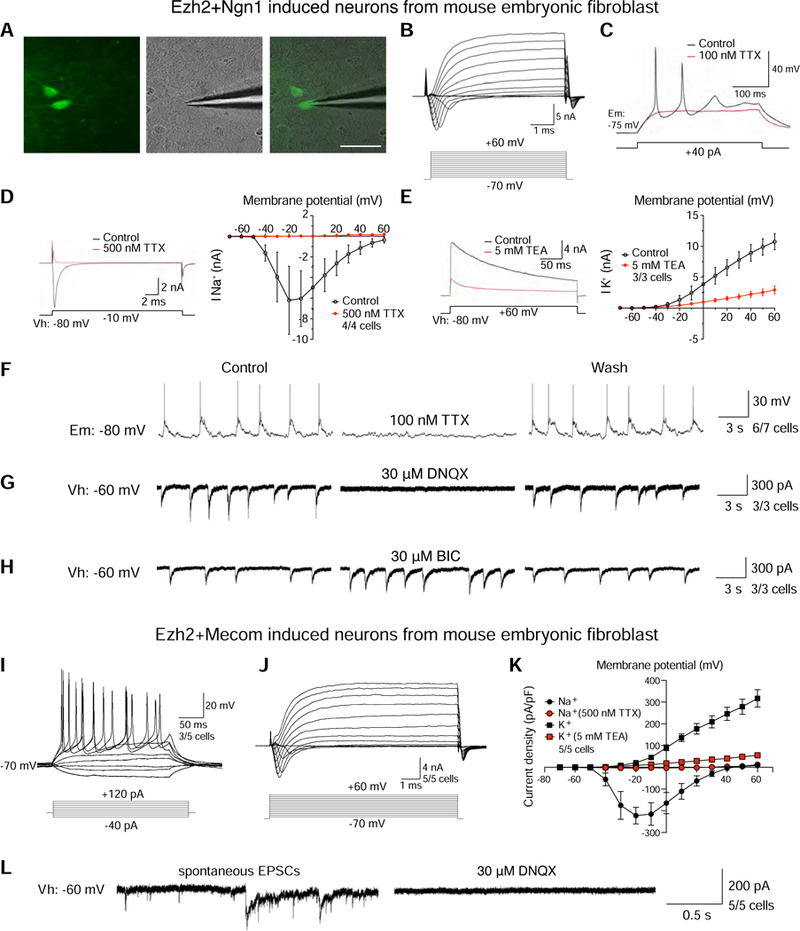
(A) Recording electrode patched onto a sfGFP+ cell with a stimulation electrode. Scale bar, 10 µm. (B) Representative traces of whole-cell currents in voltage-clamp mode; cells were held at −80 mV. (C) Representative trace of evoked membrane potential (black). Application of TTX inhibited the action potential (red). (D) Inward sodium currents were evoked from an induced neuron (black), and application of TTX inhibited these currents (red). Cells were held at −80 mV (right panel); a presentative trace of whole-cell current with and without TTX at −10 mV membrane potential in voltage-clamp mode is shown (left panel). (E) Outward potassium currents were evoked from an induced neuron (black), and application of TEA inhibited these currents (red). Cells were held at −80 mV (right panel); a presentative trace of whole-cell current with and without TEA at +60mV membrane potential in voltage-clamp mode is shown (left panel). (F) Spontaneous action potentials recorded from an induced neuron (left panel). Application of TTX blocked the action potentials (middle panel). Washout of TTX reversed the blockade (right panel). (G) Representative traces of evoked EPSCs recorded from an induced neuron (left panel). Application of DNQX blocked the response of EPSCs (middle panel). Washout of DNQX reversed the blockade (right panel). (H) Representative traces of evoked EPSCs recorded from an induced neuron (left panel). Application of BIC (Bicuculline), a GABA receptor antagonist, slightly increased the frequency and amplitude of EPSCs (middle panel). Washout of BIC reversed the increase (right panel). (I) Representative traces showing action potentials elicited from directly reprogrammed neurons. (J) Representative traces of whole-cell currents in voltage-clamp mode. (K) Current density plot of voltage activated currents in directly reprogrammed neurons. The graph shows current density (y-axis, pA/pF) for peak outward (potassium, squares) and inward currents (sodium, circles) plotted against voltage step (x-axis, mV) in the absence (black) and presence of either TEA (red squares) or TTX (red circles). (L) Representative traces of evoked EPSCs recorded from an induced neuron (left panel). Application of DNQX blocked the response of EPSCs (right panel). Error bars indicate ± SEM of cell counts. Ngn1+Ezh2 (A–H) and Ezh2+Mecom (I–L) induced neurons were recorded.
DISCUSSION
Here we demonstrated a systematic approach using a series of individual and combinatorial CRISPRa screens to study genetic drivers of neuronal fate determination. We developed an integrated experimental and computational platform to functionally characterize the full set of transcription factors and other regulators and the GIs between core factors for neuronal fate determination using a high-density single gene profiling and GI maps. Our strategy offers an approach for studying the system biology of cell identity regulatory networks, providing a useful methodology for understanding cell fate determination.
Our approach enabled systematic identification of factors for neuronal fates determination, some of which were previously unlinked to neuronal differentiation or direct reprogramming. These findings provide insights into the molecular mechanisms governing cellular reprogramming. For example, Ezh2 and Suz12, two Polycomb-group proteins that are global epigenetic regulators (Margueron and Reinberg, 2011), appeared as top hits and were validated to promote neuronal differentiation. Our transcriptome analyses further suggested that Ezh2 inhibited alternative endodermal and mesodermal lineages. Studying its exact mechanisms in the future might help elucidate how global epigenetic changes favor a specific cell fate, and potentially provide drug targets for degenerative diseases.
By pairwise activation of core neuronal-inducing factors, we generated a quantitative GI map for the neuronal fate decision. The GI map predicted multiple factor pairs that enhance the induction of the neuronal fate. We validated the pairs with the lowest FDR and found that they showed positive effects on neuronal differentiation. These effects for ES to neuron differentiation were moderate, correlative to that individual single factors already exhibited strong differentiation effects. Compared to the additive effects, several factor pairs showed strong synergistic effects on neuronal direct reprogramming (Figure 5A). For example, the combinations of Ezh2+Mecom and Ezh2+Brn2 efficiently generated neurons from fibroblasts, whereas none of them alone induced neuronal direct reprogramming. The drastic increase in neuronal direct reprogramming efficiency using two factors compared to a single factor suggests that a higher degree of synergism between driver genes is required in fibroblasts compared to ES cells.
As an enzymatic subunit and core component of the PRC2 complex, Ezh2 participates in histone methylation and is primarily thought to repress gene expression. A recent work demonstrates that Ezh2 controls REST stability independently of PRC2, and acts as an anti-neurogenic barrier during direct neuronal reprogramming of human fibroblasts (Lee et al., 2018). This is in contrast to our study, where overexpression of Ezh2 promoted neuronal differentiation and reprogramming both from ES cells and from fibroblasts. The pro-neuronal effect of Ezh2 is likely PRC2-dependent. First, this is supported by the fact that Suz12, another PRC2 component, was also identified as a pro-neuronal hit from our unbiased screen. In addition, Lee et al. found that the repression of PRC2 components Suz12 and EED led to the failed neuronal conversion, also highlighting the importance of PRC2 during neuronal generation. Second, we performed a transcriptome analysis of the most downregulated genes in Ezh2-induced neurons and found that many of these genes were putative PRC2 targets (Figure S5A, Liu et al., 2010). This suggests that overexpression of Ezh2 in our study may have enhanced PRC2-mediated repression, thus promoting neuronal differentiation. Third, in our direct reprogramming experiments, Ezh2 dramatically promoted neuronal generation in the presence of other factors (such as Ngn1, Brn2 and Mecom), suggesting that it may prime the chromatin of fibroblasts and enhance the binding of pro-neuronal factors. Together, our results provide deeper insights on how Ezh2, as a global epigenetic modulator in the PRC2 complex identified from unbiased genetic screens, affects neuronal fate conversion.
We mapped the identified neuronal-promoting factors, Ezh2, Foxo1, Ngn1, onto the STRING database (Szklarczyk et al., 2015) and found that they directly interacted with β-catenin, a core factor that regulates neuronal differentiation and function (Hoogeboom et al., 2008; Otero et al., 2004; Wisniewska, 2013). Furthermore, β-catenin activates Ngn1 and Brn2 as downstream genes (Goodall et al., 2004; Israsena et al., 2004). We incorporated the observations in this study into a hypothetical gene interaction network, in which the Wnt/β-catenin pathway acts as a hub (Figure S7). The direct reprogramming factors, Ezh2 and Foxo1, may directly bind to β-catenin and redirect its transcriptional activity (Hoogeboom et al., 2008; Shi et al., 2007). Several differentiation factors, such as Tcf15 and Nr4a1, also regulate β-catenin via expression modulation, degradation or adherent activity (Cheng et al., 2015; Davies et al., 2013; Sánchez-Tilló et al., 2010; Sun et al., 2011). Taken together with previous knowledge on β-catenin, our CRISPRa approach in this study allows us to propose a model with a hypothetic interaction network centered on Wnt/β-catenin, with a number of identified factors to enhance the transcriptional activity of β-catenin and govern neuronal fate determination.
In sum, the ability to activate a large-set of endogenous genes and rapidly profile GI maps between genes provides a powerful tool to understand the regulatory network of the cell identity, and for discovering factors to promote desired cell type engineering. This study opens up possibilities in understanding the biology of cellular reprogramming, which could facilitate other strategies to reprogram cells into clinically relevant cell types.
STAR Methods
CONTACT FOR REAGENT AND RESOURCE SHARING
Further information and requests for resources and reagents should be directed to and will be fulfilled by the Lead Contact, Lei S Qi (stanley.qi@stanford.edu)
EXPERIMENTAL MODEL AND SUBJECT DETAILS
Cell Culture
E14 mouse ES cells and CamES cells were maintained on gelatin-coated tissue culture plates with basal medium (50% Neurobasal, 50% Dulbecco modified Eagle medium (DMEM)/Ham’s nutrient mixture F12, 0.5% NEAA, 0.5% Sodium Pyruvate, 0.5% GlutaMax, 0.5% N2, 1% B27, 0.1mM β-mercaptoethanol and 0.05 g/L bovine albumin fraction V; all from Thermo Fisher Scientific) supplemented with LIF (Millipore) and 2i (CHIR99021 and PD0325901, Stemgent). Human embryonic kidney (HEK293T) cells (ATCC) were cultured in 10% fetal bovine serum (Thermo Fisher Scientific) in DMEM (Thermo Fisher Scientific).
Mice
Mice used in this study were C57BL/6 background. We did not sort genders because the sex of fetuses and neonates is difficult to be determined. The mice were housed in the specific- pathogen-free (SPF) animal facility at the Gladstone Institutes, University of California, San Francisco. The mice were housed under controlled conditions (temperature (21 ± 2°C), humidity (55 ± 10%), 12 h light/dark cycle). The animals were not involved in any previous procedures and were test naive. All procedures involving mice described in the present study were approved by the Institutional Animal Care and Use Committee at the University of California, San Francisco.
Rats
The rat pups used in this study were of the Sprague-Dawley strain. All rats were maintained in a controlled, SPF environment (temperature: 21.5 ± 4.5 °C / relative humidity: 35–55%) under a standard 12-hour light / 12-hour dark lighting cycle (lights on at 06:00). The rat pups were born in-house at the AfaSci animal facility from female timed-pregnant rats (Charles River). The rat pups were allowed to remain with the lactating female rat until the pups were used for cell culture (~ postnatal day 1). We did not sort genders because the sex of neonates is difficult to be determined. The timed-pregnant females as well as the pups were not involved in any previous procedures and were tested naive. Procedures involving rats were approved by the Institutional Animal Care and Use Committee (IACUC) of AfaSci Research Laboratory.
Primary Cell Culture
Primary cultures of cortex neurons were prepared from postnatal day 1 Sprague Dawley rats. Rats were decapitated, and their brains were removed in pre-cooled physiological saline. The cortex was dissected. Tissues were slightly minced and placed into a Papain Dissociation solution (Worthington Biochemical Corporation) containing 20 units/ml papain and 0.005% DNase in Earle’s Balanced Salt Solution (Thermo Fisher Scientific). The solution was equilibrated in 95% O2, 5% CO2 before the tissue was incubated at 37°C for 1 hour. After incubation, the tissue and solution mixture was triturated. Undissociated tissue was allowed to settle and the cloudy suspension was removed and centrifuged at 300 x g for 5 minutes. The supernatant was then discarded and the cell pellet was resuspended in a DNase/albumin- inhibitor solution. A discontinuous density gradient was prepared by gently layering the cell suspension on top of an albumin-inhibitor solution in a centrifuged tube. The mixture was centrifuged at 145 x g for 5 minutes. The supernatant was discarded and the neurons were resuspended in Neurobasal (Invitrogen) medium containing 2% B27 supplement, 2 mM glutamine and 0.5% penicillin/streptomycin. A total of 250,000 cells were plated onto a well of 24-well plates that had been pre-treated with 12.5 µg/ml poly-D-lysine (Sigma). The plates were incubated at 37 °C in a 5% CO2/95% air incubator an d half of the medium was changed every three days. One week after culturing primary neurons, the induced neurons were gently removed from the dishes by trypsin dissociation and were replated onto the primary neurons. Electrophysiological recordings were performed between day 14 and day 21 after replating.
Construction of the CamES Cell Line
Mouse ES cells were co-transduced with lentiviral constructs that express dCas9-SunTag from a TRE3G promoter, scFV-sfGFP-VP64 from the PGK promoter, and reverse tetracycline- controlled transactivator (rtTA) from the EF1a promoter. After adding Doxycycline, polyclonal cells were sorted by flow cytometry using a BD FACS Aria2 for GFP+ and mCherry+ cells. After verification of endogenous gene activation for a few genes (Etv2, Nobox, Hoxc11, Brn2, Lhx4) using individual sgRNAs, we sorted monoclonal cells, and chose one efficient cell line as the final CamES cell line for screening.
Construction of the Tubb3-hCD8 CamES Cell Line
2.5 µg pSLQ1654-sgTubb3, 12.5 µg Tubb3-IRES-hCD8 template DNA in 100 µL Nucleofector solution (Amaxa) were electroporated into 1×10⁶ CamES cells using program A-030. Both plasmids were maxiprepped using the Endofree Maxiprep Kit (Qiagen). After 3 days of culture, sorted single cells were seeded in a 96-well plate with one cell per well. All clonal cell lines were analyzed using PCR and sequencing (Yu et al., 2015). Primers used: 5’ homologous arm F: 5’- aaagtgccacctgacactcagtcctagatgtcgtgcgg-3’. 5’ homologous arm R: 5’-tcacttgggcccctgggct-3’. IRES-human CD8 F: 5’-caggggcccaagtgaactagtaaaattcgcccctctccctc-3’. IRES-human CD8 R: 5’-cagctgcgagcaactttaacctgcaaaaagggagcagtaaagg-3’. 3’ homologous arm F: 5’- agttgctcgcagctggggt-3’. 3’ homologous arm R: 5’-agctggagaccgttttttctgactgactggatacagggcat-3’. The pX330-derived pSLQ1654 encoding the nuclease Cas9 and an optimized sgRNA sequence was linearized by a BbsI digest and gel purified. Two primers sgTubb3 F (5’- caccgcccaagtgaagttgctcgcagc-3’) and sgTubb3 R (5’-aaacgctgcgagcaacttcacttgggc-3’) were phosphorylated, annealed, and ligated to the linearized vector pSLQ1654 to generate pSLQ1654-sgTubb3. The Tubb3-IRES-hCD8 vector (pSLQ1760) was assembled with three fragments (5’ homologous arm of Tubb3, IRES-hCD8, and 3’ homologous arm of Tubb3) and a modified pUC19 backbone vector by using Gibson Assembly Master Mix (New England Biolabs). Both 5’ and 3’ homology arms were PCR amplified from the genomic DNA extracted from mES cells with Herculase II Fusion DNA polymerase (Agilent). The IRES-hCD8 was PCR amplified from pSLQ1729. The backbone vector was linearized by digestion with PmeI and ZraI. All DNA fragments and the backbone vector were gel purified.
METHOD DETAILS
Plasmids Construction
To clone individual sgRNAs, the lentiviral vector (pSLQ1373) expressing an optimized sgRNA was linearized and gel purified (Chen et al., 2013). New sgRNA sequences were PCR amplified from pSLQ1373 using different forward primers and a common reverse primer, gel purified and ligated to the linearized pSLQ1373 vector using In-Fusion cloning (Clontech). Primers used to construct individual sgRNAs are shown in Table S2.
The double-sgRNA expression vectors were assembled by a two-step cloning procedure (Figure S4A). Individual sgRNA sequences were PCR amplified, and ligated onto the pSLQ5004 vector that contained a modified human U6 promoter (hU6) linearized by BstXI and XhoI. The same individual sgRNA sequences were also cloned onto pSLQ1373 that contained a modified mouse U6 promoter (mU6). The double-sgRNA expression vectors were constructed by inserting PCR products, amplified from pSLQ5004 containing one sgRNA, onto NsiI-linearized pSLQ1373 vector with another sgRNA. Primers (Integrated DNA Technologies) used to construct individual sgRNAs are shown in Table S3.
sgRNA Library Design
Putative TFs were selected according to the TRANSFAC database (Wingender et al., 1996), and transcription start site (TSS) for each gene was determined using the Gencode (Mudge and Harrow, 2015) and refFlat databases. We regard different isoforms of TF genes as different TFs. We designed sgRNAs primarily targeting a region of −3kb to 0 upstream of TSS. Using the CRISPR-era algorithm (Liu et al., 2015), we computed the targeting sequences of sgRNAs adjacent to a NGG protospacer adjacent motif (PAM), starting with a G (for better U6 promoter activity), and containing a protospacer length of 20 bp. The sgRNAs containing homopolymers spanning greater than 3 nucleotides (nt) were discarded. To avoid off-target effects, every sgRNA sequence was aligned to the whole mouse genome using the short read aligner Bowtie, and those with 0, 1, or 2 mismatches with another genomic region were excluded. We also excluded Ascl1 and Ngn2 (known neurogenic factors) from our library because we used them to validate the efficiency of CRISPRa for neuronal differentiation (Figure S1), and also because we were concerned that the signal from Ascl1 and Ngn2 induced neurons would drown out the signal of novel factor hits if they were not excluded from the library. Furthermore, sgRNA sequences that contained BstXI and BlpI restriction sites were excluded for construction convenience. We kept only sgRNAs with a GC content between 30% and 70%. An average of about 20 sgRNAs were selected for each factor. Sequences for non-targeting negative control sgRNAs were generated using a scrambled yeast chromosome region and selected using the same rules as described above.
sgRNA Library Construction
The oligonucleotide library (Custom Array) was PCR amplified, gel purified, and ligated into the linearized pSLQ1373 vector digested with BstXI and BlpI using In-Fusion cloning. Libraries and the parental vector will be made available on http://addgene.org.
Double sgRNA Library Construction
We designed a library of 44 sgRNAs including a set of 19 genes by using the top predicted hits from the single screens and six non-targeting sgRNAs. We excluded any sgRNAs containing NsiI restriction sites, which were used for combinatorial sgRNA library construction. We synthesized individual oligos encoding sgRNAs in a 96-well format (IDT), and cloned each sgRNA into pSLQ1373 individually as previously described. We also cloned the same individual sgRNAs into pSLQ5004 as previously described. After sequencing validation, we manually mixed all pSLQ1373-sgRNA constructs and all pSLQ5004-sgRNA constructs separately in equal amounts for double sgRNA library construction. To generate the pooled double sgRNA library, the sgRNA sequence were PCR amplified from pooled pSLQ5004-sgRNA constructs, gel purified, and ligated onto the Nsil-digested pooled pSLQ1373-sgRNA constructs using In- Fusion cloning (Clontech). The double sgRNA-library pools were prepared in Stellar competent cells (TaKaRa) and purified with a Plasmid Maxi Kit (Qiagen). Primers (IDT) used to construct individual sgRNAs are shown in Table S3. The representation of each of the double-sgRNA constructs was then quantified by NGS with the primers listed in Table S4.
Virus Production
HEK293T cells were seeded at ~30% confluence one day before transfection. Lentivirus was produced by co-transfecting with pHR plasmids and encoding packaging protein vectors (pMD2.G and pCMV-dR8.91) using TranslT-LT1 transfection reagents (Mirus). Viral supernatants were collected 3 days after transfection and filtered through a 0.45 µm strainer. Supernatant was used for transduction immediately or kept at −80°C for long-term storage.
High-Throughput Pooled Neuronal Differentiation Screens
The differentiation screens were performed in two independent replicates.
- On day −2, 108 CamES cells were seeded at 40,000 cells/cm2 to gelatin-coated plate.
- On day −1, cells were transduced with pooled lentiviral sgRNA library with an MOI of 0.3 in basal medium supplemented with LIF and 2i.
- On day 0, cells were switched to basal medium with Doxycycline at 100 ng/mL and puromycin at 1 µg/mL.
- 24 hours after puromycin selection, 25 million cells were harvested as the initial population of the screen.
- Fresh medium with Doxycycline was changed every day starting day 2 (puromycin selection ended).
- On day 12, cells were harvested, stained with hCD8, and sorted for hCD8+ and hCD8- cells using EasySep human CD8 isolation kit (STEMCELL Technologies).
- Genomic DNA was harvested from all samples; the sgRNA-encoding regions were then amplified by PCR using HiSeq forward and reverse primers and then sequenced on an Illumina HiSeq-4000 using HiSeq custom primer with previously described protocols at high coverage (Bassik et al., 2013; Gilbert et al., 2014). Primers used are summarized in Table S4.
- For the individual sgRNA validation experiments, we used a similar protocol except that CamES cells were transduced with a high MOI. Top hits that show enriched neuronal fate are summarized in Table S1.
High-Throughput Pooled Combinatorial Screens
The double CRISPRa neuronal differentiation screens were performed as two independent replicates.
- On day −2, 6 million CamES cells were seeded at 40,000 cells/cm2 to gelatin-coated plate.
- On day −1, cells were transduced with pooled lentiviral sgRNA library with an MOI of 0.3 in basal medium supplemented with LIF and 2i.
- On day 0, cells were switched to basal medium with Doxycycline at 100 ng/mL and puromycin at 1 µg/mL.
- Fresh medium with Doxycycline was changed every day starting day 2 (puromycin selection ended).
- On day 12, cells were harvested, stained with hCD8 and sorted for hCD8+ and hCD8- cells using Aria II cell sorter (BD Biosciences).
- Genomic DNA was harvested from all samples; the double sgRNA-encoding regions were then amplified by PCR using MiSeq forward and reverse primers and then sequenced on an Illumina Miseq using HiSeq custom primer, which for the first sgRNA, and MiSeq custom primer, which for the second sgRNA. The method to sequence the double sgRNA regions of the constructs is shown in Figure S4A. Primers used are summarized in Table S4.
- For the double sgRNA validation experiments, we used a similar protocol except that CamES cells were transduced with a high MOI.
Generation of mouse fibroblasts
Embryonic skin-derived fibroblasts were isolated from E13.5 embryos of C57BL/6 mice as previously described (Vierbuchen et al., 2010). Isolated fibroblasts were cultured and expanded in MEF media (Dulbecco’s Modified Eagle Medium, Life Technologies) containing 10% Fetal Bovine Serum (Life Technologies), non-essential amino acids (Life Technologies), and sodium pyruvate (Life Technologies)) for 2 passages before use. Tail tip fibroblasts were isolated from the bottom third of tails from 4-day-old pups (both female and male). Tail tip cells were expanded for 2 passages in MEF media before use.
Generation of Induced Neurons
- Isolated MEFs were cultured and expanded in MEF media for 2 passages before use. Tail tip fibroblasts were were expanded for 2 passages in MEF media before use.
- Matrigel (growth factors reduced; BD Biosciences) was thawed on ice according to the manufacturer’s instruction and diluted in pre-chilled PBS with a ratio of 1: 30.
- Diluted Matrigel was added to 24-well plates in sufficient quantity to cover the entire growth surface of the plates. Plates were kept at 37°C for 30 minutes until ready for use.
- Passage 1–2 MEFs were thawed and seeded into the Matrigel-coated plates at a density of 25,000 cells per well of a 24-well plates. Cells were grown in MEF media for 4–5 days until confluent.
- When MEFs were confluent, cells were infected with lentiviruses containing expression constructs of rtTA (driven by ubiquitin promoter) and additional lentiviruses overexpressing Ascl1, Ngn1, Ezh2, Foxo1, Brn2, Nr4a1, Dmrt3, Jun, Suz12, Nr3c1, Tcf15, Zeb1, Mecom, Hoxc8, or Nr2f1 (driven by a Tet-on promoter) in the presence of polybrene (8 mg/ml).
- The next day, media was exchanged with basal medium containing Doxycycline (1 mg/ml).
- Culture media was refreshed every 3–4 days during the induction period.
Maturation of induced neurons
About 14 days after lentivirus transduction (extensive neurites outgrowth should be observed in this stage), the induced cells are able to be progressed for further maturation. To do so, they were re-plated and co-cultured directly with primary neurons.
- Mouse primary postnatal cortical neurons were isolated and cultured for about 6 days before re-plating the induced cells.
- The induced cells were dissociated by using 0.05% trypsin on the culture plate.
- Cells were centrifuged for 3 min at 1000 rpm at room temperature.
- After carefully discarding the supernatant, fresh maturation medium was added (basal media with addition of 200 µM ascorbic acid, 2 µM db-cAMP, 25 ng/ml BDNF, 25 ng/ml NT3, and 50 ng/ml GDNF) to gently re-suspend the cells and re-plate them to co-cultured with pre-existing primary neurons.
- The next day, media was exchanged with basal medium containing Doxycycline (1 mg/ml).
- Re-plated cells were co-cultured for about 14 days or longer (depending on the maturation process of the induced cells, which can be observed based on the development of the extensive neuritis outgrowth) to become functionally mature. Half of the basal medium was changed every 3–4 days.
Quantitative RT-PCR
Cells were harvested using Accutase (STEMCELL), and total RNA was isolated using the RNeasy Plus Mini Kit (QIAGEN), according to manufacturer’s instructions. Reverse transcription was performed using iScript cDNA Synthesis kit (Bio-Rad). Quantitative PCR reactions were prepared with iTaq Universal SYBR Green Supermix (Bio-Rad). Reactions were run on a LightCycler thermal cycler (Bio-Rad). Primers used are summarized in Table S5. For the below genes, the primers were ordered from IDT: Ascl1, Ngn2, GFAP, GLT1, Sox10, Olig2, Cux2, Ctip2, Sox5, Tbr1, Otx1, En-1, HoxB4, GAD1, Nestin, and NG2.
Flow Cytometry, Cell Surface Staining and Cell Sorting
The antibody CD8-APC was purchased from BD Biosciences, and Anti-PSA-NCAM-APC was from Miltenyi Biotec. Cells were harvested, washed, and adjusted to a concentration of 106 cells/mL in ice cold PBS with 2% FBS. Cells were stained and incubated with diluted primary antibodies at 4 °C for 30 mins in Eppendorf tubes. After staining, cells were washed three times by centrifugation at 400 g for 5 mins and resuspended in 500 µL to 1 mL in ice cold PBS. Cells were kept in dark on ice and analyzed using BD Accuri C6 Cytometer. Cell sorting was performed by using Aria II cell sorter (BD Biosciences).
Immunocytochemistry
Experiments were performed on cells seeded on a plate (IBIDI) that had been coated with gelatin (0.1%) overnight at 37 °C. Cells were washe d twice with PBS, fixed in 4% Paraformaldehyde (Wako) for 15 mins at room temperature, permeabilized and blocked with 0.1% Triton X-100, 5% donkey serum in PBS (blocking buffer) for 1 h at room temperature. After three washes with PBS, cells were incubated with primary antibodies. Cells were incubated with primary antibodies at 4 °C for overnight, then wash ed three times with PBS. After staining with corresponding secondary antibodies in blocking buffer for 1 hour at room temperature, cells were washed three times with PBS and stained with DAPI (Vector Labs) for 5 mins. Washed cells were examined using a Nikon Spinning Disk Confocal microscope with TIRF.
Electrophysiology
For differentiation, eight days after sgRNA transduction and induction with Dox, cells were re- plated neurons onto rat neonatal cortical neurons using basal medium. Electrophysiological functions were tested and recorded after 7–10 days.
For direct reprogramming, after 14 days’ co-infection of cDNAs and a superfold GFP (sfGFP) reporter, cells were re-plated onto rat neonatal cortical neurons using basal medium that had been cultured for 7 days in vitro. Patch-clamp electrophysiological recordings were performed one week after on sfGFP positive fibroblast-induced neurons. sfGFP positive neurons were located using a Lambda DG-4 illumination system and Q Imaging Fast 1394 Rolera-Mgi Plus camera controlled by Micro-Manager (Version 1.4) mounted on an Olympus BX51WI fluorescence microscope. Whole-cell responses were recorded using an MultiClamp 700 B (Molecular Devices) amplifier and headstage and low-pass filtered at 10 KHz before digitization using a DigiData 1440 data acquisition system (Molecular Devices). Data was stored on a PC running pClamp software (Version 10.4, Molecular Devices). Patch-pipettes were fabricated from 1.5 mm OD borosilicate capillary glass (Warner Instruments) using a microipette puller (Sutter Instrument, Model P-87) to give tip resistances of 2–4 MΩ. The series resistance for all recordings was under 10 MΩ (Mean: 5.62 MΩ, SEM: 0.38, n=12). Capacitance transients and series resistance errors were compensated for (70%) using the amplifier circuitry.
The sodium and potassium currents were recorded in the voltage-clamp configuration at a holding potential of −80 mV. Spontaneous postsynaptic currents were recorded in the voltage- clamp configuration at a holding potential of −60 mV or −70 mV. Spontaneous action potentials were recorded in neurons held at −60 mV to −80 mV. Action potentials were also evoked by applying depolarizing current.
All experiments were performed at ambient room temperature (25°C). The external solution contained (in mM): NaCl (130), HEPES-Na (10), KCl (5), CaCl2 (2), Glucose (10). For voltage- gated sodium currents, tetraethylammonium (TEA, 5 mM) was added to the external solution and the internal solution contained (in mM): CsF (120), HEPES (10), EGTA (11), CaCl2 (1), MgCl2 (1), TEA-Cl (10), KOH (11). For voltage-gated potassium currents, tetrodotoxin (TTX, 500 nM) was added to the external solution and the internal solution contained (in mM): KF (120), HEPES (10), EGTA (11), CaCl2 (1), MgCl2 (1), KCl (10), KOH (11). For current clamp recordings of action potentials, 2 mM MgATP was added to the internal solution. All recording solutions had pH values of 7.3–7.4 with osmolality of 290–300 mOsm/kg. Drug applications were administered via local perfusion approximately 200 µm from the recorded cells at a flow rate of ml/min and solutions were continually withdrawn from the recording chamber by vacuum aspiration. Drugs were applied until responses reached a steady-state level. Electrophysiological data were analyzed offline using Clampfit 10.4 and data was plotted using Graphpad Prism software.
Transcriptome Analysis by RNA-seq
CamES-derived neuronal cells driven by sgRNAs were purified with PSA-NCAM at day 12. MEF-derived neuronal cells driven by the overexpression of cDNAs were purified with PSA- NCAM at day 12. Total RNA was purified using RNeasy Plus Mini Kit (Qiagen). Library preparation and next-generation sequencing were performed by Novogene Corporation, Chula Vista, CA.
Reads were mapped with the STAR aligner (Dobin et al. 2013) to the mm10 genome using the ENSEMBL GRCm38.83 annotations. Gene counts were then obtained with HTseq (Anders et al., 2015) with the “intersection-nonempty” option to prevent counting of ambiguous reads. Differential expression analysis was performed with edgeR (Robinson et al., 2010). We analyzed the differentiation samples and the trans-differentiation samples separately. For the differentiation samples we set the CamES cells to be the baseline in the design matrix and encoded the presence of each factor as an indicator variable, as well as the interactions to investigate epistasis. For the trans-differentiation samples, we set MEF as the baseline and encoded each trans-differentiation condition as an indicator variable. We collapsed all endogenous neurons and brain samples into a single category to ensure identifiability in the design matrix and to calculate differentially expressed genes for this group as a whole. To compare samples across studies we also encoded an indicator variable of the study and subtracted these estimated batch effects from all estimated expression values. Gene Ontology results were obtained from Gene Ontology Consortium (Ashburner et al., 2000; The Gene Ontology Consortium, 2017).
QUANTIFICATION AND STATISTICAL ANALYSIS
FACS, Realtime-PCR and Electrophysiology
For quantification of differentiation efficacy by FACS (Figures 2B–E, 3D, 3E, and 5A), values represent the average value of three biologically independent experiments. Error bars represent standard deviations that are calculated in Microsoft EXCEL. For quantification of gene expression by realtime-PCR (Figures 2E, S1C, S1H, S1G, S5B, and S5C), Quantitative-PCR Analyses expression data were normalized to the housekeeping gene RiboL7. Data are represented as mean from 3 biological replicates, each individually performed in technical triplicates. Error bars represent standard deviations that are calculated in Microsoft EXCEL. For electrophysiology assays, n represents the cell numbers recorded (Figure 2H n=5, 7D n=4, 7E n=3, 7K n=5, S3C n=3, S4E n=4, S6D n=4, S6E n=3). Error bars represent standard error of the mean (SEMs) calculated in Microsoft EXCEL.
Induced Neurons Efficiency Calculation
The following method was used to calculate the efficiency of neuronal direct reprogramming: The total number of Map2+ cells with a neuronal morphology, defined as cells having a circular, three-dimensional appearance that extend a thin process at least three times longer than their cell body, were quantified 14 days after transduction into MEFs or 26 days after transduction into TTFs. The Map2+ and DAPI+ cells were counted from at least 20 randomly selected images at 20 × magnification for each experiment of every condition. The Map2+ cell number was divided by the number of DAPI+ cells to get a percentage of induced neuron cells. Values represents the average value of three biologically independent experiments, Error bars represent standard deviations that are calculated in Microsoft EXCEL.
Bioinformatic Analysis of sgRNA and Gene Hits
Data processing was conducted with custom scripts. Reads were mapped allowing for a mismatch for the first and last base pair of the spacer, which uniquely identified each sgRNA. We normalized each sample by the total read count (Table S6). This gave us a frequency for each sgRNA:
fsgRNA = sgRNA counts∑sgRNA counts
We used the paired Tubb3-hCD8+ and Tubb3-hCD8- to compute the enrichment scores. Specifically, we computed frequencies as above, and discarded sgRNA with less than 1 count in the Tubb3-hCD8- library. We computed enrichment for each sgRNA in each replicate as the log2 fold-change from the Tubb3-hCD8- sample to the Tubb3-hCD8+ libraries. We averaged enrichment across replicates and used this as Esg in subsequent analysis.
For each gene, we computed an enrichment score (ESgene) from the sgRNA enrichment above, as follows. We computed an unnormalized enrichment score (Egene,top3) by averaging Esg for the 3 sgRNA with highest Esg. We normalized Egene,top3 by the distribution of nontargeting sgRNA as follows.
Suppose a gene had N targeting sgRNA. We drew 10000 bootstrap samples of size N from the nontargeting sgRNA. For each sample of size N, we computed Esample,top3 as above. This gave us an empirical estimate of the distribution of Egene,top3 if the all the sgRNA targeting that gene had been negative control sgRNA. For our final normalized gene enrichment score (ρ1), we divided the unnormalized enrichment score by the 0.9 quantile of this empirical distribution:
ρ1=Egence,top3quantilesamples(Esamples,top3,0.9)
After ranking genes by ES, we selected the most enriched sgRNA for each gene to subsequently validate.
Bioinformatic Analysis of Double Screens
We calculated the count matrix by exact match for both ends of each paired end read, throwing all other reads out (Table S7). The correlation of counts between replicates of the same condition was high (0.942 – 0.992), indicating high reproducibility of the double screen. Effect sizes for each guide pair was calculated using MAGeCK MLE (Li et al., 2015).
Suppose the null hypothesis that the guide pair of genes i and j have an effect size equal to the maximum of the individual effect size. This will be the case if one gene is the primary driver of neuronal differentiation. We verified this assumption by examining the empirical distribution and verifying that it is centered at zero. Note that the coefficients estimated by MAGeCK (β ij for genes i and j, in that order) arise from a generalized linear regression and should, if the model posited by MAGeCK is correct, be normally distributed.
Consider the null hypothesis H 0: the effect of guide targeting two genes is less than the maximal effect of guides targeting either gene. Let sign m(x, y) be the function that returns the sign of the larger of the absolute values of the two guides compared to the negative controls. Under the null hypothesis β ij = signm(β i0, β 0j) max(|β i0|, |β 0j|).
To this end, note that the standard deviation of β ij is bounded above by
Therefore the difference βij − signm(βi0, β0j) max(|βi0|, | β0j|) has standard error bounded above by
We can then define the gene level interaction score (ρ2) of genes i and j as
ρ2(i,j)=12βi,j−signm(βi0, β0j)max(|βi0|,|β0j|)sβij2+sβi02+sβ0j2+βj,i−signm(βj0,β0i)max(|βj0,|,|β0i|)sβij2+sβj02+sβ0i2
ρ2 is constructed to be similar to a z-score for testing interactions, taking variability into account, but will not necessarily have an exactly normal distribution due to the high correlation between estimates (since we are testing all gene-gene pairs). Therefore, we use an empirical Bayes approach to estimate the null distribution and determine significant genes while appropriately controlling the false discovery rate (Efron, 2012).
Guide level interaction scores (guide-level ρ3) were computed by MCMC in the stan language with a modified James-Stein estimator by subtracting off average gene level interactions and putting a standard normal prior on the guide-level interaction scores. This allows us to pool information across the whole experiment and account for specific differences between high and low expression guides.
Supplementary Material
1
2
3
4
Highlights:
- CRISPRa screening identifies factors that promote neuronal fate in an unbiased manner
- Quantitative genetic interaction maps reveal contributions of pairwise factors
- Factor combinations can efficiently and directly reprogram fibroblasts into neurons
- Induced neurons share similar transcriptional signatures as endogenous neurons
ACKNOWLEDGEMENTS
The authors thank the Qi lab members for technical help and reading the manuscript. We thank Stanford Functional Genomics Facilities (SFGF) for technical help with RNA- seq. This work was supported by NIH Director’s Early Independence Award (grant OD017887), NIH U01 (grant EB021240), Department of Defense Breast Cancer Research Program, Breakthrough Award (W81XWH-17-1-0018), Pew Biomedical Scholar, Alfred P. Sloan Foundation, and a gift fund from the Li Ka Shing Foundation.
Footnotes
Publisher's Disclaimer: This is a PDF file of an unedited manuscript that has been accepted for publication. As a service to our customers we are providing this early version of the manuscript. The manuscript will undergo copyediting, typesetting, and review of the resulting proof before it is published in its final citable form. Please note that during the production process errors may be discovered which could affect the content, and all legal disclaimers that apply to the journal pertain.
DECLARATION OF INTERESTS
L.S.Q. and Y.L. are investors on a patent application (US Provisional Patent # 62/443,401) describing compositions and methods identifying and using stem cell differentiation markers.
DATA AND SOFTWARE AVAILABILITY
The accession number for the data reported in this paper is NCBI GEO: GSE118560.
SUPPLEMENTAL INFORMATION
Table S6. Single Screening sgRNA Counts, Related to STAR Methods.
Table S7. Double Screening sgRNA Counts, Related to STAR Methods.
REFERENCES
- Adamson B, Norman TM, Jost M, Cho MY, Nuñez JK, Chen Y, Villalta JE, Gilbert LA, Horlbeck MA, Hein MY, et al. (2016). A Multiplexed Single-Cell CRISPR Screening Platform Enables Systematic Dissection of the Unfolded Protein Response. Cell 167, 1867–1882. [DOI] [PMC free article] [PubMed] [Google Scholar]
- Anders S, Pyl PT, and Huber W (2015). HTSeq—a Python framework to work with high-throughput sequencing data. Bioinformatics 31, 166–169. [DOI] [PMC free article] [PubMed] [Google Scholar]
- Ashburner M, Ball CA, Blake JA, Botstein D, Butler H, Cherry JM, Davis AP, Dolinski K, Dwight SS, Eppig JT, et al. (2000). Gene Ontology: tool for the unification of biology. Nature Genetics 25, 25. [DOI] [PMC free article] [PubMed] [Google Scholar]
- Bassik MC, Kampmann M, Lebbink RJ, Wang S, Hein MY, Poser I, Weibezahn J, Horlbeck MA, Chen S, Mann M, et al. (2013). A systematic mammalian genetic interaction map reveals pathways underlying ricin susceptibility. Cell 152, 909–922. [DOI] [PMC free article] [PubMed] [Google Scholar]
- Black Joshua B., Adler Andrew F., Wang H-G, D’Ippolito Anthony M., Hutchinson Hunter A., Reddy Timothy E., Pitt Geoffrey S., Leong Kam W., and Gersbach Charles A. (2016). Targeted Epigenetic Remodeling of Endogenous Loci by CRISPR/Cas9-Based Transcriptional Activators Directly Converts Fibroblasts to Neuronal Cells. Cell Stem Cell 19, 406–414. [DOI] [PMC free article] [PubMed] [Google Scholar]
- Cahan P, Li H, Morris Samantha A., Lummertz da Rocha E, Daley George Q., and Collins James J. (2014). CellNet: Network Biology Applied to Stem Cell Engineering. Cell 158, 903–915. [DOI] [PMC free article] [PubMed] [Google Scholar]
- Chavez A, Scheiman J, Vora S, Pruitt BW, Tuttle M, P R Iyer E, Lin S, Kiani S, Guzman CD, Wiegand DJ, et al. (2015). Highly efficient Cas9-mediated transcriptional programming. Nat Meth 12, 326–328. [DOI] [PMC free article] [PubMed] [Google Scholar]
- Chen B, Gilbert Luke A., Cimini Beth A., Schnitzbauer J, Zhang W, Li G-W, Park J, Blackburn Elizabeth H., Weissman Jonathan S., Qi Lei S., et al. Dynamic Imaging of Genomic Loci in Living Human Cells by an Optimized CRISPR/Cas System. Cell 155, 1479–1491. [DOI] [PMC free article] [PubMed] [Google Scholar]
- Chen S, Sanjana NE, Zheng K, Shalem O, Lee K, Shi X, Scott DA, Song J, Pan JQ, Weissleder R, et al. (2015). Genome-wide CRISPR screen in a mouse model of tumor growth and metastasis. Cell 160, 1246–1260. [DOI] [PMC free article] [PubMed] [Google Scholar]
- Cheng P, Sun X, Yin D, Xu F, Yang K, Qin L, Dong Y, Guo F, Chen A, Zhang W, et al. (2015). Nanog down-regulates the Wnt signaling pathway via β- catenin phosphorylation during epidermal stem cell proliferation and differentiation. Cell & Bioscience 5, 5. [DOI] [PMC free article] [PubMed] [Google Scholar]
- D’Alessio AC, Fan ZP, Wert KJ, Baranov P, Cohen MA, Saini JS, Cohick E, Charniga C, Dadon D, Hannett NM, et al. (2015). A Systematic Approach to Identify Candidate Transcription Factors that Control Cell Identity. Stem Cell Reports 5, 763– 775. [DOI] [PMC free article] [PubMed] [Google Scholar]
- Davies Owen R., Lin C-Y, Radzisheuskaya A, Zhou X, Taube J, Blin G, Waterhouse A, Smith Andrew J.H., and Lowell S (2013). Tcf15 Primes Pluripotent Cells for Differentiation. Cell Reports 3, 472–484. [DOI] [PMC free article] [PubMed] [Google Scholar]
- Dixit A, Parnas O, Li B, Chen J, Fulco CP, Jerby-Arnon L, Marjanovic ND, Dionne D, Burks T, Raychowdhury R, et al. (2016). Perturb-Seq: Dissecting Molecular Circuits with Scalable Single-Cell RNA Profiling of Pooled Genetic Screens. Cell 167, 1853–1866. [DOI] [PMC free article] [PubMed] [Google Scholar]
- Efron B (2012). Large-scale inference: empirical Bayes methods for estimation, testing, and prediction (Cambridge University Press; ). [Google Scholar]
- Gilbert Luke A., Horlbeck Max A., Adamson B, Villalta Jacqueline E., Chen Y, Whitehead Evan H., Guimaraes C, Panning B, Ploegh Hidde L., Bassik Michael C., et al. (2014). Genome-Scale CRISPR-Mediated Control of Gene Repression and Activation. Cell 159, 647–661. [DOI] [PMC free article] [PubMed] [Google Scholar]
- Gilbert Luke A., Larson Matthew H., Morsut L, Liu Z, Brar Gloria A., Torres Sandra E., Stern-Ginossar N, Brandman O, Whitehead Evan H., Doudna Jennifer A., et al. (2013). CRISPR-Mediated Modular RNA-Guided Regulation of Transcription in Eukaryotes. Cell 154, 442–451. [DOI] [PMC free article] [PubMed] [Google Scholar]
- Goodall J, Martinozzi S, Dexter TJ, Champeval D, Carreira S, Larue L, and Goding CR (2004). Brn-2 Expression Controls Melanoma Proliferation and Is Directly Regulated by β-Catenin. Molecular and Cellular Biology 24, 2915–2922. [DOI] [PMC free article] [PubMed] [Google Scholar]
- Heinäniemi M, Nykter M, Kramer R, Wienecke-Baldacchino A, Sinkkonen L, Zhou JX, Kreisberg R, Kauffman SA, Huang S, and Shmulevich I (2013). Gene- pair expression signatures reveal lineage control. Nat Meth 10, 577. [DOI] [PMC free article] [PubMed] [Google Scholar]
- Hoogeboom D, Essers MAG, Polderman PE, Voets E, Smits LMM, and Burgering BMT (2008). Interaction of FOXO with β-Catenin Inhibits β-Catenin/T Cell Factor Activity. Journal of Biological Chemistry 283, 9224–9230. [DOI] [PubMed] [Google Scholar]
- Israsena N, Hu M, Fu W, Kan L, and Kessler JA (2004). The presence of FGF2 signaling determines whether β-catenin exerts effects on proliferation or neuronal differentiation of neural stem cells. Developmental Biology 268, 220–231. [DOI] [PubMed] [Google Scholar]
- Koike-Yusa H, Li Y, Tan EP, Velasco-Herrera Mdel C, and Yusa K (2014). Genome-wide recessive genetic screening in mammalian cells with a lentiviral CRISPR- guide RNA library. Nat Biotechnol 32, 267–273. [DOI] [PubMed] [Google Scholar]
- Konermann S, Brigham MD, Trevino AE, Joung J, Abudayyeh OO, Barcena C, Hsu PD, Habib N, Gootenberg JS, Nishimasu H, et al. (2015). Genome-scale transcriptional activation by an engineered CRISPR-Cas9 complex. Nature 517, 583– 588. [DOI] [PMC free article] [PubMed] [Google Scholar]
- Lee SW, Oh YM, Lu Y-L, Kim WK, and Yoo AS (2018). MicroRNAs Overcome Cell Fate Barrier by Reducing EZH2-Controlled REST Stability during Neuronal Conversion of Human Adult Fibroblasts. Developmental Cell 46, 73–84.e77. [DOI] [PMC free article] [PubMed] [Google Scholar]
- Li W, Köster J, Xu H, Chen C-H, Xiao T, Liu JS, Brown M, and Liu XS (2015). Quality control, modeling, and visualization of CRISPR screens with MAGeCK- VISPR. Genome Biology 16, 281. [DOI] [PMC free article] [PubMed] [Google Scholar]
- Liu H, Wei Z, Dominguez A, Li Y, Wang X, and Qi LS (2015). CRISPR-ERA: a comprehensive design tool for CRISPR-mediated gene editing, repression and activation. Bioinformatics 31, 3676–3678. [DOI] [PMC free article] [PubMed] [Google Scholar]
- Liu Y, Shao Z, and Yuan G-C (2010). Prediction of Polycomb target genes in mouse embryonic stem cells. Genomics 96, 17–26. [DOI] [PubMed] [Google Scholar]
- Mali P, Aach J, Stranges PB, Esvelt KM, Moosburner M, Kosuri S, Yang L, and Church GM (2013). CAS9 transcriptional activators for target specificity screening and paired nickases for cooperative genome engineering. Nat Biotechnol 31, 833–838. [DOI] [PMC free article] [PubMed] [Google Scholar]
- Margueron R, and Reinberg D (2011). The Polycomb complex PRC2 and its mark in life. Nature 469, 343. [DOI] [PMC free article] [PubMed] [Google Scholar]
- Mudge JM, and Harrow J (2015). Creating reference gene annotation for the mouse C57BL6/J genome assembly. Mammalian Genome 26, 366–378. [DOI] [PMC free article] [PubMed] [Google Scholar]
- Otero JJ, Fu W, Kan L, Cuadra AE, and Kessler JA (2004). β-Catenin signaling is required for neural differentiation of embryonic stem cells. Development 131, 3545– 3557. [DOI] [PubMed] [Google Scholar]
- Parnas O, Jovanovic M, Eisenhaure Thomas M., Herbst Rebecca H., Dixit A, Ye Chun J., Przybylski D, Platt Randall J., Tirosh I, Sanjana Neville E., et al. (2015). A Genome-wide CRISPR Screen in Primary Immune Cells to Dissect Regulatory Networks. Cell 162, 675–686. [DOI] [PMC free article] [PubMed] [Google Scholar]
- Robinson MD, McCarthy DJ, and Smyth GK (2010). edgeR: a Bioconductor package for differential expression analysis of digital gene expression data. Bioinformatics 26, 139–140. [DOI] [PMC free article] [PubMed] [Google Scholar]
- Sánchez-Tilló E, Lázaro A, Torrent R, Cuatrecasas M, Vaquero EC, Castells A, Engel P, and Postigo A (2010). ZEB1 represses E-cadherin and induces an EMT by recruiting the SWI/SNF chromatin-remodeling protein BRG1. Oncogene 29, 3490. [DOI] [PubMed] [Google Scholar]
- Shalem O, Sanjana NE, Hartenian E, Shi X, Scott DA, Mikkelsen TS, Heckl D, Ebert BL, Root DE, Doench JG, et al. (2014). Genome-Scale CRISPR-Cas9 Knockout Screening in Human Cells. Science 343, 84–87. [DOI] [PMC free article] [PubMed] [Google Scholar]
- Shi B, Liang J, Yang X, Wang Y, Zhao Y, Wu H, Sun L, Zhang Y, Chen Y, Li R, et al. (2007). Integration of Estrogen and Wnt Signaling Circuits by the Polycomb Group Protein EZH2 in Breast Cancer Cells. Molecular and Cellular Biology 27, 5105– 5119. [DOI] [PMC free article] [PubMed] [Google Scholar]
- Sun Z, Cao X, Jiang MM, Qiu Y, Zhou H, Chen L, Qin B, Wu H, Jiang F, Chen J, et al. (2011). Inhibition of β-catenin signaling by nongenomic action of orphan nuclear receptor Nur77. Oncogene 31, 2653. [DOI] [PMC free article] [PubMed] [Google Scholar]
- Szklarczyk D, Franceschini A, Wyder S, Forslund K, Heller D, Huerta-Cepas J, Simonovic M, Roth A, Santos A, Tsafou KP, et al. (2015). STRING v10: protein– protein interaction networks, integrated over the tree of life. Nucleic acids research 43, D447–D452. [DOI] [PMC free article] [PubMed] [Google Scholar]
- Takahashi K, and Yamanaka S (2006). Induction of Pluripotent Stem Cells from Mouse Embryonic and Adult Fibroblast Cultures by Defined Factors. Cell 126, 663–676. [DOI] [PubMed] [Google Scholar]
- Tanenbaum Marvin E., Gilbert Luke A., Qi Lei S., Weissman Jonathan S., and Vale Ronald D. (2014). A Protein-Tagging System for Signal Amplification in Gene Expression and Fluorescence Imaging. Cell 159, 635–646. [DOI] [PMC free article] [PubMed] [Google Scholar]
- The Gene Ontology Consortium (2017). Expansion of the Gene Ontology knowledgebase and resources. Nucleic acids research 45, D331–D338. [DOI] [PMC free article] [PubMed] [Google Scholar]
- Tsunemoto R, Lee S, Szűcs A, Chubukov P, Sokolova I, Blanchard JW, Eade KT, Bruggemann J, Wu C, Torkamani A, et al. (2018). Diverse reprogramming codes for neuronal identity. Nature 557, 375–380. [DOI] [PMC free article] [PubMed] [Google Scholar]
- Vierbuchen T, Ostermeier A, Pang ZP, Kokubu Y, Sudhof TC, and Wernig M (2010). Direct conversion of fibroblasts to functional neurons by defined factors. Nature 463, 1035–1041. [DOI] [PMC free article] [PubMed] [Google Scholar]
- Wang T, Wei JJ, Sabatini DM, and Lander ES (2014). Genetic Screens in Human Cells Using the CRISPR-Cas9 System. Science 343, 80–84. [DOI] [PMC free article] [PubMed] [Google Scholar]
- Wapinski Orly L., Vierbuchen T, Qu K, Lee Qian Y., Chanda S, Fuentes Daniel R., Giresi Paul G., Ng Yi H., Marro S, Neff Norma F., et al. (2013). Hierarchical Mechanisms for Direct Reprogramming of Fibroblasts to Neurons. Cell 155, 621–635. [DOI] [PMC free article] [PubMed] [Google Scholar]
- Wingender E, Dietze P, Karas H, and Knüppel R (1996). TRANSFAC: A Database on Transcription Factors and Their DNA Binding Sites. Nucleic acids research 24, 238– 241. [DOI] [PMC free article] [PubMed] [Google Scholar]
- Wisniewska MB (2013). Physiological Role of β-Catenin/TCF Signaling in Neurons of the Adult Brain. Neurochemical Research 38, 1144–1155. [DOI] [PMC free article] [PubMed] [Google Scholar]
- Xu J, Du Y, and Deng H (2015). Direct Lineage Reprogramming: Strategies, Mechanisms, and Applications. Cell Stem Cell 16, 119–134. [DOI] [PubMed] [Google Scholar]
- Yu C, Liu Y, Ma T, Liu K, Xu S, Zhang Y, Liu H, La Russa M, Xie M, Ding S, et al. (2015). Small Molecules Enhance CRISPR Genome Editing in Pluripotent Stem Cells. Cell Stem Cell 16, 142–147. [DOI] [PMC free article] [PubMed] [Google Scholar]
Associated Data
This section collects any data citations, data availability statements, or supplementary materials included in this article.
Supplementary Materials
1
2
3
4