Precise therapeutic gene correction by a simple nuclease-induced double-strand break (original) (raw)
. Author manuscript; available in PMC: 2019 Oct 3.
Published in final edited form as: Nature. 2019 Apr 3;568(7753):561–565. doi: 10.1038/s41586-019-1076-8
Abstract
Current programmable nuclease-based (e.g. CRISPR-Cas9) methods for precise correction of a disease-causing genetic mutation harness the Homology Directed Repair (HDR) pathway. However, this repair process requires co-delivery of an exogenous DNA donor to recode the sequence and can be inefficient in many cell types. Here, we show that disease-causing frameshift mutations resulting from microduplications can be efficiently reverted to the wild-type sequence simply by generating a double-strand break (DSB) near the center of the duplication. We demonstrate this in patient-derived cell lines for two diseases: Limb-Girdle Muscular Dystrophy 2G (LGMD2G)1 and Hermansky-Pudlak Syndrome Type 1 (HPS1)2. Clonal analysis of Streptococcus pyogenes Cas9 (SpyCas9) nuclease-treated LGMD2G iPSCs revealed that ~80% contained at least one wild-type allele and that this correction restored TCAP expression in LGMD2G iPSC-derived myotubes. Efficient genotypic correction was also observed upon SpyCas9 treatment of an HPS1 patient-derived B-lymphoblastoid cell line (B-LCL). Inhibition of PARP-1 (poly (ADP-ribose) polymerase) suppresses the nuclease-mediated collapse of the microduplication to the wild-type sequence, confirming that precise correction is mediated by the MMEJ (microhomology-mediated end joining) pathway. Analysis of editing by SpyCas9 and Lachnospiraceae bacterium ND2006 Cas12a (LbaCas12a) at non-pathogenic microduplications within the genome that range in length from 4 bp to 36 bp indicates that the correction strategy is broadly applicable to a wide range of microduplication lengths and can be initiated by a variety of nucleases. The simplicity, reliability and efficacy of this MMEJ-based therapeutic strategy should permit the development of nuclease-based gene correction therapies for a variety of diseases that are associated with microduplications.
Keywords: CRISPR, Cas9, gene therapy, Microhomology-Mediated End Joining, TCAP, HPS1
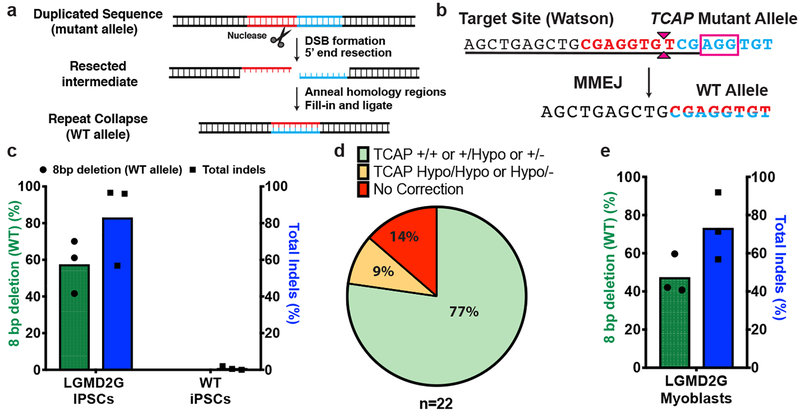
MMEJ is an error-prone DSB DNA repair pathway that uses regions of microhomology (2bp-25bp) on each side of the DSB to define the boundaries at which DNA segments are rejoined3. This mutagenic process generates deletions that result in the loss of one of the repeat sequences and the intervening region (Figure 1a). Hallmarks of MMEJ repair on DNA products generated through editing of programmable nucleases have been observed in a variety of cell types and their impact on gene inactivation rates has been appreciated4,5. The MMEJ pathway has also been harnessed for the targeted insertion of exogenous donor DNAs in mammalian cells, zebrafish and frog embryos6,7. Here, we describe a nuclease-based therapeutic approach that harnesses the MMEJ pathway to precisely correct frameshift mutations resulting from microduplications (tandem duplications). We reasoned that MMEJ-based repair of a programmable nuclease induced DSB near the center of a disease-causing microduplication would achieve precise reversion to the wild-type genomic sequence. This strategy might be an effective alternative to HDR-based gene correction approaches and would not require co-delivery of a donor DNA. Furthermore, the reverted wild-type sequence would no longer be complementary to the single-guide RNA (sgRNA) targeting the microduplication, leading to stable correction even in the presence of Cas9 nuclease.
Figure 1. MMEJ-based repair efficiently achieves precise correction of TCAP allele containing an 8bp duplication.
a. Schematic of MMEJ-based pathway for repair of a microduplication. A DSB at the center of microduplication (repeats highlighted in red and blue) is expected to initiate 5’ end resection to expose the microhomologies on each side. These repeats anneal with each other and are repaired via the MMEJ pathway to yield the wild type (WT) sequence.
b. The pathogenic 8 bp microduplication within TCAP (repeats are demarcated by bold red and blue text), where the SpyCas9 PAM sequence is demarcated in the magenta box and the protospacer sequence is underlined. A SpyCas9-induced DSB (denoted by magenta carets) is expected to drive MMEJ repair to revert the mutant allele to the wild type sequence (demarcated by half red/half blue text).
c. Graph shows percentage of 8bp deletion (green bars, plotted on the left Y-axis) and total indels (blue bars, plotted on right Y-axis) resulting from SpyCas9 RNP treatment of LGMD2G iPSCs homozygous for the 8 bp microduplication or in wild-type (WT) iPSCs. Each bar denotes the mean and dots indicate individual data points. n=3 biological replicates.
d. Pie chart showing the genotype analysis of 22 LGMD2G iPSC clones obtained after treatment with SpyCas9 RNPs. “+”, “Hypo” and “-” denote WT, hypomorphic and non-functional alleles, respectively.
e. Graph shows percentage of 8 bp deletion (green bars, plotted on the left Y-axis) and total indels (blue bars, plotted on right Y-axis) resulting from SpyCas9 treatment of myoblasts derived from patient-derived LGMD2G iPSCs. Each bar denotes the mean and dots indicate individual data points. n=3 biological replicates.
To evaluate the efficacy of our MMEJ-based correction strategy, we focused on LGMD2G and HPS1, two diseases that affect different human tissues and whose causes include pathogenic microduplications of different lengths. Both of these diseases are autosomal recessive disorders represented at modest frequencies in different human subpopulations and currently have no treatments. One of the disease alleles identified in LGMD2G patients features an 8 bp duplication in exon 1 of TCAP, a mutation that is found in the East Asian population at a frequency of ~1 in 1000 alleles. TCAP encodes the telethonin protein, a 19 kDa cardiac and striated muscle specific structural protein located in the Z-disc of sarcomeres that links titin proteins to stabilize the contractile apparatus for muscle contraction8. Homozygous or compound heterozygous inactivating mutations in TCAP manifest as severe muscle atrophy and cardiomyopathy that typically develop during late adolescence into early adulthood1,9.
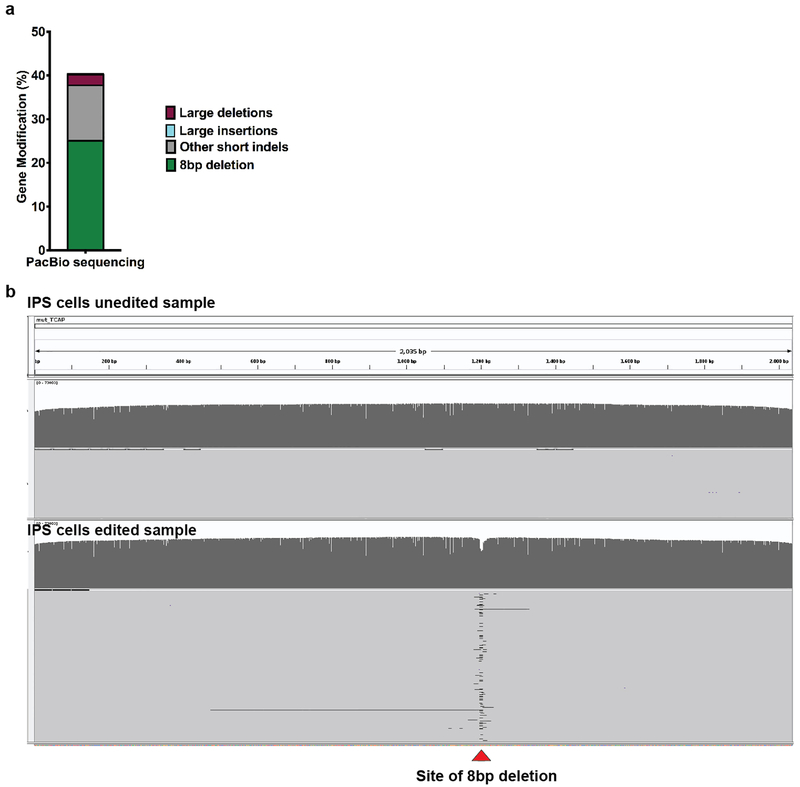
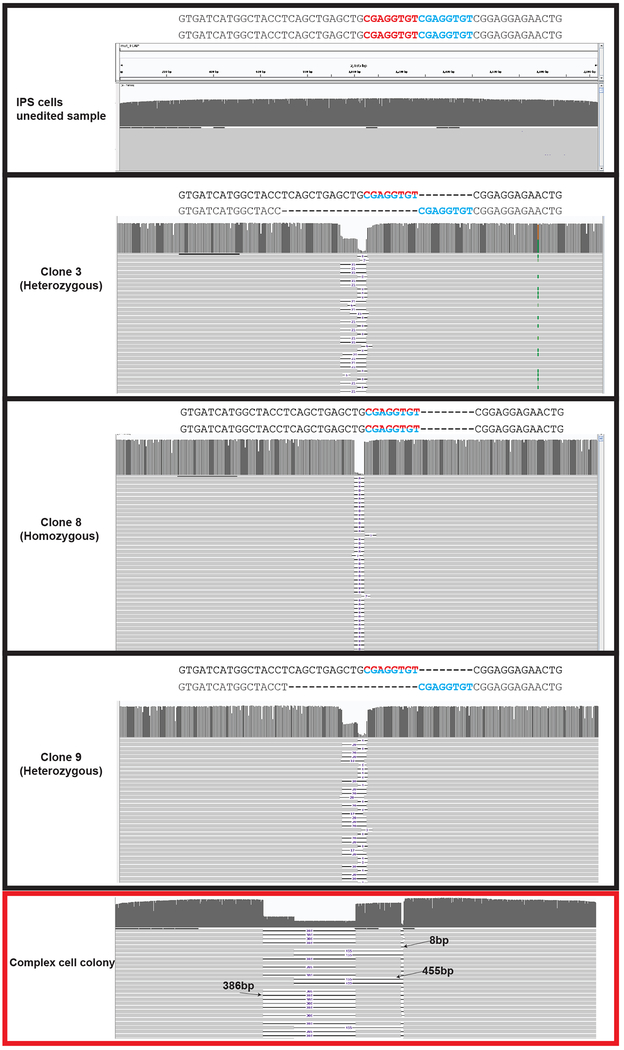
We designed and tested a sgRNA for SpyCas9 to generate a DSB one base pair away from the middle of the TCAP 8 bp microduplication (Figure 1b). Purified SpyCas9 protein was complexed with a synthetic sgRNA (RNP) and electroporated into LGMD2G patient-derived iPSCs homozygous for the TCAP microduplication. After four days, the genomic region of interest was analyzed for insertions and deletions (InDels) by deep sequencing analysis. We observed robust gene editing (~80% indel rate), indicating that the SpyCas9 RNP is efficient at generating DSBs at this site. Closer examination of the sequence variants revealed that on average ~57% of the alleles contained a precise 8 bp deletion corresponding to the wild-type allele (Figure 1c, Extended Data Figure 1a). Significantly, when introduced into wild-type cells containing functional TCAP, the SpyCas9 RNPs did not cause measurable editing at the TCAP allele, indicating that the corrected allele in the mutant cells is not subject to unintended damage following MMEJ-mediated reversion (Figure 1c). In addition to the precise 8 bp deletion, we also observed that an additional ~17% of the alleles contained in-frame mutations, and therefore may encode hypomorphic alleles with some restoration of function (Extended Data Figure 1a and 1c). Genotyping of 22 clones generated from a nuclease-treated LGMD2G iPSC population revealed that 77% contain at least one wild-type allele indicating that the vast majority of nuclease-treated cells would be phenotypically corrected (Figure 1d, Supplementary Table 1). To independently verify the duplication collapse rates observed in edited iPSCs by Illumina short-read sequencing, we sequenced a 2kb amplicon spanning the TCAP locus from a population of SpyCas9 edited iPSCs using the Pacific Biosciences long-read sequencing platform (PacBio). Analysis of these reads reveals that 67% of the edited alleles with insertions or deletions < 100 bp in length correspond to the 8 bp collapse, which is similar to the 73% rate of 8 bp collapse determined by Illumina sequencing for this sample (Extended Data Figure. 2; Supplementary Table 2). Kosicki _et al._ demonstrated that treatment of cells with Cas9 nuclease can produce large deletions (>100 bp) at the target locus at a modest frequency10. Consistent with their findings, our PacBio analysis reveals the presence of large deletions (100–1000bp) that would not have been detected by Illumina sequencing at a frequency of ~2% in bulk edited iPSCs. We also isolated a genotypically complex iPS cell colony that harbored two large deletions at the TCAP locus (Extended Data Figure. 3).
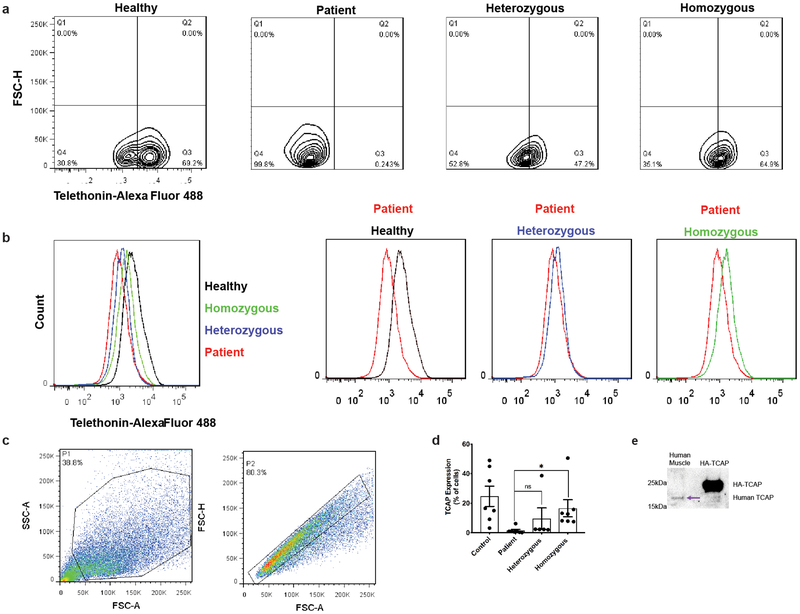
To demonstrate the translatability of our approach to muscle cell types, we differentiated the LGMD2G iPSCs into proliferative skeletal myoblasts that can be induced to terminally differentiate into myotubes11. iPSC-derived myoblasts can repair damaged muscle similar to myogenic satellite cells (one of the primary targets of gene therapy for myopathies). Myoblasts were electroporated with SpyCas9 RNPs programmed to target the 8 bp microduplication. Following editing, about 45% of the alleles were precisely repaired back to the wild-type sequence (Figure 1e, Extended Data Figure. 1b and 1d). Immunostaining of myotubes derived from corrected LGMD2G iPSC clones with an anti-telethonin antibody showed that genetic correction restored telethonin expression (Extended Data Figure. 4). Collectively, these data show that introducing a DSB close to the center of microduplication can efficiently achieve precise in vitro correction of the 8 bp microduplication associated with LGMD2G in iPSCs and in myoblasts that mimic cell populations that would be therapeutically targeted in vivo.
We further tested our approach on a 16 bp pathogenic microduplication in exon 15 of HPS1 associated with Hermansky-Pudlak Syndrome Type I (HPS1), which leads to the production of a truncated protein responsible for this autosomal recessive disease12. HPS1 has a high prevalence in the Puerto Rican population with approximately 1 in 21 carrier rate in the northwest region2. HPS proteins are involved in the biogenesis of lysosome-related organelles complexes (BLOCs), which are necessary for the proper trafficking of cargo to melanosomes, dense granules and lysosomes13. HPS1 patients suffer from albinism, bleeding disorders, vision loss and progressive pulmonary fibrosis, which leads to premature mortality14.
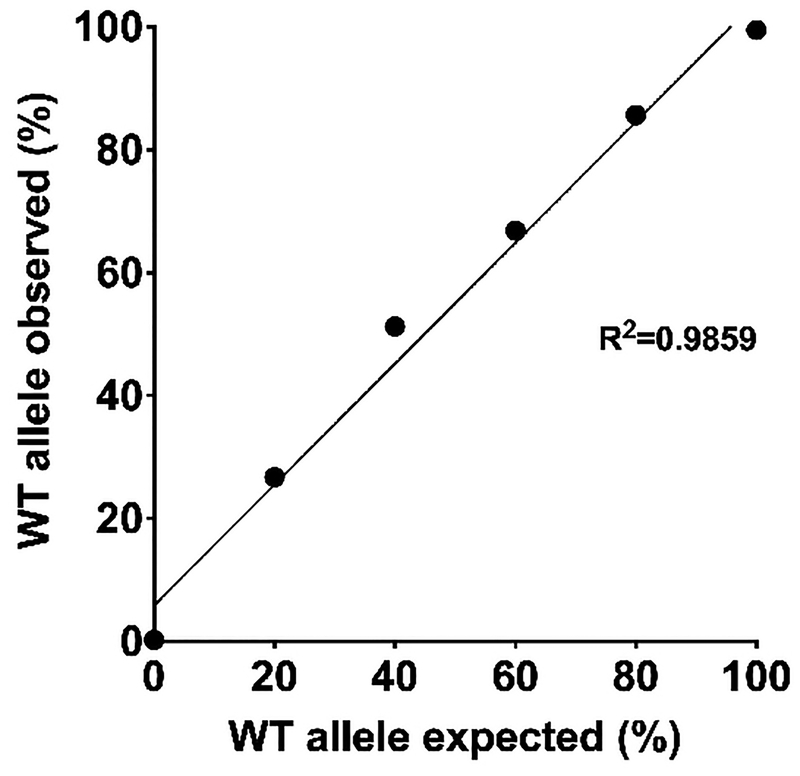
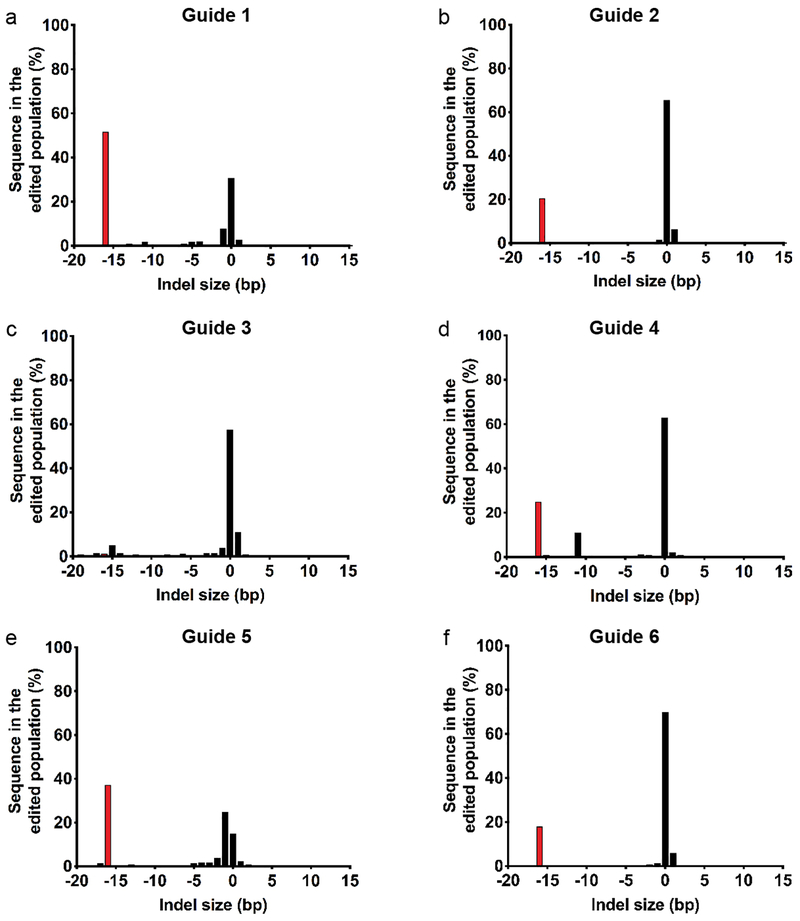
We tested the efficiency of gene correction in patient-derived B lymphocytes (B-LCL) homozygous for the 16 bp microduplication by electroporating these cells with SpyCas9 RNPs programmed to cleave two base pairs away from the center of the microduplication. (Target Site 1; Figure 2a). To accurately assess the observed editing rates, we added unique molecular identifiers (UMIs) to our PCR amplicons during Illumina library construction to allow the removal of any amplification bias15. We confirmed that this approach accurately captures the relative percentage of HPS1 microduplication and WT alleles present in a series of test populations (Extended Data Figure 5). At HPS1 Target site 1, we observed editing at ~46% of the alleles with ~35% restored to the wild-type sequence (Figure 2b and 2c, Supplementary Table 2). We further examined the impact of the position of the DSB within the microduplication on the efficiency of MMEJ-mediated repair by designing five additional sgRNAs that target the DSB to different positions relative to the center of the microduplication (Target Sites 2–6, Figure 2a). Our results show that as the break site was shifted further away from the center, there was a decrease in the efficiency of achieving the precise 16 bp deletion (Figure 2b and 2c). However, Target sites 3 and 6 were notable exceptions to this trend. Target site 3 proved to be quite efficient at generating indels to the exclusion of the 16 bp deletion (Extended Data Figure 6), likely because the wild-type sequence, once regenerated, can also be targeted by this sgRNA for further mutagenesis. On the other hand, Target site 6 achieved efficient deletion of the 16 bp microduplication (>50% of the modified alleles), despite being the most distal of the cleavage sites (10 bp away from the center of the microduplication). Its efficiency may be due to the extended regions of homology present surrounding the cleavage site at this end of the microduplication (Target Site 6; Figure 2a). Overall, these results demonstrate that the cleavage position within the microduplication and presence of alternate regions of microhomology can influence the production of the desired wild-type end product (Figure 2c).
Figure 2. MMEJ-based repair efficiently achieves precise correction of HPS1 allele containing 16bp microduplication.
a. The 16 bp microduplication repeats are demarcated by bold red and blue text. For six SpyCas9 guides targeting the microduplication, PAM sequence is demarcated in the magenta box and the protospacer sequence is underlined. A DSB (magenta carets with distance from the repeat center indicated) is expected to drive reversion to the wild type sequence indicated by half red/half blue text. Sequence underlined with red and blue bold lines in Target site 6 indicates an alternate 16 bp microhomology within this repeat.
b. Graph shows the percentage of 16 bp deletions (green) and total indels (blue) for guides shown in Figure 2a based on UMI-based Illumina sequencing. Each bar denotes the mean and dots indicate individual data points. n=3 biological replicates.
c. Plot of percentage of wild-type reverted alleles (16 bp deletion) among all alleles with insertions or deletions (indels) from Figure 2b. Each value corresponds to the mean ± s.e.m and dots indicate individual data points. n=3 biological replicates.
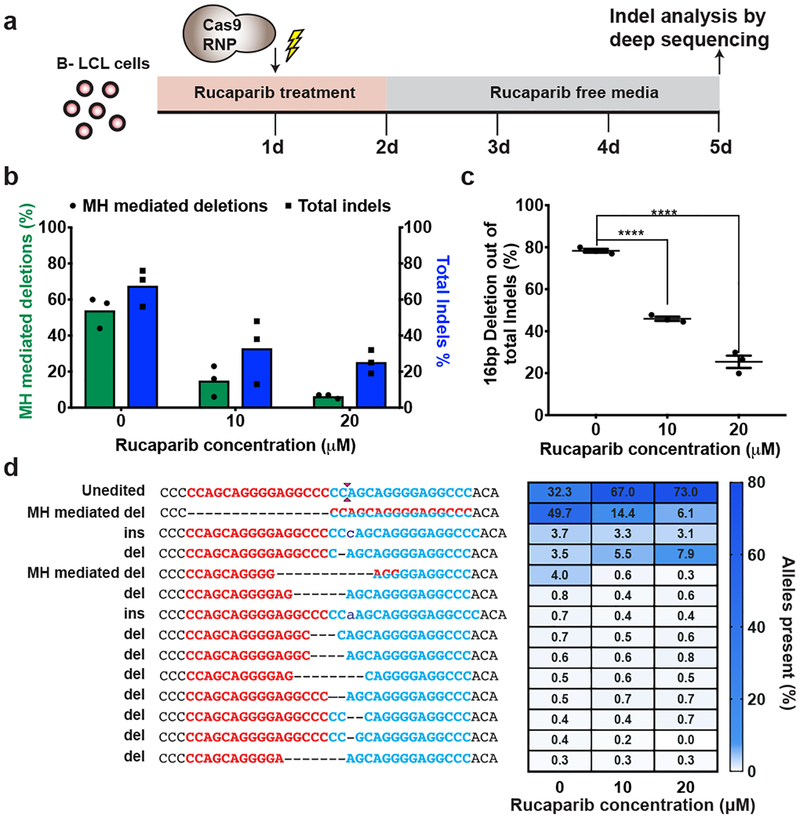
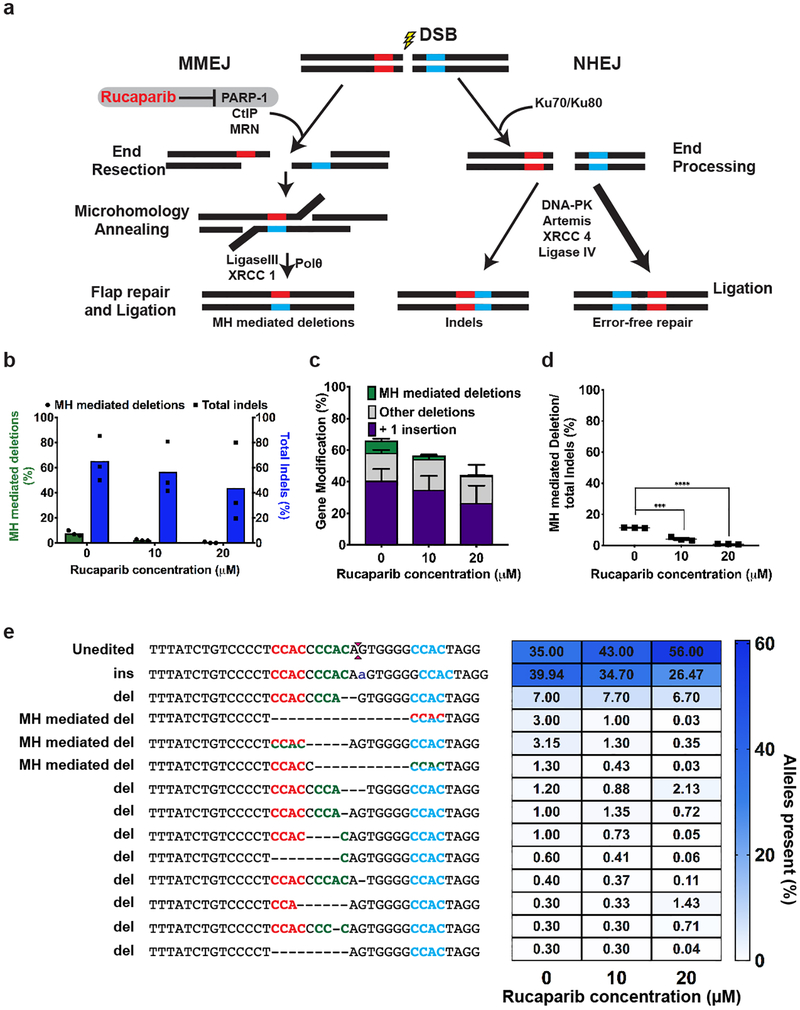
To examine if nuclease-mediated collapse of a microduplication occurs via the MMEJ pathway, we inhibited a DNA repair factor – PARP-1 – that regulates DSB flux through this pathway. PARP-1 influences the repair of a DSB through resection-dependent DNA repair pathways, such as MMEJ3,16, which are in competition with the non-homologous end joining pathway (NHEJ) for DSB repair (Extended Data Figure 7a)17. Inhibition of PARP-1 catalytic activity by rucaparib reduces DSB flux through the MMEJ pathway, resulting in fewer microhomology-based deletion products in the resulting repair events18 (Extended Data Figure 7a). Patient-derived HPS1 B-LCL cells were treated with 10μM or 20μM rucaparib prior to and after SpyCas9 RNP treatment to suppress MMEJ mediated repair of DSBs (Figure 3a). We observed an overall reduction in editing rates at the HPS1 locus upon rucaparib treatment (Figure 3b). These lower editing rates are primarily the result of a reduction in the 16 bp deletion product, which decreased from ~50% in untreated cells to ~15% and ~6% in 10μM and 20μM rucaparib treated cells, respectively (Figure 3b, 3c and 3d). We observed a similar reduction in microhomology-based deletions with SpyCas9 RNP targeting the AAVS1 locus in patient-derived HPS1 B-LCL cells (Extended Data Figure. 7). Collectively, our data show that the MMEJ pathway underlies the robust correction of the microduplications for LGMD2G and HPS1 in the presence of a targeted DSB.
Figure 3. PARP-1 inhibition decreases efficiency of MMEJ-based repair.
a. Schematic of experimental design. HPS1 B-LCL cells were treated with Rucaparib 24 hours prior to and after electroporation with SpyCas9 RNPs targeting HPS1 locus and collected for subsequent UMI-based Illumina sequencing15.
b. Graph shows percentage of microhomology (MH) mediated deletion (green) and total indels (blue) observed in cells treated with SpyCas9 in the presence of 0, 10 and 20μM rucaparib based on UMI-based Illumina deep sequencing. Each bar denotes the mean and dots indicate individual data points. n=3 biological replicates.
c. Graph shows the percentage of MH mediated deletion alleles among all other alleles with indels from Figure 3b. Each value corresponds to the mean ± s.e.m. n=3 biological replicates. “****” indicates P value = 0.00003 calculated using unpaired two tailed t-test (Supplementary Table 9).
d. (Left) Alignment of resulting sequences observed by Illumina sequencing upon SpyCas9 RNP treatment of HPS1 B-LCL cells. (Right) Heatmap plot depicts the percentage of alleles generated by SpyCas9 for cells exposed to 0, 10 and 20μM rucaparib. The gradient scale (blue) indicates the percentage occurrence of that sequence (range 0 to 80).
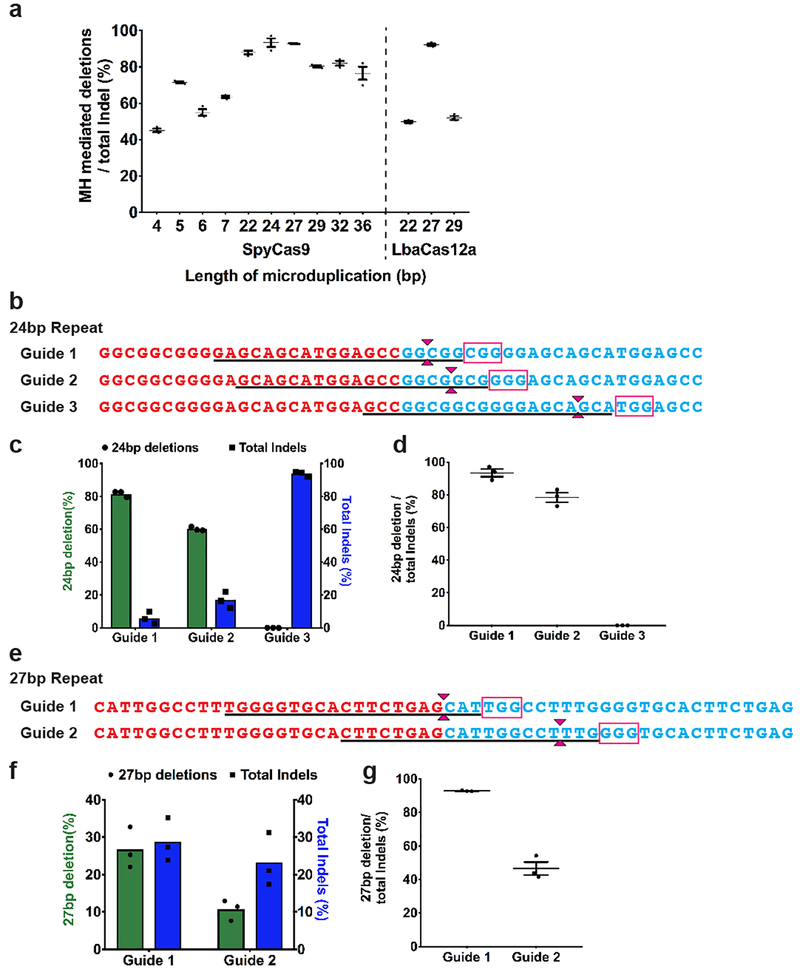
To test the generality of this MMEJ-based repair approach and the range of sequence lengths over which duplication collapse is efficient, we evaluated the editing products generated by SpyCas9 targeting endogenous microduplications within the human genome. We performed a bioinformatic analysis to identify non-pathogenic, unique endogenous microduplications ranging from 4 bp to 36 bp in length in the human genome (Figure 4a). We examined the efficiency of microduplication collapse resulting from a SpyCas9 produced DSB at the center of the microduplications in HEK 293T cells at these sites. Although the bulk editing rate varied across these target sites, we consistently observed that duplication collapse was the major end-product within the edited alleles (ranging from 45 to 93%) regardless of the microduplication length (Figure 4b and Extended data Figure 8a). Consistent with the analysis at the HPS1 locus, we observed a decrease in the duplication collapse efficiency for 24 and 27 bp long microduplications as cut sites were moved away from the center (Extended Data Figure 8b–g).
Figure 4. MMEJ-based approach efficiently achieves precise collapse of endogenous microduplications across various repeat lengths.
a. Schematic of non-pathogenic endogenous microduplications ranging in size of 4 bp to 36 bp. The microduplication repeats are demarcated by bold red and blue text. The SpyCas9 PAM sequence is demarcated in the magenta box while the LbaCas12a PAM sequence is demarcated in the orange box. Anticipated DSB produced by SpyCas9 and LbaCas12a is denoted by magenta and orange carets, respectively.
b. Graph shows percentage of the MH mediated deletion (green) and total indels (blue) produced at each endogenous site following SpyCas9 treatment based on UMI-based Illumina sequencing. Each bar denotes the mean and dots indicate individual data points. n=3 biological replicates.
c. Graph shows percentage of the MH mediated deletions (green) and total indels (blue) produced at three endogenous sites when treated with SpyCas9 or LbaCas12a. Each bar denotes the mean and dots indicate individual data points. n=3 biological replicates.
While SpyCas9 generates blunt DSBs, the type V CRISPR-Cas nuclease Cas12a generates DSBs with 5’ overhangs19. We examined if LbaCas12a generated breaks might be preferentially repaired by a resection-dependent pathway such as MMEJ by comparing the efficiency of microduplication collapse engendered by SpyCas9 and LbaCas12a nucleases at three endogenous sites. Efficient repeat collapse (50–90% of edited alleles) could be achieved with LbaCas12a at all three of these sites with efficiencies similar to SpyCas9 (Figure 4c and Extended Data Figure 8a). Overall, these data demonstrate that the MMEJ-based editing approach can be used to efficiently collapse microduplications up to lengths of at least 36 bp using either Cas9 or Cas12a programmable nucleases.
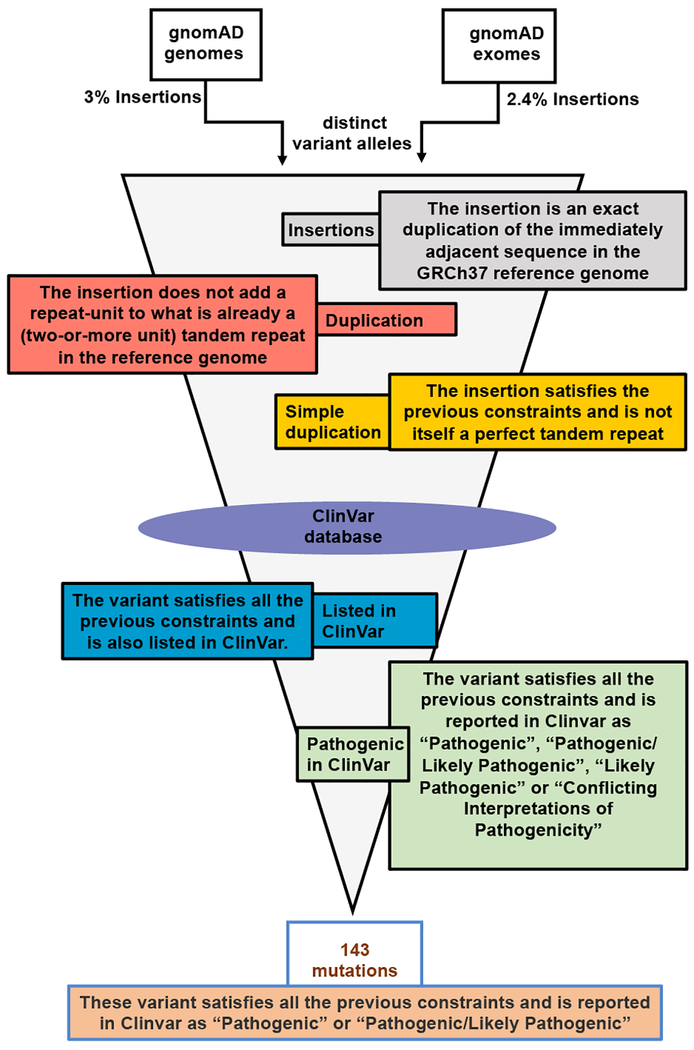
To investigate the potential of this MMEJ-based therapeutic strategy to be applied more broadly to correct human genetic disorders, we performed a bioinformatic analysis to gauge the prevalence of disease-causing microduplications in human populations. The ClinVar database20 includes ~4700 duplications that are annotated as “pathogenic” or “pathogenic/likely pathogenic” (Extended Data Figure 10a). We focused on duplications of lengths ranging from 2–40 bp because our data indicate that microhomologies within this range can be precisely repaired via the MMEJ pathway (Figure 4). We also focused on “simple” duplications – those for which the duplicated sequence is not part of a more complex repeat structure – to improve odds that the primary homology-based collapse would result in the desired wild-type sequence. Finally, we examined all duplications in “coding” regions (mainly exons plus 50 flanking bases) from the gnomAD exome and genome sequencing databases21 to prioritize pathogenic duplications based on their frequencies in human populations (Extended Data Figure 9 and Extended Data Figure 10a). Our analysis yielded 143 likely disease-causing microduplications of lengths 2–40 bp that were observed at least once in gnomAD (Extended Data Figure 10b), some of which occur in specific subpopulations at substantial frequencies (e.g. Tay-Sachs Disease, Supplementary Table 3).
To facilitate the utilization of our bioinformatics analysis, we have created an interactive, searchable webtool (https://rambutan.umassmed.edu/duplications/). This analysis also included the identification of potential Cas9 and Cas12a cleavage sites22 within these microduplications (Supplementary Table 3 and expanded tables on-line). As shown by our guide “tiling” data across the HPS1 microduplication and endogenous microduplication sites, the position of the DSB break within the duplication, as well as a guide design that avoids cleavage of the wild-type allele, is critical for efficient, stable collapse of microduplications. Rapid advances are being made in characterizing nucleases with alternate specificities23,24 and in engineering nucleases with alternate or expanded recognition preferences25–27, which will make correction of disease causing microduplications even more effective using the MMEJ based approach.
DSBs at most genomic sites (e.g. AAVS1, Extended Data Fig. 7) are repaired primarily through the NHEJ pathway, which can produce small insertions or deletions during imprecise repair28. Our data spanning DSBs in twelve sequences indicate that microduplications are preferentially repaired via the MMEJ pathway, which yields a predictable and efficient collapse. For this class of pathogenic mutations, precise repair via the MMEJ pathway provides a favorable alternative to homology directed repair, which is inefficient in many cell types29. In agreement with our findings, Shen et. al recently published the efficient correction of the pathogenic microduplication associated with HPS1 using MMEJ mediated repair30. While using allele frequencies from gnomAD can help in prioritizing potential targets for our MMEJ-based repair approach, this underestimates the extent of genetic diseases – particularly dominant ones – caused by microduplications (see Supplementary Discussion Text). As genomic and phenotypic data for the human population continue to accrue, we are likely to discover new pathogenic microduplications that can be corrected using this MMEJ-based approach. While the molecular mechanisms and cell-type specific efficiencies of the MMEJ pathway remain to be completely elucidated, our findings lay the foundation for pursuing MMEJ-based therapeutic approaches for LGMD2G and HPS1 and a broader spectrum of other microduplication-based diseases.
Online only Methods
Human Subjects.
Cells for reprogramming TCAP iPSC lines were recovered from a skin biopsy of a consented LGMD2G subject under a UMMS-IRB approved protocol and assigned a de-identified ID number unlinked to the subject’s medical record. Consenting includes conditions for sharing de-identified samples and information with other investigators. No PHI will be shared at any time per HIPAA guidelines.
Cell culture
LGMD2G primary dermal fibroblasts were isolated from the skin biopsy of the consenting LGMD2G subject according to established methods31.
Fibroblasts were reprogrammed using the CytoTune 2.0 iPS Sendai Virus Reprogramming Kit (Thermo) according to Manufacturer’s directions. Clonal lines were expanded for 6–10 passages before banking. Immunostaining was performed to confirm absence of Sendai virus and expression of OCT4. Human iPSCs were cultured in iPS-Brew XF medium (Miltenyi Biotec) and passaged every 3–5 days with Passaging Solution (Miltenyi Biotec) according to Manufacturer’s directions.
Myoblasts were induced from iPSCs using a modification of the Genea Biocells protocol11. Following generation of differentiated myotubes as described, cells were reseeded and cultured in human primary myoblast medium32. CD56+ cells were purified by FACS using an anti-CD56-APC antibody (BD Biosciences) or MACS (Miltenyi Biotec) according to Manufacturers’ directions. Myogenicity was confirmed by immunostaining myoblast and myotube cultures using the mouse monoclonal antibodies MyoD clone 5.8 (Dako) and MF20 (DSHB) (data not shown).
A lymphoblastoid cell line from B lymphocytes (B-LCL) derived from an HPS1 patient-homozygous for the 16 bp microduplication was purchased from Coriell (Catalog GM14606). The cell line was cultured following the recommended procedure using RPM1 1640 with 2mM L-Glutamine, 15% FBS and 1% Pen/Strep.
HEK293T cells were cultured following the recommended procedure using DMEM, 10% FBS and 1% Pen/Strep.
All cultures were maintained in a humidified incubator with 5% CO2 at 37°C.
SpyCas9 and LbaCas12a purification
Protein purification for 3xNLS-SpCas9 and LbaCas12a-2xNLS followed a common protocol. The generation and characterization of the 3xNLS-SpCas9 (Addgene #114365) and LbaCas12a-2xNLS (Addgene #114366) constructs have been recently described (Wu et al. Nature Medicine under review & Liu et al. Nucleic Acids Research under review). The pET21a plasmid backbone (Novagen) is used to drive the expression of a hexa-His tagged version of each protein. The plasmid expressing 3xNLS-SpCas9 (or LbaCas12a-2xNLS) was transformed into E. coli Rosetta (DE3)pLysS cells (EMD Millipore) for protein production. Cells were grown at 37°C to an OD600 of ~0.2, then shifted to 18°C and induced at an OD600 of ~0.4 for 16 hours with IPTG (1 mM final concentration). Following induction, cells were pelleted by centrifugation and then resuspended with Nickel-NTA buffer (20 mM TRIS pH 7.5 + 1 M NaCl + 20 mM imidazole + 1 mM TCEP) supplemented with HALT Protease Inhibitor Cocktail, EDTA-Free (100X) [ThermoFisher] and lysed with M-110s Microfluidizer (Microfluidics) following the manufacturer’s instructions. The protein was purified from the cell lysate using Ni-NTA resin, washed with five volumes of Nickel-NTA buffer and then eluted with elution buffer (20 mM TRIS, 500 mM NaCl, 500 mM Imidazole, 10% glycerol, pH 7.5). The 3xNLS-SpCas9 (or LbaCas12a protein) was dialyzed overnight at 4°C in 20 mM HEPES, 500 mM NaCl, 1 mM EDTA, 10% glycerol, pH 7.5. Subsequently, the protein was step dialyzed from 500 mM NaCl to 200 mM NaCl (Final dialysis buffer: 20 mM HEPES, 200 mM NaCl, 1 mM EDTA, 10% glycerol, pH 7.5). Next, the protein was purified by cation exchange chromatography (Column = 5ml HiTrap-S, Buffer A = 20 mM HEPES pH 7.5 + 1 mM TCEP, Buffer B = 20 mM HEPES pH 7.5 + 1 M NaCl + 1 mM TCEP, Flow rate = 5 ml/min, CV = column volume = 5ml) followed by size-exclusion chromatography (SEC) on Superdex-200 (16/60) column (Isocratic size-exclusion running buffer = 20 mM HEPES pH 7.5, 150 mM NaCl, 1 mM TCEP for 3xNLS-SpCas9 [or 20 mM HEPES pH 7.5, 300 mM NaCl, 1 mM TCEP for LbCpf1–2xNLS]). The primary protein peak from the SEC was concentrated in an Ultra-15 Centrifugal Filters Ultracel-30K (Amicon) to a concentration around 100 μM based on absorbance at 280nm. The purified protein quality was assessed by SDS-PAGE/Coomassie staining to be >95% pure and protein concentration was quantified with Pierce™ BCA Protein Assay Kit (ThermoFisher Scientific). Protein was stored at -80°C until further use.
In vitro transcription (IVT) of guide RNAs
The DNA cassette containing the U6 promoter and the sgRNA framework for SpyCas9 was cloned from pLKO1-puro vector33 into pBluescript SK II+ backbone (Liu et al. in revision Nucleic Acids Research). Plasmids expressing each guide RNA from U6 promoter were constructed by annealing oligonuleotides encoding guide RNA and cloning it into BfuAI cleavage sites this vector (Supplementary table 4). Templates for in vitro transcription of SpyCas9 guides were amplified from the cognate plasmids using NEB Q5 High-Fidelity DNA Polymerase for 30 cycles (98°C, 15s; 65°C 25s; 72°C 20s) using primer sets designed to include the T7 scaffold (Supplementary Table 5). For crRNA generation for LbaCas12a, templates for in vitro transcription were generated by PCR amplification of oligonucleotides designed to include the T7 scaffold along with the guide RNA and a 15-mer overlap sequence to allow annealing between the oligos (Supplementary Table 8). The oligonucleotides encoded the full length direct repeat crRNA sequence (Liu et al. Nucleic Acids Research under review). Thirty cycles of amplification were conducted using NEB Q5 High-Fidelity DNA polymerase (98°C, 15s; 60°C 25s; 72°C 20s). The PCR products were purified using Zymo DNA Clean & Concentrator Kit (Zymo Cat. #D4005). IVT reactions were performed using the HiScribe T7 High Yield RNA Synthesis Kit using 300ng of PCR product as template (NEB Cat. #E2040S). After an incubation for 16 hours at 37°C, samples were treated with DNase I for 40 mins at 37°C to remove any DNA contamination. Each guide RNA was purified using the Zymo RNA Clean and Concentrator Kit. Final RNA concentration was measured using Nanodrop and stored at -80°C until further use.
Electroporation of cell lines with SpyCas9 RNPs
3xNLS-SpyCas9 protein was precomplexed with sgRNAs either purchased from Synthego or made in-house by T7 transcription (Supplementary Table 6) and electroporated into cells using the Neon transfection system (Thermo Fisher).
Electroporation of IPSCs:
After washing with PBS, iPSCs were dissociated into single cells with 3:1 TrypLE:0.5 mM EDTA and neutralized with Ham’s F10+20% FBS. To form RNP complexes, 20 pmol 3xNLS-SpyCas9 protein and 25 pmol gRNA were combined in 10 μl Neon Buffer R and incubated for 10 minutes at RT. 1×10⁵ iPSCs were resuspended in 10 μl RNP-Buffer R mix and then nucleofected as follows: Pulse Voltage=1500 V, Pulse Width=20 ms, Pulse Number=1. After transfection, the cells were plated onto Matrigel-coated 24-well plates with iPS Brew XF supplemented with 10 μM Y27632 for expansion and grown in a humidified incubator at 37°C and 5% CO2, for 4 days before harvesting them for analysis. iPSC derived myoblasts were electroporated using two pulses of 1400V and 20ms width and plated onto 24 well dish containing pre-warmed antibiotic-free human primary myoblast growth medium and cultured for four to six days before harvesting them for analysis.
Electroporation of HPS1 patient derived B-LCL cells:
40 pmol of 3xNLS-SpyCas9 protein was precomplexed with 50 pmol of sgRNA in buffer R for 10–20 minutes at room temperature in a final volume of 12μl. 300,000 cells per reaction were resuspended in 10μl of RNP-buffer R mix and electroporated with 2 pulses of 1700V for 20ms using the 10μl tip. Cells were then plated in 24 well plates with pre-equilibrated 500μl of antibiotic free culture media and grown in a humidified incubator at 37°C and 5% CO2 for 7 days before harvesting them for indel analysis.
For the PARP-1 inhibition experiments, 300,000 HPS1 patient-derived B-LCL cells were treated with 10μM and 20μM rucaparib camsylate (Sigma-Aldrich PZ0036) in standard growth media for 24 hours. Treated cells were electroporated with SpyCas9 RNPs following previously described protocol. Following another 24 hour incubation in rucaparib containing media, cells were resuspended in PARP-1 inhibitor-free media and harvested for analysis after 7 days.
Electroporation of HEK293T cells:
20pmol of 3xNLS-SpyCas9 protein and 25pmol of in vitro transcribed sgRNA were pre-complexed in buffer R for 10–20 minutes at room temperature. 100,000 cells per reaction were resuspended in 10μl of RNP-buffer R mix and nucleofected with SpyCas9 guide RNA complex using 2 pulses of 1150V for 20ms using the 10μl tip. Cells were then plated in 24 well plates with pre-equilibrated 500μl of antibiotic free culture media and grown for 3 days before harvesting for analysis. For Cas12a editing experiments at endogenous microduplications, 80pmol of LbaCas12a protein was pre-complexed with 100pmol of in vitro transcribed crRNA. 100,000 cells per reaction were nucleofected as described previously.
Indel analysis by TIDE
Genomic DNA was extracted from HEK293Ts using GenElute™ Mammalian Genomic DNA Miniprep Kit (Sigma Aldrich**)** by following manufacturer’s instructions. DNA region containing the 24 bp microduplication was amplified using genomic DNA as template and primers listed in Supplementary Table 7 using NEB Q5 High-Fidelity DNA Polymerase (98°C, 15s; 67°C 25s; 72°C 20s) x30 cycles. Subsequently, PCR product was purified using The DNA Clean & Concentrator™-5 kit (Zymo research) and sequenced. The Sanger sequencing trace data were analyzed using TIDE webtool at https://tide.nki.nl/ to infer the composition of indels created at the site of DSB34.
Library construction for Illumina deep sequencing
Library construction for deep sequencing was performed using a modified version of our previously described protocol26. Briefly, iPSCs and myoblasts were harvested following nuclease treatment and genomic DNA was extracted with the GenElute Mammalian Genomic DNA Miniprep Kit (Sigma G1N350). Genomic loci spanning the target sites were PCR amplified with locus-specific primers carrying tails complementary to the TruSeq adapters (Deepseq_TCAP_primer_fwd & Deepseq_TCAP_primer_rev; Supplementary Table 8). 50 ng input genomic DNA was PCR amplified with Q5 High-Fidelity DNA Polymerase (New England Biolabs): (98°C, 15s; 67°C 25s; 72°C 20s) x30 cycles. Next, 0.1 μl of each PCR reaction was amplified with barcoded primers to reconstitute the TruSeq adaptors using the Q5 High-Fidelity DNA Polymerase (New England Biolabs): (98°C, 15s; 67°C, 25s; 72°C, 20s) x10 cycles. Products were qualitatively analyzed by gel electrophoresis. Equal amounts of the products were pooled and gel purified using QIAquick Gel Extraction Kit (Qiagen Cat. #28704). The purified library was deep sequenced using a paired-end 150bp Illumina MiSeq run.
Illumina deep sequencing analysis
MiSeq data analysis was performed using Unix-based software tools. First, we employed FastQC35 (version 0.11.3) to determine the quality of paired-end sequencing reads (R1 and R2 fastq files). Next, we used paired end read merger (PEAR; version 0.9.8)36 to pool raw paired-end reads and generate single merged high-quality full-length reads. Reads were then filtered according to quality via FASTQ37 for a mean PHRED quality score above 30 and a minimum per base score above 24. After that, we used BWA (version 0.7.5) and SAMtools (version 0.1.19) for aligning each group of filtered reads to a corresponding reference sequence. To determine lesion type, frequency, size and distribution, all edited reads from each experimental replicate were combined and aligned, as described above. Lesion types and frequencies were then cataloged in a text output format at each base using bam-readcount. For each treatment group, the average background lesion frequencies (based on lesion type, position and frequency) of the triplicate negative control group were subtracted to obtain the nuclease-dependent lesion frequencies.
Library construction for UMI-based Illumina deep sequencing.
The construction of the UMI-based library utilized a linear amplification step to incorporate UMIs within the amplicons from the target locus15. HPS1 B-LCL cells and HEK293Ts were harvested following nuclease treatment for genomic DNA extraction using the GenElute Mammalian Genomic DNA Miniprep Kit (Sigma G1N350). Randomized unique molecular identifiers (UMIs) were incorporated within the 5’ locus-specific primers carrying tails complementary to TruSeq adaptors (Supplementary Table 8). Briefly, 50ng of input genomic DNA was linear amplified with NEB Q5 High-Fidelity DNA Polymerase (98°C, 15s; 67°C 25s; 72°C 20s) for 10 cycles using the 5’ locus-specific primer with TruSeq adapter conjugated with a UMI sequence. Next a 5’ constant primer along with the 3’ locus-specific primer with TruSeq adapter were added and further amplified for 30 cycles. Indexes were then incorporated using barcoded primers to diluted PCR products using NEB Q5 High-Fidelity DNA Polymerase (98°C, 15s; 67°C 25s; 72°C 20s) for 10 cycles. Products were qualitatively analyzed by gel electrophoresis. Equal amounts of the products were pooled and gel purified using QIAquick Gel Extraction Kit (Qiagen Cat. #28704) for DNA recovery. The purified library was deep sequenced using a paired-end 150bp Illumina MiSeq run.
UMI-based Deep Sequencing Analysis
We adapted the analysis of the UMI-tagged deep sequencing reads from our previous protocol15. Initially, BWA (version 0.7.5) and SAMtools (version 0.1.19) were used for aligning each group of filtered merged-read pairs to a corresponding reference sequence ignoring the unique molecular barcodes. Next, we used a custom Python and PySAM script to process mapped reads into counts of UMI-labeled reads for each target. The mapped reads were filtered by requiring a mapping value (MAPQ) larger than 30. Alignments were categorized into different categories of indels using VarScan 238. Next, we identified UMI duplicates and the minimal set of amplicons that can account for the full set of reads with unique UMIs. For each unique UMI, a minimum of five observations of the same sequence was required to consider the sequence to have a low likelihood of being an artifact (sequencing error in the UMI element). For sequences meeting this threshold, all common sequences associated with the UMI were consolidated to one read for analysis of the distribution of sequence modifications that are present at a locus. The resulting UMIs number tables that describe the type of each sequence modification and its length were concatenated and loaded into GraphPad Prism 7 for data visualization. Microsoft Excel version 16.21.1 was used for statistical analysis.
PacBio library preparation
Single molecule, real-time (SMRT) sequencing is modified from Pacific Biosciences (PacBio). Nuclease treated patient-derived iPSCs were harvested for genomic DNA extraction with GenElute Mammalian Genomic DNA Miniprep Kit (Sigma G1N350). Briefly, regions flanking the TCAP target site were PCR amplified using locus-specific primers (Supplementary table 8). The forward primer is designed to have barcode sequence followed by UMI and locus specific primer sequence. Reverse primer contains the barcode followed by locus specific primer sequence. 25–50ng input DNA is PCR amplified with Phusion High Fidelity DNA Polymerase (New England Biolabs): (98°C, 15s; 65°C 25s; 72°C 18s) x30 cycles. The products were qualitatively analyzed by gel electrophoresis and subsequently gel purified with QIAquick Gel Extraction Kit (Qiagen Cat. #28704). The purified products were sent to the UMASS Medical School Deep Sequencing Core for SMRTbell Library Preparation and sequencing on the Pacific Biosciences Sequel Instrument.
PacBio sequencing data analysis
For PacBio sequencing data analysis, Minimap2 (version 2.14,39) was used to align the raw Consensus_ROI (reads_of_insert.fastq) data to the 2kb reference sequence. Alignment quality control and filtering were performed using custom Perl script to remove errors and filter out alignments with poor quality. For variation calling, a custom Python script was used to extract deletions or insertions larger than 5bp for each read from the SAM files. Subsequently deletions or insertions were classified into different groups based on their length. IGV(version 2.4.16) was used for alignment visualization of the aligned reads using Quick consensus mode40.
Clonal analysis of iPSCs
Following confirmation of MMEJ-mediated correction in the population of LGMD2G iPSCs, clonal analysis was performed. Cells from the corrected population were seeded in 96-well plates in the presence of Y27632 at a frequency of 0.8 cell/well. iPSC clones were cultured for several weeks in iPS Brew XF (Miltenyi Biotec) before harvesting to perform sequence analysis by deep-sequencing.
Myoblast differentiation and detection of telethonin expression
iPSC-derived myoblasts were plated into 0.1% gelatin-coated 6-well plates at a density of 100,000 cells per well in myoblast expansion medium containing Ham’s F-10 (Cellgro) supplemented with 20% fetal bovine serum (Hyclone, SH30071.03), 1.2mM CaCl2 (EMD OmniPur 3000) and 1% chick embryo extract isolated from day 12 SPF Premium Fertilized White Leghorn Chicken Eggs (Charles River, North Franklin, CT). After 4 days of expansion, the cells were incubated with myotube differentiation medium including DMEM/F12 (Thermofisher) supplemented with 1% N2 (Thermofisher, 17502–048) and 1% insulin-transferrin-selenium (Thermofisher, 41400045). After 10 days of differentiation, the cells were dissociated into single cells with TrypLE. Subsequently the cells were fixed with 2% PFA for 15 minutes and blocked with PBS including 2% BSA, 2% horse serum, 2% goat serum and 2% Triton X-100 for 20 minutes. The cells then were incubated with anti-telethonin antibody (Santa Cruz, sc-25327, 1:50) at 4°C for 2 days and IgG goat anti-mouse secondary antibody labeled with Alexa 488 fluorophore (Invitrogen, A11017, 1:800) at room temperature for 1 hour, respectively. The cells were suspended in flow buffer (PBS including 0.2% FBS) and flow cytometry was performed using a BD FACSAria IIu (UMMS Flow Cytometry Core Lab). Roughly, 20,000 cells were included for analysis. FlowJo software (version 7.6) was used for data analysis.
Survey of microduplications in ClinVar and in human reference populations.
Annotations of pathogenicity from ClinVar (ftp://ftp.ncbi.nlm.nih.gov/pub/clinvar/vcf_GRCh37/clinvar_20180225.vcf.gz)20 were combined with annotations of allele-frequencies from gnomAD (https://console.cloud.google.com/storage/browser/gnomad-public/release/2.0.2/vcf)21 and from the 1000 Genome Project (ftp://ftp.1000genomes.ebi.ac.uk/vol1/ftp/release/20130502/)41 using the annotate function in bcftools42 (1.9), after decomposing multi-allelic sites and normalizing variants with vt43 (v0.5772) against the reference genome http://www.broadinstitute.org/ftp/pub/seq/references/Homo_sapiens_assembly19.fasta. Most analyses were restricted to the intervals in ftp://ftp.broadinstitute.org/pub/ExAC_release/release1/resources/exome_calling_regions.v1.interval_list. Insertions were extracted using vt (view -h -f “VTYPE==INDEL&&DLEN>0”); then duplications were identified, repeat units counted, internal shift-symmetries determined, and flanking genomic regions extracted using a modified version of the vt function annotate_indels. Additional processing (filtering, finding maximal allele frequencies among different populations, scanning for PAM sites, etc.) was performed using R (3.4.3), including the VariantAnnotation (1.24.5) package44.
Exact tandem repeats in the reference genome were identified using the Tandem Repeats Finder program (4.09)45 and checked for exact matches elsewhere in the genome with bwa fastmap (0.7.17)46. Examples of different lengths were manually selected to use for the tests of collapse of endogenous microduplications.
Extended Data
Extended Data Figure 1 |. Indel populations resulting from SpyCas9 editing at the TCAP locus.
a) Indel percentages resulting from SpyCas9 RNP treatment in patient-derived iPSCs homozygous for the 8 bp microduplication or in wild-type (WT) iPSCs. Each value corresponds to the mean ± s.e.m. from 3 biological replicates. b) Breakdown of indel classes resulting from SpyCas9 treatment of myoblasts derived from patient-derived LGMD2G iPSCs. Values correspond to the mean ± s.e.m. from 3 biological replicates. c) Sequence alignment of the different edited alleles resulting from SpyCas9 RNP treatment in LGMD2G iPSCs. Red and blue text indicates DNA repeats that constitute the microduplication, where the collapse is indicated by half red and half blue text. Dashes indicate deleted bases, and purple text indicates inserted bases. Data is from one biological replicate out of three independent biological replicates. d) Sequence alignment of the different edited alleles resulting from SpyCas9 RNP treatment of myoblasts derived from patient-derived LGMD2G iPSCs. Data is from one biological replicate out of three independent biological replicates.
Extended Data Figure 2 |. PacBio long-read sequencing analysis for SpyCas9 edited LGMD2G iPSCs at TCAP locus.
a) Graph shows percentage of gene modification observed from PacBio sequencing (1 replicate from Figure 1c out of three biological replicates). Percent of alleles containing the 8 bp deletion are represented in green, other small indels(<=100bp) are represented in gray, large insertions (0.14%, not visible on the graph) and deletions (>100 bp) are shown in blue and maroon respectively b) IGV graphs depicting representative reads obtained for unedited (top) and edited (bottom) LGMD2G iPSCs, spanning ~2035 bp genomic region surrounding the TCAP target site. Red Carat indicates the site of 8 bp deletion. Data represents 1 replicate out of three independent biological replicates.
Extended Data Figure 3 |. PacBio long-read sequencing analysis of SpyCas9 edited LGMD2G iPSCs clones and a complex colony at TCAP locus.
IGV graphs depicting representative reads obtained for clonal isolates of edited LGMD2G iPSCs (Figure 1d), spanning ~2035 bp genomic region surrounding the TCAP target site. The genotype of the clones (deduced by Illumina deep sequencing) is indicated beside an enlargement of the TCAP target region within the PacBio data. The sequences of the two alleles (listed above the IGV plot) obtained from sequencing are shown with repeats demarcated by red and blue texts. Alleles reverted to wild-type due to collapse of microduplication are demarcated by half red/blue text. The final panel shows IGV plot for one complex iPSC colony that appears to be nucleated by more than one cell (panel demarcated by a red box), where large deletions are present within the genome. 8bp, 386bp, and 455bp indicate deletion sizes observed.
Extended Data Figure 4 |. Detection of telethonin expression by flow cytometry in patient derived cells treated with SpyCas9.
a) Contour plots from a representative flow cytometry assay to detect telethonin expression for healthy control, patient, SpyCas9 treated homozygous and heterozygous iPS clone derived myoblasts differentiated for 10 days in culture. Plots are representative of 3 independent replicates. b) Histograms from a representative flow cytometry assay to detect telethonin expression. (Left) Overlay of anti-telethonin antibody staining for four different representative samples for different TCAP genotypes. (Right) Comparison between patient cells (TCAP-/-) and healthy control (TCAP+/+), SpyCas9 treated homozygous and heterozygous iPS clone derived myoblasts differentiated for 10 days in culture. Histograms are representative of 3 independent replicates c) The cells were selected by removing cell debris firstly as shown by Gate P1, and then single cells were selected from P1 by removing clustered cells as shown by Gate P2. The cells in Gate P2 were used for flow analysis. Plots are representative of 1 biological replicate d) Average percentage of telethonin expressing cells from two technical replicates of three biological replicates. Error bars indicate s.e.m (n=6) circles represent individual data points. p-values (0.33 for patient vs heterozygous and 0.04 for patient vs homozygous clones) were calculated via a two-sided student’s t-test (Supplementary Table 9). e) Western blot showing validation of anti-telethonin antibody (purchased from Santa Cruz Biotechnology). Human muscle lysate and lysate from HEK293T cells transfected with HA-tagged-telethonin expression construct were separated on an SDS 4–12% acrylamide gradient gel and the resulting blot was probed with SCBT anti-telethonin antibody. For gel source data, see Supplementary Figure 1.
Extended Data Figure 5 |. Standard curve generated with genomic DNA of wild-type and HPS1 mutant B-LCLs from UMI-based Illumina deep sequencing.
Genomic DNA from wild-type cells and HPS1 cells homozygous for the 16bp microduplication were mixed at different ratios (X-axis). These mixed DNAs were used for the construction of a UMI-based Illumina library to determine the ratio of the alleles through deep sequencing (Y-axis). These data are fitted to a regression line with the R2 value reported. n=1 biological replicate.
Extended Data Figure 6 |. Indel spectrum generated by SpyCas9 editing at the HPS1 locus HPS1 B-LCL cells.
Indel spectrum of SpyCas9 nuclease cells treated with different sgRNAs determined by UMI-based Illumina deep sequencing. a) Target site 1 b) Target site 2 c) Target site 3 d) Target site 4 e) Target site 5 f) Target site 6. Red bar indicates the 16 bp deletion that corresponds to the deletion of one of the microduplication repeats. Data depicts indel spectrum from one representative biological replicate out of a total three independent biological replicates.
Extended Data Figure 7 | – Effect of rucaparib on microhomology mediated deletion products profile at AAVS1 locus in patient derived HPS1 B-LCL cells.
a) Schematic of two prominent DNA double-strand break repair pathways. A DSB can be repaired through various pathways that produce different DNA sequence end-products. The NHEJ pathway is the dominant DSB repair pathway in most cells. The MMEJ pathway utilizes end-resection to discover small homologies on each side of the break that can be used to template the fusion of the broken ends. PARP-1 is an enzyme that regulates DSB flux through the MMEJ pathway. Treatment of cells with Rucaparib – an inhibitor of PARP-1 – attenuates DSB flux down the MMEJ repair pathway. b) Graph shows microhomology (MH) mediated deletions (green bars) and total indels (blue bars) resulting from SpyCas9 treatment of cells in presence of 0,10 and 20 μM rucaparib. Each bar corresponds to the mean with dots showing individual data points from 3 biological replicates based on UMI-based Illumina deep sequencing. c) Graph shows percentage of 1 bp insertions (purple), microhomology mediated deletions (green), other deletions (gray) produced by SpyCas9 RNP with a sgRNA targeting the AAVS1 locus with the addition of increasing amounts of rucaparib. Each value corresponds to the mean ± s.e.m from 3 biological replicates based on UMI-based Illumina deep sequencing. d) Graph shows the percentage of microhomology mediated deletions out of total indels observed in cells treated with SpyCas9 in the presence of rucaparib. Dots represent individual data points with mean ± s.e.m (denoted by line with error bars) from 3 biological replicates. p values were determined using two tailed unpaired t-test (Supplementary Table 9). ***p=0.0004, ****p=6.5E-07. e) (Left) Alignment of allele sequences obtained from deep sequencing analysis from samples treated with SpyCas9 RNP in the presence of different rucaparib concentrations. Microhomologies present at the AAVS1 locus are demarcated by red, green and blue text. Microhomology mediated deletion (MH mediated del) is indicated by two-toned text. Magenta carets indicate site of DSB created by SpyCas9. Inserted bases (ins) are demarcated by purple text while deleted bases (del) are demarcated by black dashes. (Right) Heatmap plot depicting the percentage of alleles generated after SpyCas9 treatment of cells in the presence of different concentrations of rucaparib (0, 10, 20μM). The blue color gradient scale ranging from 0–60 indicates the percentage of occurrence of that sequence. Heatmap represents mean values from a total of three independent biological replicates.
Extended Data Figure 8 |. SpyCas9 and LbCas12a editing at endogenous microduplications.
a) Graph shows the percentage of microhomology mediated deletions out of total indels at endogenous sites observed in cells treated with SpyCas9 and LbaCas12a. Dots represent individual data points with mean ± s.e.m (denoted by line with error bars) from 3 biological replicates. b) Schematic of endogenous site containing a 24 bp microduplication for SpyCas9 target sites 1 through 3. The 24 bp microduplication repeats are demarcated by bold red and blue text. The PAM sequence is demarcated in the magenta box and the protospacer sequence is underlined. Magenta carets demarcate the site of DSB. c) Graph shows the percentage of alleles with 24 bp deletion (green) and total indels (blue) for all three guides from TIDE analysis. Guide 3 produces primarily 23 bp deletions, but not 24 bp deletions likely because it recuts the collapsed DNA sequence. Bars shows the mean from n=3 biological repeats, individual data points are represented by dots. d) Graph shows the proportion of the 24 bp deletion out of total indels as individual data points (represented by dots). The mean is represented by a line with error bars (s.e.m). n=3 biological repeats. e) Schematic of endogenous site containing a 27 bp microduplication for SpyCas9 target sites 1 and 2. f) Graph shows the percentage of alleles with 27 bp deletion (green) and total indels (blue) for all two guides from UMI-based Illumina deep sequencing. Bars shows the mean from n=3 biological repeats, individual data points are represented by dots. g) Graph shows the proportion of the 27 bp deletion out of total indels as individual data points (represented by dots). The mean is represented by a line with error bars (s.e.m). n=3 biological replicates.
Extended Data Figure 9 |. Bioinformatics pipeline for identifying the disease alleles.
Schematic describes the bioinformatics pipeline used to identify all microduplications amendable to efficient MMEJ mediated collapse from the “coding” regions (exome_calling_regions.v1; mainly exons plus 50 flanking bases) in the gnomAD genome and exome databases (version 2.0.2). Insertion variants observed in both databases were used for analysis (variants occurring in both databases were counted once). Insertions that do not add a repeat-unit to an existing tandem repeat and is not itself a perfect repeat were filtered to constrain only duplications that span 2–40bp in length and are amendable to CRISPR-Cas9 targeting. This dataset was then cross-referenced against the ClinVar database (clinvar_20180225.vcf) to apply further filters for variants reported as pathogenic, which ultimately yielded 143 likely-disease causing microduplications.
Extended data 10 |. Pathogenic microduplications and their prevalence in human populations.
a) Histogram showing the number of insertion variants of length >1 bp that are annotated as “Pathogenic” or “Pathogenic/Likely pathogenic” in ClinVar. Variants are binned by length, with all those of length 40 or greater combined. The insertions (grey) are stratified into progressively finer categories: duplications (red); “simple” duplications (described in text, orange); and the subset of these observed at least once in gnomAD exome/genome databases (green). b) Histogram showing the number of insertion variants of length >1 bp that are observed at least once in the “coding” regions of the gnomAD exome/genome databases. As above, the insertions (grey) are stratified into progressively finer categories: duplications (red); “simple” duplications (orange); the subset of these listed in ClinVar (cyan); and the subset annotated as “Pathogenic” or “Pathogenic/Likely pathogenic” in ClinVar (green). (cyan and green bars not visible at this resolution.)
Supplementary Material
Reporting Summary
SI Guide
Supp Tables
Supplementary Discussion and Supplementary Figure 1
Acknowledgements:
We thank E. Kittler and the UMass Medical School Deep Sequencing Core for sequencing. We thank Dr. Lawrence Hayward, Dr. Lan Qin and Diane McKenna-Yasek, RN, BSN for coordinating patient enrollment and acquiring patient skin biopsy. We thank Dr. Zdenka Matijasevic for generating LGMD2G iPSC lines. The authors would like to thank the Genome Aggregation Database (gnomAD) and the groups that provided exome and genome variant data to this resource. A full list of contributing groups can be found at http://gnomad.broadinstitute.org/about. This work was supported in part by the National Institutes of Health (R01DK098252, R01HL131471, and R01NS088689 [C.M.]; R01AI117839, R01GM115911, R01HL093766 and U01HG007910 [S.A.W.]; U54HD0060848 [C.P.E]; a SPARK award through UL1-TR001453) and the Worcester Foundation for Biomedical Research. The content is solely the responsibility of the authors and does not necessarily represent the official views of the NIH.
Footnotes
Supplementary information
Supplementary material includes Supplementary discussion, Supplementary figure, and Supplementary tables (1 through 9).
Competing Interests
The authors declare competing interests: The authors have filed patent applications related to genome engineering technologies. S.I., S.S., D.G., J.C.J.C., C.M., O.D.K., C.P.E. and S.A.W. have filed a patent application [62/667201] on this work. The authors have no other competing interests.
Ethics Statement
We have complied with all relevant ethical regulations in this study.
Data availability statement
Raw data associated with Extended Data Figure 10 are reported in Supplementary Table 3. Raw script used for retrieving microduplication data listed in Supplementary Table 3 will be available upon request. Raw Illumina sequencing reads and PacBio data for this study have been deposited in the National Center for Biotechnology Information Short Read Archive Bioproject ID# PRJNA517630.
Code availability statement
Data analysis used a combination of publicly available software and custom code, as detailed in the Online only Methods. Custom python [CRESA-lpp.py] and R [indel_background_filtering.R] scripts used in the Illumina data analysis and the shell script [Tcap_pacbio_analysis.sh] used for the analysis of the PacBio data are hosted on GitHub (https://github.com/locusliu/PCR_Amplicon_target_deep_seq). Scripts for the bioinformatic analysis of pathogenic microduplications are hosted at (https://rambutan.umassmed.edu/duplications/).
References
- 1.Moreira ES et al. Limb-girdle muscular dystrophy type 2G is caused by mutations in the gene encoding the sarcomeric protein telethonin. Nat Genet 24, 163–166 (2000). [DOI] [PubMed] [Google Scholar]
- 2.El-Chemaly S & Young LR Hermansky-Pudlak Syndrome. Clin. Chest Med 37, 505–511 (2016). [DOI] [PMC free article] [PubMed] [Google Scholar]
- 3.Sfeir A & Symington LS Microhomology-Mediated End Joining: A Back-up Survival Mechanism or Dedicated Pathway? Trends Biochem Sci 40, 701–714 (2015). [DOI] [PMC free article] [PubMed] [Google Scholar]
- 4.Bae S, Kweon J, Kim HS & Kim J-S Microhomology-based choice of Cas9 nuclease target sites. Nature Methods 11, 705–706 (2014). [DOI] [PubMed] [Google Scholar]
- 5.Kim S-I et al. Microhomology-assisted scarless genome editing in human iPSCs. Nature Communications 9, 939 (2018). [DOI] [PMC free article] [PubMed] [Google Scholar]
- 6.Hisano Y et al. Precise in-frame integration of exogenous DNA mediated by CRISPR/Cas9 system in zebrafish. Sci Rep 5, 8841 (2015). [DOI] [PMC free article] [PubMed] [Google Scholar]
- 7.Sakuma T, Nakade S, Sakane Y, Suzuki K-IT & Yamamoto T MMEJ-assisted gene knock-in using TALENs and CRISPR-Cas9 with the PITCh systems. Nat Protoc 11, 118–133 (2016). [DOI] [PubMed] [Google Scholar]
- 8.Bertz M, Wilmanns M & Rief M The titin-telethonin complex is a directed, superstable molecular bond in the muscle Z-disk. Proceedings of the National Academy of Sciences 106, 13307–133310 (2009). [DOI] [PMC free article] [PubMed] [Google Scholar]
- 9.Nigro V & Savarese M Genetic basis of limb-girdle muscular dystrophies: the 2014 update. Acta Myol 33, 1–12 (2014). [PMC free article] [PubMed] [Google Scholar]
- 10.Kosicki M, Tomberg K & Bradley A Repair of double-strand breaks induced by CRISPR-Cas9 leads to large deletions and complex rearrangements. Nature Biotechnology (2018). doi: 10.1038/nbt.4192 [DOI] [PMC free article] [PubMed] [Google Scholar]
- 11.Caron L et al. A Human Pluripotent Stem Cell Model of Facioscapulohumeral Muscular Dystrophy-Affected Skeletal Muscles. Stem Cells Translational Medicine 5, 1145–1161 (2016). [DOI] [PMC free article] [PubMed] [Google Scholar]
- 12.Oh J et al. Positional cloning of a gene for Hermansky-Pudlak syndrome, a disorder of cytoplasmic organelles. Nat Genet 14, 300–306 (1996). [DOI] [PubMed] [Google Scholar]
- 13.Richmond B et al. Melanocytes derived from patients with Hermansky-Pudlak Syndrome types 1, 2, and 3 have distinct defects in cargo trafficking. J. Invest. Dermatol 124, 420–427 (2005). [DOI] [PMC free article] [PubMed] [Google Scholar]
- 14.Brantly M et al. Pulmonary function and high-resolution CT findings in patients with an inherited form of pulmonary fibrosis, Hermansky-Pudlak syndrome, due to mutations in HPS-1. Chest 117, 129–136 (2000). [DOI] [PubMed] [Google Scholar]
- 15.Bolukbasi MF et al. Orthogonal Cas9-Cas9 chimeras provide a versatile platform for genome editing. Nature Communications 9, 4856 (2018). [DOI] [PMC free article] [PubMed] [Google Scholar]
- 16.Sharma S et al. Homology and enzymatic requirements of microhomology-dependent alternative end joining. Cell Death Dis 6, e1697 (2015). [DOI] [PMC free article] [PubMed] [Google Scholar]
- 17.Wang M et al. PARP-1 and Ku compete for repair of DNA double strand breaks by distinct NHEJ pathways. Nucleic Acids Research 34, 6170–6182 (2006). [DOI] [PMC free article] [PubMed] [Google Scholar]
- 18.Dutta A et al. Microhomology-mediated end joining is activated in irradiated human cells due to phosphorylation-dependent formation of the XRCC1 repair complex. Nucleic Acids Research 45, 2585–2599 (2017). [DOI] [PMC free article] [PubMed] [Google Scholar]
- 19.Zetsche B et al. Cpf1 is a single RNA-guided endonuclease of a class 2 CRISPR-Cas system. Cell 163, 759–771 (2015). [DOI] [PMC free article] [PubMed] [Google Scholar]
- 20.Landrum MJ et al. ClinVar: improving access to variant interpretations and supporting evidence. Nucleic Acids Research 46, D1062–D1067 (2018). [DOI] [PMC free article] [PubMed] [Google Scholar]
- 21.Lek M et al. Analysis of protein-coding genetic variation in 60,706 humans. Nature 536, 285–291 (2016). [DOI] [PMC free article] [PubMed] [Google Scholar]
- 22.Komor AC, Badran AH & Liu DR CRISPR-Based Technologies for the Manipulation of Eukaryotic Genomes. Cell 168, 20–36 (2017). [DOI] [PMC free article] [PubMed] [Google Scholar]
- 23.Kim E et al. In vivo genome editing with a small Cas9 orthologue derived from Campylobacter jejuni. Nature Communications 8, 14500 (2017). [DOI] [PMC free article] [PubMed] [Google Scholar]
- 24.Edraki A et al. A Compact, High-Accuracy Cas9 with a Dinucleotide PAM for In Vivo Genome Editing. MOLCEL 1–32 (2018). doi: 10.1016/j.molcel.2018.12.003 [DOI] [PMC free article] [PubMed] [Google Scholar]
- 25.Kleinstiver BP et al. Engineered CRISPR-Cas9 nucleases with altered PAM specificities. Nature 523, 481–485 (2015). [DOI] [PMC free article] [PubMed] [Google Scholar]
- 26.Bolukbasi MF et al. DNA-binding-domain fusions enhance the targeting range and precision of Cas9. Nature Methods 12, 1150–1156 (2015). [DOI] [PMC free article] [PubMed] [Google Scholar]
- 27.Hu JH et al. Evolved Cas9 variants with broad PAM compatibility and high DNA specificity. Nature (2018). doi: 10.1038/nature26155 [DOI] [PMC free article] [PubMed] [Google Scholar]
- 28.van Overbeek M et al. DNA Repair Profiling Reveals Nonrandom Outcomes at Cas9-Mediated Breaks. Molecular Cell 63, 633–646 (2016). [DOI] [PubMed] [Google Scholar]
- 29.Suzuki K et al. In vivo genome editing via CRISPR/Cas9 mediated homology-independent targeted integration. Nature 540, 144–149 (2016). [DOI] [PMC free article] [PubMed] [Google Scholar]
- 30.Shen MW et al. Predictable and precise template-free CRISPR editing of pathogenic variants. Nature 339, 819 (2018). [DOI] [PMC free article] [PubMed] [Google Scholar]
- 31.Rittié L & Fisher GJ Isolation and culture of skin fibroblasts. Methods Mol. Med 117, 83–98 (2005). [DOI] [PubMed] [Google Scholar]
- 32.Stadler G et al. Establishment of clonal myogenic cell lines from severely affected dystrophic muscles - CDK4 maintains the myogenic population. Skelet Muscle 1, 12 (2011). [DOI] [PMC free article] [PubMed] [Google Scholar]
- 33.Kearns NA et al. Cas9 effector-mediated regulation of transcription and differentiation in human pluripotent stem cells. Development 141, 219–223 (2014). [DOI] [PMC free article] [PubMed] [Google Scholar]
- 34.Brinkman EK, Chen T, Amendola M & van Steensel B Easy quantitative assessment of genome editing by sequence trace decomposition. Nucleic Acids Research 42, e168–e168 (2014). [DOI] [PMC free article] [PubMed] [Google Scholar]
- 35.Andrews S FastQC A Quality Control tool for High Throughput Sequence Data. www.bioinformatics.babraham.ac.uk1, 1 (2010). [Google Scholar]
- 36.Zhang J, Kobert K, Flouri T & Stamatakis A PEAR: a fast and accurate Illumina Paired-End reAd mergeR. Bioinformatics 30, 614–620 (2014). [DOI] [PMC free article] [PubMed] [Google Scholar]
- 37.Blankenberg D et al. Manipulation of FASTQ data with Galaxy. Bioinformatics 26, 1783–1785 (2010). [DOI] [PMC free article] [PubMed] [Google Scholar]
- 38.Koboldt DC et al. VarScan 2: somatic mutation and copy number alteration discovery in cancer by exome sequencing. Genome Research 22, 568–576 (2012). [DOI] [PMC free article] [PubMed] [Google Scholar]
- 39.Li H Minimap2: pairwise alignment for nucleotide sequences. Bioinformatics 34, 3094–3100 (2018). [DOI] [PMC free article] [PubMed] [Google Scholar]
- 40.Robinson JT et al. Integrative genomics viewer. Nature Biotechnology 29, 24–26 (2011). [DOI] [PMC free article] [PubMed] [Google Scholar]
- 41.1000 Genomes Project Consortium et al. A global reference for human genetic variation. Nature 526, 68–74 (2015). [DOI] [PMC free article] [PubMed] [Google Scholar]
- 42.Li H et al. The Sequence Alignment/Map format and SAMtools. Bioinformatics 25, 2078–2079 (2009). [DOI] [PMC free article] [PubMed] [Google Scholar]
- 43.Tan A, Abecasis GR & Kang HM Unified representation of genetic variants. Bioinformatics 31, 2202–2204 (2015). [DOI] [PMC free article] [PubMed] [Google Scholar]
- 44.Obenchain V et al. VariantAnnotation: a Bioconductor package for exploration and annotation of genetic variants. Bioinformatics 30, 2076–2078 (2014). [DOI] [PMC free article] [PubMed] [Google Scholar]
- 45.Benson G Tandem repeats finder: a program to analyze DNA sequences. Nucleic Acids Research 27, 573–580 (1999). [DOI] [PMC free article] [PubMed] [Google Scholar]
- 46.Li H Exploring single-sample SNP and INDEL calling with whole-genome de novo assembly. Bioinformatics 28, 1838–1844 (2012). [DOI] [PMC free article] [PubMed] [Google Scholar]
Associated Data
This section collects any data citations, data availability statements, or supplementary materials included in this article.
Supplementary Materials
Reporting Summary
SI Guide
Supp Tables
Supplementary Discussion and Supplementary Figure 1
