Experience-Dependent Plasticity of Binocular Responses in the Primary Visual Cortex of the Mouse (original) (raw)
Abstract
An activity-dependent form of synaptic plasticity underlies the fine tuning of connections in the developing primary visual cortex of mammals such as the cat and monkey. Studies of the effects of manipulations of visual experience during a critical period have demonstrated that a correlation-based competitive process governs this plasticity. The cellular mechanisms underlying this competition, however, are poorly understood. Transgenic and gene-targeting technologies have led to the development of a new category of reagents that have the potential to help answer questions of cellular mechanism, provided that the questions can be studied in a mouse model. The current study attempts to characterize a developmental plasticity in the mouse primary visual cortex and to demonstrate its relevance to that found in higher mammals. We found that 4 d of monocular lid suture at postnatal day 28 (P28) induced a maximal loss of responsiveness of cortical neurons to the deprived eye. These ocular dominance shifts occurred during a well-defined critical period, between P19 and P32. Furthermore, binocular deprivation during this critical period did not decrease visual cortical responses, and alternating monocular deprivation resulted in a decrease in the number of binocularly responsive neurons. Finally, a laminar analysis demonstrated plasticity of both geniculocortical and intracortical connections. These results demonstrate that an activity-dependent, competitive form of synaptic plasticity that obeys correlation-based rules operates in the developing primary visual cortex of the mouse.
Keywords: ocular dominance, neural plasticity, visual cortex, development, mouse, monocular deprivation, critical period, binocular deprivation
The remarkably complex and precise connectivity present in the adult mammalian central visual system arises as a consequence of an equally remarkable developmental process. Spontaneous and stimulus-evoked activity fine tune the connections between neurons in the various visual areas, shaping the anatomical and physiological properties of neurons and synapses, eventually honing in on the adult state (Goodman and Shatz, 1993). Much is known about the rules governing this fine-tuning process, thanks to decades of experiments on binocular interactions in the primary visual cortex (area 17) of the cat. During the first few months of life, geniculocortical afferents from the two eyes, initially widespread within the input layer of area 17, segregate into ocular dominance (OD) columns through an activity-dependent competition for synaptic space (LeVay et al., 1978;Stryker and Harris, 1986; Antonini and Stryker, 1993a).
The tremendous plasticity inherent in this developmental reorganization of connectivity can be redirected by manipulating the visual environment of young cats and monkeys. Monocular lid suture [monocular deprivation (MD)] during this same early postnatal period results in a pronounced decrease in the area occupied by geniculocortical arbors representing the deprived eye and a corresponding increase in the area occupied by arbors representing the nondeprived (ND) eye (Hubel et al., 1977; Shatz and Stryker, 1978; LeVay et al., 1980). The physiological plasticity is just as dramatic; after only a few days of MD, the great majority of cortical cells become responsive only to stimuli presented to the ND eye, and only a few cells respond, usually poorly, to stimulation through the deprived eye (Wiesel and Hubel, 1963, 1970;Olson and Freeman, 1975, 1980; Hubel et al., 1977; Movshon and Dürsteler, 1977; Blakemore et al., 1978; LeVay et al., 1980). The rules governing this plasticity are well established. Cortical activity blockade prevents the shift in responsiveness with MD (Reiter et al., 1986). MD later in the life of the animal, at a time after OD columns normally are fully formed, has little or no effect (Wiesel and Hubel, 1970; Olson and Freeman, 1980). Binocular visual deprivation during the critical period has a much smaller effect on responses, demonstrating a requirement for competition between inputs from the two eyes (Wiesel and Hubel, 1965; Freeman et al., 1981). Finally, interventions that prevent coincident activation of corresponding portions of both eyes, such as strabismus or alternating MD (AltMD), decrease binocular responses and cause most neurons to be driven exclusively by one eye or the other, suggesting that OD plasticity follows Hebbian rules (Hubel and Wiesel, 1965; Blakemore et al., 1975; Yinon, 1975; Blakemore, 1976;Changeux and Danchin, 1976; Stent, 1973; Blasdel and Pettigrew, 1979;Crawford and von Noorden, 1979, 1980).
Experiments have suggested that ocular dominance plasticity, so well described in cats and primates, also can be found in other mammals. MD has been shown to alter the physiological responses of cortical cells in ferrets (B. Chapman, K. Zahs, and M. Stryker, unpublished observations), sheep (Kennedy et al., 1980), rabbits (Van Sluyters and Stewart, 1974), rats (Maffei et al., 1992; Fagiolini et al., 1994), hamsters (Emerson et al., 1982), and mice (Dräger, 1978). In particular, experiments in rats have demonstrated that even in the primitive rodent primary visual cortex, plasticity during a critical period appears to follow correlation-based rules (Domenici et al., 1992; Fagiolini et al., 1994).
Mice offer an additional advantage to those wishing to manipulate the environment. Powerful transgenic and knockout technologies enable direct control over the genetic makeup of the mouse (Grant and Silva, 1994; Mayford et al., 1995). A large and continuously growing number of mutant and knockout mouse lines are available (Brandon et al., 1995). Many of these mice may be used to test hypotheses regarding the cellular mechanisms underlying OD plasticity, which to date have remained elusive. Such work requires a simple, well-established murine model. Although Dräger (1978) showed that prolonged MD (6 weeks to 1 year) can induce OD shifts in mice, it was not clear that the effects reported were competitive. Here, we describe experiments that demonstrate that (1) OD shifts can be induced reliably in mice with brief deprivations, (2) this plasticity is confined to a well-defined critical period, (3) 4 d deprivations at the peak of this critical period have a saturating effect, (4) this plasticity depends on competition between the inputs from the two eyes, and (5) this plasticity appears to result from a correlation-based rule for synaptic reorganization. These results show that an experience-dependent plasticity exists in mouse visual cortex that appears identical to that described in other species.
MATERIALS AND METHODS
Mouse strains. Sixty male C57Bl/6 mice were obtained from Simonsen Laboratories (Gilroy, CA) or Banton and Kingman (Fremont, CA). For the laminar analysis and Figure 3 only, an additional 12 C57Bl/6 × 129 mice were obtained from A. J. Silva at Cold Spring Harbor Laboratory (Cold Spring Harbor, NY) and G. S. McKnight at the University of Washington (Seattle, WA). There were no detectable differences in receptive field (RF) properties, OD, or plasticity between these hybrid animals and the inbred mice.
Fig. 3.
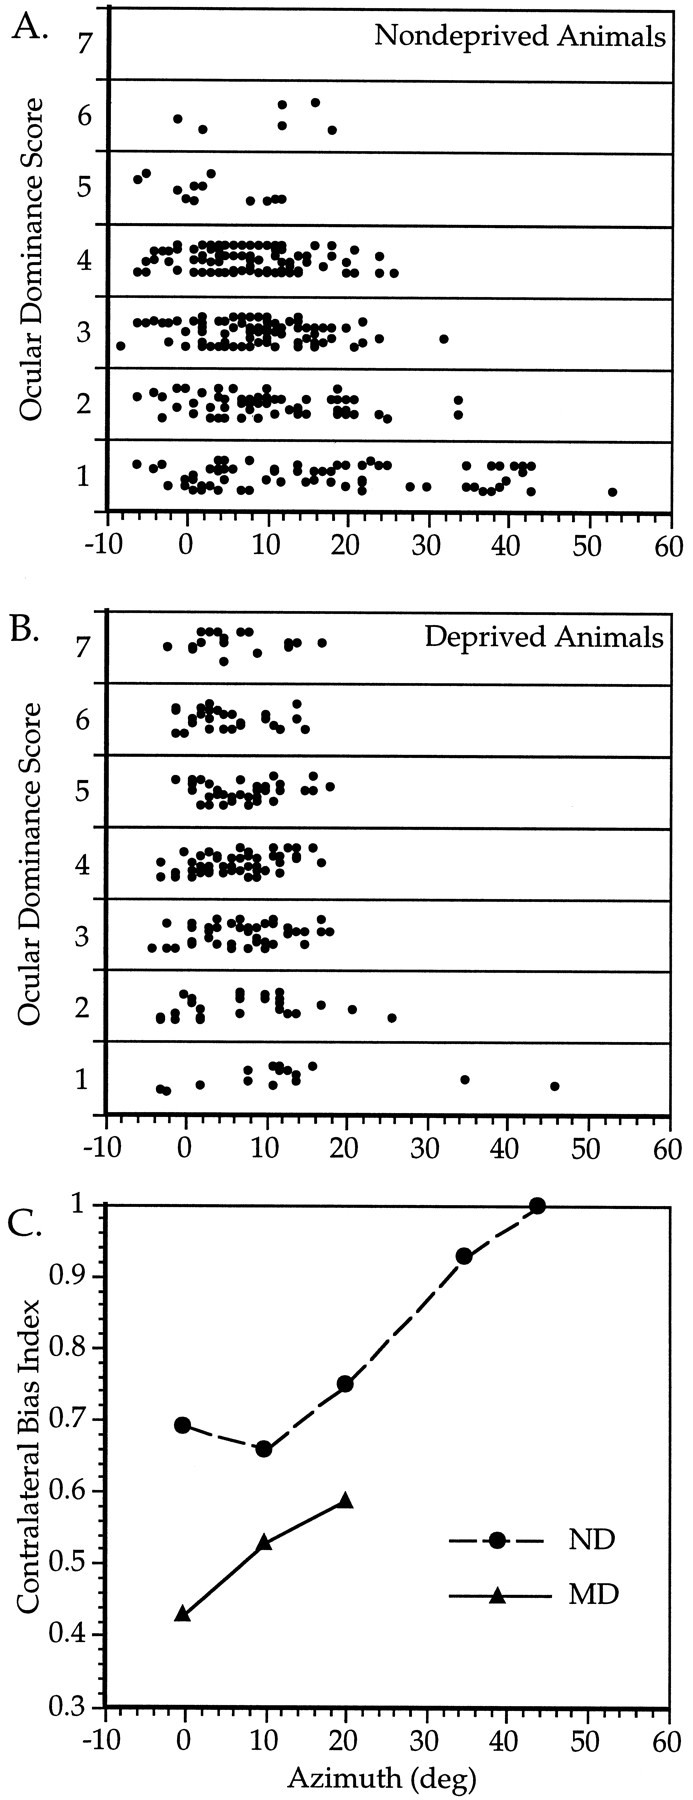
Ocular dominance of cells within the binocular zone. A_–_C, Relationship between OD and RF location in ND (A, C) and MD (B,C) mice. A, B, OD scores of 320 cells from nine ND mice (A) and 234 cells from 10 MD mice (B) are plotted versus the azimuth of the RF center of each cell. Cells from the MD animals were recorded in the cortex contralateral to the deprived eye. C, The CBI was calculated separately for cells with RF center azimuths of −5 to 5, 6–15, 16–25, 26–40, and >40° from the vertical meridian in ND mice (circles), and −5 to 5, 6–15, and 16–25° in MD mice (triangles). MD mice were deprived for 4 d beginning at either P23 or P27. For each point, n = 59–134 cells, except for ND 26–40°, n = 17; ND > 40°, n = 6; and MD 16–25°, n = 13.
MD and binocular deprivation (BD). Mice of various ages were anesthetized with 3% halothane (Halocarbon, Riveredge, NJ) in a 3:2 mixture of nitrous oxide and oxygen. The halothane concentration was reduced to 1.5% after achievement of surgical anesthesia. The area immediately surrounding the eye to be sutured was wiped with 70% ethanol. Lid margins were trimmed, and the eye was flushed with saline. In some cases, an antibiotic (chloroptic, Allergan, Irvine, CA) was placed on the eye, but this practice was discontinued, because it did not decrease the incidence of postoperative infection. Two to three mattress sutures were placed using 7-0 silk, opposing the full extent of the trimmed lids. Animals were recovered by allowing them to breathe a mixture of 100% oxygen and room air and returned to their cages when fully alert.
Animals were checked daily to make sure that the eyes remained closed and uninfected. Occasionally, it was difficult to be certain whether the lids were closed in the awake animal, in which case the animal was anesthetized briefly with 3% halothane in 3:2 N2O:O2. Holes were discovered in three animals. In one of these cases, the deprivation was planned for a total of 3 weeks; therefore, the hole was repaired and the deprivation continued. The results from this experiment were consistent with similar deprivations in which the lid suture remained intact. The other two animals were to be deprived for 4 d; experiments on these animals were terminated without recording. Only animals whose lid fusions remained intact throughout the 4 d period are considered in the results for 4 d or shorter deprivations. In an additional animal, an infection was severe enough to require drainage, which was performed under halothane anesthesia. The sutures were removed, the eye drained and washed with sterile saline, antibiotic applied, and the lids resutured. The results obtained from this animal also were consistent with similarly deprived animals.
AltMD. The right eyelids of five mice were sutured at P22 (two animals) or P23 (three animals). The procedure followed was identical to that described above for MD and BD, except that lid margins were not trimmed before suturing. Under these conditions, the lids did not heal together, facilitating later opening. At P29, after an initial 6–7 d deprivation, the sutures were removed from the right eye, and the left eye was closed. Again, the procedure described above was followed, except that the lids were not trimmed and only one mattress suture was placed. This process was repeated daily, alternating the eye closed each day, for the next 7–12 d. Electrophysiological recordings were obtained from the hemisphere contralateral to the initially deprived eye immediately at the end of the period of AltMD.
Electrophysiology. Electrophysiological procedures were adapted from those of Dräger (1975) and Wagor et al. (1980). Mice were anesthetized with an intraperitoneal injection of 50 mg/kg Nembutal (Abott, North Chicago, IL). Additional doses of 0.15–0.25 mg were given if necessary to induce surgical anesthesia. A sedative, chlorprothixene (0.2 mg, i.m.) (Sigma, St. Louis, MO), was administered to supplement the Nembutal; this reduced the amount of Nembutal necessary to maintain a sufficiently deep level of anesthesia. Additionally, lidocaine (2% Anthocaine) (Anpro, Arcadia, CA) was applied locally to all incisions. Atropine (0.3 mg, s.c.) (Butler, Columbus, OH) and dexamethasone (0.05 mg, s.c.) (Anpro) were injected subcutaneously. The atropine was necessary to reduce secretions and to counter the parasympathomimetic effect of the anesthetic agents; the dexamethasone helped reduce cerebral edema. The animal’s temperature was maintained at 36.5°C by a rectal thermoprobe feeding back to a heating pad on which the animal rested throughout the experiment. The animal’s eyes were kept closed throughout the ensuing surgical procedures to prevent drying out. Electrocardiograph leads were attached to the right forelimb and left hindlimb, and the heart rate was monitored continuously throughout the experiment using custom software written in LabView (National Instruments, Austin, TX) installed on a Macintosh IIfx computer. This enabled us to monitor closely the depth of anesthesia in these animals, which is crucial to maintain optimum visual responsiveness. A low (<6–7 Hz) or falling heart rate indicated that the animal might be overanesthetized, resulting in a dramatic decrease in visual cortical responsiveness. In contrast, a high (>9–10 Hz) or rising heart rate indicated the animal might be getting too light. Additional doses of Nembutal (0.15–0.25 mg) were delivered as required through an intraperitoneal catheter.
To keep the animal’s airway patent, a tracheotomy was performed, and a bent glass capillary tube (1.0 mm outside diameter, 0.75 mm inside diameter for young animals, larger for adults) was inserted into the open end of the trachea just below the larynx. A plastic tube blowing 100% oxygen was placed in front of the opening of the trachea tube so that the animal breathed a mixture of oxygen and room air throughout the course of the experiment. Pulse oximetry in a few representative animals demonstrated that this preparation enabled the animals to maintain a blood oxygen level of 95–98% saturation throughout the course of the physiological recording session. The animal then was placed in a custom-built stereotaxic holder. The head was held in place by ear bars with fine (1.5 mm) tips and a mouth bar to which the animal’s upper teeth were secured by a drop of cyanoacrylate.
Extreme care was required in exposing the visual cortex. A dental drill was used to drill partially through the skull along the suture lines, and the large (5 mm × 5 mm) section of bone was lifted away carefully from the brain with the bent tip of a pair of fine forceps. The dura was left intact, and the exposure was covered with warm agarose (2.8% in saline), which when hardened, reduced the cardiac and respiratory pulsations. The eyes then were opened and lids trimmed until the full extent of the pupil was exposed. The corneas were protected by covering them with silicone oil, which had to be reapplied frequently throughout the course of the experiment. By this point, the eyes were typically tremendously dilated, perhaps a side effect of the anesthetic used. We therefore were able to easily visualize and project optic disk locations onto a tangent screen; the optic disk location varied from animal to animal only slightly (mean ± SD; elevation = 33.6 ± 5.7°, azimuth = 65.0 ± 6.0°). As described by Dräger (1975) andWagor et al. (1980), eye position does not vary significantly under these recording conditions. We confirmed this in an initial subset of animals by replotting the position of the optic disks over the course of each experiment; differences greater than the accuracy of measurement (3–5°) were never found.
Resin-coated tungsten microelectrodes (Hubel, 1957) with tip resistances of 2–4 MΩ were used to record single units from the primary visual cortex. Electrodes were positioned under visual guidance, and correspondence between RF locations and published maps (Dräger, 1975; Wagor et al., 1981) were used to locate the binocular zone. We verified that all neurons recorded were in the primary visual cortex, as opposed to extrastriate cortex, in two ways. First, we verified that as the electrode was moved from medial to lateral, RF locations moved centrally. Second, in most animals, lesions placed in one to two penetrations per animal were located within V1 using Nissl-stained sections, according to established cytoarchitectonic criteria (Caviness, 1975).
RFs of isolated single units were plotted using a hand-held projection lamp on a screen placed 30 cm in front of the animal’s eyes at an angle of 58° from a line extending out from the animals’ midline. Bars of light were varied in size and orientation, where appropriate, to obtain a maximal response; for those cells with orientation selectivity, the preferred orientation was noted.
Cells within the central 30–40° of the upper portion of each hemifield have the potential to receive input from both eyes (see Fig.1A). In our initial recordings from normal animals, we found that cells with RFs outside the central-most 25° were much less likely to be driven well by the ipsilateral eye (see Results, Fig. 3). We therefore conservatively defined the binocular zone as the central 25° of each visual hemifield. The vertical meridian was defined as the intersection of the midline of the animal with the tangent screen. The appropriateness of this definition was verified by the consistency of the optic disk projections relative to this midline and the reversal of retinotopy seen as the electrode was moved into V2 (see Fig. 1B,C). The latter typically occurred at azimuths of 0 to −5°, consistent with previous reports (Dräger, 1978). Rare deviations in the optic disk projection and retinotopic reversal were consistent and caused us to occasionally revise our estimate of the vertical meridian; in all cases, however, data sets include only those cells within 25° of either estimate, whichever most conservatively estimated the extent of the binocular zone.
Fig. 1.

The primary visual cortex of the mouse.A, Schematic diagram of the central visual pathway in the mouse. The central 30–40° of the upper portion of each visual hemifield is seen by the retinas of both eyes. Retinal ganglion cell axons project to eye-specific regions of the LGN. Geniculocortical projections carrying information from the two eyes converge in the lateral one third of the primary visual cortex (V1), in the binocular zone. Arrow indicates vertical meridian of the visual field.B, Diagram showing the locations of a series of penetrations made into the visual cortex of a normal mouse. Thin circles_show penetrations in the monocular portion of V1. Thick circles show penetrations in the binocular zone of V1.Dashed circle shows a penetration made into V2.C, Retinotopy in the visual cortex of a normal mouse. Representative RFs encountered in the penetrations shown in_B are plotted here. The numbers correspond to the penetrations in which the RFs were found. Within V1, moving the electrode laterally (toward the right in B) resulted in finding more centrally located RFs (toward the_right_ in C). Once the electrode was moved into V2, the retinotopic progression reversed itself, as lateral displacement of the electrode resulted in a peripheral shift in RF position. This reversal of retinotopy was used during recording to determine the location of the V1/V2 boundary. The dashed line is the vertical meridian.
Cells within the binocular zone were assigned ocular dominance scores according to the methods of Hubel and Wiesel (1962). Optimal stimuli were presented to either eye alternately, and the relative strength of the response was determined. Cells were assigned an OD score of 1 if they responded only to stimuli presented to the contralateral eye and 7 if they responded only to stimuli presented to the ipsilateral eye. Cells responding equally well to stimuli presented independently to either eye were assigned an OD score of 4. OD scores of 2 or 3 and 5 or 6 were assigned if the cell responded better or was dominated by response to stimuli presented to the contralateral and ipsilateral eye, respectively. The contralateral bias index (CBI) was calculated according to the formula:
CBI=[(n1−n7)+(2/3)(n2−n6)+(1/3)(n3−n5)+N]/2N,
where N = total number of cells and_n_ x = number of cells with OD scores equal to x.
Because neuronal response characteristics vary with RF location and depth within the cortex, we controlled for these variables across experiments. For any two experimental groups, mean RF center azimuths never differed by more than 3°, and the distributions of recording depths overlapped completely.
Electrolytic lesions (4.5 μA for 4.5 sec) were placed in one to three penetrations per animal. Double lesions also were placed to estimated the degree of shrinkage caused by the histological procedures (see below).
Quantitative response evaluation. Custom software running on a 486 PC using a VSG2/2 video card (Cambridge Research Systems, Cheshire, UK) was used to present oriented light bars on a gray scale monitor (Apollo, Chelmstand, MA) placed 25 cm in front of the animal. The length, width, and speed of the bars were varied to maximize the response of single units; however, the difficulty of recording from these units for extended periods of time and the need to record from a number of units per animal precluded attempts to quantify more rigorously optimum stimulus parameters. Most units displayed some preference for a given stimulus orientation, but few were highly selective. Few, if any, demonstrated strong or reliable direction selectivity. Responses for eight presentations of each orientation (four presentations in each direction) were averaged and spontaneous activity subtracted. Peak response rates (firing rates evoked by stimuli of the preferred orientation), although larger than mean response rates (evoked firing rates averaged over all orientations), were modulated identically by the various deprivation patterns. Peak response rates were much more variable. The results from the analysis of mean response rates are therefore discussed.
Histology and laminar analysis. At the end of each experiment, the animal was given an overdose of Nembutal and perfused transcardially with 0.1 m PBS followed by 10% formalin in PBS. After post-fixation, the brain was removed, cryoprotected in 30% sucrose/10% formalin, and cut into 40 μm sections using a freezing microtome. Sections were mounted on slides, defatted, and stained with cresylecht violet. Cytoarchitectonic borders of area 17 were determined as described in Caviness (1975). Cortical laminae were well defined in this material (see Fig. 9) and were identified as in Krieg (1946) and Caviness (1975). Cameral lucida drawings of the lesion sites were used to reconstruct electrode penetrations and to determine the laminar location of the neurons recorded in that penetration. Cells within 25 μm of a border between cortical layers were not included in the analysis.
Fig. 9.
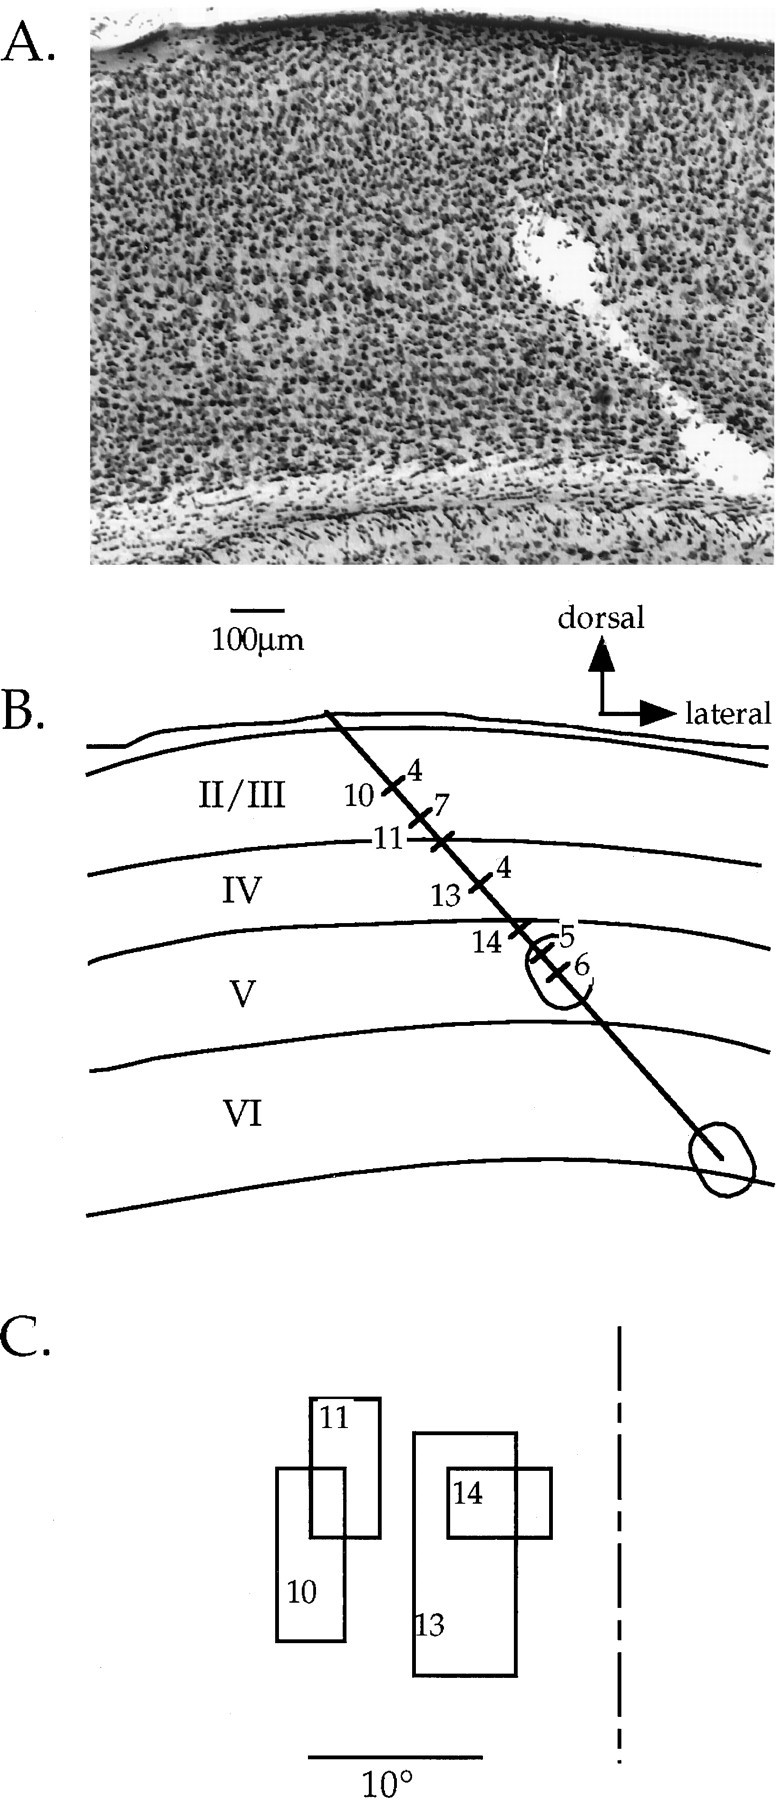
Reconstruction of an electrode track for laminar analysis. A, Nissl-stained section of the visual cortex in a deprived mouse. Two lesions placed at the end of a penetration into the binocular zone can be seen. B, Camera lucida drawing of section shown in A. Laminar boundaries are drawn, as are the lesions and the electrode track. The locations of each cell encountered in the penetration are indicated by hash marks across the electrode track. OD scores are shown to the right of each hash mark for those neurons that could be unambiguously assigned to a cortical layer; numbers to the left of selected hash marks indicated the neurons from which the RFs shown in C were obtained. The scale bar and direction key apply to both _A_and B. C, RFs of selected cells obtained in the penetration depicted in A and B. Note that because the electrode penetration was not radial, there was a gradual progression in RF position toward more central locations as the electrode was advanced deeper into the cortex. The vertical meridian is indicated by the dashed line.
RESULTS
Binocular responses in mouse visual cortex
In the mouse, only the central 30–40° of the upper portion of each visual hemifield is seen by the retinas of both eyes (Dräger, 1975, 1978; Wagor et al., 1980) (see Fig.1A). Information about this portion of the visual world is carried by retinal ganglion cell axons to eye-specific regions of the lateral geniculate nucleus (LGN) (Métin et al., 1983; Godement et al., 1984). Geniculocortical afferents project from these regions to the lateral one third of the primary visual cortex (V1) (Dräger, 1975, 1978; Wagor et al., 1980). Within this “binocular zone,” individual cells usually respond to inputs from both eyes.
Microelectrode recordings were made from the binocular zone and surrounding monocular area of V1 in five C57Bl/6 mice. Each single unit was assigned an ocular dominance score according to the relative activity evoked by a stimulus presented to either eye independently (as in Hubel and Wiesel, 1962) (see Methods). The distribution of OD scores of 27 neurons encountered in the binocular zone of one hemisphere of a normal animal is shown at the top of Figure 2. Note the strong bias toward the contralateral eye (that is, toward low OD scores) of the normal OD distribution. Even within the binocular zone of a normal animal, cells are more likely to be driven better by inputs from the contralateral eye than from the ipsilateral eye.
Fig. 2.

Effects of monocular deprivation on ocular dominance in mouse primary visual cortex. Top, Distribution of OD scores (see Results) for 27 neurons recorded from the binocular zone of a normal P24 mouse. Lower left, OD distribution for 26 neurons recorded in the binocular zone ipsilateral to the deprived eye in a mouse that underwent MD from P28 to P32. Lower right, OD distribution for 25 neurons from the binocular zone contralateral to the deprived eye; same mouse as lower left. The CBI (see Materials and Methods) is indicated in the upper right corner of each histogram. The number of neurons of each OD class is indicated at the top of each_bar_.
OD distributions were characterized by the CBI, which indicates the degree to which the input from the contralateral eye dominates the activity of the cortical cells (see Methods). The CBI will be closer to 1 if the contralateral input predominates and closer to 0 if ipsilateral input predominates. The CBI for each OD distribution in Figure 2 is shown at the top right of each histogram. The CBIs for six hemispheres from five normal mice are shown in Figure 4.
Fig. 4.

Critical period for the effects of monocular deprivation in the mouse. Mean ± SD CBIs for normal animals (shaded bar) and animals monocularly deprived for 4 d beginning at various ages (filled triangles). Filled circles show individual CBIs for OD distributions obtained from ND animals; n = 23–30 cells per hemisphere, N = five hemispheres from five animals per time point (MD) and six hemispheres from five animals (ND).
To define better the extent of the binocular zone, we examined the relationship between OD and RF location for 320 neurons recorded from V1 in the six C57Bl/6 and three additional hybrid mice. In Figure3A, the OD score of each neuron is plotted against the azimuth of the center of its RF. Cells with RFs within the central 25° were very likely to be driven well by stimuli presented to the ipsilateral eye, as can be seen by the large percentage of neurons with OD scores of 2 or greater. In contrast, cells with RFs located between 25 and 40° from the midline were less likely to be driven well by the ipsilateral eye. These qualitative observations were confirmed by calculating the CBIs for OD distributions of cells grouped by RF center azimuth (Fig. 3C). The CBIs of cells with RFs near 0, 10, and 20° of the vertical midline were quite similar, whereas the CBIs of cells with RFs located more peripherally were much higher, reflecting a greater degree of contralateral dominance. For azimuths less than 25° and elevations greater than 10°, OD did not vary with elevation (data not shown).
Effects of brief monocular deprivation
Dräger (1978) has shown previously that long (6 week) periods of monocular deprivation starting at eye opening (P11–P12) will result in significant shifts in cortical responsiveness toward the nondeprived eye. To determine whether shorter deprivations could induce similar shifts, we deprived several animals for varying lengths of time starting at various ages from P12 to P40. At the end of the deprivation period, extracellular recordings were made from single neurons in the binocular zone. OD scores were assigned as described above.
At the bottom of Figure 2 are shown histograms of OD score distributions from each hemisphere of an animal in which the right eye was sutured shut for 4 d, starting at P28. Even after such a brief period of MD, cortical ocular dominance changed dramatically. In the hemisphere ipsilateral to the deprived eye, the contralateral dominance increased markedly; few cells responded to stimuli presented to the ipsilateral eye, and the majority of those that did respond did so poorly. In the hemisphere contralateral to the deprived eye, the open ipsilateral eye dominated responses, and cells driven exclusively by the ipsilateral eye were found. The degree of the shift was quantified by comparing the CBI in the nondeprived and deprived hemispheres. The CBIs of distributions recorded from ipsilaterally deprived hemispheres were considerably higher and contralaterally deprived hemispheres considerably lower than those from normal animals.
We also examined the effect of RF location on plasticity subsequent to MD. Recordings were made from the binocular zone contralateral to the deprived eye in 10 mice deprived for 4 d beginning between P23 and P28. Figure 3B shows the OD score for each cell plotted against its RF center azimuth. Small differences in the OD distributions for cells of different eccentricities are evident. CBIs were calculated for OD distributions of cells grouped by RF center azimuth. A plot of CBI versus azimuth reveals that cells with RFs closest to the vertical midline shifted most (Fig. 3C).
Critical period for monocular deprivation in the mouse
Having observed potent effects of a brief, 4 d period of monocular deprivation beginning at P28, we investigated whether OD plasticity is confined to a critical period in early life, as it is in other species. To delimit the critical period, we sutured shut one eye in each of five mice of the following ages: P19, 23, 28, 32, and 36 (these and all subsequent ages given are ±1 d).The animals were returned to their cages, and microelectrode recordings were performed 4 d later. In this and all subsequent MD experiments, we consider only recordings made from the hemisphere contralateral to the deprived eye for two reasons. First, we might have obtained an artifactual result of apparent shift toward the contralateral eye if we accidentally recorded outside the binocular zone. Second, shifts toward the ipsilateral eye reveal cells in OD classes 6 and 7, which rarely are seen in ND animals. Considering only the contralaterally deprived hemispheres, a decrease in the CBI represents a shift toward the ipsilateral, open eye.
The results shown in Figure 4 reveal a well-defined critical period. Average CBIs for the binocular zone contralateral to the closed eye in the deprived animals are plotted together with the CBIs from six ND hemispheres in five animals. Maximal effects of MD were caused by 4 d deprivations starting at P28. Smaller shifts toward the open ipsilateral eye were evident even at the youngest age tested, deprivations starting at P19. The magnitude and reliability of shifts induced by 4 d MD dropped off rapidly after the peak of the period of susceptibility. Although several animals deprived after P32 showed CBIs below the normal range, there were no significant differences between animals deprived beginning at either of the two later time points and ND controls. The differences in the effects of MD were not caused by differences in the RF locations sampled at each age; CBIs calculated separately for cells grouped by azimuth (as in Fig. 3C) showed the same age-dependent shift (data not shown).
Four day deprivations are maximally effective
One characteristic of the critical period in other species is the surprising finding that brief deprivations have such a strong effect. To determine whether this was true for OD plasticity in mice, we measured the length of time necessary to achieve a maximal shift toward the ND eye at the peak of the critical period. We therefore deprived a number of animals for varying lengths of time, all centered around ∼P28. Figure 5 shows the mean CBIs for deprivations of increasing lengths. Two day deprivations had little effect, whereas 4 d deprivations were as effective as longer deprivations at inducing a shift in cortical responsiveness toward the open eye.
Fig. 5.

Duration of monocular deprivation required for maximal shift. CBIs were calculated individually from OD distributions obtained from nondeprived mice and mice deprived for increasing lengths of time, centered at ∼P28. Mean (bars) and individual CBIs (open circles) are shown.
Effects of binocular deprivation
MD produced a dramatic shift in the efficacy of inputs from the two eyes in driving cortical cells. We wished to determine whether this effect was attributable to simple disuse, a hypothetical degradation in the deprived eye’s visual pathway upon lid suture, or whether, as in other species, competition between inputs from the two eyes was required. We tested this by suturing shut both eyes [binocular deprivation (BD)] of several mice at the peak of the critical period. Short-term BD in animals such as the cat has been shown to cause only small changes in visual responsivity (Wiesel and Hubel, 1965a, Freeman et al., 1981).
We deprived four mice binocularly for 4 d starting at P28, a period identical to that which produced maximal effects in MD animals. We found cortical responses to be remarkably resilient to this manipulation. The data presented in Figure 6 demonstrate that all measured aspects of cortical cell responses were normal or nearly so in the BD animals. The distribution of RF sizes in BD animals consistently overlapped those of normal animals, although the mean RF size for all BD animals was slightly smaller that that of controls (p = 0.01, t test) (Fig. 6A). Retinotopy, however, was preserved perfectly in the BD animals. In Figure 6B, the RF azimuths of cells encountered in successive evenly spaced electrode penetrations are plotted against the lateromedial position of the electrode. We found a consistent linear relationship between RF location and cortical location within the central 40° of the visual field in BD as well as normal animals. The precision of this retinotopic mapping can be estimated by the correlation coefficient of the linear regression, which in normal animals is quite high (0.92 ± 0.6). There was no significant difference between the mean coefficients of two such regressions each in BD and normal animals (Fig. 6B, inset).
Fig. 6.

Effects of binocular deprivation on visual cortical responses in the mouse. A, RF sizes in BD and normal mice. The mean ± SD is shown for RFs of neurons recorded in each animal (mo105 to mo326). The overall mean ± SEM are shown for all four BD animals (All BD) and all five ND animals (All ND); n = 15–54 cells per animal, n = 137 and 124 cells for All BD and All ND, respectively. B, Retinotopy in BD and normal animals. Series of three to five evenly spaced penetrations were made across a portion of the lateromedial extent of V1 in BD and ND animals. The RF centers of three to five neurons encountered at each location are plotted here for one representative series of penetrations from a BD (circles) and an ND animal (triangles).Solid and dotted lines show linear regressions of RF center azimuth on electrode position in the BD and normal animal, respectively. Inset shows mean ± SD correlation coefficients of two and four regressions each from BD and normal animals, respectively. C, OD distribution of 132 neurons recorded from the binocular zone in the BD mice. Conventions as in Figure 2. The OD distribution for ND animals is shown in Figure8A. D, Visual evoked responses in single neurons recorded from the binocular zone in ND, BD, and_MD_ mice. Mean ± SEM of responses of neurons to computer-generated stimuli presented to both eyes (gray bars), the ipsilateral eye (white bars), or the contralateral eye (hatched bars) are shown. Responses are calculated separately for neurons recorded contralateral (contra MD) and ipsilateral (ipsi MD) to the deprived eye. For each neuron, the response to eight presentations (four in each direction) of a bar of each orientation were averaged; n = 11–24 cells for each category. Both MD and BD mice were deprived from P28 to P32.
The OD distribution of 131 cells recorded in the binocular zone of the BD animals is shown in Figure 6C. The distribution is quite similar to that seen in normal animals (see Fig. 2, top; Fig. 8A), although there seems to be a slight reduction in the proportion of cells driven by both eyes in the BD animals (22% of cells in the BD mice were monocular vs 17% of cells in normal mice). The OD distributions of cells from the BD animals and five normal animals are significantly different by χ2analysis (p < 0.05). In contrast, there was no shift in OD toward either eye; the CBIs of the four BD hemispheres from which sufficient data were obtained were 0.76, 0.67, 0.70, and 0.70, respectively, all well within the normal range. There was no significant difference between the means of these CBIs and those of ND animals (mean ± SD = 0.71 ± 0.04 and 0.71 ± 0.03 for BD and ND, respectively, _p_ > 0.7, t test).
Fig. 8.

Effects of alternating monocular deprivation on binocular responses. A_–_D, OD distributions for cells recorded from mice subjected to various manipulations of their visual experience. Conventions as in Figure 2. A, ND mice; 150 cells were recorded from six hemispheres in five animals.B, AltMD. Mice were initially deprived of vision in one eye from P22 or P23 to P29, then subjected to daily AltMD for 7–12 d; 257 cells were recorded from the hemisphere contralateral to the initially deprived eye in five mice. C, Contralateral MD; 130 cells were recorded from the hemisphere contralateral to the deprived eye in five MD mice deprived from P28 to P32. D, Ipsilateral MD; 91 cells were recorded from the hemisphere ipsilateral to the deprived eye in five MD mice.
To determine quantitatively the effects of BD and to compare them with those of MD, we measured firing rates evoked by computer-generated oriented light bars swept across the RFs in two normal, two BD, and two MD animals. These measurements are shown in Figure 6D. The mean response rates of cells encountered in the binocular zone of ND animals were on average greater for stimuli presented to the contralateral eye than for stimuli presented to the ipsilateral eye, verifying the contralateral dominance seen in the OD histograms. BD resulted in only a small and nonsignificant decrease in the responsiveness of binocular zone neurons. In contrast, MD resulted in a much greater decrease in the responsiveness of neurons to the deprived eye. Responses of neurons to the contralateral deprived eye were reduced significantly relative to those in ND animals (p < 0.05, _t_ test). Responses of neurons to the ipsilateral deprived eye were nearly eliminated and were significantly smaller than those in both ND and BD animals (_p_ < 0.05 and 0.03, respectively, _t_test). Responses to the ND eye did not increase significantly with either contralateral or ipsilateral MD (_p_ > 0.3). In BD animals, as in normal animals, cells were found that displayed excellent specificity for stimulus orientation, as well as cells that exhibited only a slight preference for a particular orientation. Representative examples of these cells from BD animals are shown in Figure 7.
Fig. 7.
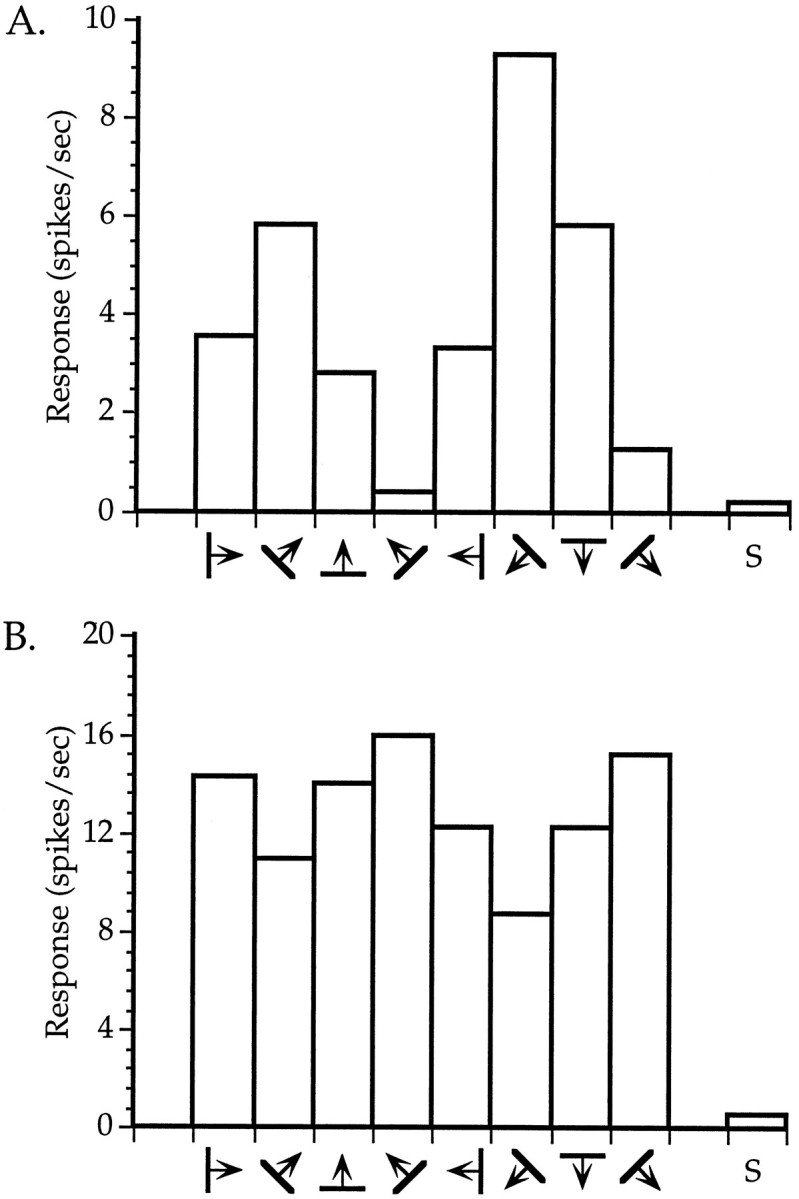
Orientation tuning of neurons in binocularly deprived mice. A, An orientation-selective cell.B, A cell with weak orientation tuning. Averaged responses to four presentations of an oriented bar moving in the indicated direction are shown for each of four orientations (two directions each). S indicates spontaneous activity. Both neurons were recorded within the binocular zone of a mouse deprived binocularly from P28 to P32.
Effects of alternating monocular deprivation
Experiments designed to decorrelate input between the two eyes have implicated a correlation-based mechanism in OD plasticity by causing an increase in the proportion of monocular cells (Hubel and Wiesel, 1965; Blakemore et al., 1975; Yinon, 1975; Blakemore, 1976;Blasdel and Pettigrew, 1979; Crawford and von Noorden, 1979, 1980). We initially attempted to obtain similar evidence for the murine model by inducing exo- or esotropic strabismus but found it difficult to produce large, maintained deviations in eye position through resection of medial or lateral rectus muscles. We therefore studied the consequences of daily alternating monocular lid suture instead. We first tried AltMD for ∼4–6 d around the peak of the critical period, which resulted in a shift toward the contralateral eye rather than an increase in monocularity (data not shown). We hypothesized that this contralateral shift still might be consistent with a correlation-based plasticity mechanism, given that cells in the binocular zone of the mouse cortex were quite dominated by the contralateral eye at the time the deprivation began; when put in equal competition, the ipsilateral eye never might have achieved sufficient synaptic efficacy in any cell to come to dominate it completely, and the contralateral inputs eventually would win out in every cell. We reasoned that if we first could balance the efficacy of the two eyes by an initial period of MD before beginning daily AltMD, the strengthened, initially open eye might obtain a sufficient foothold in the ipsilateral cortex to allow for it to win out in equal competition for some cortical cells.
We deprived five animals monocularly for an initial period of 6 or 7 d (P23–P29, three animals, and P22–P29, two animals), immediately followed by a 7–12 d period of AltMD. At the end of the AltMD period, we recorded from cortical cells in the binocular zone of V1 ipsilateral to the initially open eye. The resulting OD distribution of all 257 cells recorded from the five cortical hemispheres is shown in Figure8B. Note the j-shaped distribution, with the great majority of cells being monocular and a considerable number being driven only by the ipsilateral eye. Four of the five animals had distributions similar to the total; in one animal, however, only one ipsilateral monocular cell was found, and its OD distribution looked more like an ipsilaterally deprived cortex (the CBI of this animal was 0.90). Note that the overall distribution (CBI = 0.74) and each of the other four animals (CBIs = 0.67, 0.70, 0.72, and 0.67) showed no evidence of a net shift toward either eye. Rather, the effect of AltMD simply seemed to be a change toward monocular domination by one eye or the other.
The overall OD histograms for all ND, P28 contra-MD, and all ipsi-MD animals are shown for comparison in Figure 8 A, C, and_D_. Note once again that the effect of AltMD is unlike the effects of contra- or ipsi-deprivation. Pairwise χ2 analysis demonstrates that each of the four OD distributions is significantly different from any other (p < 0.0005 in all cases). Furthermore, AltMD is unlike a simple linear combination of ipsi- and contra-MD; neither monocular manipulation results in more cells of OD class 7 than cells of class 4, as occurs after AltMD. The effects of AltMD did not vary with RF position (data not shown).
Laminar analysis
To examine more closely the locus of the plasticity induced by monocular lid suture, we analyzed the laminar position of neurons recorded from the binocular zone in a subset of MD and control mice. After single-unit recordings, electrolytic lesions were made in 24 penetrations in 14 MD animals and 14 penetrations in 11 ND controls. The MD animals all were deprived for 4 d beginning between P23 and P28. Cells were assigned to cortical layers based on reconstructions of the electrode paths in Nissl-stained sections. One such reconstruction is illustrated in Figure 9. Figure 10 shows the OD distributions for neurons from these penetrations separated according to the cortical layer in which the cells were found. The OD distribution of cells in layers II/III, IV, and V/VI from ND animals were nearly identical, each reflecting the normal bias toward the contralateral eye. In contrast, laminar analysis of OD in the MD mice suggested differences in the degree of shift present in each of the cortical layers. The OD distributions of cells in all three groups shifted in favor of the ND eye (p < 0.005 for each comparison, χ2 test). Furthermore, cells in layers V/VI shifted significantly more than those in layer IV, and the cells in layers II/III shifted to an intermediate degree. Controlling for azimuth confirmed the laminar differences. CBIs calculated for OD distributions from cells within the 5° of the vertical meridian were 0.42, 0.55, and 0.20 for layers II/III, IV, and V/VI, respectively.
Fig. 10.

Laminar analysis of binocular responses in nondeprived and monocularly deprived mice. A_–_F, OD histograms are shown for cells recorded from ND (A,C, E) and MD (B, D,F) mice separated by cortical layer. MD animals were deprived contralaterally for 4 d beginning between P23 and P28. Conventions as in Figure 2.
DISCUSSION
Although effects of long-term monocular deprivation on ocular dominance in mouse V1 were reported initially by Dräger (1978), this report is the first full characterization of OD plasticity in this species. The experiments described provide evidence that OD plasticity in the mouse follows similar rules as in higher mammals in which it has been studied more completely. We found that periods of monocular lid suture as short as 4 d produced a maximally effective shift in the responsiveness of visual cortical neurons toward the ND eye. These effects were delimited to a critical period early in the development of the animal. Brief periods of BD had little or no effect on visual cortical responses, demonstrating the dependence of the plasticity on the competition between the two eyes. AltMD, by decorrelating the input from the two eyes, decreased the degree of binocularity in the cortex. Finally, a laminar analysis suggested that plasticity occurs both subcortically and intracortically, because the OD distribution of cells in layer IV was less shifted than that of cells in infragranular layers, with supragranular layers intermediate. The extent to which these findings support the conclusion that OD plasticity in the mouse is a valid model for that in other mammals is discussed below.
Effects of brief monocular deprivation
We report here that 4 d of MD at the height of the critical period are necessary and sufficient to shift maximally the responsiveness of mouse V1 neurons toward the ND eye. Two days of monocular lid suture produced only an incomplete shift in the hemisphere contralateral to the deprived eye (we have not examined the effects of brief MD on responses in the ipsilateral hemisphere). Studies of brief MD in kittens suggest a similar length requirement. Although 2 d deprivations in kittens are quite effective, 4 d deprivations are required for a maximal effect (Olson and Freeman, 1975; Movshon and Dürsteler, 1977; Hensch et al., 1995a). Very brief MD has not been examined in monkeys or rats.
Time course of the critical period
The critical period for the effects of 4 d of MD in mouse V1 begins after eye opening, peaks at or near P28, and ends rather abruptly at ∼P32. These findings are in rough agreement with the critical period described by Fagiolini et al. (1994) for the effects of 10 d of MD in the rat. The critical period in rodents appears to be shorter than that in other mammals. Ten days of MD is able to induce a substantial shift in cortical responses during postnatal weeks 2–11 in kittens (Olson and Freeman, 1980), and longer periods of deprivation can have significant effects throughout the first year of life (Cynader et al., 1980; Daw et al., 1992). MD in the monkey has been shown to be quite effective up to at least 6 weeks of age (Blakemore et al., 1978;LeVay et al., 1980). Although longer deprivations might reveal residual plasticity in older mice, it should be noted that rodents mature quite rapidly after birth. A 4-week-old mouse is reproductively capable and nearly full grown. Thus, it would not be surprising if the critical period were shorter. Rather, it is surprising that it occurs so late and lasts so long.
The dissociation between the time course of visual development and other more general developmental processes has been noted previously for anatomical events. Robinson and Dreher (1990) found that the timing of the establishment of various visual system cell types and pathways in a wide variety of different mammals is better correlated with the time from conception to eye opening than with the time from conception to birth. An examination of data from the present study and those ofFagiolini et al. (1994) in the rat and Olson and Freeman (1980) in the cat suggests that this is true for activity-dependent physiological processes as well; the time from conception to the peak of the critical period in these animals ranges from 160 to 250% of the gestational period but only 140–150% of the period between conception and eye opening. Activity-dependent processes appear to be regulated by the same visual system-specific developmental clock as earlier, presumably activity-independent ones.
We do not yet know what aspects of the development of the visual pathways account for the peak of sensitivity to the effects of visual deprivation. One attractive possibility is that the cellular mechanisms responsible for OD plasticity may only be fully functional in the visual cortex near this peak. Another possibility is that plasticity mechanisms that are in place before the peak of the critical period may be insufficiently engaged by the differences in activity created by lid suture. This alternative explanation is consistent with our qualitative impression that visual responses were less vigorous in the younger animals. The rapid decrease in susceptibility seen after the peak then would require a different mechanism, such as a decline in the function of some hypothetical cellular mechanism of plasticity. Reductions in NMDA receptor function and loss of susceptibility to long-term potentiation in vitro suggest that NMDA-mediated plasticity may be involved in the critical period (Fox et al., 1991, 1992;Carmignoto and Vicini, 1992; Fox, 1995; Kirkwood et al., 1995).
Effects of binocular deprivation
The role of competition in the effects of visual deprivation was established by Wiesel and Hubel (1965), who first demonstrated that periods of binocular lid suture do not result in wholesale loss of visual responsivity, in marked contrast to the devastating effects of MD. Even more striking is the difference between cats deprived monocularly and binocularly for brief periods. Dark rearing for 3–6 d has small effects on cortical cell responses in critical period-aged cats (Freeman et al., 1981), whereas similar length monocular lid suture, arguably a more subtle manipulation, completely eliminates responses of most cells to the deprived eye (Olson and Freeman, 1975;Movshon and Dürsteler, 1977). Similar differences between MD and BD effects are reported here for the mouse. In mice binocularly deprived for 4 d at the peak of the critical period for MD, visual responses, retinotopy, ocular dominance, and receptive field size were very similar to ND animals. In MD mice, by contrast, responses to the deprived ipsilateral eye nearly disappear, and responses to the deprived contralateral eye are greatly reduced. These findings argue strongly that in the mouse, just as in the cat, the effects of visual deprivation largely are attributable to the competition between inputs from the two eyes.
Effects of alternating monocular deprivation
Numerous experiments designed to decorrelate the inputs from the two eyes have demonstrated that a correlation-based plasticity operates in the visual cortex of cats and monkeys. Thus, divergent strabismus, alternating monocular occlusion, and rotation of one eye all have been shown to dramatically reduce the percentage of binocular cells in cat visual cortex (Hubel and Wiesel, 1965; Blakemore et al., 1975; Yinon, 1975; Blakemore, 1976; Blasdel and Pettigrew, 1979). Likewise, surgically or optically induced strabismus in the monkey has similar effects (Crawford and von Noorden, 1979, 1980). After we attempted to compensate to some extent for the stronger initial contralateral bias, daily AltMD for 7–12 d dramatically decreased the number of binocular cells in mouse V1 as well. The OD distributions for mice subjected to brief periods of AltMD reported here are similar to those reported recently for rats subjected to longer periods of surgically induced strabismus (Domenici et al., 1992).
Despite initially depriving the animals and recording from the cortex contralateral to the initially deprived eye, we still found a marked contralateral dominance after the period of AltMD. Deprivations similar to those used before the AltMD are sufficient to nearly equalize the efficacy of inputs from the two eyes in the contralateral hemisphere (compare the effects of deprivation from P23 to P27, Fig. 4) (additional data not shown). The contralateral, deprived afferents, therefore, must retain some additional advantage at the onset of the period of AltMD, beyond that demonstrated by their physiological efficacy, to come to dominate the majority of cells after AltMD. Nonetheless, many group 7 ipsilaterally driven monocular cells were found. These findings demonstrate that the effects of AltMD are altogether different from those of simple MD. They support the hypothesis that a correlation-based mechanism underlies plasticity in mouse V1.
Asymmetry of binocular responses
The contralateral inputs’ apparent competitive advantage in mouse visual cortex, revealed by AltMD, is confirmed by a comparison of the effects of MD in mice with those in other animals. The extent of the shift in cortical responses induced by closing the contralateral eye was considerably less than that seen in comparably deprived cats and monkeys, in which 80–100% of cells fail to respond to the deprived eye (Wiesel and Hubel, 1963, 1970; Olson and Freeman, 1975, 1980; Hubel et al., 1977; Movshon and Dürsteler, 1977; Blakemore et al., 1978; LeVay et al., 1980). In the rat, ∼50% of cells in the binocular zone fail to respond to the contralateral, deprived eye (Maffei et al., 1992; Fagiolini et al., 1994). The less dramatic shift seen in mice is not simply because the deprivations were not long enough. As described here and in Dräger (1978), even in mice deprived for longer periods of time (up to 1 year in the earlier study), only 17–20% of cortical cells fail to respond to the contralateral deprived eye. Cells in the binocular zone ipsilateral to the deprived eye, however, become nearly completely dominated by the contralateral eye, such that the OD distributions of these cells look quite similar those for deprived cats. The significant contralateral bias present in the binocular zone of ND mice appears to prevent the complete domination of the cortex by the ipsilateral eye.
The reason the initial contralateral bias blocks further domination by the ipsilateral eye is not immediately evident, however. A review of the effects of MD in various species reveals no consistent relationship between the degree of initial contralateral bias in ND animals and the amount of shift after MD (Fig. 11). Note especially the variable degree of shift in rats, rabbits, mice, and sheep, all of which start with the same initial contralateral bias. (In some of these studies, however, the possible confounding effects of RF location and depth were not evaluated fully.) Even fully deprived kittens, in which nearly all cells are responsive to only one eye, can be shifted fully back to the other eye if the suture is reversed early enough in the critical period (Blakemore and Van Sluyters, 1974). These data suggest that there is something special about the initial position of the contralateral eye geniculocortical afferents in the mouse binocular zone, besides their initial physiological dominance, that makes them partially immune to the effects of competition. The finding that cells with RFs closest to the vertical midline shift greater than those with more peripheral RFs raises the intriguing possibility that the monocular area exerts a stabilizing influence on nearby contralateral inputs through horizontal intracortical connections. This influence would be weakest at points farthest from the monocular area, i.e., at the representation of the vertical meridian, precisely where the shift toward the ipsilateral eye is greatest.
Fig. 11.

Relationship between initial contralateral bias and the degree of shift induced by MD. The normalized change in CBI with deprivation of the contralateral eye are plotted as a function of the initial CBI in ND animals for seven different species. The normalized change in CBI is calculated as (CBI in normal animals − CBI in deprived animals)/CBI in normal animals. Sources are as follows: sheep, Kennedy et al., 1980; hamster, Emerson et al., 1982; rat, Maffei et al., 1992; cat, Wiesel and Hubel, 1963; monkey, Hubel et al., 1977; rabbit, Van Sluyters and Stewart, 1974.
Locus of the effects of MD
In both cat and monkey, cortical cells in the geniculocortical input layers tend to be more monocular than in other layers, reflecting the anatomical segregation of inputs from the two eyes (Hubel et al., 1977; Shatz and Stryker, 1978). After a period of MD, the dominance of the ND eye is much greater in extragranular layers than in layer IV, even after year-long MD (Shatz and Stryker, 1978). Furthermore, cells in layer V were more shifted than supragranular layers. These findings suggest that intracortical connections also are plastic, in addition to plasticity in the geniculocortical afferents. In the mouse, in which geniculocortical afferents appear not to segregate into separate domains within layer IV (Dräger, 1978), we found that layer IV cells had OD distributions identical to those in extragranular layers. After MD, a shift toward the open eye was found in all layers, but the shift was more pronounced in extragranular layers than in layer IV, with the greatest shift in infragranular cells. This finding suggests that in the mouse, as in other species, intracortical as well as geniculocortical synapses undergo plasticity with MD. It also demonstrates the effects of plasticity with increasing layers of intracortical processing, causing the infragranular layers to be most dramatically affected.
Possible anatomical bases of plasticity
The findings of the present study are entirely physiological, but in other species, the effects of MD have been shown to be accompanied by major anatomical reorganization of the geniculocortical afferent pathways serving the two eyes. After long periods of MD in the cat and monkey, labeling of OD columns by transneuronal transport of amino acids, sugars, or lectins into one eye reveal that OD columns belonging to the deprived eye shrink with corresponding increases in the extent of those serving the ND eye (Hubel et al., 1977; Shatz and Stryker, 1978; LeVay et al., 1980). In the initial study of MD in the mouse,Dräger (1978) found no change in the extent or intensity of afferent innervation using transneuronal labeling with tritiated proline, the same method as used in the cat and monkey studies. Consideration of the extent to which such label may spill over in the LGN to label afferents serving the other eye makes this finding less than definitive. Changes in geniculate cell size also have been used to monitor competitive interactions between the visual pathways of the two eyes (Guillery, 1972). More recently, reconstructions of single geniculocortical afferents have revealed a rapid reorganization of arborization subsequent to brief periods of MD (Antonini and Stryker, 1993b). Similar techniques may reveal whether geniculocortical afferent arbors undergo a reorganization in mouse V1 as well. They also might reveal the basis of the differential susceptibility of the contralateral eye to the effects of MD.
CONCLUSION
The characterization of physiological responses in the primary visual cortex of the mouse subsequent to manipulation of visual experience reveals a plasticity remarkably similar to that of other mammals. The findings presented here demonstrate the operation of a competitive, correlation-based plasticity operating during a critical period in the development of the binocular zone of mouse V1. The advantages of a murine model for OD plasticity are many. OD plasticity is the best-studied form of CNS plasticity and serves as a model for the activity-dependent development and reorganization of connectivity throughout the neocortex. Yet we know comparatively little about the cellular mechanisms that underlie this important phenomenon. The mouse is an ideal organism for answering questions regarding molecular and cellular mechanisms of complex biological processes. Targeted disruption of specific genes allows study of the involvement of particular molecules in the development and function of whole systems. Until now, the only form of plasticity amenable to study in rodents has been that described in the cortical barrel fields, which has some similarities to but many differences from that in the visual cortex (Fox, 1992, 1994; Shlagger et al., 1993). The development of a mouse model of OD plasticity has allowed us to begin a dissection of the cellular mechanisms underlying this better understood form of plasticity (Gordon et al., 1994, 1995; Hensch et al., 1995b; J.A. Gordon et al., unpublished observations). As knowledge of the genome of this species becomes more complete and techniques for manipulating its genome become more sophisticated, the power of the mouse to answer questions of mechanism will only increase. The findings described here demonstrate that OD plasticity in the mouse is an excellent model for the phenomenon as described in other species and suggest that explorations of the mechanisms underlying mouse OD plasticity should help us understand cortical plasticity in mammals generally.
Footnotes
This research was supported by the Human Frontiers Science Program RG69/93 and facilities provided by the W. M. Keck Foundation and the Hellman family. We thank G. W. Balkema, C. Stone, U. C. Dräger, and A. L. Pearlman for technical advice, and E. S. Ruthazer and A. J. Doupe for comments on this manuscript. J.A.G. is an ARCS Foundation scholar and was supported by a National Institutes of Health MSTP fellowship and an NEI Vision Training Grant.
Correspondence should be addressed to Dr. Michael P. Stryker, Department of Physiology, 513 Parnassus Avenue, Room S-762, University of California, San Francisco, CA 94143-0444.
REFERENCES
- 1.Antonini A, Stryker MP. Development of individual geniculocortical arbors in cat striate cortex and effects of binocular impulse blockade. J Neurosci. 1993a;13:3259–3573. doi: 10.1523/JNEUROSCI.13-08-03549.1993. [DOI] [PMC free article] [PubMed] [Google Scholar]
- 2.Antonini A, Stryker MP. Rapid remodeling of axonal arbors in the visual cortex. Science. 1993b;260:1819–1821. doi: 10.1126/science.8511592. [DOI] [PubMed] [Google Scholar]
- 3.Blakemore C. Development of cat visual cortex following rotation of one eye. Nature. 1975;257:584–586. doi: 10.1038/257584a0. [DOI] [PubMed] [Google Scholar]
- 4.Blakemore C. The conditions required for the maintenance of binocularity in the kitten’s visual cortex. J Physiol (Lond) 1976;261:423–444. doi: 10.1113/jphysiol.1976.sp011566. [DOI] [PMC free article] [PubMed] [Google Scholar]
- 5.Blakemore C, Van Sluyters RC. Reversal of the physiological effects of monocular deprivation in kittens: further evidence for a sensitive period. J Physiol (Lond) 1974;237:195–216. doi: 10.1113/jphysiol.1974.sp010478. [DOI] [PMC free article] [PubMed] [Google Scholar]
- 6.Blakemore C, Garey LJ, Vital-Durand F. The physiological effects of monocular deprivation and their reversal in the monkey’s visual cortex. J Physiol (Lond) 1978;283:223–262. doi: 10.1113/jphysiol.1978.sp012498. [DOI] [PMC free article] [PubMed] [Google Scholar]
- 7.Blasdel GG, Pettigrew JD. Degree of interocular synchrony required for maintenance of binocularity in kitten’s visual cortex. J Neurophysiol. 1979;42:1692–1710. doi: 10.1152/jn.1979.42.6.1692. [DOI] [PubMed] [Google Scholar]
- 8.Brandon EP, Idzerda RL, McKnight GS (1995) Targeting the mouse genome—a compendium of knockouts 1–3. Curr Biol 5:625–634, 758–765, 873–881.
- 9.Carmignoto G, Vicini S. Activity-dependent decrease in NMDA receptor responses during development of the visual cortex. Science. 1992;258:1007–1011. doi: 10.1126/science.1279803. [DOI] [PubMed] [Google Scholar]
- 10.Caviness VS., Jr Architectonic map of neocortex of the normal mouse. J Comp Neurol. 1975;164:247–263. doi: 10.1002/cne.901640207. [DOI] [PubMed] [Google Scholar]
- 11.Changeux J-P, Danchin A. Selective stabilisation of developing synapses as a mechanism for specification of neuronal networks. Nature. 1976;264:705–712. doi: 10.1038/264705a0. [DOI] [PubMed] [Google Scholar]
- 12.Crawford MLJ, von Noorden GK. The effects of short-term experimental strabismus on the visual system in Macaca mulatta. Invest Ophthalmol Vis Sci. 1979;18:496–505. [PubMed] [Google Scholar]
- 13.Crawford MLJ, von Noorden GK. Optically induced concomitant strabismus in monkeys. Invest Ophthalmol Vis Sci. 1980;19:1105–1109. [PubMed] [Google Scholar]
- 14.Cynader M, Timney BN, Mitchell DE. Period of susceptibility of kitten visual cortex to the effects of monocular deprivation extends beyond six months of age. Brain Res. 1980;191:545–550. doi: 10.1016/0006-8993(80)91303-7. [DOI] [PubMed] [Google Scholar]
- 15.Daw NW, Fox K, Sato H, Czepita D. Critical period for monocular deprivation in the cat visual cortex. J Neurophysiol. 1992;67:197–202. doi: 10.1152/jn.1992.67.1.197. [DOI] [PubMed] [Google Scholar]
- 16.Domenici L, Parisi V, Maffei L. Exogenous supply of nerve growth factor prevents the effects of strabismus in the rat. Neuroscience. 1992;51:19–24. doi: 10.1016/0306-4522(92)90466-f. [DOI] [PubMed] [Google Scholar]
- 17.Dräger UC. Receptive fields of single cells and topography in mouse visual cortex. J Comp Neurol. 1975;160:269–290. doi: 10.1002/cne.901600302. [DOI] [PubMed] [Google Scholar]
- 18.Dräger UC. Observations on monocular deprivation in mice. J Neurophysiol. 1978;41:28–42. doi: 10.1152/jn.1978.41.1.28. [DOI] [PubMed] [Google Scholar]
- 19.Emerson VF, Chalupa LM, Thompson ID, Talbot RJ. Behavioral, physiological and anatomical consequences of monocular deprivation in the golden hamster (Mesocricetus auratus ). Exp Brain Res. 1982;45:168–178. doi: 10.1007/BF00235776. [DOI] [PubMed] [Google Scholar]
- 20.Fagiolini M, Pizzorusso T, Berardi N, Domenici L, Maffei L. Functional postnatal development of the rat primary visual cortex and the role of visual experience: dark rearing and monocular lid suture. Vision Res. 1994;34:709–720. doi: 10.1016/0042-6989(94)90210-0. [DOI] [PubMed] [Google Scholar]
- 21.Fox K. A critical period for experience-dependent synaptic plasticity in rat barrel cortex. J Neurosci. 1992;12:1826–1838. doi: 10.1523/JNEUROSCI.12-05-01826.1992. [DOI] [PMC free article] [PubMed] [Google Scholar]
- 22.Fox K. The cortical component of experience-dependent synaptic plasticity in the rat barrel cortex. J Neurosci. 1994;14:7665–7679. doi: 10.1523/JNEUROSCI.14-12-07665.1994. [DOI] [PMC free article] [PubMed] [Google Scholar]
- 23.Fox K. The critical period for long-term potentiation in primary sensory cortex. Neuron. 1995;15:485–488. doi: 10.1016/0896-6273(95)90136-1. [DOI] [PubMed] [Google Scholar]
- 24.Fox K, Daw N, Sato H, Czepita D. Dark-rearing delays the loss of NMDA-receptor function in kitten visual cortex. Nature. 1991;350:342–344. doi: 10.1038/350342a0. [DOI] [PubMed] [Google Scholar]
- 25.Fox K, Daw N, Sato H, Czepita D. The effect of visual experience on development of NMDA receptor synaptic transmission in kitten visual cortex. J Neurosci. 1992;12:2673–2684. doi: 10.1523/JNEUROSCI.12-07-02672.1992. [DOI] [PMC free article] [PubMed] [Google Scholar]
- 26.Freeman RD, Mallach R, Hartley S. Responsivity of normal kitten striate cortex deteriorates after brief binocular deprivation. J Neurophysiol. 1981;45:1074–1084. doi: 10.1152/jn.1981.45.6.1074. [DOI] [PubMed] [Google Scholar]
- 27.Godement P, Salaün J, Imbert M. Prenatal and postnatal development of retinogeniculate and retinocollicular projections in the mouse. J Comp Neurol. 1984;230:552–575. doi: 10.1002/cne.902300406. [DOI] [PubMed] [Google Scholar]
- 28.Goodman CS, Shatz CJ. Developmental patterns that generate precise patterns of neuronal connectivity. Cell. 1993;72:S72–S98. doi: 10.1016/s0092-8674(05)80030-3. [DOI] [PubMed] [Google Scholar]
- 29.Gordon JA, Silva A, Morris R, Silver J, Tokugawa Y, Stryker MP. Plasticity in mouse visual cortex: critical period and effects of αCaMKII and Thy-1 Mutations. Soc Neurosci Abstr. 1994;20:465. [Google Scholar]
- 30.Gordon JA, Hensch TK, Brandon EP, McKnight GS, Idzerda RL, Stryker MP. Normal ocular dominance plasticity without long-term potentiation in the visual cortex of PKA RIβ-deficient mice. Soc Neurosci Abstr. 1995;21:1284. [Google Scholar]
- 31.Grant SGN, Silva AJ. Targeting learning. Trends Neurosci. 1994;17:71–75. doi: 10.1016/0166-2236(94)90077-9. [DOI] [PubMed] [Google Scholar]
- 32.Guillery RW. Binocular competition in the control of geniculate cell growth. J Comp Neurol. 1972;144:117–129. doi: 10.1002/cne.901440106. [DOI] [PubMed] [Google Scholar]
- 33.Hensch TK, Crair MC, Ruthazer ES, Fagiolini M, Gillespie DC, Stryker MP. Robust two-day ocular dominance plasticity revealed by single-unit recording and intrinsic signal imaging of kitten area 17. Soc Neurosci Abstr. 1995a;21:2023. [Google Scholar]
- 34.Hensch TK, Gordon JA, Brandon EP, McKnight GS, Idzerda RL, Stryker MP. Dissociation of LTP induction from monocular deprivation effects in the visual cortex of protein kinase A RIβ-deficient mice. IBRO Abstr. 1995b;4:203. [Google Scholar]
- 35.Hubel DH. Tungsten microelectrode for recording from single units. Science. 1957;125:549–550. doi: 10.1126/science.125.3247.549. [DOI] [PubMed] [Google Scholar]
- 36.Hubel DH, Wiesel TN. Receptive fields, binocular interaction and functional architecture in the cat’s visual cortex. J Physiol (Lond) 1962;160:106–154. doi: 10.1113/jphysiol.1962.sp006837. [DOI] [PMC free article] [PubMed] [Google Scholar]
- 37.Hubel DH, Wiesel TN. Binocular interaction in striate cortex of kittens reared with artificial squint. J Neurophysiol. 1965;28:1041–1059. doi: 10.1152/jn.1965.28.6.1041. [DOI] [PubMed] [Google Scholar]
- 38.Hubel DH, Wiesel TN, LeVay S. Plasticity of ocular dominance columns in monkey striate cortex. Philos Trans R Soc Lond Biol. 1977;278:131–163. doi: 10.1098/rstb.1977.0050. [DOI] [PubMed] [Google Scholar]
- 39.Kennedy H, Martin KAC, Rao VM, Whitteridge D. Neuronal plasticity in the visual system of the sheep. In: Rose FC, Behan PO, editors. Animal models of neurological disease. Pittman Medical; Tunbridge Wells, UK: 1980. pp. 249–265. [Google Scholar]
- 40.Kirkwood A, Lee H-K, Bear MF. Co-regulation of long-term potentiation and experience-dependent synaptic plasticity in visual cortex by age and experience. Nature. 1995;375:328–331. doi: 10.1038/375328a0. [DOI] [PubMed] [Google Scholar]
- 41.Krieg WJS. Connections of the cerebral cortex. I. The albino rat. B. Structure of the cortical areas. J Comp Neurol. 1946;84:277–324. doi: 10.1002/cne.900840302. [DOI] [PubMed] [Google Scholar]
- 42.LeVay S, Stryker MP, Shatz CJ. Ocular dominance columns and their development in layer IV of the cat’s visual cortex: a quantitative study. J Comp Neurol. 1978;179:223–244. doi: 10.1002/cne.901790113. [DOI] [PubMed] [Google Scholar]
- 43.LeVay S, Wiesel TN, Hubel DH. The development of ocular dominance columns in normal and visually deprived monkeys. J Comp Neurol. 1980;191:1–51. doi: 10.1002/cne.901910102. [DOI] [PubMed] [Google Scholar]
- 44.Maffei L, Berardi N, Domenici L, Parisi V, Pizzorusso T. Nerve growth factor (NGF) prevents the shift in ocular dominance distribution of visual cortical neurons in monocularly deprived rats. J Neurosci. 1992;12:4651–4662. doi: 10.1523/JNEUROSCI.12-12-04651.1992. [DOI] [PMC free article] [PubMed] [Google Scholar]
- 45.Mayford M, Abel T, Kandel ER. Transgenic approaches to cognition. Curr Opin Neurobiol. 1995;5:141–148. doi: 10.1016/0959-4388(95)80019-0. [DOI] [PubMed] [Google Scholar]
- 46.Métin C, Godement P, Saillour P, Imbert M. Étude physiologique et anatomique des projections rétinogéniculées chez la Souris. C R Acad Sci III. 1983;296:157–162. [PubMed] [Google Scholar]
- 47.Movshon JA, Dürsteler MR. Effects of brief periods of unilateral eye closure on the kitten’s visual system. J Neurophysiol. 1977;40:1255–1265. doi: 10.1152/jn.1977.40.6.1255. [DOI] [PubMed] [Google Scholar]
- 48.Olson CR, Freeman RD. Progressive changes in kitten striate cortex during monocular vision. J Neurophysiol. 1975;38:26–32. doi: 10.1152/jn.1975.38.1.26. [DOI] [PubMed] [Google Scholar]
- 49.Olson CR, Freeman RD. Profile of the sensitive period for monocular deprivation in kittens. Exp Brain Res. 1980;39:17–21. doi: 10.1007/BF00237065. [DOI] [PubMed] [Google Scholar]
- 50.Reiter HO, Waitzman DM, Stryker MP. Cortical activity blockade prevents ocular dominance plasticity in the kitten visual cortex. Exp Brain Res. 1986;65:182–188. doi: 10.1007/BF00243841. [DOI] [PubMed] [Google Scholar]
- 51.Robinson SR, Dreher B. The visual pathways of eutherian mammals and marsupials develop according to a common timetable. Brain Behav Evol. 1990;36:177–195. doi: 10.1159/000115306. [DOI] [PubMed] [Google Scholar]
- 52.Schlaggar BL, Fox K, O’Leary DDM. Postsynaptic control of plasticity in developing somatosensory cortex. Nature. 1993;364:623–626. doi: 10.1038/364623a0. [DOI] [PubMed] [Google Scholar]
- 53.Shatz CJ, Stryker MP. Ocular dominance in layer IV of the cat’s visual cortex and the effect of monocular deprivation. J Physiol (Lond) 1978;281:267–283. doi: 10.1113/jphysiol.1978.sp012421. [DOI] [PMC free article] [PubMed] [Google Scholar]
- 54.Stent GS. A physiological mechanism for Hebb’s postulate of learning. Proc Natl Acad Sci USA. 1973;70:997–1001. doi: 10.1073/pnas.70.4.997. [DOI] [PMC free article] [PubMed] [Google Scholar]
- 55.Stryker MP, Harris WA. Binocular impulse blockade prevents the formation of ocular dominance columns in cat visual cortex. J Neurosci. 1986;6:2117–2133. doi: 10.1523/JNEUROSCI.06-08-02117.1986. [DOI] [PMC free article] [PubMed] [Google Scholar]
- 56.Van Sluyters RC, Stewart DL. Binocular neurons of the rabbit’s visual cortex: effects of monocular sensory deprivation. Exp Brain Res. 1974;19:196–204. doi: 10.1007/BF00238534. [DOI] [PubMed] [Google Scholar]
- 57.Wagor E, Mangini NJ, Pearlman AL. Retinotopic organization of striate and extrastriate visual cortex in the mouse. J Comp Neurol. 1980;193:187–202. doi: 10.1002/cne.901930113. [DOI] [PubMed] [Google Scholar]
- 58.Wiesel TN, Hubel DH. Single cell responses in striate cortex of kittens deprived of vision in one eye. J Neurophysiol. 1963;26:1003–1017. doi: 10.1152/jn.1963.26.6.1003. [DOI] [PubMed] [Google Scholar]
- 59.Wiesel TN, Hubel DH. Comparison of the effects of unilateral and bilateral eye closure on cortical unit responses in kittens. J Neurophysiol. 1965;28:1029–1040. doi: 10.1152/jn.1965.28.6.1029. [DOI] [PubMed] [Google Scholar]
- 60.Wiesel TN, Hubel DH. The period of susceptibility to the physiological effects of unilateral eye closure in kittens. J Physiol (Lond) 1970;206:419–436. doi: 10.1113/jphysiol.1970.sp009022. [DOI] [PMC free article] [PubMed] [Google Scholar]
- 61.Yinon U. Eye rotation in developing kittens: the effect on ocular dominance and receptive field organization of cortical cells. Exp Brain Res. 1975;24:215–218. doi: 10.1007/BF00234065. [DOI] [PubMed] [Google Scholar]