Density-Dependent Feedback Inhibition of Oligodendrocyte Precursor Expansion (original) (raw)
Abstract
The myelin sheath in the vertebrate CNS is formed by oligodendrocytes. The number of oligodendrocytes in a mature axon tract must be sufficient to myelinate all appropriate axons. How the number of oligodendrocytes is matched to axonal requirements and whether such matching involves axon–oligodendrocyte signaling or intrinsic oligodendrocyte self-regulation are not clear.
Using a combination of in vitro analyses, we demonstrate that oligodendrocyte precursors closely regulate their numbers through interactions between adjacent precursors. In low-density rat spinal cord cultures, the number of oligodendrocyte lineage cells increases rapidly. The addition of large numbers of oligodendrocyte precursors substantially reduces precursor expansion and results in a normalization of oligodendrocyte lineage cell numbers in the cultures over time. Thus, the number of oligodendrocyte lineage cells that develop appears dependent on the density of oligodendrocyte lineage cells. This normalization of cell number is reflected in assays of clonal potential and proliferation. For example, precursors gave rise to fewer progeny and proliferated less at high density. Reduced precursor expansion at high density was not attributable to the depletion of growth factors. Cocultures of high and low densities did not inhibit precursor expansion in low-density cultures, suggesting the requirement for local cell–cell interactions. The inhibition of precursor expansion was cell-type-specific and dependent on the presence of oligodendrocyte lineage cells. We propose that this density-dependent feedback inhibition of oligodendrocyte precursor expansion may play a primary role in regulating the number of oligodendrocytes in the developing spinal cord.
Keywords: spinal cord, oligodendrocyte precursors, cell proliferation, retroviral analysis, density dependence
The effective functioning of the mammalian CNS depends on the correct matching of numbers of interacting cell populations. One critical cell–cell interaction involves the wrapping of CNS axons by oligodendrocytes forming the myelin insulating sheath (Bunge, 1968). Although an individual oligodendrocyte can wrap many different axons, during development a sufficient number of oligodendrocytes must be generated to ensure that all axons destined to be myelinated are ensheathed along their entire length. How such a matching of cell number is accomplished is currently unclear.
Cells of the oligodendrocyte lineage can be characterized by stage-specific antigenic markers (Pfeiffer et al., 1993). In cultures of rodent CNS, immature oligodendrocyte precursors bind the monoclonal antibodies A2B5 (Raff et al., 1983) and GD3 (Pfeiffer et al., 1993), are highly migratory (Noble et al., 1988), and proliferate in response to both PDGF and bFGF (Noble et al., 1988; Raff, 1989; Bogler et al., 1990). More mature oligodendrocyte precursors bind the monoclonal antibody O4 (Sommer and Schachner, 1981), proliferate in response to bFGF (Fok-Seang and Miller, 1994), and are less migratory. Differentiated oligodendrocytes express galactocerebroside on their surface (Raff et al., 1978; Ranscht et al., 1982) and are primarily nonmigratory and nonproliferative.
In the developing spinal cord, most oligodendrocyte precursor proliferation occurs in the developing white matter (Fujita, 1965;Gilmore, 1971), and the timing of appearance of spinal cord oligodendrocytes appears to be influenced by their local environment (Schwab and Schnell, 1989). For example, myelinating oligodendrocytes appear in ventral tracts of the spinal cord approximately at the day of birth, whereas in the dorsal cortical spinal tract, oligodendrogenesis continues for an additional 2 weeks, and differentiated oligodendrocytes do not develop until the third postnatal week (Schwab and Schnell, 1989).
A number of mechanisms may regulate the final number of oligodendrocytes in the developing CNS. Analysis of rat optic nerve oligodendrocyte precursor proliferation suggests that individual precursors undergo a defined number of cell divisions, and the progeny of a single cell ceases proliferation and differentiate at approximately the same time (Raff et al., 1985; Temple and Raff, 1986). The number of divisions of a particular progenitor is regulated by an intrinsic clock that has been proposed to depend on AP-1 activity (Barres and Raff, 1994). Thus, the maximal number of oligodendrocytes generated depends directly on the initial number of progenitor cells and their subsequent number of divisions. Control of the final number of optic nerve oligodendrocytes may then be regulated by availability of a number of survival factors (Barres et al., 1992, 1994). Other factors also influence oligodendrocyte precursor proliferation. For example, conditioned medium from cultured oligodendrocyte lineage cells inhibits proliferation of oligodendrocyte precursors in vitro (Louis et al., 1992). This effect may be mediated in part by transforming growth factor B, which inhibits the proliferation of oligodendrocyte precursors in purified cultures (McKinnon et al., 1993).
Here, we show that in cultures of embryonic rat spinal cord, oligodendrocyte lineage cells reach a steady-state density independent of the initial number of precursors. This normalization of cell number appears to reflect a feedback inhibition of precursor expansion at high density, is cell-type specific, and does not appear to be mediated by a diffusible factor. These data imply that local cell–cell interactions between adjacent oligodendrocyte precursors have the potential to regulate the generation of the correct number of oligodendrocytes in specific areas of the vertebrate spinal cord.
MATERIALS AND METHODS
Cell culture. Cultures of embryonic rat spinal cord were prepared as described previously (Warf et al., 1991). The thoracic and lumbar regions of embryonic day 18 (E18) Sprague Dawley rat spinal cords were dissected and the meninges removed. Tissue was finely chopped and incubated in 0.05% trypsin in Minimum Essential Medium (S-MEM) (Life Technologies, Gaithersburg, MD) with 0.025% EDTA for 30 min at 37°C. Tissue was dissociated into single cells by trituration (10 ×) through a fire-polished Pasteur pipette. After centrifugation at 1000 × g for 5 min, cells were resuspended in DMEM with 10% FBS and plated at a density of 7.5 × 10⁴ live cells/12 mm poly-l-lysine (PLL)-coated coverslip (base culture) or at a density of 2–3 × 10⁶ live cells/75 cm2 PLL-coated flask. Twenty four hours after plating, the medium was changed to DMEM/N2 medium (Bottenstein and Sato, 1979) containing 5 μg/ml insulin, 5 μg/ml transferrin, 5 ng/ml sodium selenite, 1.6 μg/ml putrescine, 0.4 μg/ml thyroxine, 0.34 μg/ml tri-iodo-thyroxine, 60 ng/ml progesterone, 2.86% BSA, 1% FBS 5 ng/ml PDGF, and in some cases 10 ng/ml PDGF (Collaborative Research, Bedford, MA). The medium was replaced totally every other day.
Generation of enriched oligodendrocyte precursors. To generate large numbers of spinal cord oligodendrocyte precursors of the appropriate age, a preplating approach was used. E18 spinal cord cells were grown for 2 d in 75 mm2 flasks (see above). To selectively remove less adherent cells, flasks were washed three times with S-MEM with 0.025% EDTA and incubated in 0.01% trypsin in S-MEM for 5–7 min at 37°C. The enzymatic digestion was stopped by addition of 3 ml DMEM + 10% FBS and the detached cells collected. After centrifugation at 1000 × g for 5 min, the detached cells were resuspended in DMEM/N2 medium with 5 ng/ml PDGF and plated at a density of 1.8 × 10⁵ live cells/coverslip that was either PLL-coated or supported an E18 spinal cord (base) culture plated 2 d earlier. The DMEM/N2 medium was changed every other day and contained 5 ng/ml PDGF unless specified.
To estimate the proportion of oligodendrocyte precursors in the detached cell population, cultures were labeled with A2B5 antibody by indirect immunofluorescence 4–5 hr after plating (see below). Approximately 50–60% of the cells were A2B5+, whereas the majority of the cells that remained attached to the flask were glial fibrillary acidic protein-positive (GFAP+) type 1-like astrocytes.
_Immunocytochemical analysis and complement-mediated cell lysis._Cell types were identified by indirect immunofluorescence labeling procedures as described previously (Fok-Seang and Miller, 1994; Zhang and Miller, 1995). Immature oligodendrocyte precursors were identified by labeling with A2B5 antibody (Raff et al., 1983; Pfeiffer et al., 1993), more mature oligodendrocyte precursors were identified by labeling with O4 antibody (Sommer and Schachner, 1981), and newly differentiated oligodendrocytes were identified with the Rmab (Ranscht et al., 1982), which recognizes galactocerebroside as well as other oligodendrocyte antigens (Bansal et al., 1989). Astrocytes were identified by labeling with antibodies to GFAP (Bignami et al., 1972;Bignami and Dahl, 1974). For cell surface antigens (A2B5, O4, Rmab), live cells were incubated in either supernatant at a dilution of 1:1 (A2B5,O4) or ascites fluid at a dilution of 1:100 (Rmab) followed by appropriate secondary antibody. For anti-GFAP labeling, cells were fixed in 5% acetic acid in methanol at −20°C for 10 min and then incubated in rabbit anti-GFAP (Cappel, Cochranville, PA) at a dilution of 1:100 followed by appropriate secondary antibody. All antibody dilutions were made in DMEM containing 10% normal goat serum, and all fluorescein or rhodamine conjugated secondary antibodies were used at a concentration of 1:100. Specificity of immunoreactivity was confirmed by substituting the primary antibody with normal serum or by labeling with the secondary antibody alone. In both cases, no specific labeling was seen. Coverslips were mounted in glycerol containing 5%_N_-propyl gallate to reduce fading of fluorescence, and labeled cells were examined on a Nikon Optiphot microscope equipped with the appropriate filters. Photographs were recorded on Tri-X film rated at 400ASA.
To generate spinal cord cultures lacking oligodendrocyte lineage cells, complement-mediated cell lysis was used. A cocktail of A2B5, O4 antibody (supernatant 1:1), and Rmab (ascites 1:50) was incubated with spinal cord cells for 30 min at 37°C in the presence of a 1:8 dilution of rabbit complement (Life Technologies). The efficiency of cell lysis was determined by comparing the number of oligodendrocyte lineage cells surviving antibody and complement treatment with the number of oligodendrocyte lineage cells in parallel cultures treated with complement alone. In all cases, antibody + complement treatment virtually eliminated the oligodendrocyte lineage cells, whereas complement treatment alone had no significant effect.
To examine the effects of cell density on the generation of spinal cord oligodendrocytes, an in vitro assay system was developed. In these studies, a base culture was established at a density of ∼7.5 × 10⁴ total cells/12 mm coverslip, and to this, 2 d later, an age-matched enriched population of oligodendrocyte lineage cells at a concentration of ∼1.8 × 10⁵ cells/coverslip was added. The cultures were allowed to develop further for 1, 3, and 6 d and the number of cells of the oligodendrocyte lineage at different stages of maturation assayed.
To determine the relative number of A2B5+, O4+, and Rmab+ cells in base and experimental high-density cultures, representative cultures were labeled with appropriate antibodies, and the total number of labeled cells on a minimum of six nonoverlapping fields under a 40× objective was counted and the data pooled. Counts were repeated on at least two different coverslips from each preparation, and each experiment was repeated from at least three different litters of animals. Because the exact number of cells of a particular phenotype varied slightly between each preparation, the data were normalized to the cell number seen in control cultures after 3 d in vitro. Astrocyte densities were determined by counting the number of GFAP+ cells in four nonoverlapping fields under a 20× objective from at least two different coverslips in three different experiments.
Retroviral clonal analysis. To assay the clonal expansion from an individual precursor cell in cultures of different densities, retrovirus-mediated gene transfer techniques were used (Sanes et al., 1986; Price et al., 1987; Miller and Szigeti, 1991). Two to three hours after plating, the replication-incompetent retrovirus BAG2 carrying the_Escherichia coli Lac Z_ gene (PSI 2BAG α ATCC No 9560) was added to the E18 base culture. After 8 d in culture, cells expressing the Lac Z product (B-gal) were detected histochemically using X-gal as a substrate. For histochemical detection of _B-gal_-expressing cells, cultures were fixed with 4% paraformaldehyde in 0.1 m phosphate buffer, pH 7.2, for 10 min. Cultures were rinsed and incubated in the staining solution containing 1 mg/ml X-gal, 40 mm potassium ferricyanide, 40 mm potassium ferrocyanide, 2 mm MgCl2 in phosphate buffer for 40–60 min at 37°C to develop a blue product in the cytoplasm of clonally related cells. As described previously (Zhang and Miller, 1995), all batches of supernatant used in these studies were tested for the presence of replication-competent helper virus on National Institutes of Health 3T3 cells (Sanes et al., 1986), and in no case was infective virus detected.
To ensure that each cluster of B-gal+ cells represented a clone derived from a single precursor, the amount of virus added to the coverslip was adjusted such that only three to four clones were present on any single coverslip (0.8 μl). In additional controls, separate cultures were infected with increasing amounts of virus and the number of clones and number of cells/clone assayed (Zhang and Miller, 1995). With increasing amounts of virus, the number of spatially distinct clones increased linearly, whereas the mean number of cells within an oligodendrocyte clone remained relatively constant (Zhang and Miller, 1995).
To determine clone size of oligodendrocyte lineage cells grown at different densities, the number of cells in clones of small process-bearing cells was counted. To ensure that these clones represented cells of the oligodendrocyte lineage, cultures were labeled with an antibody cocktail of A2B5, O4, and Rmab antibodies and the cultures processed for X-gal staining as described previously (Zhang and Miller, 1995). As in previous studies (Zhang and Miller, 1995), virtually all multicellular clones containing small process-bearing cells were composed of cells of the oligodendrocyte lineage. From three different preparations, a total of 41 clones of oligodendrocyte lineage cells were assayed in base cultures and 45 clones in experimental cultures and the data pooled.
Bromodeoxyuridine (BrdU) incorporation assays. To examine the proliferation of A2B5+ and O4+ cells in cultures of different densities, a BrdU incorporation assay was used (Fok-Seang and Miller, 1994). Base and experimental high-density E18 spinal cord cultures were grown for 5 d and incubated for the final 24 hr in 10 μm BrdU. The proportion of A2B5+ and O4+ cells that had incorporated BrdU was determined by double-labeling with anti-BrdU and A2B5 or O4 antibodies as described previously (Fok-Seang and Miller, 1994; Zhang and Miller, 1995). Quantitation of the number of double-labeled cells was similar to that described above for cell phenotypes.
RESULTS
To examine the effects of cell density on the generation of spinal cord oligodendrocytes, base cultures of E18 rat spinal cord were plated at a density of 7.5 × 10⁴ total cells/coverslip. Because ∼20% of the plated population were A2B5+oligodendrocyte precursors (Zhang and Miller, 1995), this translated into an approximate density of 8 × 103μm2/oligodendrocyte precursor. Thus, these cells were clearly spatially separate. In experimental cultures, 1.8 × 10⁵ oligodendrocyte lineage-enriched cells were added to these cultures. The enriched population was always composed of >50% A2B5+ cells. The combination of the base and added cells gave a final density of ∼2 × 103μm2/oligodendrocyte precursor. This represents an approximate three- to fourfold increase in total oligodendrocyte progenitor density between the base and experimental cultures at the time of plating.
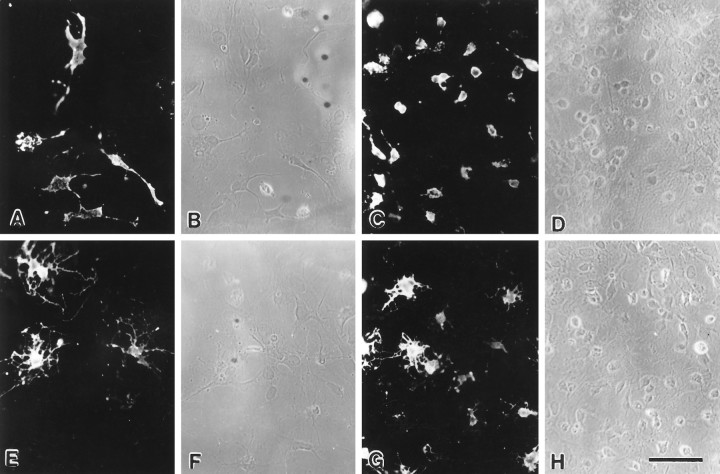
Cultures of embryonic spinal cord represent a good model in which to assay the development of oligodendrocytes. At E18, the majority of rat spinal cord oligodendrocyte precursors were A2B5+, and few O4+ or Rmab+ cells were detectable (Zhang and Miller, 1995). The cultures supported the proliferation and subsequent differentiation of oligodendrocyte lineage cells on the same time schedule as observed in vivo (Warf et al., 1991; Zhang and Miller, 1995), suggesting that many of the mechanisms that regulate oligodendrocyte differentiation were accurately reproduced in this_in vitro_ system. For example, after 3 d in vitro (equivalent of P0), both base and experimental cultures contained significant number of A2B5 and O4 immunoreactive cells (Figs.1, 2). By 8 d in vitro, all cultures contained large numbers of O4 and Rmab immunoreactive cells (Fig. 2).
Fig. 1.
Experimental cultures contain more oligodendrocyte lineage cells than base cultures 1 d after adding A2B5-enriched cells. A_–_D, The number of A2B5+ (A, C) and total (B, D) cell number is lower in base cultures (A, B) than in experimental cultures (C, D). Similarly, the number of O4+ (E, G) and total (F, H) cell number is lower in base cultures (E, F) than in experimental cultures (G_–_H). Scale bar, 50 μm.
Fig. 2.
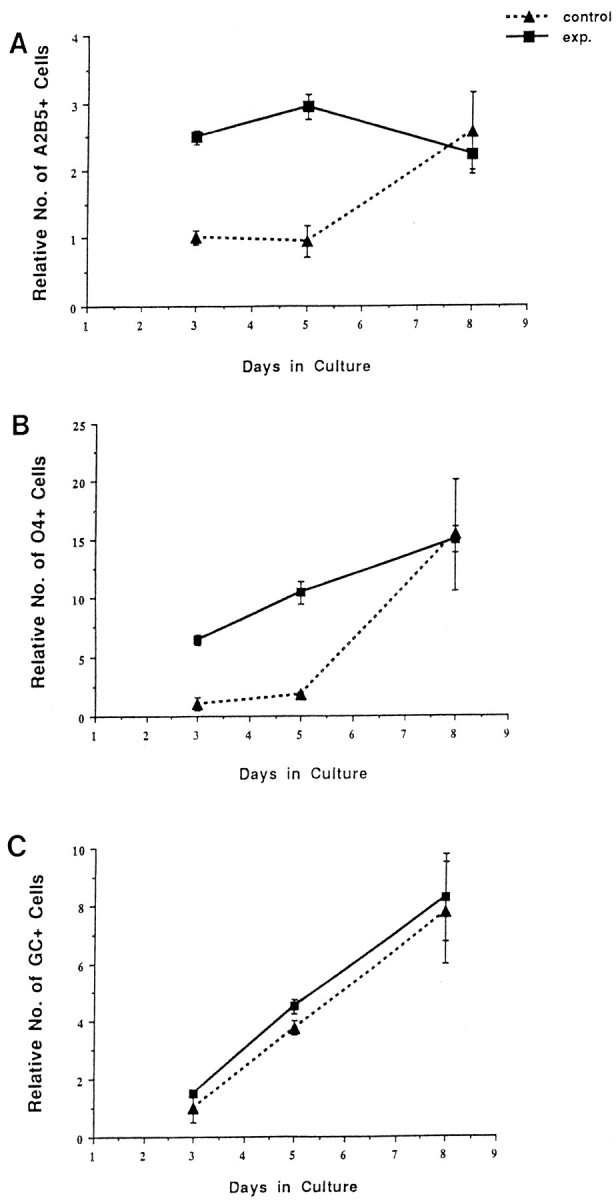
The number of oligodendrocyte lineage cells in base and experimental cultures normalizes during 6 d of culture.A, The relative number of A2B5+ cells. Although experimental cultures contained two to three times more A2B5+ cells 1 d after addition (day 3), 6 d later, both control and experimental cultures contain similar numbers of cells. B, The relative number of O4+cells. As with A2B5+ cells, the number of O4+cells in base and experimental cultures normalizes over the 6 d culture period. Note that the number of O4+ cells increases in both cultures. C, The relative numbers of Rmab+ cells in base and experimental cultures. Although both cultures show an increase in Rmab+ cells, there is no difference in the number of Rmab+ cells between base and experimental cultures. The data represent one experiment, because the initial relative number of cells of each phenotype varied among individual experiments.
Normalization of oligodendrocyte lineage cell number in spinal cord cultures of different density
The total number of oligodendrocyte lineage cells that developed in spinal cord cultures was not directly correlated with the original number of oligodendrocyte precursors. Initially, experimental cultures contained substantially more oligodendrocyte precursors than base cultures. For example, 1 d after adding experimental cells, the number of A2B5+ immature oligodendrocyte precursors was 2.5- to 3.5-fold higher in experimental high-density cultures than in base cultures (Figs. 1, 2A). The relative difference in the number of immature oligodendrocyte precursors between experimental and base cultures was maintained for an additional 2 d in culture (Fig. 2A). By contrast, after an additional 3 d of culture [8 d in vitro (DIV) total], the number of A2B5+ cells in experimental and base cultures was similar (Figs. 2A, 3). In all preparations, the normalization of the number of immature oligodendrocyte recursors reflected a slight decrease in the number of A2B5+ cells in experimental cultures over time, as well as an increase in the number of A2B5+ cells in base culture (Fig. 2A). These observations suggest that A2B5+ cells are depleted through maturation in experimental cultures and not totally replaced by cell proliferation, whereas in base cultures, the number of A2B5+ cells generated by proliferation greatly outnumbers those depleted through maturation.
Fig. 3.
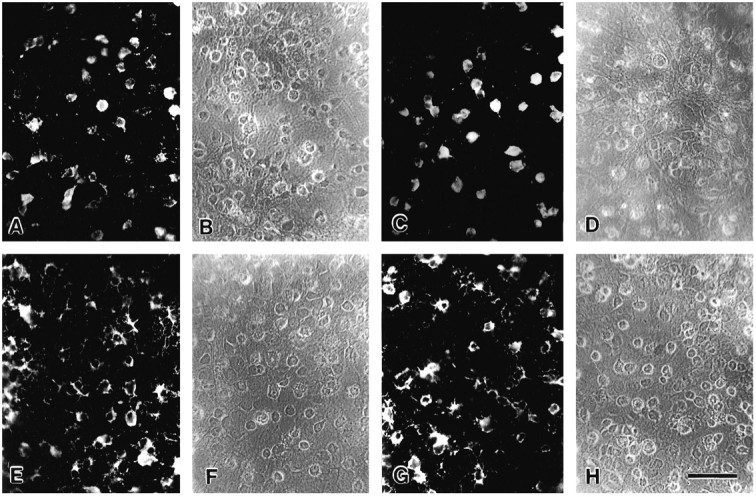
Experimental and base cultures contain similar numbers of oligodendrocyte lineage cells after 6 d of culture.A_–_D, The number of A2B5+(A, C) cells is comparable in base (A, B) and experimental (C, D) cultures. Similarly, the number of O4+ (E, G) are comparable in base (E, F) and experimental (G, H) cultures. Note that although the number of A2B5+ has not increased significantly from that seen in the experimental cultures 5 d earlier (Fig. 1C), the number of O4+ cells has increased significantly in both base and experimental cultures.B, D, F, H, Phase-contrast micrographs. Scale bar, 50 μm.
A similar normalization in the number of more mature O4+oligodendrocyte precursors occurred over time. For example, as expected, experimental cultures contained between 5- and 10-fold as many O4+ cells than base cultures during the first 5 d_in vitro_ (Figs. 1, 2B). By contrast, at the end of the culture period, similar numbers of O4+ cells were present in both experimental and control cultures (Figs.2B, 3). This normalization of O4+ cell number resulted from a dramatic increase in O4+ cells in base cultures compared with a smaller increase in the number of O4+ cells in experimental cultures (Fig.2B).
Differentiated oligodendrocytes did not show the same normalization in cell number. In contrast to oligodendrocyte precursors as assayed by A2B5 and O4 antibodies, there was little initial difference in the number of Rmab+ cells between the base and experimental cultures, reflecting the immature status of the cell population. Although experimental cultures contained many more oligodendrocyte precursors than base cultures at the start of the culture period, the number of Rmab+ cells that subsequently developed in both cultures was similar (Fig. 2C). Thus, a larger initial precursor pool is not directly reflected in a subsequent comparable increase in the number of differentiated oligodendrocytes over the period of the assay. These observations suggest that the normalization of cell number that occurs in these spinal cord cultures is primarily a response of precursor cell populations rather than differentiated oligodendrocytes.
Astrocyte cell numbers also increased during the course of the experiment. Initially, base cultures contained astrocytes at a density of ∼3 × 103 μm2/astrocyte, whereas experimental cultures contained a slightly higher density of ∼1.7 × 103 μm2/astrocyte. Within 1–2 d, astrocyte density in both base and experimental cultures stabilized at a density of ∼1.3 × 103μm2/astrocyte and were unchanged for the duration of the experiment.
Clone size is reduced at high density
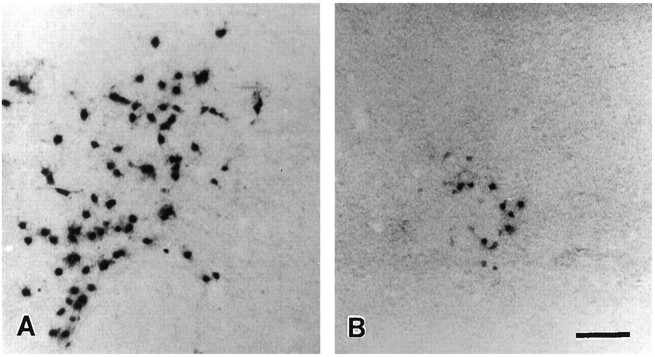
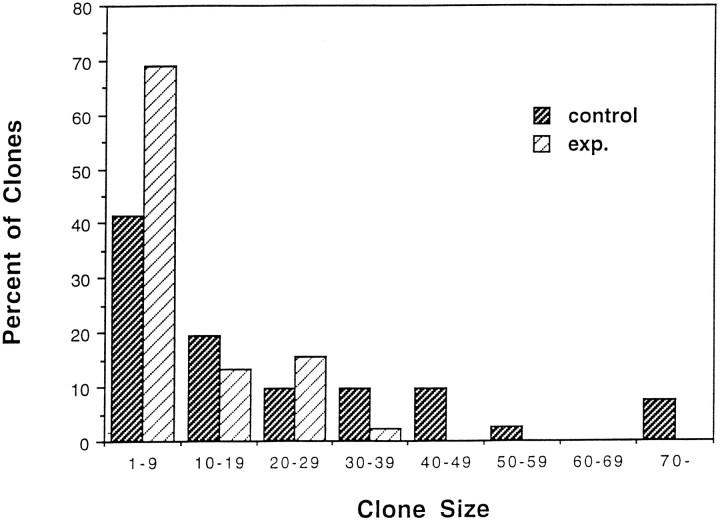
A number of factors may contribute to the normalization of oligodendrocyte precursor cell number in cultures of different densities. Because the number of oligodendrocyte precursors did not increase dramatically in experimental cultures, it seemed likely that clonal expansion of oligodendrocyte precursors was reduced at high density. To compare clonal expansion of oligodendrocyte precursors in base and experimental cultures, a retroviral clonal analysis was used (Zhang and Miller, 1995). BAG2 retrovirus was added to the cultures at the time of initial plating, 2 d before adding additional cells to experimental cultures. Cultures were grown for 8 d to allow proliferation and differentiation and the size of clones of the oligodendrocyte lineage determined. Although similar numbers of clones/coverslip were present in both base and experimental cultures, clones in base culture contained more cells than clones in experimental cultures (Figs. 4, 5). In base cultures, from 41 clones assayed, the average clones size was 23 (Fig. 5), and 16% of the clones contained >40 cells. By contrast, in experimental cultures, the average clones size was four cells, and no clones contained >40 cells. These observations indicate a substantial reduction in the number of progeny generated by a single oligodendrocyte precursor in high-density experimental cultures compared with base cultures. This difference in clonal expansion contributes to the normalization of the number of oligodendrocyte lineage cells in cultures of different densities over time.
Fig. 4.
Clonal expansion of oligodendrocyte lineage cells is greater in low-density base cultures (A) than in high-density experimental cultures (B). E18 spinal cord cells were infected with BAG2 retrovirus at the time of plating. Two days later, A2B5-enriched cells were added to experimental cultures. After an additional 6 d in vitro, the size of clones of oligodendrocyte lineage cells was determined.A, B, Low-magnification micrograph of X-gal-stained oligodendrocyte lineage clones from base (A) and experimental (B) cultures. Note that there are far more cells in the base culture clone than in the experimental culture clone. Scale bar, 100 μm.
Fig. 5.
Experimental high-density cultures contain more smaller clones and fewer large clones of oligodendrocyte lineage cells than base cultures. Data represent the proportion of clones containing different numbers of cells from 41 control (base) clones and 45 experimental clones. Although ∼16% of the clones in control cultures contain >40 cells, no experimental clones contain >40 cells.
Oligodendrocyte precursor proliferation is reduced at high density
To determine whether the proliferation of oligodendrocyte precursors was influenced by cell density, base and experimental cultures were grown for 5 d with the thymidine analog BrdU present for the final 24 hr. The proportion of immature A2B5+ and more mature O4+ oligodendrocyte precursors that had incorporated BrdU at the different densities was compared. In base cultures, 35–45% of A2B5+ cells incorporated BrdU. In experimental cultures, the proportion of A2B5+ cells that had incorporated BrdU was reduced by ∼40% (Fig. 6). The reduction in the proportion of O4+ cells that incorporated BrdU between experimental and control cultures was more striking. In base cultures, ∼20% of O4+ cells incorporated BrdU, and this was reduced by >80% in experimental cultures (Fig. 6). These data suggest that increased precursor density predominantly inhibits proliferation of O4+ oligodendrocyte precursors.
Fig. 6.
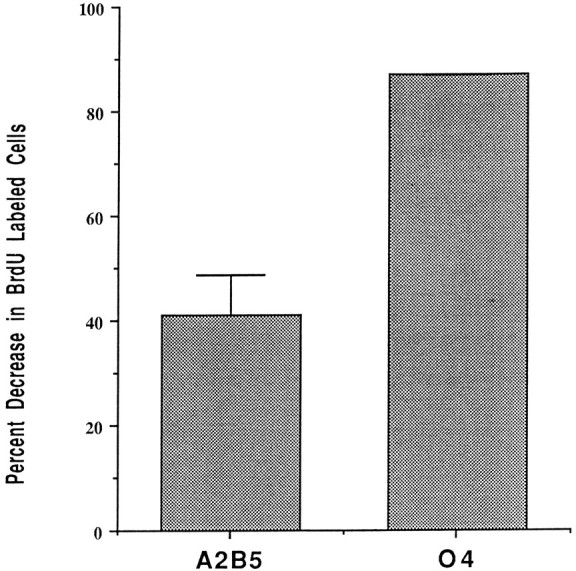
The proliferation of oligodendrocyte lineage cells is reduced at high density. Quantification of the proportional decrease in BrdU incorporation of A2B5+ and O4+ cells between base and experimental cultures. In base cultures, ∼35-45% of the A2B5+ cells incorporated BrdU, and this was reduced by 40% in experimental cultures. The reduction in proliferation of O4+ cells at high density was more striking. Approximately 20% of O4+ cells proliferated in control cultures, and this was reduced by >80% in experimental cultures. Data represent the mean ± SD from three different experiments.
Reduction in oligodendrocyte precursor expansion at high density is not attributable to limited supply of mitogen
To test the possibility that a limited supply of mitogen/survival factor was responsible for the reduction in cell proliferation and clone size seen at high density, the effects of the addition of 10 ng/ml PDGF were evaluated. The addition of PDGF to experimental cultures did not result in an increase in the number of A2B5+ cells over the culture period (Fig.7). Likewise, the increase in A2B5+ cells in base cultures was not substantially different in the presence or absence of PDGF (compare Figs. 7 and 2). Similarly, the addition of PDGF did not result in a substantial increase the number of O4+ or Rmab+ cells that developed in experimental or base cultures during the course of the experiment (Fig.7B,C). Thus, addition of exogenous PDGF appears to have little effect on the generation of oligodendrocyte lineage cells in these spinal cord cultures. Consistent with these observations, retroviral clonal analysis indicated that the average clone size in base and experimental cultures with exogenously added PDGF was not significantly different from that seen in control cultures (data not shown). These studies suggest that both base and experimental cultures contain saturating levels of PDGF and that the limited precursor expansion in experimental high-density cultures is not attributable to a limiting supply of this factor.
Fig. 7.
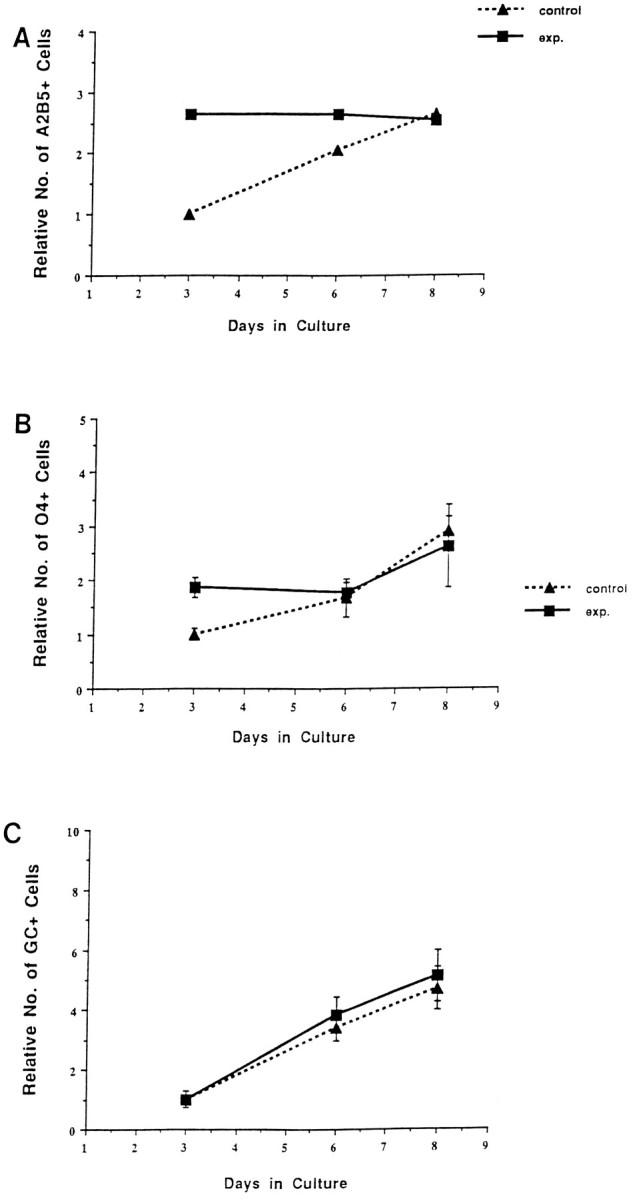
The addition of increased amounts of PDGF does not significantly alter the relative number of oligodendrocyte lineage cells in base and experimental cultures. A, The relative numbers of A2B5+ cells. Although at 3 DIV, there were threefold more A2B5+ cells in experimental than base cultures, after 8 DIV, the number is similar. B, The relative number of O4+ cells that normalize over the culture period. C, The relative number of Rmab+ cells, which is similar in both cultures. Note that the overall pattern of cell numbers in these cultures, which contained an additional 10 ng/ml PDGF in the medium, is indistinguishable from that in standard culture conditions, as shown in Figure 2.
Inhibition of oligodendrocyte precursor proliferation depends specifically on oligodendrocyte precursors density
Spinal cord cultures contain many types of neural cells that may regulate the proliferation of oligodendrocyte precursors. Attempts to isolate large numbers of enriched spinal cord oligodendrocyte lineage cells without prolonged subculture were not successful. Therefore, in an alternative approach, oligodendrocyte lineage cells were specifically eliminated from E18 spinal cord cultures by a combination of A2B5- and O4-mediated complement cell lysis and the influence of the residual cell population on oligodendrocyte precursor cell number assayed.
In the absence of oligodendrocyte lineage cells, spinal cord cells at high density had no effect on the expansion of oligodendrocyte precursors (Fig. 8). Both base and experimental cultures initially contained the same number of oligodendrocyte lineage cells, because these cells selectively depleted from the added spinal cord cells. Experimental cultures, however, contained more than twice as many astrocytes as base cultures. Similar numbers of A2B5+cells developed in base and experimental cultures (Fig. 8), even though experimental cultures contained nearly three times as many total cells. Similarly, the number of O4+ and Rmab+ cells was comparable between base and experimental cultures at all stages assayed (Fig. 8). Consistent with these results, retroviral clonal analysis indicated that there was no substantial difference in the average clone size of oligodendrocyte lineage cells (∼25 cells/clone from 20 clones assayed) between base and experimental cultures (data not shown). These results suggest that the reduction in oligodendrocyte precursor expansion in experimental cultures is a specific response to the high density of oligodendrocyte precursors in those cultures.
Fig. 8.
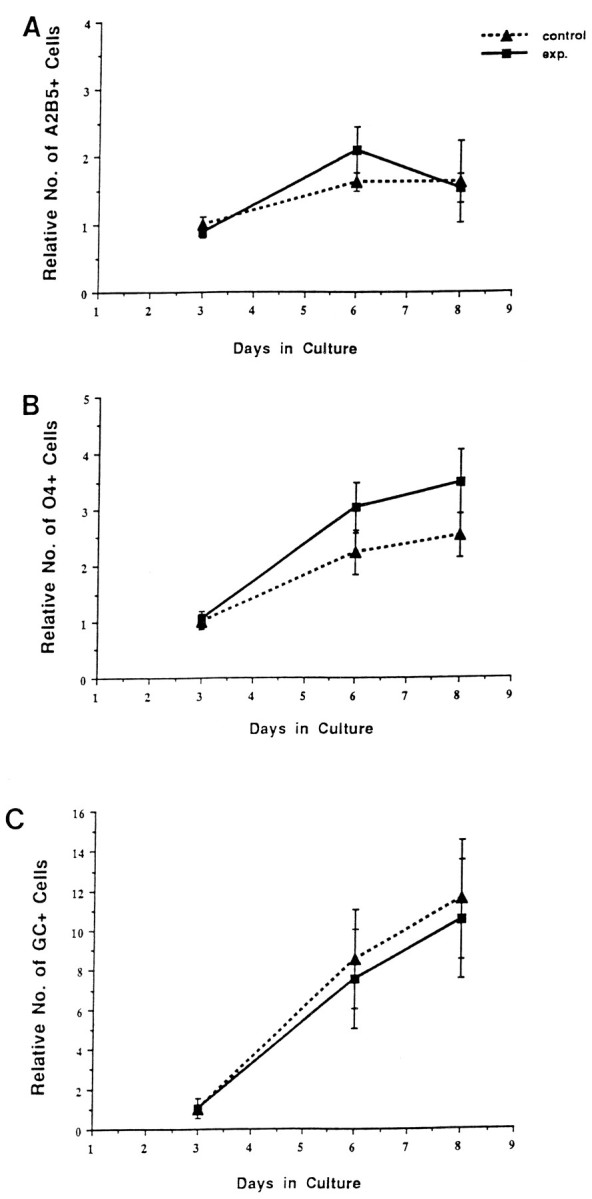
Addition of oligodendrocyte lineage-depleted spinal cord cells did not inhibit the expansion of oligodendrocyte lineage cells in the base culture. A, The relative number of A2B5+ cells in control (base) culture and experimental culture containing additional nonoligodendrocyte lineage spinal cord cells. There is no significant difference in the number of A2B5+ cells between the two cultures at any stage.B, C, The relative numbers of O4+ and Rmab+ cells in base and experimental cultures are comparable, even though the experimental cultures contained nearly three times as many total cells.
The inhibition of oligodendrocyte precursor proliferation is not mediated by long-range diffusible factors
To determine whether the inhibition of oligodendrocyte proliferation in high-density cultures reflects soluble inhibitory factors, base low-density cultures were grown in “transwell” cultures with high-density experimental cultures such that the cells were physically separated but growing in the same medium. The number of A2B5+ cells was indistinguishable between base cultures grown in the presence or absence of transwell high-density cultures (Fig. 9). In both cases, the number of A2B5+cells increased approximately twofold during the culture period. Similarly, the number of O4+ cells that developed in control and transwell cultures was not substantially different (Fig.9), with an approximate twofold increase in cell number. As in all other cases, the number of Rmab+ cells increased during the culture period, and there was no apparent difference in the extent of increase between the control and transwell cultures.
Fig. 9.
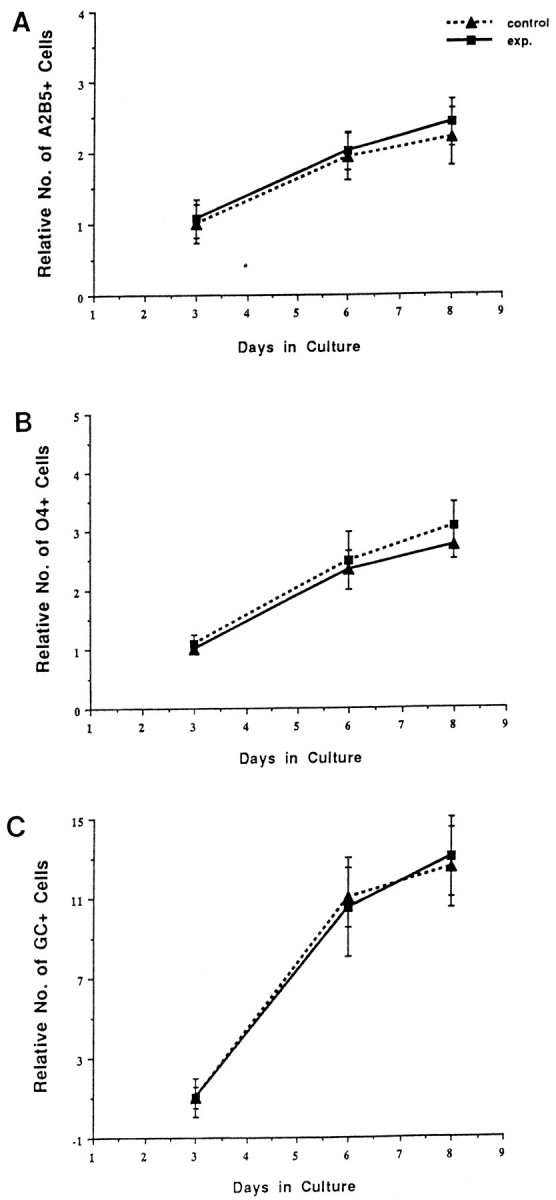
Transwell cocultures of base cultures and high-density cultures did not inhibit expansion of oligodendrocyte lineage cells. The relative numbers of A2B5+(A), O4+ (B), and Rmab+ (C) cells in control and transwell (experimental) cultures. Similar numbers of all three cell phenotypes develop in both cultures, even though the experimental transwell cultures share medium with a high-density culture.
These data suggest that the inhibition of oligodendrocyte precursor cell proliferation in high-density cultures is unlikely to be mediated through a long-range diffusible factor.
DISCUSSION
The regulation of cell number during the development of the nervous system is of critical importance for the correct functioning of the adult animal. For example, in CNS white matter, the number of oligodendrocytes destined to myelinate CNS axons must be sufficient to ensheath the full complement axons. Here, we show that a density-dependent feedback inhibition of oligodendrocyte precursor expansion can regulate the final number of oligodendrocyte lineage cells. Such a mechanism may play a role determining the local density of oligodendrocytes in discrete regions of the developing spinal cord white matter. Several lines of evidence suggest that this inhibition of proliferation is independent of other cell types. First, the density of astrocytes in base and experimental cultures rapidly equilibrate and remain constant during the period when oligodendrocyte precursor proliferation is different in the two cultures. Second, the addition of large numbers of nonoligodendrocyte lineage spinal cord cells had no effect on the subsequent proliferation of oligodendrocyte precursors. Finally, density-dependent feedback inhibition of oligodendrocyte precursor proliferation occurs in pure cultures in the absence of other cell types (V. Szigeti, R. H. Miller, unpublished observations).
We propose the following model to explain how the appropriate number of oligodendrocytes is generated in specific regions of the spinal cord during development. Initially, oligodendrocyte precursors arise in specific regions of the ventricular zone of the spinal cord (Noll and Miller, 1993; Pringle and Richardson, 1993; Cameron-Currey and LeDouarin, 1995; Ono et al., 1995). The progeny of these cells subsequently migrate laterally to populate the developing white matter (Noll and Miller, 1993; Cameron-Currey and LeDouarin, 1995; Ono et al., 1995). In rat, this migration is most likely accomplished by A2B5+ immature precursors (Warrington et al., 1993). Once precursors reach developing white matter, they continue to proliferate and mature (Fujita, 1965; Gilmore, 1971). At this stage, the local density of precursors increases through proliferation until, depending on the size and number of available axons, a critical density is reached. As a consequence of this elevated density, further expansion of the precursor population is inhibited by a density-dependent feedback inhibition of precursor expansion. Oligodendrocyte precursors subsequently differentiate and myelinate axons in their vicinity.
This model is generally compatible with studies on oligodendrocyte development in clonal cultures of rat optic nerve cells (Barres and Raff, 1994). In this case, the number of oligodendrocytes that develop in the optic nerve is directly dependent on the number of precursor cells that migrate into the nerve. The cells are proposed to undergo a defined number of divisions stimulated by axonal activity (Barres and Raff, 1993) before differentiating in accordance with a cell intrinsic clock (Temple and Raff, 1986; Raff et al., 1988). The final number of oligodendrocytes is then established through competition for limiting supplies of a number of survival factors (Barres et al., 1992; Barres and Raff, 1994).
Unlike spinal cord, optic nerve does not contain an intrinsic source of oligodendrocyte progenitors. Rather, these cells migrate into the nerve from the brain (Small et al., 1987; ffrench-Constant et al., 1988). If a relatively small number of precursors with limited proliferative capacity initially populate the nerve, they may not retain sufficient proliferative capacity to achieve the density required to evoke the density-dependent feedback inhibition of proliferation on a large scale. Thus, the final number of cells would be more directly correlated with the initial number of founder cells. In spinal cord, where the general cell number may be established by density-dependent inhibition, the final number of oligodendrocytes in any specific region may be determined through competition for local survival factors as in optic nerve (Barres and Raff, 1994). It seems likely that additional influences from surrounding axons and other cellular components of developing white matter also contribute to establishing the final density of differentiated oligodendrocytes in vivo.
The mechanisms that inhibit oligodendrocyte proliferation are not well understood. In cultures of purified oligodendrocyte precursors and in oligodendrocyte cell lines (Louis et al., 1992; McKinnon et al., 1993), soluble factors secreted by oligodendrocyte lineage cells can inhibit their proliferation in an autocrine manner. At least some of these factors belong to the TGF-β family (McKinnon et al., 1993), which also inhibit the proliferation of astrocytes (Hunter et al., 1993). The inhibition of spinal cord oligodendrocyte precursors through the action of long-range diffusible factors seems unlikely. Transwell high-density cultures did not inhibit oligodendrocyte precursor expansion in the low-density culture, even though they shared the same fluid environment. Thus, density-dependent feedback inhibition of proliferation of spinal cord oligodendrocyte precursors appears to act locally.
Local autocrine signals that regulate the expansion of oligodendrocyte precursor populations would allow for fine temporal/spatial regulation of oligodendrocyte development in a complex region of the vertebrate CNS. For example, during development of the vertebrate spinal cord, different white matter regions mature at different times (Windle et al., 1934). In some cases, adjacent axon tracts such as the cortico-spinal tract (CST) and fasciculus cuneate and gracile develop >1 week apart (Schreyer and Jones, 1982). Thus, whereas cuneate and gracile are composed predominantly of myelinated axons, the CST still contains predominantly elongating axons (Schwab and Schnell, 1989). In fact, inhibitors of axon outgrowth on the oligodendrocyte lineage cells of cuneate and gracile have been suggested to be involved in the guidance of growing axons in the CST (Schwab and Schnell, 1991). Thus, oligodendrocyte precursor proliferation is essentially complete in cuneate and gracile before it has commenced in the CST. Local regulation of oligodendrocyte proliferation would allow for inhibition of proliferation in cuneate and gracile but continued proliferation in the CST, thereby matching immediate environmental requirements.
One prediction of the density-dependent inhibition of proliferation model is that experimental manipulation of oligodendrocyte lineage cell number in the developing spinal cord should be compensated for by alterations in the proliferative behavior of remaining cells. Locally increasing the density of oligodendrocyte lineage cells through injection of purified populations into neonatal rat spinal cord did suppress proliferation of local white matter glia (L. Milner, H. Zhang, R. Miller, unpublished observations). Interpretation of these results is confounded, however, by the injury responses in the spinal cord to the injection. More importantly, selective loss of oligodendrocyte lineage cells in the developing spinal cord results in increased proliferation of precursors (Skoff, 1982). In the hypomyelinated mouse mutant Jimpy, there is selective and premature death of the oligodendrocyte cell population (Knapp et al., 1986). This cell death results in a significant reduction in the oligodendrocyte cell population (Kraus-Ruppert et al., 1973; Meier and Bischoff, 1975; Skoff, 1976; Ghandour and Skoff, 1988). Analysis of cell proliferation in Jimpy mouse spinal cord demonstrates a significant increase in the number of proliferating glial precursors (Skoff, 1982) compared with normal animals, the majority of which are oligodendrocyte precursors (Skoff, 1982). These data are consistent with the density-dependent feedback inhibition model, such that because of loss of mutant oligodendrocytes, a critical density for feedback inhibition is never obtained, and oligodendrocyte precursors continue to proliferate.
The concept of local cell density-dependent regulation of cell number is not new (Wieser et al., 1990). Studies on normal mammalian fibroblast-like cells in vitro indicate that cell–cell interactions mediated by specific cell surface glycoproteins result in an inhibition of cell proliferation (Wieser et al., 1990). Among cells of the vertebrate CNS, interactions between granule cell neurons and astrocytes of the cerebellum have been proposed to inhibit the proliferation and promote differentiation of astrocytes (Hatten, 1985,1987; Hatten and Shelanski, 1988). Recently, cell–cell interactions mediated through the neural cell adhesion molecule have been proposed to inhibit the proliferation of astrocytes (Sporns et al., 1995). The molecular mechanisms mediating the local inhibition of oligodendrocyte proliferation are currently unclear.
In conclusion, we propose that one mechanism that regulates the overall oligodendrocyte numbers in the developing spinal cord is a local density-dependent feedback inhibition of precursor expansion. This inhibition is specific for cells of the oligodendrocyte lineage and is mediated through either contact or very local-acting diffusible factors.
Footnotes
This work was supported by National Institutes of Health Grants NS-25597 and NS30800. We thank Vilma Szigeti for assistance with all aspects of this study. We also thank Drs. Alison Hall, Story Landis, and Jerry Silver for helpful advice and Alison Hall for critical reading of this manuscript.
Correspondence should be addressed to Dr. Robert H. Miller at the above address.
Dr. Zhang’s current address: Section of Neurobiology, Yale University School of Medicine, New Haven, CT 06518.
REFERENCES
- 1.Bansal R, Warrington AE, Gard AL, Ranscht B, Pfeiffer SE. Multiple and novel specificities of monoclonal antibodies O1, O4, and R-mAb used in the analysis of oligodendrocyte development. J Neurosci Res. 1989;24:548–557. doi: 10.1002/jnr.490240413. [DOI] [PubMed] [Google Scholar]
- 2.Barres BA, Raff MC. Proliferation of oligodendrocyte precursor cells depends on electrical activity in axons. Nature. 1993;361:258–260. doi: 10.1038/361258a0. [DOI] [PubMed] [Google Scholar]
- 3.Barres BA, Raff MC. Control of oligodendrocyte number in the developing rat optic nerve. Neuron. 1994;12:935–942. doi: 10.1016/0896-6273(94)90305-0. [DOI] [PubMed] [Google Scholar]
- 4.Barres BA, Hart IK, Coles HS, Burne JF, Voyvodic JT, Richardson WD, Raff MC. Cell death and control of cell survival in the oligodendrocyte lineage. Cell. 1992;70:31–46. doi: 10.1016/0092-8674(92)90531-g. [DOI] [PubMed] [Google Scholar]
- 5.Barres BA, Lazar MA, Raff MC. A novel role for thyroid hormone, glucocorticoids and retinoic acid in timing oligodendrocyte development. Development. 1994;120:1097–1108. doi: 10.1242/dev.120.5.1097. [DOI] [PubMed] [Google Scholar]
- 6.Bignami A, Dahl D. Astrocyte-specific protein and radial glia in the cerebral cortex of newborn rat. Nature. 1974;252:55–56. doi: 10.1038/252055a0. [DOI] [PubMed] [Google Scholar]
- 7.Bignami A, Eng LF, Dahl D, Uyeda CT. Localization of the glial fibrillary acidic protein in astrocytes by immunofluorescence. Brain Res. 1972;43:429–435. doi: 10.1016/0006-8993(72)90398-8. [DOI] [PubMed] [Google Scholar]
- 8.Bogler O, Wren D, Barnett SC, Land H, Noble M. Cooperation between two growth factors promotes extended self-renewal and inhibits differentiation of oligodendrocyte-type-2 astrocyte (O-2A) progenitor cells. Proc Natl Acad Sci USA. 1990;87:6368–6372. doi: 10.1073/pnas.87.16.6368. [DOI] [PMC free article] [PubMed] [Google Scholar]
- 9.Bottenstein JE, Sato GH. Growth of a rat neuroblastoma cell line in serum-free supplemented medium. Proc Natl Acad Sci USA. 1979;76:514–517. doi: 10.1073/pnas.76.1.514. [DOI] [PMC free article] [PubMed] [Google Scholar]
- 10.Bunge RP. Glial cells and the central myelin sheath. Physiol Rev. 1968;48:197–251. doi: 10.1152/physrev.1968.48.1.197. [DOI] [PubMed] [Google Scholar]
- 11.Cameron-Currey P, LeDouarin NM. Oligodendrocyte precursors originate from both the dorsal and ventral parts of the spinal cord. Neuron. 1995;15:1299–1310. doi: 10.1016/0896-6273(95)90009-8. [DOI] [PubMed] [Google Scholar]
- 12.ffrench-Constant C, Miller RH, Burne JF, Raff MC. Evidence that migratory oligodendrocyte-type-2 astrocyte (O-2A) progenitor cells are kept out of the rat retina by a barrier at the eye-end of the optic nerve. J Neurocytol. 1988;17:13–25. doi: 10.1007/BF01735374. [DOI] [PubMed] [Google Scholar]
- 13.Fok-Seang J, Miller RH. Distribution and differentiation of A2B5+ glial precursors in the developing rat spinal cord. J Neurosci Res. 1994;37:219–235. doi: 10.1002/jnr.490370208. [DOI] [PubMed] [Google Scholar]
- 14.Fujita S. An autoradiographic study on the origin and fate of the sub-pial glioblasts in the embryonic chick spinal cord. J Comp Neurol. 1965;124:41–50. doi: 10.1002/cne.901240105. [DOI] [PubMed] [Google Scholar]
- 15.Ghandour MS, Skoff RP. Expression of galactocerebroside in developing normal and jimpy oligodendrocytes in situ. J Neurocytol. 1988;17:485–495. doi: 10.1007/BF01189804. [DOI] [PubMed] [Google Scholar]
- 16.Gilmore SA. Neuroglial populations in the spinal white matter of neonatal and early postnatal rats: an autoradiographic study of numbers of neuroglia and changes in their proliferative activity. Anat Rec. 1971;171:283–292. doi: 10.1002/ar.1091710208. [DOI] [PubMed] [Google Scholar]
- 17.Hatten ME. Neuronal regulation of of astroglial morphology and proliferation in vitro. J Cell Biol. 1985;100:384–396. doi: 10.1083/jcb.100.2.384. [DOI] [PMC free article] [PubMed] [Google Scholar]
- 18.Hatten ME. Neuronal inhibition of astroglial cell proliferation is membrane mediated. J Cell Biol. 1987;104:1353–1360. doi: 10.1083/jcb.104.5.1353. [DOI] [PMC free article] [PubMed] [Google Scholar]
- 19.Hatten ME, Shelanski ML. Mouse cerebellar granule neurons arrest the proliferation of human and rodent astrocytoma cells in vitro. J Neurosci. 1988;8:1447–1453. doi: 10.1523/JNEUROSCI.08-04-01447.1988. [DOI] [PMC free article] [PubMed] [Google Scholar]
- 20.Hunter KE, Sporn MB, Davies AM. Transforming growth factor-Bs inhibit mitogen-stimulated proliferation of astrocytes. Glia. 1993;7:203–211. doi: 10.1002/glia.440070303. [DOI] [PubMed] [Google Scholar]
- 21.Knapp PE, Skoff RP, Redstone DW. Oligodendroglial cell death in jimpy mice: an explanation for the myelin deficit. J Neurosci. 1986;6:2813–2822. doi: 10.1523/JNEUROSCI.06-10-02813.1986. [DOI] [PMC free article] [PubMed] [Google Scholar]
- 22.Kraus-Ruppert R, Herschkowitz N, Furst S. Morphological studies on neuroglial cells in the corpus callosum of the jimpy mutant mouse. J Neuropathol Exp Neurol. 1973;32:197–203. doi: 10.1097/00005072-197304000-00002. [DOI] [PubMed] [Google Scholar]
- 23.Louis JC, Muir D, Varon S. Autocrine inhibition of mitotic activity in cultured oligodendrocyte-type-2 astrocyte (O-2A) precursor cells. Glia. 1992;6:30–38. doi: 10.1002/glia.440060105. [DOI] [PubMed] [Google Scholar]
- 24.McKinnon RD, Piras G, Ida JA, Dubois-Dalcq M. A role for TGF-B in oligodendrocyte differentiation. J Cell Biol. 1993;121:1397–1407. doi: 10.1083/jcb.121.6.1397. [DOI] [PMC free article] [PubMed] [Google Scholar]
- 25.Meier C, Bischoff A. Oligodendroglial cell development in jimpy mice and controls, an electron-microscope study in the optic nerve. J Neurol Sci. 1975;26:517–528. doi: 10.1016/0022-510x(75)90053-2. [DOI] [PubMed] [Google Scholar]
- 26.Miller RH, Szigeti V. Clonal analysis of astrocyte diversity in neonatal rat spinal cord cultures. Development. 1991;113:353–362. doi: 10.1242/dev.113.1.353. [DOI] [PubMed] [Google Scholar]
- 27.Noble M, Murray K, Stroobant P, Waterfield MD, Riddle P. Platelet-derived growth factor promotes division and motility and inhibits premature differentiation of the oligodendrocyte/type-2 astrocyte progenitor cell. Nature. 1988;333:560–562. doi: 10.1038/333560a0. [DOI] [PubMed] [Google Scholar]
- 28.Noll E, Miller RH. Oligodendrocyte precursors originate at the ventral ventricular zone dorsal to the ventral midline in the embryonic rat spinal cord. Development. 1993;118:563–573. doi: 10.1242/dev.118.2.563. [DOI] [PubMed] [Google Scholar]
- 29.Ono K, Bansal R, Payne J, Rutishauser U, Miller RH. Early development and dispersal of oligodendrocyte precursors in the embryonic chick spinal cord. Development. 1995;121:1743–1754. doi: 10.1242/dev.121.6.1743. [DOI] [PubMed] [Google Scholar]
- 30.Pfeiffer SE, Warrington AE, Bansal R. The oligodendrocyte and its many cellular processes. Trends Cell Biol. 1993;3:191–197. doi: 10.1016/0962-8924(93)90213-k. [DOI] [PubMed] [Google Scholar]
- 31.Price J, Turner D, Cepko C. Lineage analysis in the vertebrate nervous system by retrovirus-mediated gene transfer. Proc Natl Acad Sci USA. 1987;84:156–160. doi: 10.1073/pnas.84.1.156. [DOI] [PMC free article] [PubMed] [Google Scholar]
- 32.Pringle NP, Richardson WD. A singularity of PDGF alpha-receptor expression in the dorsoventral axis of the neural tube may define the origin of the oligodendrocyte lineage. Development. 1993;117:525–533. doi: 10.1242/dev.117.2.525. [DOI] [PubMed] [Google Scholar]
- 33.Raff MC. Glial cell diversification in the rat optic nerve. Science. 1989;243:1450–1455. doi: 10.1126/science.2648568. [DOI] [PubMed] [Google Scholar]
- 34.Raff MC, Mirsky R, Fields KL, Lisak RP, Dorfman SH, Silberberg DH, Gregson NA, Liebowitz S, Kennedy PC. Galactocerebroside is a specific cell surface antigenic marker for oligodendrocytes in culture. Nature. 1978;274:813–816. [PubMed] [Google Scholar]
- 35.Raff MC, Miller RH, Noble M. A glial progenitor cell that develops in vitro into an astrocyte or an oligodendrocyte depending on culture medium. Nature. 1983;303:390–396. doi: 10.1038/303390a0. [DOI] [PubMed] [Google Scholar]
- 36.Raff MC, Abney ER, Fok-Seang J. Reconstitution of a developmental clock in vitro: a critical role for astrocytes in the timing of oligodendrocyte differentiation. Cell. 1985;42:61–69. doi: 10.1016/s0092-8674(85)80101-x. [DOI] [PubMed] [Google Scholar]
- 37.Raff MC, Lillien LE, Richardson WD, Burne JF, Noble MD. Platelet-derived growth factor from astrocytes drives the clock that times oligodendrocyte development in culture. Nature. 1988;333:562–565. doi: 10.1038/333562a0. [DOI] [PubMed] [Google Scholar]
- 38.Ranscht B, Clapshaw PA, Price J, Noble M, Seifert W. Development of oligodendrocytes and Schwann cells studied with a monoclonal antibody against galactocerebroside. Proc Natl Acad Sci USA. 1982;79:2709–2713. doi: 10.1073/pnas.79.8.2709. [DOI] [PMC free article] [PubMed] [Google Scholar]
- 39.Sanes JR, Rubenstein JL, Nicolas JF. Use of a recombinant retrovirus to study post-implantation cell lineage in mouse embryos. EMBO J. 1986;5:3133–3142. doi: 10.1002/j.1460-2075.1986.tb04620.x. [DOI] [PMC free article] [PubMed] [Google Scholar]
- 40.Schreyer DJ, Jones EG. Growth and target finding by axons of the corticospinal tracts in prenatal and postnatal rats. Neuroscience. 1982;7:1837–1853. doi: 10.1016/0306-4522(82)90001-x. [DOI] [PubMed] [Google Scholar]
- 41.Schwab ME, Schnell L. Region-specific appearance of myelin constituents in the developing rat spinal cord. J Neurocytol. 1989;18:161–169. doi: 10.1007/BF01206659. [DOI] [PubMed] [Google Scholar]
- 42.Schwab ME, Schnell L. Channeling of developing rat corticospinal tract axons by myelin-associated neurite growth inhibitors. J Neurosci. 1991;11:709–721. doi: 10.1523/JNEUROSCI.11-03-00709.1991. [DOI] [PMC free article] [PubMed] [Google Scholar]
- 43.Skoff RP. Increased proliferation of oligodendrocytes in the hypomyelinated mouse mutant-jimpy. Brain Res. 1982;248:19–31. doi: 10.1016/0006-8993(82)91143-x. [DOI] [PubMed] [Google Scholar]
- 44.Small RK, Riddle P, Noble M. Evidence for migration of oligodendrocyte–type-2 astrocyte progenitor cells into the developing rat optic nerve. Nature. 1987;328:155–157. doi: 10.1038/328155a0. [DOI] [PubMed] [Google Scholar]
- 45.Sommer I, Schachner M. Monoclonal antibodies (O1 to O4) to oligodendrocyte cell surfaces: an immunocytological study in the central nervous system. Dev Biol. 1981;83:311–327. doi: 10.1016/0012-1606(81)90477-2. [DOI] [PubMed] [Google Scholar]
- 46.Sporns O, Edelman GM, Crossin KL. The neural cell adhesion molecule (N-CAM) inhibits proliferation in primary cultures of rat astrocytes. Proc Natl Acad Sci USA. 1995;92:542–546. doi: 10.1073/pnas.92.2.542. [DOI] [PMC free article] [PubMed] [Google Scholar]
- 47.Temple S, Raff MC. Clonal analysis of oligodendrocyte development in culture: evidence for a developmental clock that counts cell divisions. Cell. 1986;44:773–779. doi: 10.1016/0092-8674(86)90843-3. [DOI] [PubMed] [Google Scholar]
- 48.Warf BC, Fok-Seang J, Miller RH. Evidence for the ventral origin of oligodendrocyte precursors in the rat spinal cord. J Neurosci. 1991;11:2477–2488. doi: 10.1523/JNEUROSCI.11-08-02477.1991. [DOI] [PMC free article] [PubMed] [Google Scholar]
- 49.Warrington AE, Barbarese E, Pfeiffer SE. Differential myelinogenic capacity of specific stages of the oligodendrocyte upon transplantation into hypomyelinating hosts. J Neurosci Res. 1993;34:1–13. doi: 10.1002/jnr.490340102. [DOI] [PubMed] [Google Scholar]
- 50.Wieser RJ, Renauer D, Schafer A, Heck R, Engel R, Schutz S, Oesch F. Growth control in mammalian cells by cell-cell contacts. Environ Health Perspect. 1990;88:251–253. doi: 10.1289/ehp.9088251. [DOI] [PMC free article] [PubMed] [Google Scholar]
- 51.Windle WF, Fisch MW, O’Donnell JE. Myelogeny of the cat as related to development of the fiber tracts and prenatal behavior patterns. J Comp Neurol. 1934;59:139–165. [Google Scholar]
- 52.Zhang H, Miller RH. Asynchronous differentiation of clonally related spinal cord oligodendrocytes. Mol Cell Neurosci. 1995;6:16–31. doi: 10.1006/mcne.1995.1003. [DOI] [PubMed] [Google Scholar]
