Slow Oscillations during Sleep Coordinate Interregional Communication in Cortical Networks (original) (raw)
Abstract
Large-amplitude sleep slow oscillations group faster neuronal oscillations and are of functional relevance for memory performance. However, relatively little is known about the impact of slow oscillations on functionally coupled networks. Here, we provide a comprehensive view on how human slow oscillatory dynamics influence various measures of brain processing. We demonstrate that slow oscillations coordinate interregional cortical communication, as assessed by phase synchrony in the sleep spindle frequency range and cross-frequency coupling between spindle and beta activity. Furthermore, we show that the organizing role of slow oscillations is restricted to circumscribed topographical areas. These findings add importantly to our basic understanding of the orchestrating role of slow oscillations. In addition, they are of considerable relevance for accounts of sleep-dependent memory reprocessing and consolidation.
Keywords: EEG, functional connectivity, memory, sleep spindles, slow oscillations
Introduction
During slow-wave sleep, rhythmic brain signals alternate between depolarized up states and hyperpolarized down states at a frequency ∼1 Hz. These slow membrane potential fluctuations (Steriade et al., 1993a) exert a grouping influence on faster oscillations (Steriade et al., 1993b). That is, faster rhythms, including sleep spindles (10–16 Hz) and beta/gamma band (>20 Hz) activity, are more prominent in the slow oscillation (SO) up state than in the down state (Mölle et al., 2002; Clemens et al., 2007; Le Van Quyen et al., 2010; Valderrama et al., 2012; Piantoni et al., 2013). Furthermore, SOs may be local in nature (Nir et al., 2011), although it is presently unknown how these spatial dynamics of SOs relate to their grouping capacity.
Intriguingly, SO modulations have been related to prior daytime learning (Huber et al., 2004, 2006; Mölle et al., 2004, 2009, 2011), and SOs are causally involved in the offline reprocessing and stabilization of memories (Marshall et al., 2006; Antonenko et al., 2013; Ngo et al., 2013). Such sleep-related memory stabilization is widely held to involve the reactivation of memory traces in hippocampo-neocortical networks, leading to the formation of hippocampus-independent links between cortically distributed memory representations (Marr, 1971; Frankland and Bontempi, 2005). This hippocampo-cortical dialogue is thought to rely on the temporal coupling (Buzsáki, 1996; Diekelmann and Born, 2010) of SOs, sleep spindles—themselves tightly linked to learning and memory consolidation processes (Gais et al., 2002; Schabus et al., 2004; Cox et al., 2012, 2014a)—and hippocampal ripples, during which previously acquired neuronal patterns are replayed (O'Neill et al., 2010).
Thus, the depolarizing-hyperpolarizing cycle of the SO appears to impact memory processes by organizing activity in higher frequency bands. A crucial, but as yet unexplored, aspect of this orchestration regards the modulation of brain dynamics at the level of distributed networks. That is, neural networks may become functionally and transiently coupled depending on the SO phase. Such functional coupling is indispensable if distributed cortical memory traces are to be linked during sleep.
Network coupling may manifest itself in several ways. For one, consistent oscillatory phase locking between distant brain sites is thought to enable effective communication between the underlying neuronal groups (Fries, 2005; Womelsdorf et al., 2007; Fell and Axmacher, 2011). Second, cross-frequency phase-amplitude coupling organizes brain communication across multiple spatiotemporal scales (Canolty and Knight, 2010). Although learning-related enhancements in signal coherence have been demonstrated during SO up states in various frequency bands (Mölle et al., 2004), no study has comprehensively investigated human brain-wide functional connectivity dynamics across multiple frequency bands along the SO time course. Here, we confirm the grouping effect of SOs on faster oscillations. In addition, we report how phase relations (in the sleep spindle range) and cross-frequency interactions (between spindles and beta activity) across brain regions depend on the phase of the SO. Finally, we demonstrate the local nature of these modulating effects by showing that anterior, central and posterior SOs have distinct topographical grouping profiles.
Materials and Methods
Participants and procedure.
Seven volunteers (5 female, 2 male, mean age ± SD: 19.6 ± 1.4 years) participated in the study. All reported no history of neurological, psychiatric, or sleep disorders, and provided informed consent. They were compensated either financially or with course credits. The local ethics committee of the University of Amsterdam approved this study. Subjects arrived at the sleep laboratory at 2 P.M. After providing information regarding the previous night of sleep, they were prepared for EEG recordings. Starting at 3 P.M., a 2 h sleep opportunity was provided in a dark and quiet environment.
Data acquisition and preprocessing.
EEG was acquired using a 128-channel WaveGuard cap (ANT) with electrode placement according to the 10–5 system (Oostenveld and Praamstra, 2001). Horizontal and vertical electrooculography and chin electromyography were monitored with bipolar derivations. Signals were sampled at 512 Hz using either one 136-channel or two cascaded 72-channel Refa DC amplifiers with a low-pass filter at one-fifth of the sample rate (TMS International). EEG was referenced to Cz, and impedance levels were kept below 10 kΩ. Sleep stages were scored offline using Galaxy software (PHIi) with an epoch size of 30 s in accordance with standard criteria (Rechtschaffen and Kales, 1968).
Custom MATLAB scripts were combined with several freely available toolboxes for all subsequent analyses. Functions from the EEGLAB toolbox (http://sccn.ucsd.edu/eeglab) were used to high-pass (0.1 Hz) and notch filter (50 Hz) the raw EEG data, interpolate channels displaying artifacts during periods of sleep, and rereference the EEG to linked mastoids. Next, current source density (CSD) was estimated with a spherical spline algorithm (Perrin et al., 1989), as implemented in the CSD toolbox (http://psychophysiology.cpmc.columbia.edu/software/csdtoolbox/index.html). Applying CSD minimizes the effects of volume conduction by estimating local radial current flow. We adopted this approach to highlight local aspects of neural processing and to minimize chances of observing spurious functional connectivity due to volume conduction (Srinivasan et al., 2007; van Driel et al., 2012).
Slow oscillation detection.
To obtain complementary perspectives on SO-associated brain dynamics, we identified SOs independently on three arbitrarily chosen midline electrodes (anterior: Fpz; central: Cz; posterior: POz). We opted for midline sites because SOs are known to travel preferentially along this route (Murphy et al., 2009), facilitating the detection of large-amplitude events. Specifically, we used an approach conceptually similar to methods described previously (Massimini et al., 2004). First, the CSD signal of the relevant channel was bandpass filtered between 0.4 and 1.5 Hz (zero-phase shift, third-order IIR filter). A potential SO was detected when (1) the latency between subsequent negative and positive zero-crossings fell between 0.3 and 0.75 s; (2) the negative half-wave (down state) reached a minimum of −2 μV/cm2; (3) the amplitude difference between the trough of the down state and the first following local maximum (up state) exceeded 4 μV/cm2; and (4) the detected event occurred during Stage 3 or Stage 4 sleep. Because our approach of using spatially filtered signals for SO detection has, to the best of our knowledge, not been adopted before, we settled on our CSD amplitude criteria after trying a variety of settings until detected events looked optimal (i.e., similar to EEG-based SO waves). However, to ensure that CSD-based SOs were not artifactual, additionally, the raw EEG amplitude difference between the time points corresponding to the CSD-based SO trough and peak was required to exceed 175 μV. This threshold is higher than what has been used previously in the literature (e.g., 140 μV for Massimini et al., 2004) because we wished to capitalize on the largest SOs to maximize chances of finding differential SO phase effects. Importantly, CSD-based and raw EEG waveforms looked very similar. Remaining SO peaks and troughs were marked, and 3 s epochs were extracted around each peak and around each trough (1.5 s on either side). Thus, in all reported time–frequency analyses, brain dynamics are time-locked to SO peaks or troughs, indicated by time 0. With this procedure, most data segments were used twice, once centered around the SO peak, and once centered around the trough. Finally, noisy epochs were removed based on visual inspection.
Rationale for analyses.
In essence, our approach resulted in three datasets (one for each location of SO detection), for which multichannel time series were analyzed in two conditions: up state-centered and down state-centered. For all measures of interest (power, phase synchrony, and cross-frequency coupling, described hereafter), we provide two sets of analyses offering complementary views on our data. In one approach, we directly contrasted up- and down-centered epochs. This contrast approach maximized opportunities to discover differences in grouping capacity of opposite SO phases. For these analyses, we limited statistical evaluation to an interval from −250 to 250 ms around SO peaks and troughs, corresponding to the time period that the average peak-centered waveform is more positive than the average trough-centered waveform. That is, we used a window that clearly differentiated between up- and down-centered waveforms. Although likely beneficial for revealing subtle differences between up and down states, this strategy inherently relies on the concurrent dynamics of two sets of waveforms (up- and down-centered). Thus, modulations as a function of the entire SO cycle cannot be assessed. Furthermore, for phase synchrony and cross-frequency coupling, up/down contrast analyses do not reveal whether there is reliable, non-zero functional connectivity to begin with.
Therefore, in a complementing set of analyses, we compared brain dynamics during SOs to baseline activity, which for the three measures essentially consisted of average power in the entire epoch, random phase synchrony, and random cross-frequency coupling (for details, see the sections on the respective measures). For power and synchrony, we analyzed full-cycle SO epochs centered on down states in an interval from −750 to 750 ms. We chose down-centered epochs, rather than up state-centered ones, because down states appear to be more precisely synchronized than up states (Volgushev et al., 2006). The longer, “single-waveform” interval in these analyses offers a more continuous perspective on the modulating role of SOs. We note, however, that the increasing variability of waveforms further from the time-locking event is a limiting factor when interpreting effects. Also, down states are more consistently followed by up states than the other way around. Hence, data in the up state before the time-locking down state trough are likely to be more variable than in the up state following the down state. As a result, some data asymmetry with respect to the time-locking event may be expected.
For measures of cross-frequency coupling, we also compared coupling strength with baseline values. However, because we collapsed this measure over all time points, thereby removing the time dimension (see Cross-frequency coupling), coupling strength could not be evaluated as a function of the SO time course. Therefore, rather than using wide 1500 ms intervals as we did when comparing down-centered power and phase connectivity to baseline activity, we analyzed coupling within 500 ms intervals centered around either down or up states (same interval as for up/down contrast analyses) and compared these values with baseline. In this manner, we could assess whether nonrandom frequency interactions were apparent separately for up and down states.
Power.
Time–frequency decomposition of all channels was done separately for epochs centered around anteriorly, centrally, and posteriorly defined up and down states. A family of complex Morlet wavelets was used to decompose all multichannel epoched time series into time–frequency representations, according to e i_2π_tf e_−_t_2/(2σ2), where i is the imaginary operator, t is time, f is frequency (27 logarithmically spaced frequencies between 10 and 100 Hz), and σ is the width of each wavelet. We defined width σ as λ/(2π_f), where λ is the number of wavelet cycles, increasing from 3 to 12 in 27 logarithmically spaced steps corresponding to the number of frequency bins. These settings resulted in a temporal precision (2σ) of 96 ms at 10 Hz and 38 ms at 100 Hz, and a spectral precision [1/(πσ)] of 6.6 Hz at 10 Hz and 16.7 Hz at 100 Hz. The resulting time–frequency representations were downsampled to 100 Hz to reduce the amount of data. Power was defined as the squared complex magnitude of the convolution result, whereas phase was defined as the angle of the convolution result, bound between −π and π. Power estimates were decibel normalized according to dB power = 10 × log10(power/baseline), where, for each channel, epoch, and frequency, the baseline was the average from −1000 to 1000 ms over either all up-centered or all down-centered epochs. We used this interval, rather than the entire 3 s window, to stay clear of edge artifacts stemming from the convolution. Normalization ensures that power values can be compared across channels, frequencies, and subjects. As noted above, we performed both analyses directly contrasting up-centered to down-centered epochs, and analyses comparing down-centered epochs to baseline (0 dB).
Given the robust organization of faster oscillatory power by the SO phase (see Results), we assessed whether larger SOs, reflecting greater degrees of depolarization and hyperpolarization, were associated with stronger modulations of high-frequency activity. To this end, we performed single-epoch correlations in which we correlated the (time-domain) maximum amplitudes of individual up states with 10–100 Hz power values on the same epoch, in a 500 ms window around the up state peak. Similar single-trial correlations were performed between minimum down state amplitudes and power, only here the lower frequency boundary was lowered to 5 Hz to investigate specific findings regarding down state-related enhancements of low-frequency power (see Results). In detail, we estimated, per subject, the regression coefficient between up (or down) state amplitudes and log-normalized power in every time–frequency-channel bin using the MATLAB robustfit function. Resulting regression coefficients were subsequently standardized by dividing them by their SEs (Cohen and Cavanagh, 2011). Under the null-assumption that there is no relation between SO amplitude and power, these coefficients would be expected to be zero. Therefore, we tested the regression weights against zero, across all time–frequency-channel points.
Phase synchrony.
For each of the three seed electrodes, phase synchrony was determined between that seed electrode and all other electrode sites, for every time point along the SO time course, for every frequency bin, and for both up- and down-centered epochs. For example, for frontally defined up or down-centered epochs, phase differences were calculated between Fpz and every other electrode. To estimate phase synchrony, we used the phase lag index (PLI) (Stam et al., 2007), a measure that is relatively unaffected by common sources. Thus, with PLI it is unlikely that observed phase coupling is due to volume conduction (Srinivasan et al., 2007). PLI is calculated by summing the signs (positive/negative) of phase differences over epochs, taking the absolute value, and dividing by the number of epochs, thereby effectively partialling out zero phase lag due to common neural activity. PLI is bound between 0 and 1, where 0 indicates no phase relation across epochs and 1 indicates perfect phase consistency.
For comparing up and down states directly, we used raw PLI values. Additionally, to assess whether there was significantly nonrandom phase synchrony to begin with, we analyzed epochs centered on down states only and compared them with random phase synchrony. To this end, we created a null distribution of PLI values by assigning random phases to all time–frequency-channel points before calculating PLI with the seed electrode, and repeated this process 200 times. We used the resulting distribution of values to _Z_-transform the observed PLI values. Thus, for PLI analyses comparing down state-centered connectivity with baseline, values indicate the number of SDs the observed PLI is removed from the average PLI in the absence of phase coupling.
Cross-frequency coupling.
Cross-frequency phase-amplitude coupling between spindles and higher frequency activity was determined by calculating a modulation index (MI) similar to measures described previously (Canolty et al., 2006; Tort et al., 2010). An important assumption when calculating this index is that phases of the modulating frequency should be uniformly distributed; violations of this assumption severely distort the coupling estimate (Cohen, 2014). We noted in our data, however, that spindle phases were often not uniformly distributed. Therefore, we developed a novel, debiased MI estimate, which does not rely on distribution assumptions. Conventionally, MI is computed with the following: MI=|1n∑t=1n(fpow(t)*eifphase(t))|, where fpow(t) is the power estimate for a given (modulated) frequency bin at time t and fphase(t) is the phase estimate for a given (modulating) frequency bin at time t. To calculate the debiased MI, we subtracted the average phase vector from every (unit length) phase estimate before multiplying with power. That is, we computed phase-amplitude coupling as follows: MI=|1n∑t=1n(fpow(t)*(eifphase(t)−B))|, where B is the mean phase bias 1n∑t=1neifphase(t). Thus, by subtracting the average phase vector from every phase estimate before multiplying with power, we reduced the influence of nonuniform phase distributions on the length of the mean modulation vector. The two approaches of computing MI were compared by applying them to several simulated datasets with known phase distributions and phase-amplitude coupling characteristics. This demonstrated, in each case, the superior performance of the debiased MI measure (unpublished observations).
Using the adapted index, MI was determined between modulating phase-frequencies fphase (10–16 Hz) and modulated power-frequencies fpow (20–100 Hz) for all channels, for every seed, and for up- and down-centered epochs separately. We constructed novel time series fpow(t) and fphase(t) from all n [number of epochs × time points] in a 500 ms window around time 0, essentially removing the time dimension. This approach was necessary to reduce the number of dimensions in our data from 4 (time-channel-modulating frequency-modulated frequency) to 3 for statistical evaluation. For same-site modulation, power and phase estimates were derived from the same electrode; for intersite modulation, phase estimates were always from the seed electrode. The resulting measure is still dependent on absolute power, and differences in phase-amplitude coupling between up and down states may be confounded by power differences. Therefore, for up- and down-centered epochs separately and per frequency-frequency-channel bin, the power time series was shuffled with respect to the phase time series 200 times to obtain a null distribution of MI values. This distribution was used to _Z_-transform the MI, yielding an MI measure that is independent on power differences between up and down states. Thus, reported MI values indicate how far, in terms of SDs, the observed coupling estimate is removed from the average coupling estimate under the null hypothesis of no coupling. In separate sets of analyses, these values were either compared with zero or compared directly between up and down states.
Statistics.
Permutation-based statistical analyses on 3D (time–frequency-channel or frequency–frequency-channel) data were performed with Fieldtrip (http://fieldtrip.fcdonders.nl/) using cluster correction (Maris and Oostenveld, 2007). For power and synchrony, we set the clusteralpha parameter to 0.01; for cross-frequency coupling, we set it to 0.05. This parameter determines the proportion of data that is used for cluster formation on each permutation: by setting a higher value for cross-frequency coupling, we accounted for the smaller number of data points for cross-frequency coupling estimates. We used 1000 iterations for all tests. Using an α of 0.05, clusters were considered significant at p < 0.025 for two-sided testing (all up/down contrasts and down-centered power vs baseline), and at p < 0.05 for one-sided testing (power regression, phase synchrony and cross-frequency coupling compared with baseline).
Results
We recorded 128-channel EEG from seven young adult volunteers while they took an afternoon nap. Standard sleep scoring confirmed that all had entered SO-rich slow-wave sleep (Table 1). After applying a spatial filter to reduce the influence of common neural sources on nearby electrodes (see Materials and Methods), we identified SO peaks and troughs on three distinct midline sites along the anterior–posterior axis of the scalp (hereafter referred to as seed electrodes; Fig. 1A). Next, we time-locked the multichannel EEG time series to identified SO peaks and troughs, allowing us to evaluate power and phase-based measures as a function of SO phase (Fig. 1B). Descriptive statistics for all detected events are provided in Table 2.
Table 1.
Sleep architecture parameters
| Mean ± SD | Range | n | |
|---|---|---|---|
| Total sleep (min) | 100.1 ± 14.1 | 80–117.5 | 7 |
| Sleep efficiency (%) | 82.8 ± 11.5 | 66.7–96.7 | 7 |
| Sleep latency (min) | 6.4 ± 4.1 | 1.5–11.5 | 7 |
| Stage 1 (min) | 24.1 ± 7.4 | 16.5–37 | 7 |
| Stage 2 (min) | 32.0 ± 10.0 | 20–45.5 | 7 |
| Stage 3 (min) | 3.6 ± 1.8 | 1.5–7 | 7 |
| Stage 4 (min) | 36.9 ± 14.8 | 18.5–58.5 | 7 |
| REM (min) | 8.2 ± 9.8 | 2.5–19.5 | 3 |
Figure 1.
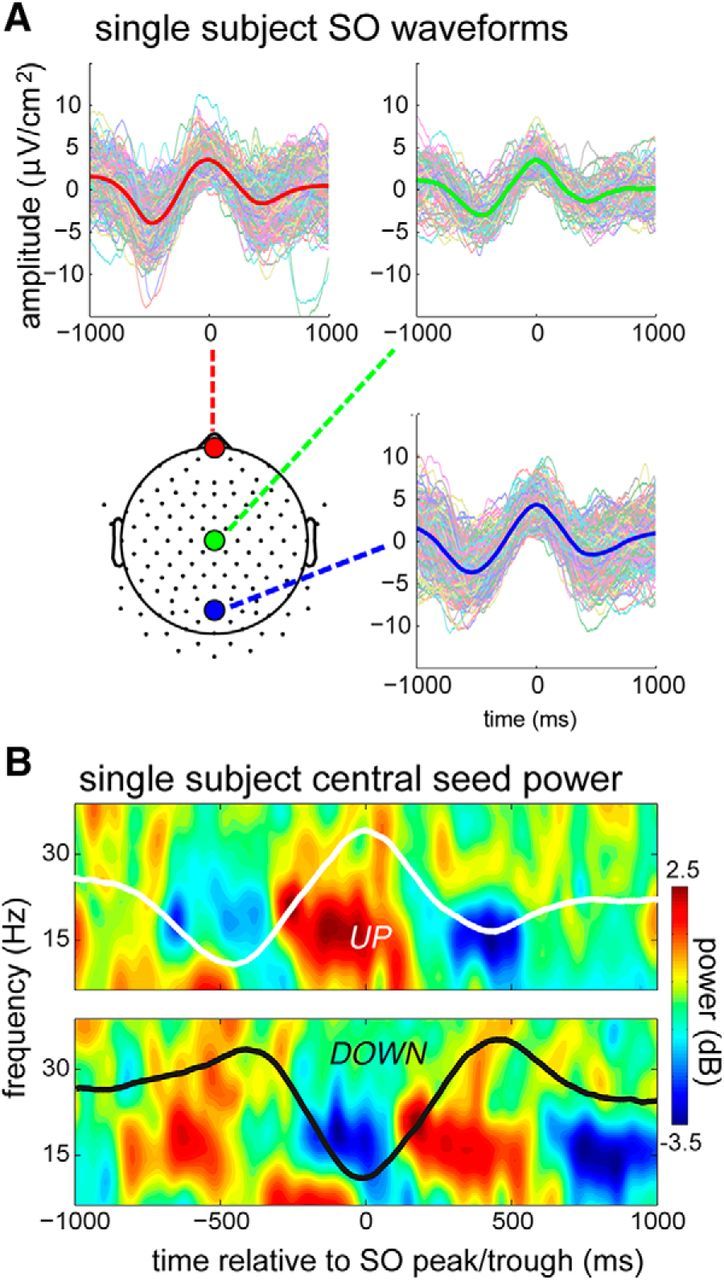
Single subject SOs. A, Individual and average peak-locked SOs for the anterior (red), central (green), and posterior (blue) detection electrodes. These seed electrodes are indicated on the scalp map. B, Central seed average peak-centered (top) and trough-centered (bottom) waveforms overlaid over time–frequency power plots. Note the clear increase of ∼15 Hz power in the up state (and decrease in the down state), corresponding to sleep spindle activity.
Table 2.
Mean, SD, and range of number of detected up and down states for all seed electrodes
| Seed | Up states | Down states | ||||
|---|---|---|---|---|---|---|
| Mean | SD | Range | Mean | SD | Range | |
| Anterior | 255 | 188 | 26–571 | 254 | 188 | 26–564 |
| Central | 103 | 117 | 15–357 | 105 | 118 | 16–362 |
| Posterior | 133 | 100 | 21–299 | 134 | 101 | 21–302 |
Power
In a first analysis, we asked how brain-wide power in the frequency range from 10 to 100 Hz was influenced by the SO waveform. Contrasting time–frequency representations of SO up and down states revealed, for each seed electrode, massive significant positive clusters spanning a large part of the time–frequency-channel domain (anterior: 13–45 Hz, −250 to 200 ms; central: 10–38 Hz, −250 to 210 ms; posterior: 10–49 Hz, −250 to 250 ms; all p < 0.001; Fig. 2A). These findings indicate that SOs modulate power in higher frequencies pervasively, with more high-frequency power in the up state than in the down state. However, examining these clusters more closely, distinct effects appeared to be present in the spindle and gamma frequency bands (Fig. 2A). To evaluate the spatiotemporal dynamics of modulations in these separate frequency bands in more detail, additional analyses were performed directed at the visually observed frequency ranges of 13–19 Hz (spindles) and 25–35 Hz (gamma), averaged over frequency bins in both bands. Results of the single-band analyses indicate that, in terms of timing, power in the spindle range became more pronounced and widespread in the lead up to the up state, before lessening in size and extent again (anterior: −200 to 160 ms, p = 0.008; central: −250 to 160 ms, p < 0.001; posterior: −250 to 190 ms. p < 0.001). For gamma, the picture was similar, but the modulations were more strongly confined to the positive-going part of the SO (anterior: −180 to −50 ms, p < 0.001; central: −200 to −90 ms, p < 0.001; posterior, two time windows: −250 to −190 ms, p = 0.025, and −70 to −10 ms, p = 0.017). In the analyses using the full frequency range, these separate dynamics are far less apparent, as distinct modulations in different frequency bands are merged into one massive cluster, through comparatively minor bridges between subclusters in the spindle and gamma ranges. Given the exploratory nature of our approach, these single-band analyses could not be performed without reference to the results obtained from the primary ones (i.e., across all frequency bins). Yet, we believe this two-step approach was critical for obtaining a more detailed understanding of how the SO affects separate frequency bands.
Figure 2.
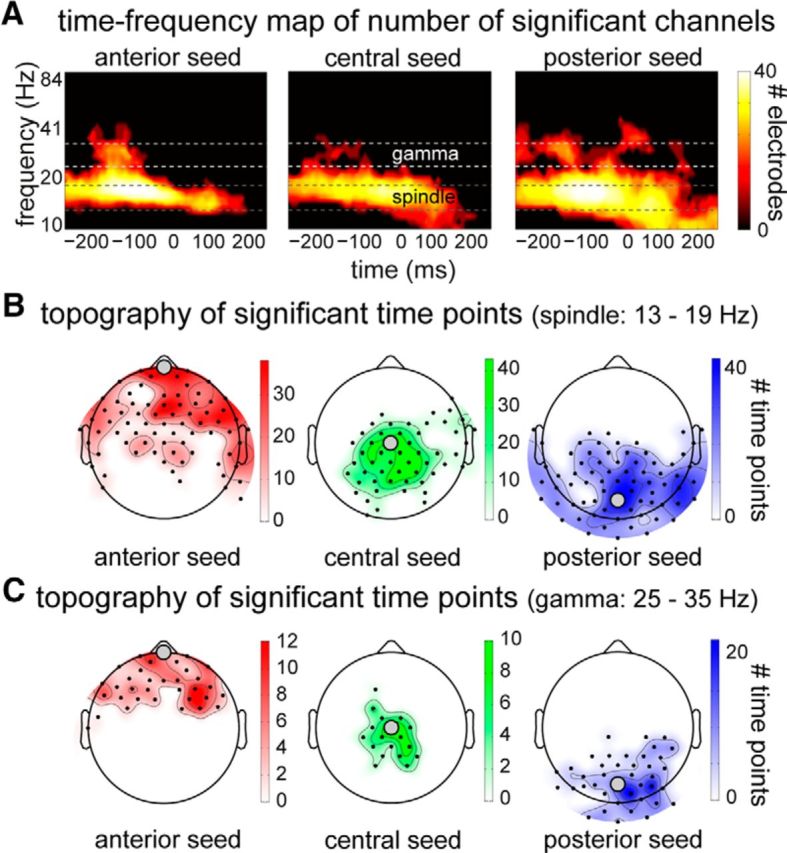
Spatiotemporal extent of SO-phase effect on power. A, Heat maps of clusters with significantly higher power in the up versus down state for the anterior (left column), central (middle column), and posterior seed electrodes (right column). Indicated is the number of channels involved at every time–frequency point. Note the apparent presence of two distinct frequency ranges in these clusters, indicated between dashed lines and labeled “spindle” and “gamma.” B, C, Topographies of these frequency-specific effects (B, spindles; C, gamma) reveal that power modulations are highly localized. Channels closer to the seed electrode used for SO detection are involved in the significant cluster on more time points.
Topographically, all effects (both full-frequency and single-band) surrounded the seed electrode used for analysis. That is, SO-modulated power effects were found to be strongest and most reliable around the scalp site where SOs were detected, for both spindles and gamma activity, although the spatial topography was more tightly clustered for gamma (Fig. 2B,C). For illustration purposes, we show the spatiotemporal power dynamics for two selected seed electrode/frequency band combinations: the spindle effect for SOs detected on the central seed electrode (Fig. 3A) and the gamma band effect for the posterior seed (Fig. 3B). The power modulations in the spindle range (Figs. 2A and 3A) appear most consistent with >13 Hz fast spindles time-locked to up states, as reported previously (Mölle et al., 2011).
Figure 3.
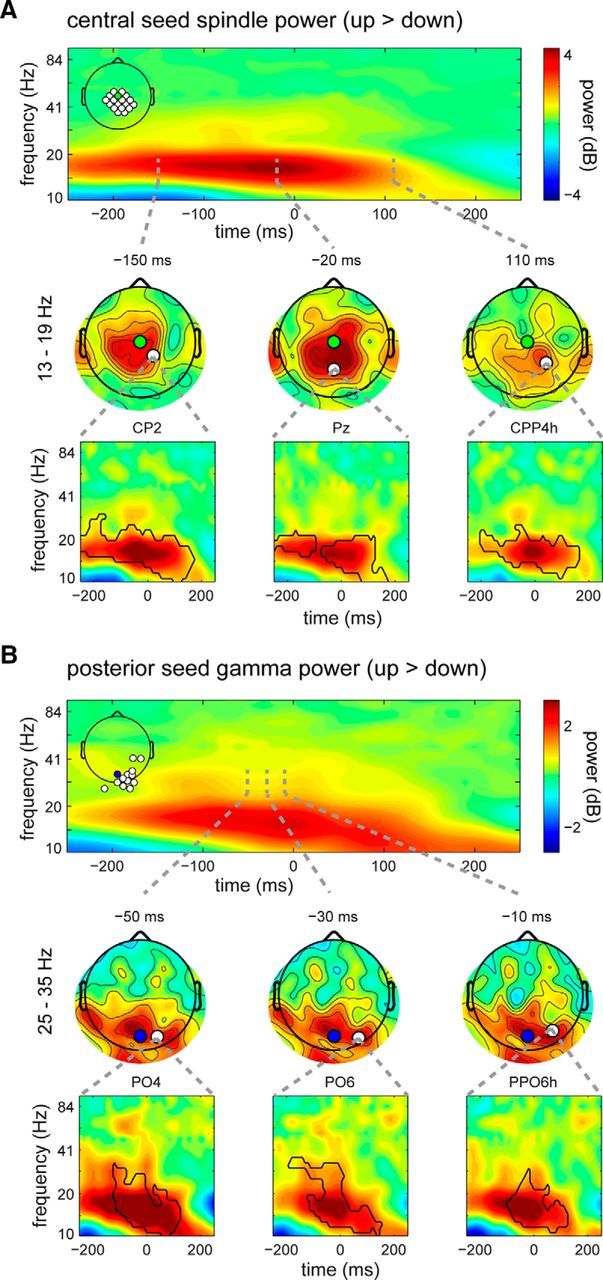
Topographically restricted SO-phase effects on power in the spindle and gamma ranges. A, Effects in the sleep spindle (13–19 Hz) range for the central seed. Top, Time–frequency plot showing power difference (up > down) averaged across a subset of channels significant in the spindle range. Clearly visible is the enhanced spindle power in the up state, which is most pronounced around time 0 when up and down states differ maximally. Inset, The electrodes used for averaging (top tertile involved electrodes in cluster). Middle, Scalp topographies at three randomly selected time points showing the spatial extent of the spindle power effect. Most affected is the region surrounding the seed electrode (in green). Also note how the topographical extent of the power modulation evolves as a function of time. Bottom, Time–frequency plots for three randomly selected example electrodes indicated on the scalp maps (in white). Black outlines indicate the extent of significance for these individual channels. B, Similar as A, but now for gamma (25–35 Hz) power effects using the posterior seed for SO detection. Again, the spatial topography is restricted to the area surrounding the seed electrode (blue).
In a parallel set of analyses, rather than contrasting up and down states directly, we focused on a wider (1500 ms) time window centered around down states to evaluate full-cycle SO dynamics. Within this interval, we assessed time–frequency-channel power estimates with respect to baseline (i.e., average power in a 2 s window around the troughs). Figure 4 shows power modulations for an example channel with respect to frontally defined down states. In general, results of these analyses were highly consistent with the abovementioned up/down contrast effects. For every seed electrode, there were robust topographically organized decreases in power in the down state spanning the spindle, beta, and gamma bands (anterior: 10–49 Hz, −290 to 190 ms, p = 0.011; central: 10–27 Hz, −240 to 200 ms, p < 0.001; posterior: 10–49 Hz, −240 to 440 ms, p < 0.001); these modulations encompassed large parts of the scalp surrounding the seed electrode, comparable with the up/down contrast effects. Thus, the hyperpolarizing SO phase appears to suppress broadband activity. In contrast, the preceding and succeeding up states were accompanied by spatially restricted power enhancements in the spindle-beta range (anterior: 11–24 Hz, 310–690 ms, p = 0.013; central: 10–16 Hz, −350 to −80 ms, p = 0.017; 10–24 Hz, 200–580 ms, p < 0.001; posterior: 11–32 Hz, −750 to −390 ms, p = 0.024; 10–14 Hz, −340 to −90 ms, p = 0.024, 12–27 Hz, 170–520 ms, p = 0.017). Notably, these up state power increases did not reach as high into the gamma band as did the down state suppression, suggesting an asymmetry between up and down state modulations. This finding is in line with intracellular evidence that down states are more precisely synchronized than up states (Volgushev et al., 2006), resulting, perhaps, in increased statistical power to detect differences surrounding the less variable down states.
Figure 4.

Full-cycle SO phase-dependent power modulations. Using the anterior seed electrode, broadband suppression of activity is apparent in the down state for a representative frontal channel, followed by enhanced spindle power in the succeeding up state. Also present is a cluster of enhanced 10–12 Hz power in the down state, possibly reflecting slow spindle activity. The extent of significance is outlined: black represents power increases; white represents power decreases.
In sum, these findings reveal that the grouping effect of SOs on sleep spindle and gamma activity is consistent with their local nature.
Of note, when contrasting up and down states, we also noticed significant clusters of enhanced power around the down state (central: 10–11 Hz, −250 to −10 ms, p = 0.009; posterior: 10–13 Hz, −250 to −80 ms, p = 0.01). Similarly, for the down state-centered full-cycle analysis based on the anterior seed, we witnessed a borderline significant increase in 10–12 Hz power commencing right before the down state (−250 to 60 ms, p = 0.027; Fig. 4). These observations are consistent with findings that, in contrast to fast spindles, <13 Hz slow spindles are tied to the hyperpolarizing down state (Mölle et al., 2011).
Given that the SO phase distinctly modulates spindle and gamma activity, it might be expected that larger SOs, reflecting higher degrees of depolarization or hyperpolarization, have greater impact on the enhancement and suppression of faster oscillations. To assess whether SO amplitudes are predictive of high-frequency power, we performed single-trial correlations between SO peak (or trough) amplitudes on the one hand, and power in every frequency bin in a 500 ms window around the peak (or trough) on the other hand. For up states, results indicated that the SO peak amplitude was not significantly related, on a trial-by-trial basis, with power in any frequency range. This was the case for all seed electrodes. Thus, the precise level of up state depolarization does not appear to influence faster activity reliably.
The corresponding single-trial correlations between down state amplitudes and power were done with frequency bins from 5 Hz up because visual inspection of time–frequency power plots suggested that the existence of low-frequency power clusters in the down state (e.g., 10–12 Hz in Fig. 4) may have been related to the low-frequency content of the down state waveform itself. Results indicated that, similar to the up state correlations, down state amplitudes were not robustly associated with power in any frequency band >14 Hz. That is, the extent of down state hyperpolarization is generally not associated with the extent of oscillatory suppression.
In contrast, we observed robust single-trial correlations between the down state minimum amplitude and low-frequency power in the theta and slow spindle range, such that more negative and presumably sharper down states were associated, on a trial-by-trial basis, with greater low-frequency power. These correlational effects were apparent for all seeds (anterior: 5–14 Hz, −250 to 250 ms, p < 0.001; central: 5–11 Hz, −250 to −150 ms, p < 0.001; posterior: 5–12 Hz, −250 to 250 ms, p < 0.001) and were tightly wrapped around the seed electrode in terms of topography. Thus, the spectral and spatial extent of these correlations suggests the possibility that our findings of enhanced slow spindle-like power in the down state are mainly due to down states being composed of relatively strong low-frequency content. On the other hand, spectral precision of our wavelet approach may not have been sufficient to adequately distinguish slow spindle activity from lower SO-related frequencies (compare with Mölle et al., 2011, their Fig. 3), preventing us from drawing strong conclusions as to the nature of the observed 10–13 Hz power differences between up and down states (see Discussion).
Phase synchrony
Next, we investigated whether phase coupling between electrodes, in the frequency range from 10 to 100 Hz, was influenced by SOs. For each seed electrode, we assessed the phase lag index (PLI: a measure minimally sensitive to common neural sources) (Stam et al., 2007) between the seed electrode and all other electrodes.
In a first step, we assessed whether there was significantly nonrandom phase coupling in any frequency band along the full SO waveform. To this end, we limited our analyses to down state-centered epochs (similar to the full-cycle evaluation of power), and compared _Z_-transformed PLI values, obtained through permutation testing, to zero. Using this method, we observed significant phase relations between the seed electrode and surrounding electrodes in the sleep spindle range for all seeds. Phase synchrony was particularly strong and widespread for the anterior seed, showing reliable 10–20 Hz phase synchrony throughout most of the SO cycle, with only a brief interruption just before the down state trough (−750 to −20 ms, p = 0.009; 0–750 ms, p < 0.001). As apparent from Figure 5A, spindle connectivity was most pronounced between the seed electrode and the anterior half of the scalp but extended to posterior regions. For the other seeds, phase synchrony was more modest in its spatial and temporal extent: for the central seed (Fig. 5B), two significant clusters were found in the up state succeeding the down state (13–17 Hz, 300–400 ms, p = 0.035; 12–17 Hz, 580–640 ms, p = 0.025), whereas for the posterior seed (Fig. 5C) significant coupling was apparent during the preceding up state (10–13 Hz, −290 to −240 ms, p = 0.037) and, at a slightly more lenient threshold, in the succeeding up state as well (13–17 Hz, 600–660 ms, p = 0.052).
Figure 5.

Phase synchrony in the sleep spindle range. Heat maps showing _Z_-transformed PLI estimates for single, representative channels, indicating functional connectivity with the anterior (A), central (B), and posterior (C) seed electrode. Extent of significance is outlined. Scalp plots represent spatial topography of channels significantly coupled with seed electrode. Small filled circles and larger open circles represent channels belonging to distinct clusters, with some channels partaking in both clusters. Large colored circles represent seed electrodes. Small colored circles represent the example channel locations used for the heat maps.
Next, we investigated whether spindle synchrony was indeed higher in the up compared with the down state, as suggested by the previous analyses. To this purpose, we directly compared phase coupling between up- and down-centered epochs across all frequencies, time points, and electrodes, using the raw PLI values. For frontal SOs, we indeed observed substantially greater phase coupling in the spindle band toward and into the up state peak, compared with the down state (11–20 Hz, −100 to 60 ms, p < 0.001). Similar to the spatiotemporal dynamics we observed for power, this interregional synchronization effect was confined to a cluster of electrodes surrounding the frontal seed electrode, waxing along the rising slope of the up state, and waning again following the most depolarized part of the SO (Fig. 6). We also note that, similar to effects on spindle power, spindle synchrony appeared to be most strongly modulated in the >13 Hz range of fast spindles. For the central and posterior seeds, we did not observe significantly modulated phase coupling when contrasting up and down states in any frequency band.
Figure 6.

Topographically restricted SO-phase effect on synchrony in the sleep spindle range for the anterior seed. An increase in phase coupling with the anterior seed electrode (red) was maximal and spatially most extensive just before the up state. Panels follow the same logic as in Figure 3.
In sum, we established the presence of interregional communication in the spindle range during deep sleep. Although present across the cortex, these communication lines appear most pronounced in frontal areas, where they are also reliably modulated by the SO phase.
Cross-frequency coupling
Having established significant effects of SOs on spindle synchrony, as well as on power in both the spindle and gamma bands, we explored the possibility that phase-amplitude relations between distinct frequency bands were themselves dependent on the SO phase. More specifically, we asked whether the preferential nesting of faster activity in a specific spindle phase is itself affected by the SO phase. To answer this question, we computed a modulation index indicating the association between phases in the 10–16 Hz range and power in the 20–100 Hz band (adapted from Canolty et al., 2006; Tort et al., 2010). Although this index may be computed for every time point, channel, modulating frequency, and modulated frequency, statistical procedures allowed the usage of only three dimensions. Hence, cross-frequency modulation was calculated across all time points and epochs in a 500 ms window around time 0, for all seeds and up- and down-centered epochs separately, essentially removing the time dimension.
First, we assessed local phase-amplitude coupling per electrode (i.e., “same-site modulation”). To establish whether the sleeping brain exhibits such coupling at all, _Z_-transformed MI values were compared with zero. We observed highly significant coupling across all channels, spanning all spindle frequencies and all modulated frequencies in the 20–100 Hz range. This does not suggest reliably greater than zero coupling for every frequency–frequency-channel bin. Rather, these findings indicate that nonrandom coupling was present on sufficiently many neighboring frequency–frequency-channel bins so as to form one big cluster encompassing all electrodes and modulating and modulated frequencies. These effects were very similar for up-centered and down-centered epochs and, furthermore, did not seem to depend on the site used for SO detection (all p < 0.001). Figure 7A shows the number of channels displaying reliable same-site phase-amplitude coupling for every frequency–frequency bin, for up state-centered epochs based on the central seed. Also indicated is the extent of significance for a representative channel. Thus, nonrandom phase-amplitude relations appear to be ubiquitous during sleep.
Figure 7.
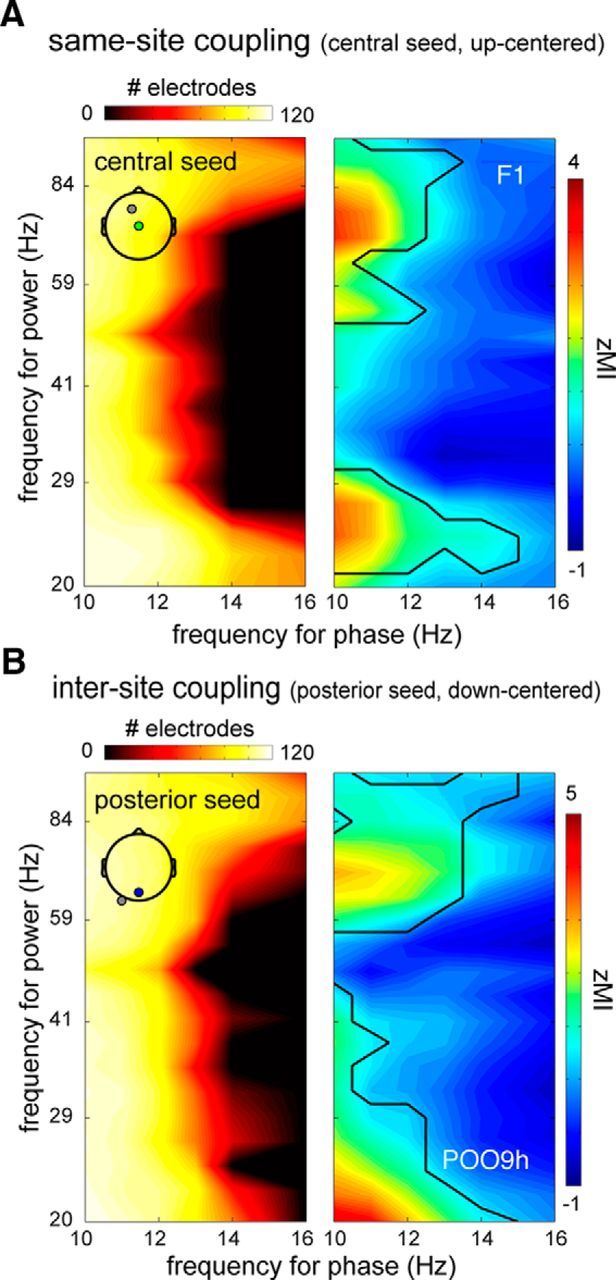
Significant phase-amplitude coupling with respect to baseline. A, Same-site coupling using up-centered epochs based on the central seed electrode. Left, Heat map indicating number of channels showing reliable same-site coupling at every frequency–frequency bin. Beta and high gamma activity is prominently modulated by spindle phases in the 10–16 Hz range on numerous channels, whereas power in the 30–80 Hz range was affected only by the phase of lower-frequency spindles. Right, Strength of coupling (_Z_-transformed MI) for example channel indicated in left panel. Black lines indicate extent of significance. B, Similar to A, only for intersite coupling, using down-centered epochs based on the posterior seed.
Next, we compared this MI measure between up and down states for each seed electrode. For the anterior seed, this revealed a significant increase of coupling between spindle phase (11–16 Hz) and beta power (20–24 Hz) in a frontal region during the up state relative to the down state (Fig. 8A; p < 0.001). As observed for power and synchrony, spindle-beta coupling was modulated by the SO phase most prominently around the site of SO detection. Analyses centered on the central and posterior seeds, however, did not reveal differential same-site cross-frequency coupling between up and down states.
Figure 8.
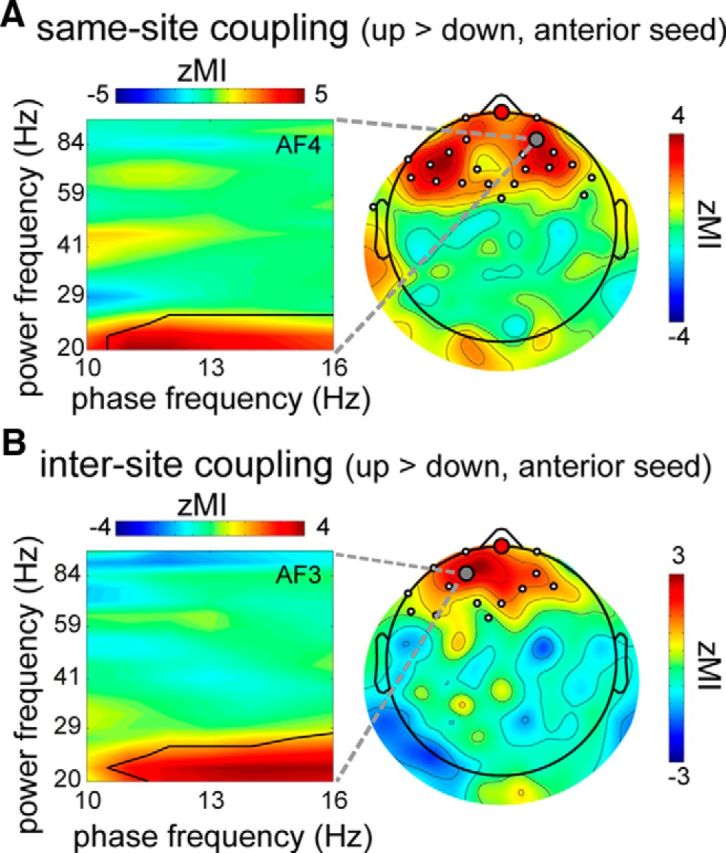
SO phase-dependent cross-frequency coupling using anterior seed. A, Left, Same-site coupling difference (_Z_-transformed MI) between up- and down-centered epochs for example channel (gray circle in scalp plot). Black line indicates extent of (beta band) significance. Right, Topography showing enhanced frontal coupling in up state relative to down state, averaged over 11–16 Hz modulating range and 20–24 Hz modulated range. B, Similar to A, only for up-down difference in intersite coupling with anterior seed. Scalp plot averaged over 11–16 Hz modulating range and 20–27 Hz modulated range.
We also assessed whether SOs modulate cross-frequency coupling between electrodes (i.e., “intersite modulation”). To this end, we calculated a modulation index similar to the same-site modulation index, only now between the spindle phase at the seed electrode and higher frequency power at all other electrodes. Again, we first assessed whether there was reliable cross-frequency coupling to begin with, by comparing _Z_-transformed MI values with zero. Very similar to the same-site modulation results, we observed significant intersite coupling in a large cluster spanning all channels and all modulating and modulated frequencies. Figure 7B visualizes this result for the analysis of down state-centered epochs based on the posterior seed. These effects were present regardless of the seed electrode used or whether data points stemmed from up or down states (all p < 0.001). That is, nonrandom interregional phase-amplitude coupling appears to be pervasive during sleep.
Finally, we contrasted intersite MI values from up- and down-centered epochs. We observed reliably enhanced interregional coupling between spindle phases (11–16 Hz) on the anterior seed electrode and beta power (20–27 Hz) in surrounding frontal areas in the up relative to the down state (Fig. 8B; p = 0.006). Thus, anterior SOs importantly influence the extent of effective cross-frequency communication between brain areas. Reliable differences in intersite coupling between up and down states were not apparent for the other seeds.
The combined cross-frequency coupling findings indicate the following: (1) the widespread nature of local and interregional phase-amplitude coupling between spindles and broadband >20 Hz activity, regardless of SO phase or detection site; and (2) same-site and intersite spindle-beta coupling were distinctly greater during frontally defined up states relative to down states, with topographies consistent with the location of the anterior seed electrode.
Discussion
The current study addresses the occurrence of functionally coupled network activity during deep sleep and its modulation by slow oscillatory dynamics. We found functional network coupling, both within and across frequency bands, is ubiquitous during sleep. We demonstrate that SOs profoundly modulate this network activity. Moreover, the spatial extent of this modulation depends on the site of SO detection, emphasizing the local organizing role of SOs. In particular, we observed that the SO phase topographically orchestrates (1) spindle and gamma power, (2) spindle phase synchrony, and (3) local and interregional phase-amplitude coupling between spindles and beta activity.
Considering our findings in more detail, distinctly enhanced power in the spindle and gamma frequencies was observed during the SO upswing, replicating earlier studies (Mölle et al., 2002; Valderrama et al., 2012). Importantly, we extend those findings, demonstrating that the spatial distributions of these modulations surround the site of SO detection, suggesting regional effects of SOs on network functioning. Spindle spiking patterns induce synaptic plasticity in slice preparations (Rosanova and Ulrich, 2005) and may thus facilitate plasticity during sleep. This notion is supported, albeit indirectly, by a substantial literature linking spindles to learning, consolidation, and memory reactivation (Gais et al., 2002; Schabus et al., 2004; Cox et al., 2012, 2014a). Furthermore, gamma activity is indicative of local cortical information processing and is optimally suited for spike-timing dependent plasticity (Jutras and Buffalo, 2010). Thus, the local modulation of both spindle and gamma dynamics by SOs suggests they organize information processing and plasticity in cortical networks.
In this light, the novel finding of enhanced up state phase synchrony in the spindle band is highly interesting. Consistent phase relations between areas affect the relative timing of neuronal spikes between the brain regions involved, thereby enabling communication and plasticity (Fries, 2005; Fell and Axmacher, 2011). Indeed, the spindle phase modulates both spike activity (Andrillon et al., 2011) and faster rhythms related to ensemble activity, including neocortical gamma (>30 Hz) (Ayoub et al., 2012), hippocampal ripples (Clemens et al., 2007), and broadband 20–100 Hz activity (this study). Thus, modulated phase synchrony in the spindle range adds an important means by which SOs may influence neocortical information transfer and plasticity.
The existence of two types of spindles, fast and slow, with different spatial topographies has been demonstrated repeatedly (Zeitlhofer et al., 1997; Andrillon et al., 2011). Interestingly, slow and fast spindles express distinct temporal relations with SOs (Mölle et al., 2011). Our own findings fit with this notion, in that we observed <13 Hz power enhancements in down states, whereas power increases in up states were strongest in a decidedly higher (>13 Hz) frequency range. Moreover, SO-related modulations of frontal spindle synchrony were also centered on the fast spindle range. These observations agree with accumulating evidence that fast spindles, in particular, are relevant for memory function (Saletin et al., 2011; Cox et al., 2014a). We should stress, however, that the level of spectral precision in our data precludes a clear demarcation between slow and fast spindles. Similarly, slow spindles cannot be readily discerned from still lower frequencies, as evident from robust correlations between down state amplitudes and 5–13 Hz power. Definitive evidence regarding the differential SO modulation of fast and slow spindles at the network level could be obtained using algorithms for the detection of individual spindles (Ferrarelli et al., 2007; Cox et al., 2014a).
Consistent with the organizing role of spindle phases on faster oscillations, we observed enhanced cross-frequency coupling between spindles and higher frequencies in the up state, particularly in the beta range. Importantly, we observed both same-site and intersite interactions organized around the area of SO detection. This finding attests to the highly complex organization of network activity during sleep, essentially revealing a triple-layered nesting of brain signals. Recent evidence also suggested such complexity showing that gamma power jointly depends on SO and spindle phases (Valencia et al., 2013). We propose that the multilayered organization of oscillatory frequencies during sleep importantly regulates neural communication within and between areas, similar to the crucial role of multiplexed oscillations in waking cognition (Canolty and Knight, 2010).
Notably, SO phase dependence of intersite spindle-beta coupling is probably a direct consequence of the SO phase effects on spindle synchrony and same-site spindle-beta coupling. That is, consistent spindle phase relations in the up state may ensure that local dependencies of beta power on spindle phase will be relayed to more distant sites, resulting in SO phase-dependent interregional coupling.
The approach using distinct sites for SO detection revealed both spatial commonalities and differences with regard to the organizing role of SOs. Concerning commonalities, our data show that, whenever reliable SO modulation of brain processing was observed, it was consistently localized around the site of SO detection. These local modulations of information processing fit with previous evidence showing that individual SOs can emerge locally on the scalp and travel across the cortical surface in idiosyncratic trajectories (Massimini et al., 2004; Menicucci et al., 2009). Thus, our findings suggest that, as an SO sweeps across the cortex, it organizes neural processing locally along its pathway. Moreover, our spatially clustered results agree well with recent findings showing how neural networks are locally involved in the regulation of sleep (Nir et al., 2011; Vyazovskiy et al., 2011) and sleep-related memory processing (Huber et al., 2004, 2006; Cox et al., 2014a).
Regarding topographical differences, SO-dependent power modulations were strong for all seed electrodes. Spindle synchrony, however, although most distinctly associated with SO up states on all detection sites (vs baseline connectivity; Fig. 5), was only significantly different between up- and down-centered epochs in frontal locations (Fig. 6). Similarly, cross-frequency coupling of beta power to spindle phase was reliably affected by SO phase only over frontal cortex (Fig. 8). Thus, whereas functional network coupling was present throughout cortex, connectivity measures related to spindle phase (i.e., PLI and MI) depend reliably on SO phase exclusively over anterior areas. This may be related to particularly high-amplitude SOs in frontal regions, exerting a commensurately strong influence on network processing. Functionally, this might imply a higher level of coordinated information processing in frontal circuitry than elsewhere.
It could be argued that our findings of enhanced frontal spindle synchrony in the up versus down state could be confounded by corresponding differences in spindle power, such that greater power leads to improved signal-to-noise ratios, more accurate phase estimates, and higher PLI values. However, even under circumstances when power is relatively low, tonic power levels in the brain are still sufficiently high for adequate phase estimation (Cohen, 2014). Moreover, spindle power also differed considerably between up and down states for the central and posterior seeds, whereas PLI did not. Thus, empirical data suggest that power modulations do not invariably result in comparable differences in phase synchrony. For these reasons, we believe the issue of potentially confounded power and synchrony measures does not pose a major concern.
Our findings have important implications for theories of system-level consolidation. Such theories hold that, during sleep, relatively fragile episodic hippocampal memory traces are recoded to more permanent neocortical stores (Marr, 1971; Frankland and Bontempi, 2005). Over the last two decades, evidence for this notion has been accumulating (Talamini et al., 2008; Takashima et al., 2009; Aton et al., 2014; Barnes and Wilson, 2014; Yang et al., 2014), and various accounts suggest dynamic interactions among SOs, sleep spindles, and hippocampal ripples are mechanistically involved in this process (Buzsáki, 1996; Diekelmann and Born, 2010). However, direct evidence for the coordinated reactivation and strengthening of distributed cortical representations during human sleep has, thus far, been lacking. Our findings are highly relevant in this respect, showing that the functional network coupling required for the establishment of durable corticocortical connections is compatible with the state of deep sleep. It is presently unclear whether observed oscillatory coupling during sleep reflects the processing of previously stored memories. Studies investigating whether coupling strength depends on presleep encoding history or correlates with presleep to postsleep memory retention could lend empirical support to this notion.
Whereas the previous focuses on memory strengthening, an alternative account of sleep-related information processing, the theory of synaptic homeostasis centers on the role of SOs in synaptic depression (Tononi and Cirelli, 2014). Our findings are not at odds with this theory, as they do not exclude the presence of global processes regulating synaptic metabolism. Our findings do, however, point at the simultaneous possibility of more specific, memory-related processing occurring during up states. It might here also be noted that the facilitation of spike-timing-dependent plasticity by functional network coupling could regard both long-term potentiation and depression.
Our data have practical implications for studies using external cues to reactivate memory traces (Oudiette and Paller, 2013). In particular, we suggest that memory cueing during sleep may be most effective when cue presentation is directed at depolarized up states, as used in some recent studies (Ngo et al., 2013; Cox et al., 2014b). Furthermore, given the local nature of SOs, this targeting should ideally be based on SO detection over cortical areas relevant for the cued memories.
Finally, our findings relate to more general aspects of sleep physiology. Previous studies have shown reduced metabolic activity in the descent from wakefulness to deep sleep (Braun et al., 1997) and a gradual breakdown of widespread corticocortical network interactions (Massimini et al., 2005; Spoormaker et al., 2010; Sämann et al., 2011). These findings have been taken to suggest diminished processing complexity during deep sleep. Nonetheless, our data indicate that, even during the deepest stages of sleep, macroscopic brain dynamics are incredibly rich and intricate. Thus, whereas functional networks may be reduced during deep sleep on average, highly organized network activity is still present, and its prominence is regulated by the slow oscillation rhythm.
Notes
Supplemental material for this article is available at http://dx.doi.org/10.6084/m9.figshare.1219206. Supplementary movie material shows the spatiotemporal dynamics of spindle and gamma power, as well as spindle phase synchrony, in relation to the phase of the slow oscillation. This material has not been peer reviewed.
Footnotes
This work was supported by Dutch National Science Foundation Grant 452-08-013 to L.M.T. We thank Michael X. Cohen and Tobias H. Donner for their advice on analysis procedures and suggestions regarding the manuscript.
The authors declare no competing financial interests.
References
- Andrillon T, Nir Y, Staba RJ, Ferrarelli F, Cirelli C, Tononi G, Fried I. Sleep spindles in humans: insights from intracranial EEG and unit recordings. J Neurosci. 2011;31:17821–17834. doi: 10.1523/JNEUROSCI.2604-11.2011. [DOI] [PMC free article] [PubMed] [Google Scholar]
- Antonenko D, Diekelmann S, Olsen C, Born J, Mölle M. Napping to renew learning capacity: enhanced encoding after stimulation of sleep slow oscillations. Eur J Neurosci. 2013;37:1142–1151. doi: 10.1111/ejn.12118. [DOI] [PubMed] [Google Scholar]
- Aton SJ, Suresh A, Broussard C, Frank MG. Sleep promotes cortical response potentiation following visual experience. Sleep. 2014;37:1163–1170. doi: 10.5665/sleep.3830. [DOI] [PMC free article] [PubMed] [Google Scholar]
- Ayoub A, Mölle M, Preissl H, Born J. Grouping of MEG gamma oscillations by EEG sleep spindles. Neuroimage. 2012;59:1491–1500. doi: 10.1016/j.neuroimage.2011.08.023. [DOI] [PubMed] [Google Scholar]
- Barnes DC, Wilson DA. Slow-wave sleep-imposed replay modulates both strength and precision of memory. J Neurosci. 2014;34:5134–5142. doi: 10.1523/JNEUROSCI.5274-13.2014. [DOI] [PMC free article] [PubMed] [Google Scholar]
- Braun AR, Balkin TJ, Wesenten NJ, Carson RE, Varga M, Baldwin P, Selbie S, Belenky G, Herscovitch P. Regional cerebral blood flow throughout the sleep–wake cycle: an H2 (15) O PET study. Brain. 1997;120:1173–1197. doi: 10.1093/brain/120.7.1173. [DOI] [PubMed] [Google Scholar]
- Buzsáki G. The hippocampo-neocortical dialogue. Cereb Cortex. 1996;6:81–92. doi: 10.1093/cercor/6.2.81. [DOI] [PubMed] [Google Scholar]
- Canolty RT, Knight RT. The functional role of cross-frequency coupling. Trends Cogn Sci. 2010;14:506–515. doi: 10.1016/j.tics.2010.09.001. [DOI] [PMC free article] [PubMed] [Google Scholar]
- Canolty RT, Edwards E, Dalal SS, Soltani M, Nagarajan SS, Kirsch HE, Berger MS, Barbaro NM, Knight RT. High gamma power is phase-locked to theta oscillations in human neocortex. Science. 2006;313:1626–1628. doi: 10.1126/science.1128115. [DOI] [PMC free article] [PubMed] [Google Scholar]
- Clemens Z, Mölle M, Eross L, Barsi P, Halász P, Born J. Temporal coupling of parahippocampal ripples, sleep spindles and slow oscillations in humans. Brain. 2007;130:2868–2878. doi: 10.1093/brain/awm146. [DOI] [PubMed] [Google Scholar]
- Cohen MX. Analyzing neural time series data: theory and practice. Cambridge, MA: Massachusetts Institute of Technology; 2014. [Google Scholar]
- Cohen MX, Cavanagh JF. Single-trial regression elucidates the role of prefrontal theta oscillations in response conflict. Front Psychol. 2011;2:30. doi: 10.3389/fpsyg.2011.00030. [DOI] [PMC free article] [PubMed] [Google Scholar]
- Cox R, Hofman WF, Talamini LM. Involvement of spindles in memory consolidation is slow wave sleep-specific. Learn Mem. 2012;19:264–267. doi: 10.1101/lm.026252.112. [DOI] [PubMed] [Google Scholar]
- Cox R, Hofman WF, de Boer M, Talamini LM. Local sleep spindle modulations in relation to specific memory cues. Neuroimage. 2014a;99:103–110. doi: 10.1016/j.neuroimage.2014.05.028. [DOI] [PubMed] [Google Scholar]
- Cox R, Korjoukov I, de Boer M, Talamini LM. Sound asleep: processing and retention of slow oscillation phase-targeted stimuli. PLoS One. 2014b;9:e101567. doi: 10.1371/journal.pone.0101567. [DOI] [PMC free article] [PubMed] [Google Scholar]
- Diekelmann S, Born J. The memory function of sleep. Nat Rev Neurosci. 2010;11:114–126. doi: 10.1038/nrn2762. [DOI] [PubMed] [Google Scholar]
- Fell J, Axmacher N. The role of phase synchronization in memory processes. Nat Rev Neurosci. 2011;12:105–118. doi: 10.1038/nrn2979. [DOI] [PubMed] [Google Scholar]
- Ferrarelli F, Huber R, Peterson MJ, Massimini M, Murphy M, Riedner BA, Watson A, Bria P, Tononi G. Reduced sleep spindle activity in schizophrenia patients. Am J Psychiatry. 2007;164:483–492. doi: 10.1176/appi.ajp.164.3.483. [DOI] [PubMed] [Google Scholar]
- Frankland PW, Bontempi B. The organization of recent and remote memories. Nat Rev Neurosci. 2005;6:119–130. doi: 10.1038/nrn1607. [DOI] [PubMed] [Google Scholar]
- Fries P. A mechanism for cognitive dynamics: neuronal communication through neuronal coherence. Trends Cogn Sci. 2005;9:474–480. doi: 10.1016/j.tics.2005.08.011. [DOI] [PubMed] [Google Scholar]
- Gais S, Mölle M, Helms K, Born J. Learning-dependent increases in sleep spindle density. J Neurosci. 2002;22:6830–6834. doi: 10.1523/JNEUROSCI.22-15-06830.2002. [DOI] [PMC free article] [PubMed] [Google Scholar]
- Huber R, Ghilardi MF, Massimini M, Tononi G. Local sleep and learning. Nature. 2004;430:78–81. doi: 10.1038/nature02663. [DOI] [PubMed] [Google Scholar]
- Huber R, Ghilardi MF, Massimini M, Ferrarelli F, Riedner BA, Peterson MJ, Tononi G. Arm immobilization causes cortical plastic changes and locally decreases sleep slow wave activity. Nat Neurosci. 2006;9:1169–1176. doi: 10.1038/nn1758. [DOI] [PubMed] [Google Scholar]
- Jutras MJ, Buffalo EA. Synchronous neural activity and memory formation. Curr Opin Neurobiol. 2010;20:150–155. doi: 10.1016/j.conb.2010.02.006. [DOI] [PMC free article] [PubMed] [Google Scholar]
- Le Van Quyen M, Staba R, Bragin A, Dickson C, Valderrama M, Fried I, Engel J. Large-scale microelectrode recordings of high-frequency gamma oscillations in human cortex during sleep. J Neurosci. 2010;30:7770–7782. doi: 10.1523/JNEUROSCI.5049-09.2010. [DOI] [PMC free article] [PubMed] [Google Scholar]
- Maris E, Oostenveld R. Nonparametric statistical testing of EEG- and MEG-data. J Neurosci Methods. 2007;164:177–190. doi: 10.1016/j.jneumeth.2007.03.024. [DOI] [PubMed] [Google Scholar]
- Marr D. Simple memory: a theory for archicortex. Philos Trans R Soc Lond B Biol Sci. 1971;262:23–81. doi: 10.1098/rstb.1971.0078. [DOI] [PubMed] [Google Scholar]
- Marshall L, Helgadóttir H, Mölle M, Born J. Boosting slow oscillations during sleep potentiates memory. Nature. 2006;444:610–613. doi: 10.1038/nature05278. [DOI] [PubMed] [Google Scholar]
- Massimini M, Huber R, Ferrarelli F, Hill S, Tononi G. The sleep slow oscillation as a traveling wave. J Neurosci. 2004;24:6862–6870. doi: 10.1523/JNEUROSCI.1318-04.2004. [DOI] [PMC free article] [PubMed] [Google Scholar]
- Massimini M, Ferrarelli F, Huber R, Esser SK, Singh H, Tononi G. Breakdown of cortical effective connectivity during sleep. Science. 2005;309:2228–2232. doi: 10.1126/science.1117256. [DOI] [PubMed] [Google Scholar]
- Menicucci D, Piarulli A, Debarnot U, d'Ascanio P, Landi A, Gemignani A. Functional structure of spontaneous sleep slow oscillation activity in humans. PLoS One. 2009;4:e7601. doi: 10.1371/journal.pone.0007601. [DOI] [PMC free article] [PubMed] [Google Scholar]
- Mölle M, Marshall L, Gais S, Born J. Grouping of spindle activity during slow oscillations in human non-rapid eye movement sleep. J Neurosci. 2002;22:10941–10947. doi: 10.1523/JNEUROSCI.22-24-10941.2002. [DOI] [PMC free article] [PubMed] [Google Scholar]
- Mölle M, Marshall L, Gais S, Born J. Learning increases human electroencephalographic coherence during subsequent slow sleep oscillations. Proc Natl Acad Sci U S A. 2004;101:13963–13968. doi: 10.1073/pnas.0402820101. [DOI] [PMC free article] [PubMed] [Google Scholar]
- Mölle M, Eschenko O, Gais S, Sara SJ, Born J. The influence of learning on sleep slow oscillations and associated spindles and ripples in humans and rats. Eur J Neurosci. 2009;29:1071–1081. doi: 10.1111/j.1460-9568.2009.06654.x. [DOI] [PubMed] [Google Scholar]
- Mölle M, Bergmann TO, Marshall L, Born J. Fast and slow spindles during the sleep slow oscillation: disparate coalescence and engagement in memory processing. Sleep. 2011;34:1411–1421. doi: 10.5665/SLEEP.1290. [DOI] [PMC free article] [PubMed] [Google Scholar]
- Murphy M, Riedner BA, Huber R, Massimini M, Ferrarelli F, Tononi G. Source modeling sleep slow waves. Proc Natl Acad Sci U S A. 2009;106:1608–1613. doi: 10.1073/pnas.0807933106. [DOI] [PMC free article] [PubMed] [Google Scholar]
- Ngo HV, Martinetz T, Born J, Mölle M. Auditory closed-loop stimulation of the sleep slow oscillation enhances memory. Neuron. 2013;78:545–553. doi: 10.1016/j.neuron.2013.03.006. [DOI] [PubMed] [Google Scholar]
- Nir Y, Staba RJ, Andrillon T, Vyazovskiy VV, Cirelli C, Fried I, Tononi G. Regional slow waves and spindles in human sleep. Neuron. 2011;70:153–169. doi: 10.1016/j.neuron.2011.02.043. [DOI] [PMC free article] [PubMed] [Google Scholar]
- O'Neill J, Pleydell-Bouverie B, Dupret D, Csicsvari J. Play it again: reactivation of waking experience and memory. Trends Neurosci. 2010;33:220–229. doi: 10.1016/j.tins.2010.01.006. [DOI] [PubMed] [Google Scholar]
- Oostenveld R, Praamstra P. The five percent electrode system for high-resolution EEG and ERP measurements. Clin Neurophysiol. 2001;112:713–719. doi: 10.1016/S1388-2457(00)00527-7. [DOI] [PubMed] [Google Scholar]
- Oudiette D, Paller KA. Upgrading the sleeping brain with targeted memory reactivation. Trends Cogn Sci. 2013;17:142–149. doi: 10.1016/j.tics.2013.01.006. [DOI] [PubMed] [Google Scholar]
- Perrin F, Pernier J, Bertrand O, Echallier JF. Spherical splines for scalp potential and current density mapping. Electroencephalogr Clin Neurophysiol. 1989;72:184–187. doi: 10.1016/0013-4694(89)90180-6. [DOI] [PubMed] [Google Scholar]
- Piantoni G, Astill RG, Raymann RJ, Vis JC, Coppens JE, Van Someren EJ. Modulation of gamma and spindle-range power by slow oscillations in scalp sleep EEG of children. Int J Psychophysiol. 2013;82:252–258. doi: 10.1016/j.ijpsycho.2013.01.017. [DOI] [PubMed] [Google Scholar]
- Rechtschaffen A, Kales A. A manual of standardized terminology, techniques and scoring system of sleep stages in human subjects. Los Angeles: Brain Information Service/Brain Research Institute, University of California; 1968. [Google Scholar]
- Rosanova M, Ulrich D. Pattern-specific associative long-term potentiation induced by a sleep spindle-related spike train. J Neurosci. 2005;25:9398–9405. doi: 10.1523/JNEUROSCI.2149-05.2005. [DOI] [PMC free article] [PubMed] [Google Scholar]
- Saletin JM, Goldstein AN, Walker MP. The role of sleep in directed forgetting and remembering of human memories. Cereb Cortex. 2011;21:2534–2541. doi: 10.1093/cercor/bhr034. [DOI] [PMC free article] [PubMed] [Google Scholar]
- Sämann PG, Wehrle R, Hoehn D, Spoormaker VI, Peters H, Tully C, Holsboer F, Czisch M. Development of the brain's default mode network from wakefulness to slow wave sleep. Cereb Cortex. 2011;21:2082–2093. doi: 10.1093/cercor/bhq295. [DOI] [PubMed] [Google Scholar]
- Schabus M, Gruber G, Parapatics S, Sauter C, Klösch G, Anderer P, Klimesch W, Saletu B, Zeitlhofer J. Sleep spindles and their significance for declarative memory consolidation. Sleep. 2004;27:1479–1485. doi: 10.1093/sleep/27.7.1479. [DOI] [PubMed] [Google Scholar]
- Spoormaker VI, Schröter MS, Gleiser PM, Andrade KC, Dresler M, Wehrle R, Sämann PG, Czisch M. Development of a large-scale functional brain network during human non-rapid eye movement sleep. J Neurosci. 2010;30:11379–11387. doi: 10.1523/JNEUROSCI.2015-10.2010. [DOI] [PMC free article] [PubMed] [Google Scholar]
- Srinivasan R, Winter WR, Ding J, Nunez PL. EEG and MEG coherence: measures of functional connectivity at distinct spatial scales of neocortical dynamics. J Neurosci Methods. 2007;166:41–52. doi: 10.1016/j.jneumeth.2007.06.026. [DOI] [PMC free article] [PubMed] [Google Scholar]
- Stam CJ, Nolte G, Daffertshofer A. Phase lag index: assessment of functional connectivity from multichannel EEG and MEG with diminished bias from common sources. Hum Brain Mapp. 2007;28:1178–1193. doi: 10.1002/hbm.20346. [DOI] [PMC free article] [PubMed] [Google Scholar]
- Steriade M, Nuñez A, Amzica F. A novel slow (<1 Hz) oscillation of neocortical neurons in vivo: depolarizing and hyperpolarizing components. J Neurosci. 1993a;13:3252–3265. doi: 10.1523/JNEUROSCI.13-08-03252.1993. [DOI] [PMC free article] [PubMed] [Google Scholar]
- Steriade M, Nuñez A, Amzica F. Intracellular analysis of relations between the slow (<1 Hz) neocortical oscillation and other sleep rhythms of the electroencephalogram. J Neurosci. 1993b;13:3266–3283. doi: 10.1523/JNEUROSCI.13-08-03266.1993. [DOI] [PMC free article] [PubMed] [Google Scholar]
- Takashima A, Nieuwenhuis IL, Jensen O, Talamini LM, Rijpkema M, Fernández G. Shift from hippocampal to neocortical centered retrieval network with consolidation. J Neurosci. 2009;29:10087–10093. doi: 10.1523/JNEUROSCI.0799-09.2009. [DOI] [PMC free article] [PubMed] [Google Scholar]
- Talamini LM, Nieuwenhuis IL, Takashima A, Jensen O. Sleep directly following learning benefits consolidation of spatial associative memory. Learn Mem. 2008;15:233–237. doi: 10.1101/lm.771608. [DOI] [PubMed] [Google Scholar]
- Tononi G, Cirelli C. Sleep and the price of plasticity: from synaptic and cellular homeostasis to memory consolidation and integration. Neuron. 2014;81:12–34. doi: 10.1016/j.neuron.2013.12.025. [DOI] [PMC free article] [PubMed] [Google Scholar]
- Tort AB, Komorowski R, Eichenbaum H, Kopell N. Measuring phase-amplitude coupling between neuronal oscillations of different frequencies. J Neurophysiol. 2010;104:1195–1210. doi: 10.1152/jn.00106.2010. [DOI] [PMC free article] [PubMed] [Google Scholar]
- Valderrama M, Crépon B, Botella-Soler V, Martinerie J, Hasboun D, Alvarado-Rojas C, Baulac M, Adam C, Navarro V, Le Van Quyen M. Human gamma oscillations during slow wave sleep. PLoS One. 2012;7:e33477. doi: 10.1371/journal.pone.0033477. [DOI] [PMC free article] [PubMed] [Google Scholar]
- Valencia M, Artieda J, Bolam JP, Mena-Segovia J. Dynamic interaction of spindles and gamma activity during cortical slow oscillations and its modulation by subcortical afferents. PLoS One. 2013;8:e67540. doi: 10.1371/journal.pone.0067540. [DOI] [PMC free article] [PubMed] [Google Scholar]
- van Driel J, Ridderinkhof KR, Cohen MX. Not all errors are alike: theta and alpha EEG dynamics relate to differences in error-processing dynamics. J Neurosci. 2012;32:16795–16806. doi: 10.1523/JNEUROSCI.0802-12.2012. [DOI] [PMC free article] [PubMed] [Google Scholar]
- Volgushev M, Chauvette S, Mukovski M, Timofeev I. Precise long-range synchronization of activity and silence in neocortical neurons during slow-wave oscillations. J Neurosci. 2006;26:5665–5672. doi: 10.1523/JNEUROSCI.0279-06.2006. [DOI] [PMC free article] [PubMed] [Google Scholar]
- Vyazovskiy VV, Olcese U, Hanlon EC, Nir Y, Cirelli C, Tononi G. Local sleep in awake rats. Nature. 2011;472:443–447. doi: 10.1038/nature10009. [DOI] [PMC free article] [PubMed] [Google Scholar]
- Womelsdorf T, Schoffelen JM, Oostenveld R, Singer W, Desimone R, Engel AK, Fries P. Modulation of neuronal interactions through neuronal synchronization. Science. 2007;316:1609–1612. doi: 10.1126/science.1139597. [DOI] [PubMed] [Google Scholar]
- Yang G, Lai CS, Cichon J, Ma L, Li W, Gan WB. Sleep promotes branch-specific formation of dendritic spines after learning. Science. 2014;344:1173–1178. doi: 10.1126/science.1249098. [DOI] [PMC free article] [PubMed] [Google Scholar]
- Zeitlhofer J, Gruber G, Anderer P, Asenbaum S, Schimicek P, Saletu B. Topographic distribution of sleep spindles in young healthy subjects. J Sleep Res. 1997;6:149–155. doi: 10.1046/j.1365-2869.1997.00046.x. [DOI] [PubMed] [Google Scholar]