Telencephalic Neural Progenitors Appear To Be Restricted to Regional and Glial Fates before the Onset of Neurogenesis (original) (raw)
Abstract
The contribution of early cell lineage to regional fate in the mammalian forebrain remains poorly understood. Previous lineage-tracing studies using retroviral methods were only begun at mid-neurogenesis and have suffered from region-specific retroviral silencing. We have been able to study cell lineage in the telencephalon from the onset of neurogenesis by using ultrasound backscatter microscopy to label the forebrain neuroepithelium and a modified retroviral lineage library to overcome regional silencing. Our studies suggest that by embryonic day 9.5, forebrain clones are primarily restricted to territories within anatomically demarcated regional boundaries, such as the cortex, striatum and hypothalamus. In addition, we observed a subset of clones that appeared to be composed entirely of glia. These observations suggest that both regional and cell-type restrictions exist within progenitor populations before the first forebrain cells become postmitotic.
Keywords: lineal analysis, retrovirus, telencephalon, neurogenesis, regional restriction, cell identity
The contribution of cell lineage to the complex anatomical organization of the telencephalon is unclear. It has been postulated that a lineally based “protomap” (Rakic, 1988) exists before neurogenesis. This hypothesis is supported by the expression of transcription factors in the forebrain neuroepithelium that correlate with mature brain organization (Rubenstein et al., 1994;Shimamura et al., 1995; Puelles et al., 2000). In addition, experiments have suggested that regional borders restrict cell dispersion across forebrain ventricular (VZ) zones (Fishell et al., 1993).
Lineage studies have observed widespread clones in the cerebral cortex (Walsh and Cepko, 1988, 1990, 1993; Reid et al., 1995, 1997; Szele and Cepko, 1996, 1998). These studies, in contrast to the predictions of the protomap hypothesis, suggest that cell lineage is a poor predictor of final position in the telencephalon. However these studies were initiated at mid-neurogenesis and do not reflect the earliest postmitotic cells. More recently, early ferret lineal analysis (Ware et al., 1999) and chimeric rodent studies (Tan et al., 1993) have revealed the existence of radial clones. Hence, the protomap hypothesis appears to be applicable to some but not all neural lineages within the forebrain.
Two distinct modes of migration appear to be used in the telencephalon: radial (Hatten, 1990, 1993, 1999; Rakic, 1990) and tangential (Fishell et al., 1993; O'Rourke et al., 1995). In addition, it has been suggested that separate lineages use these two modes of migration. Consistent with this idea, recent studies have suggested that most cortical interneurons originate from the ventral regions of the forebrain (Anderson et al., 1997, 1999). Nevertheless, although the link between region of origin and pattern of migration seems secure, whether lineage restriction is an obligate part of this process remains uncertain at present.
A related question involves the specification of specific cell types in the forebrain. Although some cell types are specific to particular anatomic regions (e.g., pyramidal cortical neurons), others such as interneurons and oligodendrocytes are ubiquitous. A variety of lines of evidence have suggested that cells fated to become projection neurons and interneurons are derived from separate lineages (Parnavelas et al., 1991, 1995; Tan and Breen, 1993; Mione et al., 1994, 1997). Similarly, circumstantial evidence for the early specification of glial-restricted progenitors has been reported (Levitt et al., 1981; Berman et al., 1997).
A lineal analysis from the onset of neurogenesis would help clarify the contribution of lineage to cell type and regional fate. Such a study has not been attempted in rodents for technical reasons. We have overcome these difficulties through the development of a modified retroviral lineage library that is resistant to silencing (Gaiano et al., 1999) and by using ultrasound backscatter microscopy (UBM) guidance to make injections at embryonic day 9.5 (E9.5) (Liu et al.,1998; Gaiano et al., 1999).
We have observed that regional cell identity appears to be restricted early in forebrain histogenesis and that a subpopulation of large glial-specific clones appears to be present by E9.5. Together, our studies suggest that a surprising degree of regional and cell-type specificity exists by the onset of neurogenesis in the telencephalon.
MATERIALS AND METHODS
Cytomegalovirus enhancer-chick β-actin promoter plasmid preparation. The cytomegalovirus (CMV) enhancer-chick β-actin promoter (CAP) library is a modified version of the Babe vector, oligonucleotide library, alkaline phosphatase (BOLAP) (Cepko et al., 1998). The 1.7 kb _Eco_RI–_Xho_I fragment from the pCLC plasmid (Gaiano et al., 1999) containing the CAP sequences was blunt-end ligated into the _Eco_RI site of BOLAP. Three micrograms of the resulting plasmid were digested with_Asc_I and _Xho_I, and these sites were used to directionally insert 25 ng of the degenerate oligonucleotide pool (5′-TAGGAGGCGCGCGCCTTT[(G or C) (A or T)]GTTACGCGTTAATTAACTCGAGATCTAGCTTC-3′). The ligation reaction was purified over a silica-bead column (Qiagen, Valencia, CA) and resuspended in 50 μl of 10 mm Tris and 1 mm EDTA. Twenty microliters of ligation product were used to transform Electromax DH10B competent cells (Life Technologies, Grand Island, NY) according to the manufacturer's instructions. The transformed cells were pooled and then seeded into five 1 l cultures of Luria broth (LB) containing ampicillin and kanamycin. Three milligrams of CAP plasmid were extracted by alkaline lysis and purified using CsCl gradients. Serial dilutions of 1 μl of CAP-transformed DH10B cells were grown on LB amp plates. The number of colonies on these plates projected a total number of 1.5 × 10⁷ transformants. Control ligated vector arms gave a background of <1%. A test of the complexity of the library was performed by infecting NIH 3T3 cells in vitro, as described previously for BOLAP (Golden and Cepko, 1996; Cepko et al., 1998). Bulk-infected NIH 3T3 cells were cloned by limiting dilution in 96 well tissue-culture plates, and the resultant colonies were fixed with 4% paraformaldehyde and stained for detection of human placental alkaline phosphatase (PLAP) activity, as described below. These cell cultures were washed with PBS and then lysed by mechanical agitation in 10 μl 1× PCR buffer (Roche, Hertforshire, UK) containing 400 μg/ml proteinase K and 0.02% Tween 20. The lysate was transferred to 96 well PCR plates and covered with mineral oil. The plate was heated to 65°C for 2 hr, 85°C for 20 min, and 95°C for 10 min. Two rounds of nested PCR were performed as described below, and the 10 μl of the PCR product was run on a 2% NuSieve (Rockland, ME) 1% SeaKem GTG agarose gel (Bioproducts, Rockland, ME). Wells that yielded an amplified 123 bp DNA product were later sequenced using an Exo-Pfu Cyclist kit (Stratagene, La Jolla, CA) as described below. One hundred PCR products were sequenced; none contained the same sequence.
CAP virus preparation. Pseudotyped CAP virus was prepared as described previously (Gaiano et al., 1999). Briefly, thirty micrograms of CAP plasmid along with 35 μg of pHCMVG plasmid were cotransfected into a 293-derived packaging line (293GP cells; Chiron, San Diego, CA) at 90% confluence on 150 mm tissue-culture plates by calcium phosphate precipitation. Virus-containing supernatant was harvested at 24, 36, and 48 hr after infection. Thirty-six milliliters of the 36 hr supernatant were harvested from three plates transfected in tandem and the supernatants were pooled. This supernatant was titrated using NIH 3T3 cells and was found to contain 352,000 pfu/ml. This pool of virus was used to infect the majority of brains (12 of 17, 70.5%) analyzed in this study. In addition, a pooled ecotropic viral supernatant (titer, 504,000 pfu/ml) produced in the Phoenix-eco line was used to infect the remainder of the brains (5 of 17, 29.4%) analyzed in this study.
Animal surgery and UBM injections. All animals were housed in the Skirball Animal Facility and were maintained in accordance with protocols approved by the Institutional Animal Care and Use Committee at New York University School of Medicine. E9.5 timed-pregnant Swiss–Webster female mice were obtained from the Skirball Institute transgenic facility. The day of sperm plug identification was defined as E0.5. Animal care, preparation for surgery, and the use of the UBM scanner were done as described previously (Liu et al., 1998). On E9.5, 2 μl of viral supernatant containing 80 μg/ml polybrene was injected into the lateral ventricle of each embryo. All embryos from each litter were injected. The accuracy of the injection could be monitored using real-time imaging of the UBM scanner. After surgery, each uterus was placed into the peritoneal cavity and the incision in the body wall was sutured. Animals were allowed to recover from surgery and placed back in the animal colony to allow development to continue normally until E16.5 for migration studies or until postnatal day 21 (P21) for clonal analysis.
Sample preparation, histology, and analysis of cell clusters. Animals were killed on E16.5 or P21 by an overdose of Nembutal. The heads were severed and the brains were removed from the cranium. Brains were fixed by immersion in 4% paraformaldehyde in PBS at 4°C (E16.5 for 2 hr and P21 overnight). The brains were transferred to 30% sucrose in PBS and stored at 4°C until they sank. They were then mounted in optimal cutting temperature (OCT) compound (Tissue-Tek, Miles Inc., Elkhart, IN) and frozen on dry ice. Brains were stored at −20°C until they were sectioned at 40 μm thickness using a Leica CM 3050 S cryostat (Leica, Nussloch, Germany). Sections were mounted onto Colorfrost Plus slides (Fisher Scientific, Houston, TX) and were allowed to air dry for 20 min. OCT compound was removed by three 5 min washes in PBS. Endogenous alkaline phosphatase activity was heat inactivated by heating the sections in a 65°C PBS bath containing 2 mm MgCl2. The sections were then rinsed in alkaline phosphatase detection buffer (100 mm Tris-HCl, pH 9.5, 50 mmMgCl2, 100 mm NaCl) for 5 min. The slides were stained in alkaline phosphatase detection buffer containing 1 mg/ml nitroblue tetrazolium and 0.2 mg/ml 5-bromo-4-chloro-3-indolyl-phosphate for 48 hr at room temperature. Exogenous staining solution was removed, and the reaction was halted by washing the sections in PBS containing 20 mm EDTA. Slides were coverslipped using Gelvatol and stored at −20°C until analysis. Labeled cells were detected and mapped onto camera lucida drawings by light microscopic analysis using a Zeiss Axioplan microscope (Zeiss, Thornwood, NY) equipped with a camera lucida tube.
Clonal analysis using PCR and sequencing. Labeled cells were “picked” from sections as described previously (Walsh and Cepko, 1992). Briefly, coverslips were removed by soaking in a 50 ml tube of sterile distilled water. Small tissue pieces (∼100 × 200 × 40 μm) containing the nucleus of single infected cells if possible (or several infected cells if necessary) were dissected from the sections using a fresh beaver razor blade for each pick. Tissue fragments were digested in 10 μl of 400 μg/ml proteinase K solution in 1× PCR buffer in 96 well PCR plates as described above. The reaction was halted and proteinase K was heat inactivated as described above. A nested PCR protocol was used to increase the sensitivity and specificity of amplification using the following oligonucleotide primers: 5, 5′-CCA GGGACT GCA GGT TGT GCC CTG T-3′; 6, 5′-AGA CAC ACA TTC CAC AGG GTC GGA G-3′; 7, 5′-GGC TGC CTG CAC CCC AGG AAA GGA G-3′; and 8, 5′-GGT CTC GGA AGC CCT CAG CCC AGT C-3′. The first round of nested PCR was performed by adding 20 μl of PCR mix to each well [2 μl of 10× PCR buffer with Mg2+ (Roche), 0.15 μl of primers 5 and 6 (0.6 mg/ml), 0.15 μl of dNTP mix (25 mm) (Roche), 17.4 μl of water, and 0.4 μl of Taq DNA polymerase (Roche)] and cycling at 93°C for 2.5 min, followed by 33 cycles of 94°C for 45 sec, 67°C for 2 min, 72°C for 2 min, and 72°C for 5 min. One microliter of the reaction product from the first PCR was added to 20 μl of PCR mix, substituting primers 7 and 8 for primers 5 and 6. The amplification program for the second round of PCR was 93°C for 2.5 min, followed by 30 cycles of 94°C for 45 sec, 72°C for 2 min, and 72°C for 5 min. Ten microliters of the final PCR were added to 2 μl 6× gel-running dye and fractionated on an agarose gel, as described above, alongside a 100 bp ladder marker (Life Technologies). All samples yielding a 123 bp PCR product were sequenced using the Exo-Pfu Cyclist sequencing kit according to the manufacturer's instructions (Stratagene).
Subcloning analysis on funnel-shaped clusters. The observation that radial clones were consistently polyclonal prompted us to do an exhaustive lineal analysis of a radially arrayed cluster of 13 virally infected cells in the cortex. We collected 13 samples that together comprised all the cells in this radial cluster. Of these 13, 6 did not amplify, 3 had unique sequence inserts, and 4 gave laddered sequences, suggesting that they contained multiple inserts and hence cells from multiple lineages. Each of the four apparently polyclonal tissue samples was subcloned to determine the constituent sequences, using the Invitrogen TA cloning kit (Invitrogen, San Diego, CA) according to the manufacturer's instructions. It seemed highly probable that each of these four samples contained no more than four infected cells each, given the number of PLAP-positive labeled cells seen in each tissue sample. If each of these four cells was from independent lineages, we concluded we would have to pick at least 25 colonies from each of the four subcloned samples to have a reasonable probability of obtaining all of the unique constituent sequences. We reasoned that if each of the infected cells was the result of separate infections and no superinfection or silencing was occurring, our analysis had an extremely high probability of exhaustively identifying all unique infection events in this funnel-shaped cluster.
RESULTS
E9.5 UBM injections of the CAP library label the earliest postmitotic cells and are resistant to retroviral silencing
Previous retroviral lineage studies in the forebrain have noted pronounced silencing of retroviral vectors in some regions (i.e., the striatum) (Halliday and Cepko, 1992). In addition, retroviral vectors are known to be silenced in both hematopoietic and embryonic stem cells. Our early in vivo lineage analysis indicated that the majority of cells infected at E9.5 apparently give rise to single-cell clones. This finding was surprising because at the time of infection the entire mouse forebrain neuroepithelium is proliferative and is thought to be dividing symmetrically to give rise to additional progenitor cells (Takahashi et al., 1994; Bhide, 1996; Sheth and Bhide, 1997). This suggested that the murine leukemia virus (MLV) long terminal repeat (LTR) might be silenced in E9.5 neuroepithelial progenitors. To overcome such silencing, we have previously used mammalian promoters internal to the 5′ LTR to prevent silencing in stem cell populations (Gaiano et al., 1999). Hence, to do a regional study of the forebrain over the entire period of neurogenesis, we constructed a library containing a nested 1.7 kb hybrid CMV enhancer–chick β-actin promoter (Gaiano et al., 1999). The resultant CAP library (Fig. 1A) is a modified version of the BOLAP murine sequenceable retroviral library (Cepko et al., 1998).
Fig. 1.

UBM-guided delivery of retroviral libraries containing internal promoter sequences allows lineage analysis of the forebrain neuroepithelium from the onset of neurogenesis. A, The retroviral lineage library CAP contains human PLAP as a marker of infection and a 24 bp oligonucleotide as a lineage tracer under the transcriptional control of an internal CMV enhancer–β-actin promoter nested 3′ to the MLV LTR. The positions and orientations of oligonucleotide primer sequences P5–8 used to amplify the lineage tracer are indicated by_arrows_. Retroviral library stocks with or without the internal enhancer–promoter sequence were used to infect E9.5 forebrain using UBM-guided injections into the lateral ventricle. Use of the CMV–β-actin promoter significantly reduces retroviral gene silencing in all regions of the forebrain examined (B). E9.5 infections with retroviruses containing the nested promoter increased the number of PLAP-positive cells in the proliferative zones (C) (both in the VZ and SVZ zones) compared with retroviral infections with vectors lacking the internal promoter sequences. Similarly, postnatal analysis demonstrated that inclusion of the nested promoter increased retroviral expression in the ependymal zone (D) [in this instance lining the third ventricle (3V)] and in the striatum (E) in infected brains. Notably, the modified retrovirus allowed visualization of Cajal–Retzius cells (F), an early born cortical neuronal population, after E9.5 injections. SV40, simian virus 40 early promoter; neo, TnS neomycin resistance gene.
To demonstrate that the internal promoter did indeed prevent retroviral silencing, we amplified PLAP-negative tissue from E16.5 brains infected with CAP or BOLAP libraries. As shown in Figure 1B, PLAP-negative tissue selected from CAP-infected brains amplified at a much lower frequency than did PLAP-negative tissue picks from similar regions of BOLAP-infected brains, suggesting that the internal promoter does indeed prevent retroviral silencing. Further supporting the idea that CAP-infected brains were less subject to retroviral silencing, CAP-infected brains harvested embryonically were seen to harbor many more PLAP-positive cells in the VZ and subventricular (SVZ) proliferative zones than comparable BOLAP-infected brains (Fig.1C). In addition, brains infected with CAP and harvested 3 weeks postnatally contained numerous PLAP-positive ependymal cells (Fig. 1D) as well as striatal neurons (Fig.1E), whereas BOLAP-infected brains did not.
UBM-guided injections allowed brains to be infected at E9.5, just after anterior neuropore closure. We were thus able to study the contribution of lineage to regional specification from the onset of neurogenesis. In three brains injected at E9.5 and harvested at E16.5, we were able to label neurons in the marginal zone (MZ) with the morphologic characteristics of Cajal–Retzius (C–R) cells (Fig.1F) (Marin-Padilla, 1998). These cells had long varicose processes arrayed tangentially to the pial surface. C–R cells were never seen in brains harvested postnatally, consistent with the view that this is primarily a transient neuronal population of the pre-plate that does not persist into adulthood. We were able to do sequence analysis on a cluster of 19 cells, 12 of which were C–R cells, situated in the MZ of the posterior cortex. Among these, four C–R cells contained the same 24 bp insert, whereas the other cells contained distinct DNA tags or yielded an unreadable sequence. Because most C–R cells in the mouse are thought to be born between E10.5 and E13.5, a maximum clone size of four to six, based on 5-bromodeoxyuridine-labeling kinetics, would be expected and is consistent with our results (Derer, 1985; Derer and Derer, 1990;Gonzalez et al., 1997).
Analysis of CAP-labeled forebrains at E16.5 suggests most clones are regionally restricted
CAP virus stock that was concentrated by ultracentrifugation and then resuspended at a concentration of 2 × 10⁶ pfu/ml was injected into the lateral ventricles of E9.5 embryos. The embryos were allowed to survive until E16.5, to study the migratory dispersion of clonally related cells. At this time point, migration is at its height in the forebrain and the patterns of dispersed cells were readily distinguishable. Several patterns of cell dispersion reported previously were observed in our study and are diagrammed schematically in Figure2A,B. Radial migration has been shown to be a predominant mode of migration in the cerebral cortex. Consistent with this notion, we found that radial dispersal of cells was highly prevalent in cortical progenitors labeled at early times in neurogenesis (Fig. 2C,D,F–H). Large funnel-shaped clusters of cells were most prominent in the dorsomedial cortex, whereas the numbers of these clusters diminished in more lateral areas of cortex (Austin and Cepko, 1990) (Fig.2C,D,F–H). The level of infection used in the dispersal studies and the relative immaturity of cells at E16.5 often precluded determination of the cell type in the funnel clusters (Fig.2D,F,G). Nevertheless, it appeared that these clusters were composed of both radial glial cells and migrating neuronal progeny (Fig. 2H).
Fig. 2.
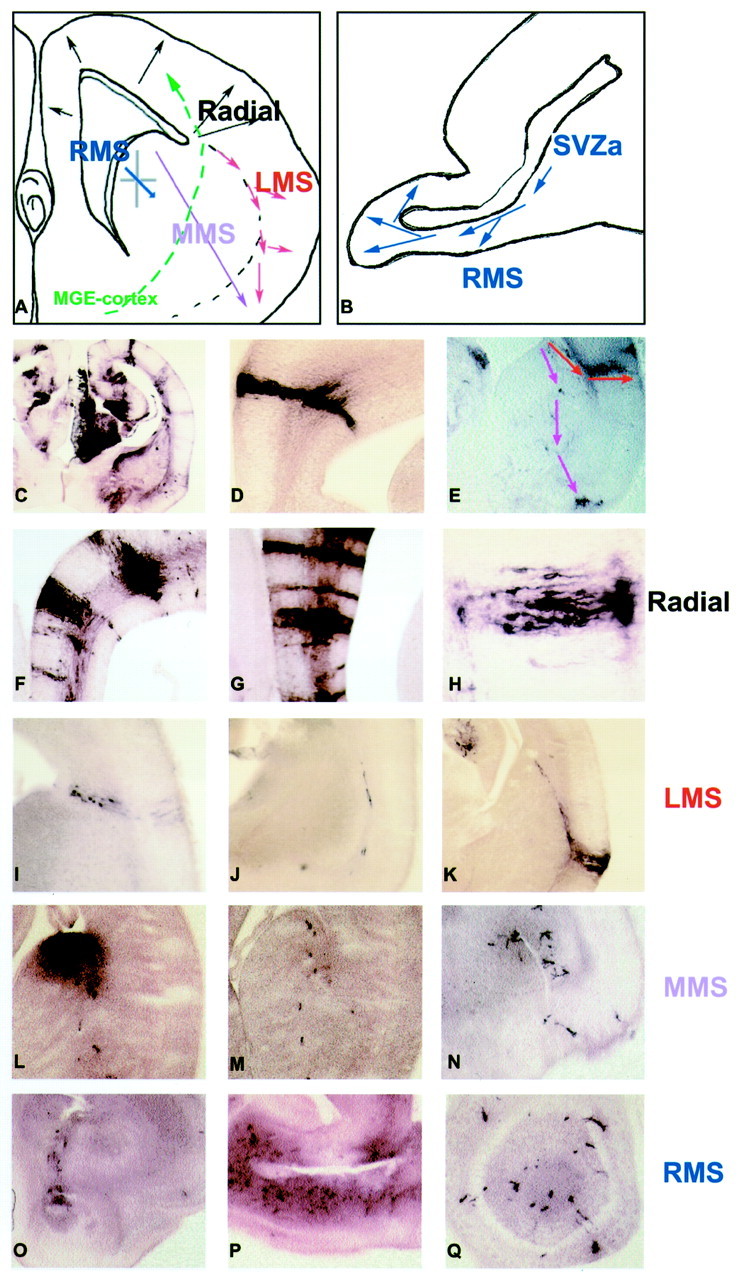
Patterns of cell dispersion in the embryonic forebrain infected with retrovirus at E9.5. Patterns of cell dispersion observed in E9.5 infected brains at E16.5 are diagrammed schematically in coronal (A) and sagittal (B) sections. In the dorsal and medial cortex, cells are distributed predominantly in a radial orientation (A, C, D,F–H). Cells from the proliferative zone at the corticostriatal sulcus (C–S) apparently migrate in the LMS, along the glial palisade separating the developing striatum from the lateral cortex (A, E,I, J). Individual radial glia in this palisade diverge and terminate in the lateral and piriform cortex (K). Cells apparently produced in the ventral proliferative zone of the LGE (A, E,L) disperse ventrally through the developing striatum (M) into the entorhinal cortex (N) and in more caudal sections to the amygdala in the MMS. Cells enter the RMS from the SVZa (B,O) and were found through the subventricular zone ventrally and anteriorly to the olfactory bulb (P,Q). All photomicrographs show coronal sections, with the exception of P, which shows a sagittal section.
In the lateral cortex, cells were found dispersed along the glial pallisade dividing the developing striatum from the lateral cortex, corresponding to a migratory path described by Bayer et al. (1991) as the lateral migratory stream (LMS) (Fig.2E,I–K). Labeled cells that appeared to originate from the VZ at the corticostriatal sulcus (Fig.2I) were dispersed ventrally along these glial fibers (Fig. 2J) to the piriform (Fig.2K) and entorhinal cortex. We observed a third pattern of dispersal, which we have termed the medial migratory stream (MMS). This path of migration has been reported to be used by Lhx2 cells (Anderson et al., 2001) and disrupted in Pax6 mutants (small-eye) (Stoykova et al., 2000). It has been speculated that this may be a significant mode of migration for cells fated to the ventral cortical regions and the amygdala (Stoykova et al., 2000). In this regard, cells apparently originating from the VZ of the lateral ganglionic eminence (LGE) (Fig. 2L) could be seen dispersed ventrally through the developing striatum (Fig. 2M) to the entorhinal cortex and more posteriorly to the developing amygdala (Fig.2N).
The final major pattern of dispersal discernable in the E16.5 mouse brain was along the rostral migratory stream (RMS). These neuroblasts are apparently derived from the anterior striatal SVZ zone (SVZa) (Fig.2O) and migrate ventrally and anteriorly to populate the olfactory bulb (Fig. 2P). These cells give rise to olfactory interneurons (Fig. 2Q) and periglomerular cells in the bulb, and this process of neurogenesis and migration continues throughout adult life (Luskin, 1993; Lois and Alvarez-Buylla, 1994). Although numerous lines of evidence suggest that cells disperse tangentially within the telencephalon in a ventral-to-dorsal direction (Anderson et al., 1997, 1999), this path of migration was not evident in our E16.5 analysis. This is likely attributable to the masking effect caused by the other patterns of virally infected dispersing cells at E16.5. Indeed the two large clones described below (clones 25 and 26) are likely the products of this type of migration.
Attempts were made to determine whether the cells labeled in these dispersion patterns were in fact clonally related. Cells representing each of these dispersion patterns were cut out en masse and subjected to PCR amplification and sequencing. Remarkably, in all cases, at this level of viral infection, clusters of cells with distinct patterns of dispersion were found to be polyclonal. This suggests that the spatial location of progenitors at E9.5 dictates which environmental cues their progeny will use to migrate to their final regional positions.
Radially arrayed cells in close proximity were generally not found to be lineally related
The funnel-shaped clusters prevalent in the dorsomedial cortex were noted to be present in brains infected with relatively high titers of virus (Fig. 3A–E). The clusters at this viral titer were so dense that cell morphology was not always discernible, although neuronal cell somas and neurites were present in every cluster. It was not possible at this viral titer to pick single cells of known morphology. Cells in these clusters were dissected en masse and found to be polyclonal.
Fig. 3.

Patterns of cell dispersion after E9.5 infection are poor predictors of lineal relationships. Radial migration is the predominant mode of migration in the dorsomedial cortex as illustrated by serial coronal sections through the P21 cortex of an animal infected at E9.5. A–E show funnel-shaped clusters of infected neurons. These clusters of cells, when analyzed by PCR and sequencing, were always found to be polyclonal in origin. Radial columns of labeled neurons (F) that extend the width of the cortical plate were also observed in brains infected with low-titer viral supernatants. A column of 13 such neurons (within 120 μm of each other along the A-P axis) was analyzed by PCR and sequencing and found to contain multiple DNA tags. This indicated that the cells in this radial column were derived from at least 11 E9.5 progenitors (J, K).
To establish the number of distinct clonal lineages that contribute to a given radial cluster, we injected brains with 2 μl of an unconcentrated retroviral supernatant. Even at this low titer, radially oriented cells with neuronal morphology (Fig. 3F) were seen to span the width of the cortex over several sections. We performed an exhaustive lineal analysis on one such group of 13 cell somas (Fig. 3G–I). To our surprise, four of the seven cells that yielded an amplified PCR product produced a ladder on sequence analysis, indicating a polyclone (Fig. 3J). To determine the clonal complexity of the cluster, we subcloned the four polyclonal amplifying sequences using TA subcloning. Statistically, if each sample contained no more than four infected cells, by picking 25 colonies from each of the four groups of subcloned sequences we would have a very high probability of obtaining all of the available sequences from the subcloning. Figure 3K shows the sequencing results obtained from this experiment. PCR R6, which gave a single sequence on initial sequencing, was used as a control. All 25 colonies picked from PCR R6 yielded the identical sequence obtained initially [compare Fig 3, J (R6) and K (R6)]. PCRs R1 and R4 each gave two unique sequencing products, whereas PCRs R2 and R7 gave three sequence products each, one that was in common with each other and reaction R5. This indicates that at least 11 E9.5 progenitors gave rise to this single radial array of 13 cells in the dorsal cortex. Despite arising from almost entirely separate lineages, these cells use the same environmental cues to migrate in a tight radial cluster.
Regional identity of clonally related cells appears to be restricted early in neurogenesis
To further analyze the contribution of lineage to regional restrictions, we infected E9.5 mouse forebrains with 2 μl of CAP library supernatant at 325,000 pfu/ml. Embryos were allowed to develop until the third postnatal week, and PLAP-positive virally infected cells were then analyzed by PCR and sequence analysis to determine their lineal relationships. At this viral titer, ∼50% of injected brains had PLAP-positive cells. PLAP-positive cells were usually found in one or two tight clusters per brain, which rarely crossed anatomic regional boundaries. Thirty-two multicellular clones from 24 hemispheres were analyzed for this study. Of these, 11 clusters (34.4%) were neuronal clones, 15 clusters (46.9%) were glial clones, and 6 clusters (18.8%) were mixed neuronal–glial clones. The clone size ranged from 2 to 53 members (with an average of 10.3 cells/clone). Neuronal clones were on average smaller than glial or mixed clones (neuronal average, 4.3 cells/clone; glial average, 10.6 cells/clone; mixed average, 22.4 cells/clone).
The most extensive spread of cells was found in the cerebral cortex. Two large mixed neuronal–glial clones, clone 25 and clone 26 (Fig.4), were found to extend for great distances (3.6 and 5.4 mm, respectively) along the anteroposterior (A-P) axis of the cortex. Most of the neurons of these clones shared the same or adjacent laminar distribution (lamina 2/4) but were distributed widely in the in the dorsomedial and lateral cortex all along the A-P axis. Reid et al. (1995, 1997) have previously reported similar widely distributed cortical neuronal clones in both the rat and ferret. They have postulated that these clones may derive from a progenitor cell, which migrates tangentially within the cortical ventricular zone, and have found a striking pattern of periodicity to the clones analyzed. It is also possible that these clones are composed of the tangentially migrating populations of_dlx 1/2_-positive interneuron progenitors, which migrate dorsally from the ventral ganglionic eminences. The 2/4 laminar distribution and lateral-to-medial distribution would be consistent with such an interpretation. Conversely, our data suggest that interneurons and pyramidal cells may not be derived from entirely separate lineages by E9.5. For instance, clone 19 contains cells with morphologies that are consistent with the sibling cells being either pyramidal and nonpyramidal neurons. Nevertheless, the relatively low frequency at which we observe such clonal heterogeneity suggests that this may be more the exception than the rule.
Fig. 4.

A schematic illustration of two widely dispersed clones in the E9.5-P21 mouse cerebral cortex. The entire murine P21 forebrain is schematized in 12 coronal sections taken at intervals separated by ∼720 μm on the A-P axis. The positions of cells from two widely dispersed and mostly neuronal clones in the cerebral cortex from two separate brains are indicated by the_black_ (clone 25) or red (clone 26)geometric shapes (G). Each clone is designated by a different color, and each cell type is designated by a different geometric shape (square, neuron;filled circle, astrocyte; open circle, oligodendrocyte). These two mostly neuronal clones were distributed along the A-P axis for ∼3.6 mm (clone 25) and 5.4 mm (clone 26), respectively. Most of the cells in these clones were neurons with nonpyramidal morphology located in lamina 2/4 of the neocortex. Clone 25 was composed of 53 cells (43 neurons and 10 astrocytes). Clone 26 was composed of 45 nonpyramidal neurons and a single oligodendrocyte. Photomicrographs of alkaline phosphatase-stained cells in clone 26 are shown in A–F. The cells are typically of “stellate” interneuron morphology (B, D) and are positioned in the same lamina (C, E,F) throughout the cortex, consistent with these cells being interneurons.
Twenty-eight of 32 (87.1%) clones analyzed were found throughout all anatomic regions within the forebrain but were tightly clustered and regionally restricted. Cells within these clones generally remained within 40–240 μm of each other along the A-P axis. Increased clone size correlated with increased dispersion of the clone along the A-P axis.
Only four of the 32 clones analyzed in this study, clones 1, 9, 24, and 26, were seen to cross anatomically defined regional boundaries (Figs.4 and 5E,J). Two of these clones crossed dorsoventral (D-V) boundaries but remained rather tightly clustered in the A-P direction. Clone 1 (Fig. 5A–E) was a mixed neuronal–glial clone containing five members that spanned the septal–preoptic area boundary. Clone 24 (Fig.5G–J) was a nine member neuronal clone that spanned the striatal–entorhinal cortical anatomic boundary. The distribution of this clone followed the MMS migration pathway (see above) and may represent sibling cells that migrated within this pathway. Clones 9 (Fig. 5E) and 26 (Fig. 4) were a four cell neuronal clone and a 46 member mixed clone, respectively, that crossed the cortical–striatal boundary. These clones had a wider distribution along the A-P axis (360 and 5400 μm), and the dorsoventral extent of these clones was also larger than the other two crossing clones.
Fig. 5.
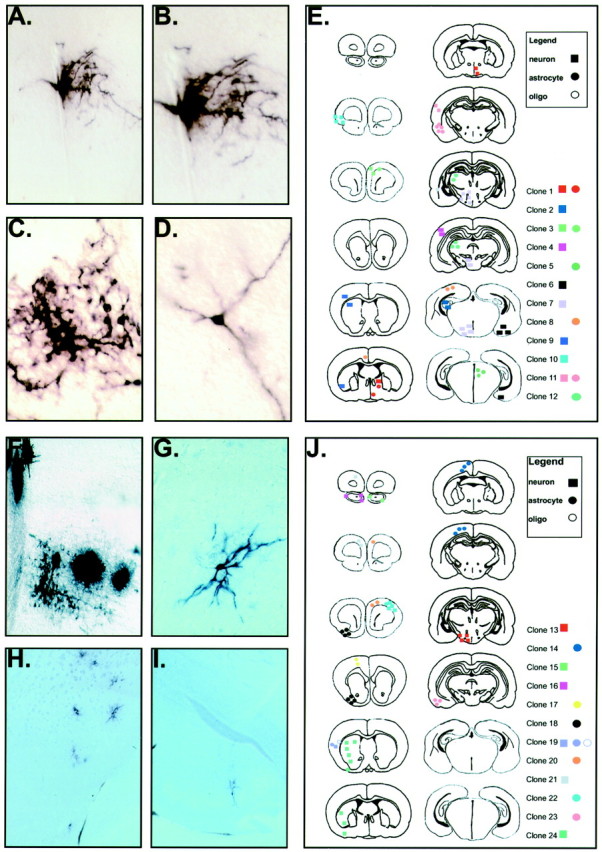
Most clones infected at E9.5 were found to be confined to discrete anatomical territories when analyzed at P21. The locations of two sets of 12 E9.5 infected forebrain clones are represented schematically on coronal sections taken through the P21 mouse forebrain at ∼720 μm intervals (E,J). Each clone is designated by a different color, and each cell type is designated by a different geometric shape (square, neuron; filled circle, astrocyte; open circle, oligodendrocyte). In 21 of the 24 clones (87.5%), all cells were found to be restricted to an anatomically distinct region of the forebrain. Clones 7 and 19 are representative of this class of regionally restricted clones. Clone 7 is a nine member neuronal clone found in the hypothalamus (A–D). Clone 19, a three member clone, is also anatomically restricted but is mixed in cell type, being composed of a neuron, an astrocyte, and an oligodendrocyte (F). Three clones (clones 1, 9, and 24) contain sibling cells that cross anatomic regional boundaries. Clone 1 is a five member mixed neuronal–astrocytic clone that crosses the boundary between the septum and preoptic area. Clone 9 is a four member neuronal clone that crosses the cortical–striatal boundary. Clone 24 (G–I) is a nine member neuronal clone that crosses the border between the striatum and the entorhinal cortex.
Large glial-restricted clones arise from progenitors in the E9.5 forebrain
Six of the 32 (18.8%) clones analyzed were picked from hemispheres in which all labeled cells had glial morphologies, suggesting that a population of glial progenitors might already be specified at the time of injection (E9.5) (Fig.6). Ten other glial-only clones were localized in hemispheres that also contained cells with neuronal morphologies. Because not every cell picked was successfully amplified and analyzed, we cannot be certain that these glial clones represent progeny from a glial-specified progenitor or mixed clones. Notably however, the six glial-specific clones differed from the majority of glial clones in both their size and distribution. These clones were larger on average (21.5 cells/clone vs 4.1 cells/clone) and had a larger distributional area in both the A-P and D-V axes. Nevertheless, even these glial clones remained restricted to a given anatomic region.
Fig. 6.

The E9.5 mouse forebrain contains a significant number of glial-specific clones. Six of 32 clones (18.8%) analyzed from E9.5 infected forebrains gave rise to glial-only clones at P21 (G). Each clone is designated by a different color, and each glial cell type is designated by a different geometric shape (filled circle, astrocyte;open circle, oligodendrocyte). Two of these clones were composed solely of astrocytes (A, B), two were mixed astrocytic–oligodendrocytic clones (D,E), and two were composed entirely of oligodendrocytes (E, F). All glial clones were found to be regionally restricted and on average had larger numbers of members (21.5 vs 4.1) and a wider cortical distribution (2400 vs 360 μm).
In summary, both dispersion and clonal lineage analysis of infected E9.5 forebrain progenitors suggest that regional specification is primarily restricted by the inception of neurogenesis in the forebrain. In addition, the observation of large glial-only clones derived from progenitors infected at E9.5 suggests that the forebrain neuroepithelium contains a heterogeneous set of progenitors from the onset of neurogenesis.
DISCUSSION
Three conclusions can be drawn from the present _in vivo_lineage analysis: (1) Patterns of migration strongly correlate with a progenitor's position of origin. (2) The regional identity of forebrain progenitors appears to be restricted early in neurogenesis. (3) A significant population of glially restricted clones appears to arise from E9.5 neural progenitors.
Patterns of migration
Radial and tangential migrations of neural progeny represent the two distinct modes of cellular dispersion in the forebrain (Rakic, 1977; Easter et al., 1985). Rakic (1988) postulated that the forebrain was intrinsically programmed to follow a protomap of development imposed in the VZ. This hypothesis was based on radial migration being the prevalent mode of cell dispersion used in early development. Our data, particularly in dorsomedial regions of the pallium, support this notion. Importantly, recent studies suggest that significant tangential migration also occurs within the telencephalon. Consistent with these studies, we observed populations of cells that apparently undergo tangential dispersion. The fact that radially and tangentially migrating cells ultimately migrate in close proximity suggests that these distinct populations must have a cell-autonomous way of distinguishing or interpreting specific guidance cues (O'Leary and Koester, 1993). Chimeric analysis suggests that this mode of migration is imprinted through cell lineage (Tan et al., 1998). Our data support this possibility by suggesting that mode of migration is best predicted by the region within the telencephalon from which a clone originates. This finding suggests that it is the local milieu surrounding progenitors that determines the pattern of dispersion of their progeny.
Most E9.5 progenitors are regionally restricted
Despite mounting evidence of widespread migration in the forebrain, the majority of the clones identified in this study (87.5%) were found to be regionally restricted. Recent work has shown that prosomere-restricted expression of a large number transcription factors is central in establishing both the anatomical divisions of the forebrain (Rubenstein et al., 1994, 1998; Shimamura et al., 1995, 1997;Rubenstein, 2000) and the generation of specific cell types (Anderson et al., 1997, 1999; Marin et al., 2000). Nevertheless, direct evidence that prosomeric boundaries act to restrict the dispersion of polyclones has been lacking. Indeed, recent evidence of large-scale tangential migrations of cells that transit across regional boundaries apparently belies the possibility that such regional restriction of progenitors could exist.
How then can the present data be reconciled with the mounting evidence for tangential migration across regional boundaries? One possibility comes from keeping in mind that our lineal analysis is retrospective. Our analysis is blind to whether a given clone originated within a given domain or later migrated into it. Perhaps all cells that migrate across regional boundaries are derived from lineally related cells that are programmed to migrate similarly. For instance, interneuronal cells derived from ventral progenitors may uniformly migrate dorsally into the cortex. Indeed, the distribution of the two largest clones seen in this study (clones 25 and 26) (Fig. 4) is consistent with this idea. In addition, work from Lavdas et al. (1999) has shown that Lhx6-positive cells appear to originate in the medial ganglionic eminence (MGE) but ultimately migrate to the cortex. Direct evidence for this idea has come from recent work by Wichterle et al. (2001), who used homotopic transplantation as a means of fate mapping MGE progenitors. In these experiments, virtually all MGE cells were found to end up in the cortex. Indeed, studies of interneurons (Anderson et al., 1997, 1999; Tamamaki et al., 1997; Marin et al., 2000; Wichterle et al., 2001) and oligodendrocytes (Spassky et al., 1998, 2000; Miller et al., 1999; Nery et al., 2001) suggest that directed migration may be widely used within the telencephalon.
Why would evolution select progenitors to be made in one anatomical location when they are ultimately fated to contribute to a distant location? It has been proposed by a number of groups, including our own (Nery et al., 2001), that the cues that determine regional fates may also be used to specify specific cell types. For instance, genetic evidence suggests that genes such as Shh (Nery et al., 2001) and the Dlx family of transcription factors (Anderson et al., 1997, 1999; Corbin et al., 2000) are required for the production of oligodendrocytes and interneurons, respectively. Although the role of these genes in establishing regional character obliges them to be restricted to ventral regions, their requirement for the induction of specific cell types is resolved through tangential migration.
One could imagine however that a common lineage could give rise to both the interneuron populations that migrate dorsally and those that remain in ventral regions. Our failure to find a significant number of clones that span regional boundaries argues that these populations are derived from distinct lineages. Together, this suggests that there may be a surprising level of progenitor heterogeneity within the germinal zones of the E9.5 telencephalon. Consistent with the existence of such heterogeneity, we found evidence of glial-restricted clones within the E9.5 forebrain.
Early glial specification
Birthdating studies and immunochemical studies have suggested that glial specification occurs subsequent to neuronal specification. Previous studies looking at glial markers have suggested that glial progenitors can be detected in the VZ and intermediate zone of the macaque brain (Levitt et al., 1981; Berman et al., 1997) early in neurogenesis. In addition, in vitro studies have shown that an E10 population of mouse cortical progenitors gives rise to glial clones, albeit at very low frequencies (Qian et al., 1998, 2000). Together, these findings suggest that some glial progenitors are specified early in neurogenesis.
We found that ∼10% of our clones contained only glia, which is considerably higher than the 1% of glial-restricted clones seen_in vitro_. The discrepancy between these results likely reflects the difference between normal cell fate and progenitor potential. Hence, although extrinsic cues in the in vivo_ventricular zone may act to constrain progenitor fate, the same progenitors when removed from this milieu show a broader potential_in vitro.
Although the molecular nature of glial specification in mammals is presently unclear, lateral (i.e., Notch–Delta) signaling has been suggested recently to play a role in glial specification. We have found (Gaiano et al., 2000) that the infection of E9.5 progenitors expressing an activated form of Notch promotes the formation of radial glia embryonically and results in astrocytic phenotypes postnatally. Similarly, Furukawa et al. (2000) and Morrison et al. (2000) have demonstrated that Notch signaling promotes the formation of Müller glia and Schwann cells, respectively. Given that the loss of cell contact (an obligate part of the culturing of progenitors_in vitro_) results by definition in a disruption in lateral signaling, this perhaps may underlie the difference between the_in vivo_ and in vitro findings.
It is curious that most of our glial-restricted clones were found in ventral telencephalic regions (all but one). An alternative possibility that we cannot rule out is that glial-restricted clones primarily arise in ventral telencephalic regions, accounting for the low frequency observed in the study by Qian et al. (2000), which was restricted to analysis of cortical progenitors.
E9.5 clone size
Chimeric analysis (Tan et al., 1998) has suggested that the average clone size in the E9.5 forebrain is significantly larger than we observed. Whereas our median clone size was ∼30 cells, these investigators estimated an average clone in the hundreds. Ostensibly, the major cause for our small clone size is that our estimates only represent the members of a clone that we successfully amplified and sequenced (∼40% of the cells expressing the PLAP reporter). To this we had to add cells that poorly expressed the reporter or underwent cell death. Finally, proviral insertion only occurs in one of the two daughter cells, resulting in our lineages being 50% smaller than they would be otherwise. Together, it comes as little surprise that our clonal estimates are far smaller than those suggested by Tan et al. (1998). Then there is the question of clonality in the study by Tan et al. (1998), which by definition cannot rule out that their putative clone size is not inflated by clustering errors resulting from the limited dispersion of polyclones. It seems likely that true median clone size in the E9.5 telencephalon falls somewhere between these estimates.
In summary, our findings revealed a number of unexpected aspects concerning the dispersion and fate restrictions seen in E9.5 progenitors. We found that infected neural progeny in close proximity and with similar patterns of migration often were derived from separate lineages. Nevertheless, a progenitor's position of origin proved to be highly predictive of the dispersal patterns of its resultant progeny. Most striking was our observation that the progeny of E9.5 progenitors appear to be primarily restricted to single regional territories in the mature brain, and that a subpopulation of progenitors are already restricted to producing only glial progeny by this age. Together, our data argue that extrinsic regional cues combine with and perhaps initiate intrinsic lineal restrictions in the developing forebrain.
Footnotes
This work was supported by National Institutes of Health Grant NS32993, by a Children's Brain Tumor Foundation Grant, and by a March of Dimes Basic Research Grant to G.F. We thank Muriel Rallu, Susana Nery, Michael Rutlin, Robert Machold, Nicholas Gaiano, and Joshua Corbin for critical reading of the manuscript. We also thank Connie Cepko, Shawn Fields-Berry, and Nicholas Gaiano for their reagents and for many helpful suggestions and discussions.
Correspondence should be addressed to Gord Fishell, Developmental Genetics Program and the Department of Cell Biology, The Skirball Institute of Biomolecular Medicine, New York University Medical Center, New York, NY 10016. E-mail: fishell@saturn.med.nyu.edu.
REFERENCES
- 1.Anderson SA, Eisenstat DD, Shi L, Rubenstein JL. Interneuron migration from basal forebrain to neocortex: dependence on Dlx genes. Science. 1997;278:474–476. doi: 10.1126/science.278.5337.474. [DOI] [PubMed] [Google Scholar]
- 2.Anderson S, Mione M, Yun K, Rubenstein JL. Differential origins of neocortical projection and local circuit neurons: role of Dlx genes in neocortical interneuronogenesis. Cereb Cortex. 1999;9:646–654. doi: 10.1093/cercor/9.6.646. [DOI] [PubMed] [Google Scholar]
- 3.Anderson SA, Marin O, Horn C, Jennings K, Rubenstein JL. Distinct cortical migrations from the medial and lateral ganglionic eminences. Development. 2001;128:353–363. doi: 10.1242/dev.128.3.353. [DOI] [PubMed] [Google Scholar]
- 4.Austin CP, Cepko CL. Cellular migration patterns in the developing mouse cerebral cortex. Development. 1990;110:713–732. doi: 10.1242/dev.110.3.713. [DOI] [PubMed] [Google Scholar]
- 5.Bayer SA, Altman J, Russo RJ, Dai XF, Simmons JA. Cell migration in the rat embryonic neocortex. J Comp Neurol. 1991;15:499–516. doi: 10.1002/cne.903070312. [DOI] [PubMed] [Google Scholar]
- 6.Berman NE, Johnson JK, Klein RM. Early generation of glia in the intermediate zone of the developing cerebral cortex. Brain Res Dev Brain Res. 1997;101:149–164. doi: 10.1016/s0165-3806(97)00060-6. [DOI] [PubMed] [Google Scholar]
- 7.Bhide PG. Cell cycle kinetics in the embryonic mouse corpus striatum. J Comp Neurol. 1996;374:506–522. doi: 10.1002/(SICI)1096-9861(19961028)374:4<506::AID-CNE3>3.0.CO;2-5. [DOI] [PubMed] [Google Scholar]
- 8.Cepko CL, Ryder E, Austin C, Golden J, Fields-Berry S, Lin J. Lineage analysis using retroviral vectors. Methods. 1998;14:393–406. doi: 10.1006/meth.1998.0594. [DOI] [PubMed] [Google Scholar]
- 9.Corbin J, Gaiano N, Machold RP, Langston A, Fishell G. Multiple defects in telencephalic development associated with the loss of Gsh2 homeodomain gene. Development. 2000;127:5007–5020. doi: 10.1242/dev.127.23.5007. [DOI] [PubMed] [Google Scholar]
- 10.Derer P. Comparative localization of Cajal-Retzius cells in the neocortex of normal and reeler mutant mice fetuses. Neurosci Lett. 1985;54:1–6. doi: 10.1016/s0304-3940(85)80109-9. [DOI] [PubMed] [Google Scholar]
- 11.Derer P, Derer M. Cajal-Retzius cell ontogenesis and death in mouse brain visualized with horseradish peroxidase and electron microscopy. Neuroscience. 1990;36:839–856. doi: 10.1016/0306-4522(90)90027-2. [DOI] [PubMed] [Google Scholar]
- 12.Easter SS, Jr, Purves D, Rakic P, Spitzer NC. The changing view of neural specificity. Science. 1985;230:507–511. doi: 10.1126/science.4048944. [DOI] [PubMed] [Google Scholar]
- 13.Fishell G, Mason CA, Hatten ME. Dispersion of neural progenitors within the germinal zones of the forebrain. Nature 362 1993. 636 638 [Erratum (1993) 363:286] [DOI] [PubMed] [Google Scholar]
- 14.Furukawa T, Mukherjee S, Bao ZZ, Morrow EM, Cepko CL. rax, Hes1, and notch1 promote the formation of Muller glia by postnatal retinal progenitor cells. Neuron. 2000;26:383–394. doi: 10.1016/s0896-6273(00)81171-x. [DOI] [PubMed] [Google Scholar]
- 15.Gaiano N, Kohtz JD, Turnbull DH, Fishell G. A method for rapid gain-of-function studies in the mouse embryonic nervous system. Nat Neurosci. 1999;2:812–819. doi: 10.1038/12186. [DOI] [PubMed] [Google Scholar]
- 16.Gaiano N, Nye JS, Fishell G. Radial glial identity is promoted by Notch1 signaling in the murine forebrain. Neuron. 2000;26:395–404. doi: 10.1016/s0896-6273(00)81172-1. [DOI] [PubMed] [Google Scholar]
- 17.Golden JA, Cepko CL. Clones in the chick diencephalon contain multiple cell types and siblings are widely dispersed. Development. 1996;122:65–78. doi: 10.1242/dev.122.1.65. [DOI] [PubMed] [Google Scholar]
- 18.Gonzalez JL, Russo CJ, Goldowitz D, Sweet HO, Davisson MT, Walsh CA. Birthdate and cell marker analysis of scrambler: a novel mutation affecting cortical development with a reeler-like phenotype. J Neurosci. 1997;17:9204–9211. doi: 10.1523/JNEUROSCI.17-23-09204.1997. [DOI] [PMC free article] [PubMed] [Google Scholar]
- 19.Halliday AL, Cepko CL. Generation and migration of cells in the developing striatum. Neuron. 1992;9:15–26. doi: 10.1016/0896-6273(92)90216-z. [DOI] [PubMed] [Google Scholar]
- 20.Hatten ME. Riding the glial monorail: a common mechanism for glial-guided neuronal migration in different regions of the developing mammalian brain. Trends Neurosci. 1990;13:179–184. doi: 10.1016/0166-2236(90)90044-b. [DOI] [PubMed] [Google Scholar]
- 21.Hatten ME. The role of migration in central nervous system neuronal development. Curr Opin Neurobiol. 1993;3:38–44. doi: 10.1016/0959-4388(93)90033-u. [DOI] [PubMed] [Google Scholar]
- 22.Hatten ME. Central nervous system neuronal migration. Annu Rev Neurosci. 1999;22:511–539. doi: 10.1146/annurev.neuro.22.1.511. [DOI] [PubMed] [Google Scholar]
- 23.Lavdas AA, Grigoriou M, Pachnis V, Parnavelas JG. The medial ganglionic eminence gives rise to a population of early neurons in the developing cerebral cortex. J Neurosci. 1999;19:7881–7888. doi: 10.1523/JNEUROSCI.19-18-07881.1999. [DOI] [PMC free article] [PubMed] [Google Scholar]
- 24.Levitt P, Cooper ML, Rakic P. Coexistence of neuronal and glial precursor cells in the cerebral ventricular zone of the fetal monkey: an ultrastructural immunoperoxidase analysis. J Neurosci. 1981;1:27–39. doi: 10.1523/JNEUROSCI.01-01-00027.1981. [DOI] [PMC free article] [PubMed] [Google Scholar]
- 25.Liu A, Joyner AL, Turnbull DH. Alteration of limb and brain patterning in early mouse embryos by ultrasound-guided injection of Shh-expressing cells. Mech Dev. 1998;75:107–115. doi: 10.1016/s0925-4773(98)00090-2. [DOI] [PubMed] [Google Scholar]
- 26.Lois C, Alvarez-Buylla A. Long-distance neuronal migration in the adult mammalian brain. Science. 1994;264:1145–1148. doi: 10.1126/science.8178174. [DOI] [PubMed] [Google Scholar]
- 27.Luskin MB. Restricted proliferation and migration of postnatally generated neurons derived from the forebrain subventricular zone. Neuron. 1993;11:173–189. doi: 10.1016/0896-6273(93)90281-u. [DOI] [PubMed] [Google Scholar]
- 28.Marin O, Anderson SA, Rubenstein JL. Origin and molecular specification of striatal interneurons. J Neurosci. 2000;20:6063–6076. doi: 10.1523/JNEUROSCI.20-16-06063.2000. [DOI] [PMC free article] [PubMed] [Google Scholar]
- 29.Marin-Padilla M. Cajal-Retzius cells and the development of the neocortex. Trends Neurosci. 1998;21:64–71. doi: 10.1016/s0166-2236(97)01164-8. [DOI] [PubMed] [Google Scholar]
- 30.Miller RH, Hayes JE, Dyer KL, Sussman CR. Mechanisms of oligodendrocyte commitment in the vertebrate CNS. Int J Dev Neurosci. 1999;17:753–763. doi: 10.1016/s0736-5748(99)00068-4. [DOI] [PubMed] [Google Scholar]
- 31.Mione MC, Danevic C, Boardman P, Harris B, Parnavelas JG. Lineage analysis reveals neurotransmitter (GABA or glutamate) but not calcium-binding protein homogeneity in clonally related cortical neurons. J Neurosci. 1994;14:107–123. doi: 10.1523/JNEUROSCI.14-01-00107.1994. [DOI] [PMC free article] [PubMed] [Google Scholar]
- 32.Mione MC, Cavanagh JFR, Harris B, Parnavelas JG. Cell fate specification and symmetrical/asymmetrical divisions in the developing cerebral cortex. J Neurosci. 1997;17:2018–2029. doi: 10.1523/JNEUROSCI.17-06-02018.1997. [DOI] [PMC free article] [PubMed] [Google Scholar]
- 33.Morrison SJ, Perez SE, Qiao Z, Verdi JM, Hicks C, Weinmaster G, Anderson DJ. Transient Notch activation initiates an irreversible switch from neurogenesis to gliogenesis by neural crest stem cells. Cell. 2000;101:499–510. doi: 10.1016/s0092-8674(00)80860-0. [DOI] [PubMed] [Google Scholar]
- 34.Nery S, Wichterle H, Fishell G. Sonic hedgehog contributes to oligodendrocyte specification in the mammalian telencephalon. Development. 2001;128:527–540. doi: 10.1242/dev.128.4.527. [DOI] [PubMed] [Google Scholar]
- 35.O'Leary DD, Koester SE. Development of projection neuron types, axon pathways, and patterned connections of the mammalian cortex. Neuron. 1993;10:991–1006. doi: 10.1016/0896-6273(93)90049-w. [DOI] [PubMed] [Google Scholar]
- 36.O'Rourke NA, Sullivan DP, Kaznowski CE, Jacobs AA, McConnell SK. Tangential migration of neurons in the developing cerebral cortex. Development. 1995;121:2165–2176. doi: 10.1242/dev.121.7.2165. [DOI] [PubMed] [Google Scholar]
- 37.Parnavelas JG, Barfield JA, Franke E, Luskin MB. Separate progenitor cells give rise to pyramidal and nonpyramidal neurons in the rat telencephalon. Cereb Cortex. 1991;1:463–468. doi: 10.1093/cercor/1.6.463. [DOI] [PubMed] [Google Scholar]
- 38.Parnavelas JG, Mione MC, Lavdas A. The cell lineage of neuronal subtypes in the mammalian cerebral cortex. Ciba Found Symp. 1995;193:41–70. doi: 10.1002/9780470514795.ch3. [DOI] [PubMed] [Google Scholar]
- 39.Puelles L, Kuwana E, Puelles E, Bulfone A, Shimamura K, Keleher J, Smiga S, Rubenstein JL. Pallial and subpallial derivatives in the embryonic chick and mouse telencephalon, traced by the expression of the genes Dlx-2, Emx-1, Nkx-2.1, Pax-6, and Tbr-1. J Comp Neurol. 2000;424:409–438. doi: 10.1002/1096-9861(20000828)424:3<409::aid-cne3>3.0.co;2-7. [DOI] [PubMed] [Google Scholar]
- 40.Qian X, Goderie SK, Shen Q, Stern JH, Temple S. Intrinsic programs of patterned cell lineages in isolated vertebrate CNS ventricular zone cells. Development. 1998;125:3143–3152. doi: 10.1242/dev.125.16.3143. [DOI] [PubMed] [Google Scholar]
- 41.Qian X, Shen Q, Goderie SK, He W, Capela A, Davis AA, Temple S. Timing of CNS cell generation: a programmed sequence of neuron and glial cell production from isolated murine cortical stem cells. Neuron. 2000;28:69–80. doi: 10.1016/s0896-6273(00)00086-6. [DOI] [PubMed] [Google Scholar]
- 42.Rakic P. Genesis of the dorsal lateral geniculate nucleus in the rhesus monkey: site and time of origin, kinetics of proliferation, routes of migration, and pattern of distribution of neurons. J Comp Neurol. 1977;176:23–52. doi: 10.1002/cne.901760103. [DOI] [PubMed] [Google Scholar]
- 43.Rakic P. Defects of neuronal migration and the pathogenesis of cortical malformations. Prog Brain Res. 1988;73:15–37. doi: 10.1016/s0079-6123(08)60494-x. [DOI] [PubMed] [Google Scholar]
- 44.Rakic P. Principles of neural cell migration. Experientia. 1990;46:882–891. doi: 10.1007/BF01939380. [DOI] [PubMed] [Google Scholar]
- 45.Reid CB, Liang I, Walsh C. Systematic widespread clonal organization in cerebral cortex. Neuron. 1995;15:299–310. doi: 10.1016/0896-6273(95)90035-7. [DOI] [PubMed] [Google Scholar]
- 46.Reid CB, Tavazoie SF, Walsh CA. Clonal dispersion and evidence for asymmetric cell division in ferret cortex. Development. 1997;124:2441–2450. doi: 10.1242/dev.124.12.2441. [DOI] [PubMed] [Google Scholar]
- 47.Rubenstein JL. Intrinsic and extrinsic control of cortical development. Novartis Found Symp 228 2000. 67 82, 109–113. [DOI] [PubMed] [Google Scholar]
- 48.Rubenstein JL, Martinez S, Shimamura K, Puelles L. The embryonic vertebrate forebrain: the prosomeric model. Science. 1994;266:578–580. doi: 10.1126/science.7939711. [DOI] [PubMed] [Google Scholar]
- 49.Rubenstein JL, Shimamura K, Martinez S, Puelles L. Regionalization of the prosencephalic neural plate. Annu Rev Neurosci. 1998;21:445–477. doi: 10.1146/annurev.neuro.21.1.445. [DOI] [PubMed] [Google Scholar]
- 50.Sheth AN, Bhide PG. Concurrent cellular output from two proliferative populations in the early embryonic mouse corpus striatum. J Comp Neurol. 1997;383:220–230. [PubMed] [Google Scholar]
- 51.Shimamura K, Hartigan DJ, Martinez S, Puelles L, Rubenstein JL. Longitudinal organization of the anterior neural plate and neural tube. Development. 1995;121:3923–3933. doi: 10.1242/dev.121.12.3923. [DOI] [PubMed] [Google Scholar]
- 52.Shimamura K, Martinez S, Puelles L, Rubenstein JL. Patterns of gene expression in the neural plate and neural tube subdivide the embryonic forebrain into transverse and longitudinal domains. Dev Neurosci. 1997;19:88–96. doi: 10.1159/000111190. [DOI] [PubMed] [Google Scholar]
- 53.Spassky N, Goujet-Zalc C, Parmantier E, Olivier C, Martinez S, Ivanova A, Ikenaka K, Macklin W, Cerruti I, Zalc B, Thomas JL. Multiple restricted origin of oligodendrocytes. J Neurosci. 1998;18:8331–8343. doi: 10.1523/JNEUROSCI.18-20-08331.1998. [DOI] [PMC free article] [PubMed] [Google Scholar]
- 54.Spassky N, Olivier C, Perez-Villegas E, Goujet-Zalc C, Martinez S, Thomas J, Zalc B. Single or multiple oligodendroglial lineages: a controversy. Glia. 2000;29:143–148. [PubMed] [Google Scholar]
- 55.Stoykova A, Treichel D, Hallonet M, Gruss P. Pax6 modulates the dorsoventral patterning of the mammalian telencephalon. J Neurosci. 2000;20:8042–8050. doi: 10.1523/JNEUROSCI.20-21-08042.2000. [DOI] [PMC free article] [PubMed] [Google Scholar]
- 56.Szele FG, Cepko CL. A subset of clones in the chick telencephalon arranged in rostrocaudal arrays. Curr Biol. 1996;6:1685–1690. doi: 10.1016/s0960-9822(02)70793-8. [DOI] [PubMed] [Google Scholar]
- 57.Szele FG, Cepko CL. The dispersion of clonally related cells in the developing chick telencephalon. Dev Biol. 1998;195:100–113. doi: 10.1006/dbio.1997.8725. [DOI] [PubMed] [Google Scholar]
- 58.Takahashi T, Nowakowski RS, Caviness VS., Jr Mode of cell proliferation in the developing mouse neocortex. Proc Natl Acad Sci USA. 1994;91:375–379. doi: 10.1073/pnas.91.1.375. [DOI] [PMC free article] [PubMed] [Google Scholar]
- 59.Tamamaki N, Fujimori KE, Takauji R. Origin and route of tangentially migrating neurons in the developing neocortical intermediate zone. J Neurosci. 1997;17:8313–8323. doi: 10.1523/JNEUROSCI.17-21-08313.1997. [DOI] [PMC free article] [PubMed] [Google Scholar]
- 60.Tan SS, Breen S. Radial mosaicism and tangential cell dispersion both contribute to mouse neocortical development. Nature. 1993;362:638–640. doi: 10.1038/362638a0. [DOI] [PubMed] [Google Scholar]
- 61.Tan SS, Kalloniatis M, Sturm K, Tam PP, Reese BE, Faulkner-Jones B. Separate progenitors for radial and tangential cell dispersion during development of the cerebral neocortex. Neuron. 1998;21:295–304. doi: 10.1016/s0896-6273(00)80539-5. [DOI] [PubMed] [Google Scholar]
- 62.Walsh C, Cepko CL. Clonally related cortical cells show several migration patterns. Science. 1988;241:1342–1345. doi: 10.1126/science.3137660. [DOI] [PubMed] [Google Scholar]
- 63.Walsh C, Cepko CL. Cell lineage and cell migration in the developing cerebral cortex. Experientia. 1990;46:940–947. doi: 10.1007/BF01939387. [DOI] [PubMed] [Google Scholar]
- 64.Walsh C, Cepko CL. Widespread dispersion of neuronal clones across functional regions of the cerebral cortex. Science. 1992;255:434–440. doi: 10.1126/science.1734520. [DOI] [PubMed] [Google Scholar]
- 65.Walsh C, Cepko CL. Clonal dispersion in proliferative layers of developing cerebral cortex. Nature. 1993;362:632–635. doi: 10.1038/362632a0. [DOI] [PubMed] [Google Scholar]
- 66.Ware ML, Tavazoie SF, Reid CB, Walsh CA. Coexistence of widespread clones and large radial clones in early embryonic ferret cortex. Cereb Cortex. 1999;9:636–645. doi: 10.1093/cercor/9.6.636. [DOI] [PubMed] [Google Scholar]
- 67.Wichterle H, Turnbull D, Nery S, Fishell G, Alvarez-Buylla A (2001) Distinct migratory pathways of neuronal precursors originating in medial and lateral ganglionic eminences revealed by in vivo fate map analysis. Development, in press. [DOI] [PubMed]