Spine Formation and Correlated Assembly of Presynaptic and Postsynaptic Molecules (original) (raw)
Abstract
Hippocampal pyramidal neurons in culture showed a developmental shift in synapse distribution from dendritic shafts to spines. Using dual wavelength time-lapse fluorescence microscopy, we analyzed the morphogenesis of three synaptic components: dendritic spines, postsynaptic densities (PSDs), and presynaptic vesicles. Local assembly of a major PSD protein, PSD-95, was spatially and temporally correlated with spine morphogenesis. Clustering of postsynaptic PSD-95 and that of a predominant synaptic vesicle protein, synaptophysin, were also correlated. In contrast, pre-existing PSD-95 clusters in dendritic shafts were preferentially eliminated without promoting spine formation. The local and stepwise assembly of synaptic components at the contact sites between dendritic protrusions and axons explains the developmental remodeling of excitatory synapses.
Keywords: synaptogenesis, dendritic spines, postsynaptic density, green fluorescent protein, fluorescence microscopy, hippocampus
Development of CNS synapses in vivo follows a stereotyped pattern that takes place gradually on a time scale of days to weeks (Schwartz et al., 1968; Harris et al., 1992; Fiala et al., 1998). Gradual changes in the molecular composition of synapses in culture have been reported and are consistent with the_in vivo_ observation (Fletcher et al., 1991; Papa et al., 1995; O'Brien et al., 1997; Rao and Craig, 1997; Rao et al., 1998). In contrast, real time imaging of living neurons provided evidence of rapid alterations of synapse morphology. Rapid transport of preassembled packets of presynaptic components (Ahmari et al., 2000) and continual remodeling of postsynaptic density (PSD) on a time scale of hours (Okabe et al., 1999b) were observed. Dendritic filopodia–spines were shown to be highly dynamic (Dailey and Smith, 1996; Ziv and Smith, 1996; Lendvai et al., 2000), and a correlation between morphological change and synapse activity was reported (Engert and Bonhoeffer, 1999; Maletic-Savatic et al., 1999;Toni et al., 1999). Furthermore, a recent experiment using functional imaging of presynaptic sites and retrospective immunocytochemistry revealed that assembly of both presynaptic and postsynaptic components occurred within 1–2 hr after initial contact (Friedman et al., 2000). Rapid alterations in individual synapses should be integrated into slow functional modulations of the neuronal network. However, very little is known about the molecular mechanisms that underlie this developmental process.
Development of excitatory synapses in the hippocampal pyramidal neurons has been studied extensively. In the first postnatal week, half of the synapses were made on dendritic shafts, and there was a transition from shaft synapses to spine synapses in the second postnatal week (Schwartz et al., 1968; Harris et al., 1992). Live cell imaging experiments revealed the presence of numerous dendritic filopodia during the early stage of development (Dailey and Smith, 1996; Ziv and Smith, 1996). Their highly motile behavior suggested a possible involvement of this structure in the initial contact between dendrites and axons (Ziv and Smith, 1996). The formation of synaptic contacts via filopodia in vivo was confirmed by electron microscopy (Fiala et al., 1998). These results suggest a possible link between gradual transition of synaptic distribution and morphological changes of dendritic protrusions. However, it is not yet clear whether filopodial formation is directly involved in the successive appearance of mature spines.
Molecular composition of signaling molecules and scaffold protein in the synapse is precisely regulated and thus underlies its functional modulation (Kennedy, 1998; Kim and Huganir, 1999; Sheng and Pak, 1999). Thus, real-time imaging of synaptic molecules should provide indispensable information on the synaptic function. Here we performed dual wavelength time-lapse fluorescence microscopy of hippocampal neurons expressing both presynaptic and postsynaptic proteins tagged with wavelength-variants of green fluorescent protein (GFP). This technique revealed the local and stepwise assembly of synaptic components at contact sites between filopodia–spines and the axon. These observations explain the translocation of excitatory synaptic junctions from dendritic shafts to spines in developing hippocampal pyramidal neurons.
MATERIALS AND METHODS
Generation of PSD-95-YFP, synaptophysin–CFP constructs, and adenovirus. The GFP coding region of the PSD-95-GFP construct (Okabe et al., 1999b) was replaced with the coding region of a yellow-emitting mutant of GFP (YFP), isolated from pEYFP-N1 vector (Clontech, Palo Alto, CA) to generate PSD-95 C-terminally labeled with YFP (PSD-95-YFP). Rat synaptophysin cDNA was cloned by PCR, and the whole cDNA sequence was confirmed to encode amino acid sequences identical to those published (Leube et al., 1987). The coding region of a cyan-emitting mutant of GFP (CFP) was isolated from pECFP vector (Clontech) and was fused in frame to the synaptophysin coding region to generate synaptophysin C-terminally labeled with CFP (synaptophysin–CFP). Construction of the replication-deficient adenovirus was performed as described previously (Kanegae et al., 1994,1995; Miyake et al., 1996). Recombinant adenovirus expressing PSD-95-YFP has an insertion of the PSD-95-YFP expression unit, which contains a PSD-95-YFP coding region under the control of a CAG promoter (Niwa et al., 1991), together with the rabbit β-globin polyadenylation signal. Recombinant adenovirus expressing CFP has a structure similar to PSD-95-YFP adenovirus, having a replacement of a PSD-95-YFP coding region with a CFP coding region. Recombinant adenovirus expressing synaptophysin–CFP has a cytomegalovirus promoter cassette instead of a CAG promoter.
Hippocampal cultures. Hippocampal cultures from 17-d-old embryonic mice were prepared as described (Okabe et al., 1998,1999a,b). Cells were maintained in MEM medium plus 2% B27 supplement (Life Technologies, Grand Island, NY) and 5% FCS. Neurons were plated onto glass coverslips attached to the bottom of dishes with holes of 10 mm diameter. An aliquot of 10 μm cytosine β-d-arabinofuranoside was added 2 d after plating to inhibit proliferation of non-neuronal cells. The Animal Use Committee of the National Institute of Bioscience and Human Technology approved all animal experiments.
Immunocytochemistry. Cells were fixed in 2% paraformaldehyde in PBS for 30 min or with methanol for 10 min at −20°C. After treatment with 0.1–0.2% Triton X-100 in PBS for 5–10 min, cells were blocked with 5% FCS and incubated with primary antibodies. The first antibodies were visualized by secondary antibody staining using goat anti-mouse or rabbit IgG conjugated to Cy3 (Jackson ImmunoResearch, West Grove, PA). Primary antibodies used in this study included mouse monoclonal antibody to synaptophysin (Boehringer Mannheim, Indianapolis, IN), rabbit polyclonal antibody to synaptophysin (Zymed, San Francisco, CA), rabbit polyclonal antibody to synapsin I (Chemicon, Temecula, CA), mouse monoclonal antibody to PSD-95 (Affinity Bioreagents, Golden, CO), mouse monoclonal antibody to MAP2 (Sigma, St. Louis, MO), and mouse monoclonal antibody to GluR2 (Chemicon). DiI labeling of neurons was done as previously described (Papa et al., 1995).
Adenovirus infection. Day 9–16 hippocampal cultures were exposed for 60 min to viruses at a multiplicity of infection of 100. Cells were then washed, reincubated in the previously removed media, and after 48–96 hr, assayed by fluorescence microscopy. Pilot immunoblot experiments showed that the expression of PSD-95-GFP, PSD-95-YFP, and synaptophysin–CFP became maximal 2 d after infection. Cells remained viable for at least 7 d after infection.
Microscopy. Live cells were mounted in a chamber at 37°C with a continuous flow of humidified 5% CO2 to maintain the pH of the medium. Images were obtained on a Zeiss Axiovert microscope equipped with a Micromax CCD camera (Roper Scientific, Trenton, NJ). A 100× oil-immersion lens (PlanNeofluar; numerical aperture 1.3; Carl Zeiss, Jena, Germany) was used to project images to the camera without an intermediate projection lens. In this configuration, a single pixel corresponded to a 66 nm square in the specimen plane. All data were collected at 1300 × 1030 resolution at 12 bits/pixel. Metamorph software (Universal Imaging, West Chester, PA) was used to control mechanical shutters, filter wheels, and_z_-axis controller. Filter sets for CFP and YFP fluorescence (XF114 and XF104; Omega Optical, Brattleboro, VT) gave similar fluorescence intensities with the identical settings of a 50 W mercury lamp. Two to four Z-sections with spacing of 1 μm were obtained with the aid of a _z_-axis controller at each time point to ensure that fluorescent clusters of PSD-95-YFP and synaptophysin–CFP did not escape from the focal plane of the lens. To reduce phototoxicity, a 50 W mercury lamp was attenuated 10- to 20-fold to illuminate samples, and an electric shutter was used to limit exposure time to <1 sec. No medium change was performed to minimize possible cell damage during recording. For the experiments involving recording from the same neurons after immunocytochemistry, the cells were identified with the aid of DIC images taken at high magnification, phase contrast images taken at low-magnification, and the _x–y_ coordinates read from the _x–y_ axis step controller. Images of CFP fluorescence and YFP fluorescence and DIC images were obtained every 10 or 20 min. Background fluorescence intensity and the maximal fluorescence intensity were measured for every image, and the degree of photobleaching was assessed. Specimens that showed >10% of reduction of initial fluorescence intensity were discarded. The moment when a fluorescent cluster was first detected in time-lapse fluorescence images was considered to be the birth time of the cluster. Therefore a time resolution of this study does not exceed the sampling interval of 10–20 min. This relatively long time interval was necessary to extend observation period up to 14 hr.
Data analysis. Digital images were analyzed using Metamorph software or IPLab software (Scanalytics, Fairfax, VA). Identification and matching of PSD-95 clusters and synaptophysin clusters were similar to the previously described methods (Okabe et al., 1999b). Correction of the image shift in x–y plane was done by comparing differential interference contrast (DIC) images through CFP and YFP filter sets. Identical settings of alignment were applied to the CFP and YFP fluorescence images. Procedures for matching fluorescent clusters were done after converting original image sets to binary images. PSD-95-YFP clusters and GluR2 immunoreactivity were considered matched when the PSD-95-YFP clusters shared more than half of their pixels with GluR2-immunopositive regions. For the matching of PSD-95-YFP clusters and synaptophysin immunoreactivity, two clusters were judged to be associated if one or more pixels of two clusters overlapped. The less strict criteria applied to match synaptophysin clusters were based on the electron microscopic observations that the distance between the PSD and the center of aggregations of synaptic vesicles was ∼250 nm, corresponding to 4 pixels in our imaging system. Similar criteria were also applied to the analysis of PSD-95-YFP and synaptophysin–CFP image sets.
Analysis of filopodia–spine size and PSD-95 cluster size was performed using Metamorph software. As an index of the volume of filopodia–spines and PSD-95 clusters, we measured two-dimensional areas of these structures in the image plane. Clearly evident protrusions from dendritic shafts <10 μm in length were included for the analysis. Filopodia–spine outlines and PSD-95 cluster outlines were determined by thresholding and converting original images to binary images. Error bars in figures represent the SEM.
For the simulation of the distribution of PSD-95 cluster area, two models were analyzed. First model is based on the assumption that the size of PSD-95 clusters is proportional to the size of spines. In this case, linear regression line was calculated (y = 0.448_x_; r = 0.407) from the experimental data, and both mean and SD were scaled using this linear regression line at specific values of the spine area (0.25, 0.5, 1.0, and 2.0 μm2). Second model is based on the assumption that the distribution of PSD-95 cluster size is independent of the spine size. This assumption allowed us to apply single value of mean and SD to different spine sizes. Random numbers with normal distribution were generated (http://ebook.stat.ucla.edu/calculators/cdf) and plotted using Origin 4.1 (Microcal Software, Northampton, MA).
RESULTS
Developmental shift of PSD-95 localization in dendrites
Morphological analyses of hippocampal pyramidal neurons have shown a translocation of synapses from dendritic shafts to spines during postnatal development (Schwartz et al., 1968; Harris et al., 1992). This translocation is associated with a disappearance of thin filopodia and an increase of spines with bulbous heads. To determine whether a similar translocation takes place in cultured hippocampal neurons, we analyzed localization of PSDs in dendrites, together with morphology of dendritic protrusions (Fig. 1). In the first set of experiments, PSD localization was detected by PSD-95 tagged with GFP. We have shown PSD-95-GFP to be a reliable marker for PSDs (Okabe et al., 1999b). We expressed PSD-95-GFP using recombinant adenoviruses and applied the lipophilic dye, DiI, to somata of pyramidal-shaped neurons after fixation. Using this method, we compared the dendritic morphology of young [11 d in vitro (11 DIV)] and mature [18 d in vitro (18 DIV)] neurons (Fig.1a–d). The 11 DIV neurons had numerous thin protrusions. However, most of the PSD-95-GFP clusters were localized to dendritic shafts with no spatial relationship to filopodia-like protrusions. In contrast, 18 DIV neurons had fewer thin protrusions and showed a higher density of spine-like protrusions with bulbous heads (Fig.1i). There was an extensive colocalization of PSD-95-GFP clusters with these spine-like protrusions. Shaft clusters of PSD-95-GFP were fewer in 18 DIV neurons.
Fig. 1.
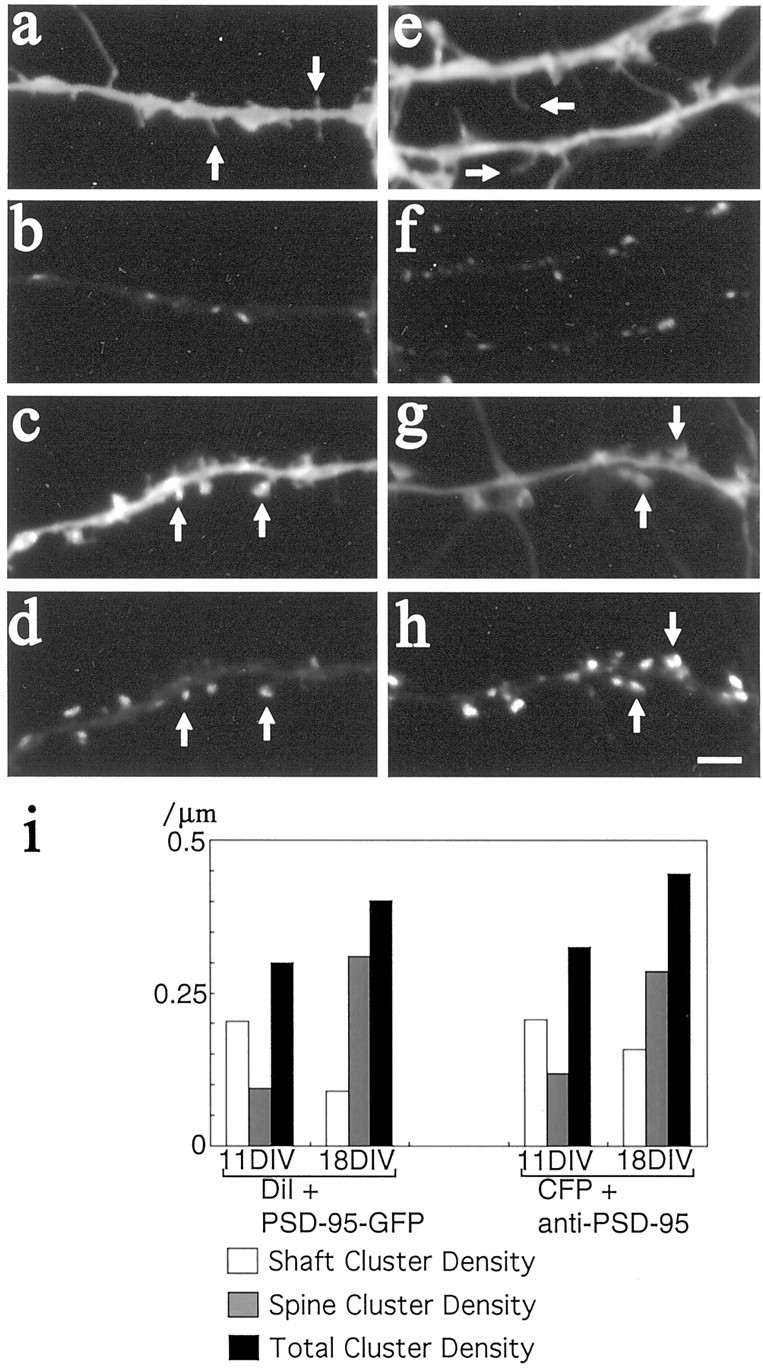
Developmental translocation of PSD-95 cluster localization from dendritic shafts to spines. a, b, An 11 DIV neuron expressing PSD-95-GFP. PSD-95 clusters visualized by GFP fluorescence localized to dendritic shafts (b). Distribution of thin filopodia-like protrusions (arrows_in a) visualized by application of DiI did not correlate with PSD-95 clusters. c, d, An 18 DIV neuron expressing PSD-95-GFP (d). DiI staining revealed dendrites with numerous spine-like protrusions (arrows in_c), and these protrusions showed colocalization with PSD-95 clusters (arrows in d). e, f, An 11 DIV neuron expressing CFP. CFP fluorescence revealed thin, filopodia-like protrusions (arrows in_e_). Anti-PSD-95 staining revealed shaft clusters of PSD-95 (f). g, h, An 18 DIV neuron expressing CFP. Spine-like protrusions, which were visualized by CFP fluorescence (arrows in g), reacted with anti-PSD-95 antibody (arrows in h). Scale bar, 3 μm. i, Average cluster density of PSD-95 along dendrites at two different time points. Images of 10 typical pyramidal neurons from two independent culture preparations were recorded, and the density of either PSD-95-GFP clusters or PSD-95-immunoreactive puncta was measured.
As a second set of experiments, localization of endogenous PSD-95 was detected with anti-PSD-95 antibody (Fig. 1e–h). By using recombinant adenoviruses, a CFP was expressed in pyramidal neurons to record dendritic morphology. CFP fluorescence revealed both thin, filopodia-like protrusions and thick, spine-like protrusions. However, the distinction between these two types of protrusions was not unambiguous in a single CFP image, therefore we refer to both thin and spine-like protrusions as filopodia–spines in the following description. The distribution of endogenous PSD-95 clusters in CFP-expressing neurons was visualized by retrospective immunocytochemistry. Comparison of CFP fluorescence and anti-PSD-95 staining revealed a similar shift of the localization of PSD-95 clusters from dendritic shafts to filopodia–spines (Fig.1i). Shaft clusters of PSD-95 in 11 DIV neurons were in close contact with synaptophysin immunoreactivity (data not shown). This indicates that shaft clusters on immature dendrites have already been in contact with presynaptic boutons. These morphological analyses indicate that synaptic contact sites, including PSDs and presynaptic vesicles, change their localization from dendritic shafts to spines in cultured hippocampal neurons. The observed translocation of synapses is consistent with the in vivo data.
It has been reported recently that 5- to 10-fold overexpression of PSD-95 in hippocampal neurons can induce synaptic maturation (El-Husseini et al., 2000). To test possible effects of PSD-95-GFP overexpression in our culture system, we compared the density of AMPA receptor subunit GluR2 clusters between PSD-95-GFP-positive and -negative neurons. The density of GluR2-immunopositive clusters along the dendritic shaft was not different 2 d after infection of the recombinant adenoviruses [control, 0.24 ± 0.031/μm; PSD-95-GFP, 0.22 ± 0.033/μm (mean ± SEM) in 15 DIV neurons]. We also compared the density of protrusions between PSD-95-GFP-positive and -negative neurons stained with lipophilic dye DiI. Expression of PSD-95-GFP did not alter the density of filopodia–spines [control, 0.35 ± 0.025/μm; PSD-95-GFP, 0.32 ± 0.030/μm (mean ± SEM) in 18 DIV neurons]. Furthermore, densities of PSD-95 clusters were similar in infected and control neurons (Fig. 1i). Absence of synaptogenic effect of exogenous PSD-95 in our system can be attributed to either low level of PSD-95-GFP expression in our system (<50% increase of the total PSD-95 protein) or shorter period of gene expression (<72 hr) (Okabe et al., 1999b).
De novo formation of PSD-95 clusters within dendritic filopodia–spines
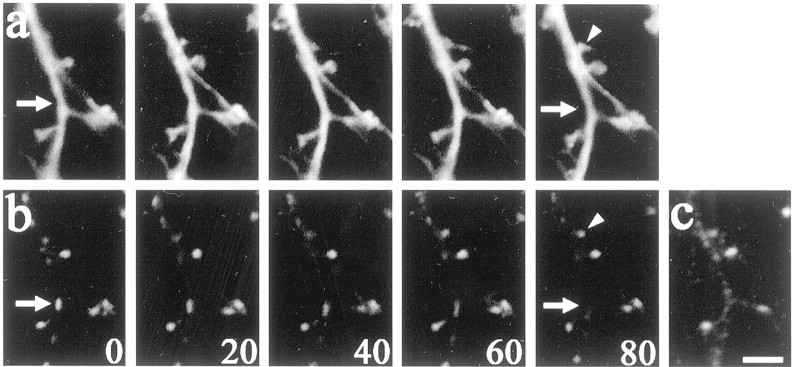
Using the culture system of hippocampal neurons as a model of synapse remodeling, we focused on the correlation among morphological features in living neurons. We visualized both spine morphology and PSD-95 localization using dual wavelength time-lapse fluorescence microscopy. Neurons infected with recombinant adenoviruses at 10–16 d of culture showed expression of both CFP and PSD-95-YFP, a fusion protein between PSD-95 and YFP. Images of neurons at 12–18 d of culture were obtained through CFP and YFP filter sets every 10–20 min for 1–14 hr. CFP fluorescence revealed numerous protrusions from dendritic shafts (Fig. 2). Both thin, filopodia-like protrusions and thick, spine-like protrusions were observed. In general, filopodia-like protrusions showed higher rates of extension and retraction and did not contain PSD-95 clusters (Fig. 2,arrows). Spine-like protrusions containing PSD-95 clusters were less motile. Quantitative analysis of the spine size from the data of time-lapse imaging revealed that the lengths of PSD-95-positive and -negative protrusions were similar, but the mean area size of PSD-95-positive protrusions was larger than that of PSD-95-negative ones (Fig. 3a,b). This suggests that PSD-95-positive protrusions have larger diameters and/or larger spine heads. To reveal correlation among the size of protrusion, presence of PSD-95 clusters and motility, we calculated mean length change of each protrusion and plotted this value against the maximal area size (Fig. 3c). The result indicates that the PSD-95-positive and -negative protrusions form distinct clusters with distinct size and motility.
Fig. 2.
Extension and retraction of thin filopodia-like protrusions in a 16 DIV neuron. a, Time-lapse imaging of CFP fluorescence of dendritic segments. Time stamps are shown in minutes in the bottom right corners. The gray scale of the images was inverted to present structural detail. Motile behavior of thin protrusions was prominent (arrows), whereas large spine-like protrusions were stable throughout the observation (arrowhead). b, Localization of PSD-95-YFP clusters at t = 120 min. A PSD-95 cluster was associated with a large, quiescent spine (arrowhead). Scale bar, 3 μm.
Fig. 3.
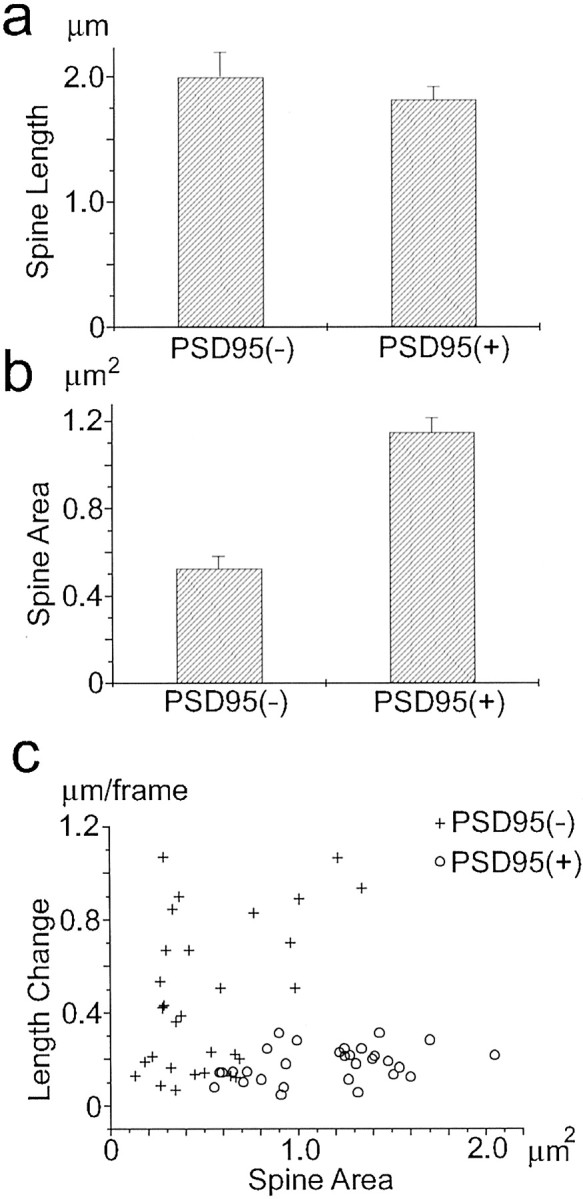
Morphology of filopodia–spines and their dynamics. a, b, Maximal lengths and areas of filopodia–spines during the time-lapse imaging (total period = 3 hr) were measured for both PSD-95-YFP cluster positive and negative protrusions (n = 30 from three independent experiments). c, Relationship between the area and the mean length change of filopodia–spines. Differences of filopodia–spine length between two adjacent time points (20 min intervals) were measured (total 3 hr period), and the mean length change was calculated. PSD-95-YFP-positive filopodia–spines show larger spine area and lower dynamics.
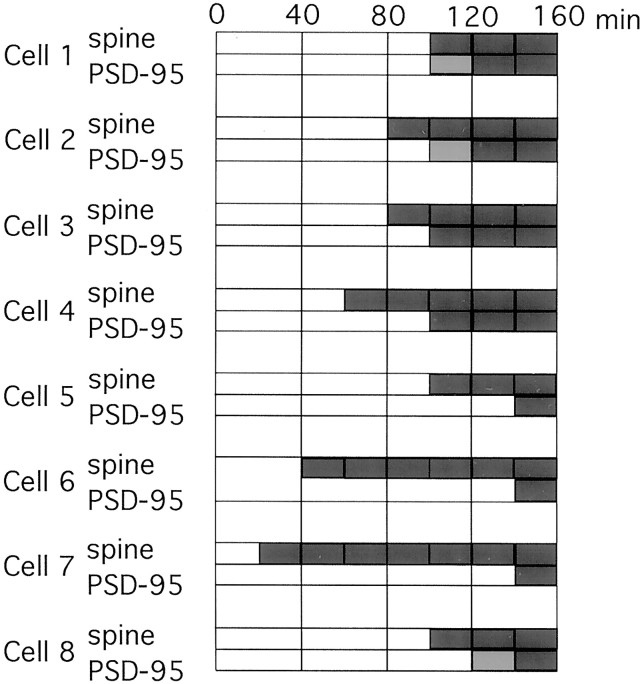
Time-lapse observations revealed accumulation of PSD-95-YFP in newly established or pre-existing filopodia–spines (Fig.4). We observed 34 dendritic fields from 34 culture dishes, and the fields contained 517 PSD-95 clusters in total. Twenty-nine new PSD-95 clusters appeared, and 14 pre-existing clusters disappeared in these experimental runs. None of the PSD-95 clusters within dendritic shafts induced the formation of filopodia–spines. In contrast, 89.7% of newly generated PSD-95 clusters were localized to filopodia–spines (26 of 29 clusters). In eight observations, both filopodia–spine morphogenesis and PSD-95 assembly were identified (Fig. 4a–d). In the rest of the observations (18 cases), PSD-95 clusters formed within pre-existing filopodia–spines (Fig. 4e–g). Elapsed time from filopodia–spine formation to PSD-95 assembly varied from 0 to 150 min, with an average of 45 min (Fig. 5). These results indicate that the assembly of a major component of PSD structure follows the protrusion of dendritic filopodia–spines.
Fig. 4.
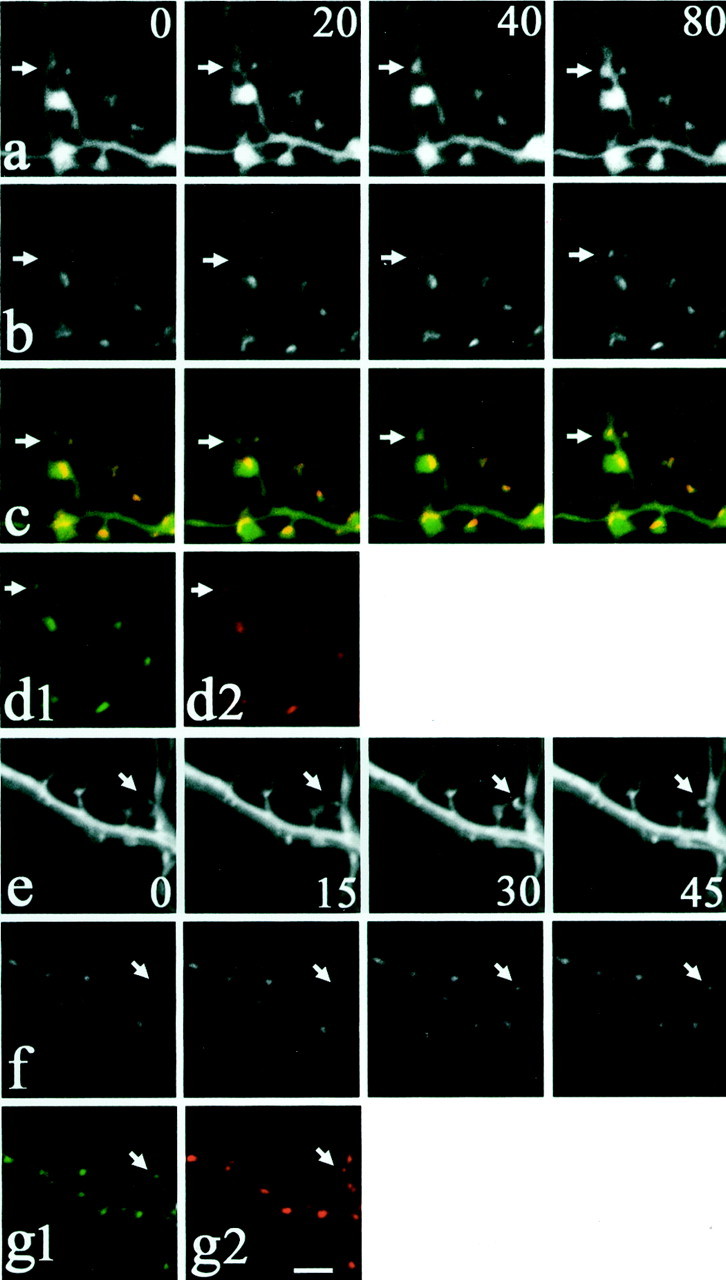
Simultaneous detection of dendritic morphology and PSD-95 localization. a–d, Time-lapse images of CFP fluorescence and PSD-95-YFP fluorescence combined with retrospective immunofluorescence using anti-GluR2 antibody.a, Time-lapse images of CFP fluorescence of a distal dendrite. Time stamps are shown in minutes in the top right corners. A horizontally running dendrite contacts a vertically running axon in this time sequence. At t = 0, distal tip of the dendrite has not yet contacted the vertical axon. At_t_ = 20 min, an axodendritic contact was established, and this followed the increase in the postsynaptic cytoplasm with time (arrows). b,Time-lapse images of PSD-95-YFP clusters. At t = 0, there was no PSD-95 cluster at the axodendritic contact site. Gradual assembly of a PSD-95 cluster was observed from 40 to 80 min (arrows). c, Superposition of images_a and b, illustrating the relationship between PSD-95 clusters (red) and filopodia–spine structure (green). d, Distribution of GluR2 subunit in a newly generated spine. The specimen was fixed at_t = 90 min and reacted with anti-GluR2 antibody (d2: red). The newly generated PSD-95-YFP cluster (d1:green) and a GluR2-immunoreactive spot were associated (arrows). e–g, Time-lapse fluorescence microscopy of CFP fluorescence and PSD-95-YFP combined with retrospective immunofluorescence of synaptophysin. _e,Time-lapse images of CFP fluorescence of a dendritic shaft. Time stamps are shown in minutes in the bottom right corners. A gradual increase in the size of a preexisting protrusion was observed (arrows). f, Time-lapse images of PSD-95-YFP clusters. Assembly of a PSD-95 cluster took place within a pre- -existing dendritic protrusion (arrows).g, Retrospective immunocytochemistry with anti-synaptophysin antibody. The specimen was fixed at_t = 90 min and reacted with anti-synaptophysin antibody (g2: red). The newly generated PSD-95-YFP cluster (g1: green) was associated with a synaptophysin-immunopositive bouton (arrows). Scale bar,a–c, e–g, 3 μm; d, 4 μm.
Fig. 5.
Temporal order of cluster formation of PSD-95 and spine morphogenesis. We could identify eight events of PSD-95 cluster formation at the sites of newly generated filopodia–spines. The presence of unambiguous clusters was indicated by dark gray rectangles. _Light gray rectangles_indicate the presence of fluorescent signals within 150% of the background fluorescence signal at the location of future unambiguous clusters.
To reveal the time course of assembly of presynaptic and postsynaptic components to the sites of newly generated PSD-95 clusters, specimens were rapidly fixed and reacted with antibodies against either the AMPA receptor subunit GluR2 (n = 17), a marker of postsynaptic glutamate receptors, or synaptophysin (n = 10), a marker of presynaptic vesicles. The time elapsed between cluster formation and fixation varied from 30 to 235 min with an average of 87.1 (±42.2) min for GluR2 immunocytochemistry. In all, 82.4% of newly generated PSD-95 clusters (14 of 17 clusters) were associated with AMPA receptor clusters (Fig. 4d). This fraction was much larger than the fraction of total PSD-95 clusters associated with GluR2 (58.1%; 207 of 356 clusters). Retrospective immunocytochemistry with anti-synaptophysin revealed that all newly generated PSD-95 clusters (10 of 10 clusters) were associated with synaptophysin-positive boutons (Fig. 4g). The elapsed time from cluster formation to fixation varied from 40 to 115 min with an average of 62.0 min (±21.5 min). The correlation between PSD-95 clusters and synaptophysin immunoreactivity was high in the population of total PSD-95 clusters (87.6%; 141 of 161 clusters). These results indicate that the assembly of PSD-95-containing postsynaptic structures is highly correlated with the accumulation of both presynaptic and postsynaptic molecules.
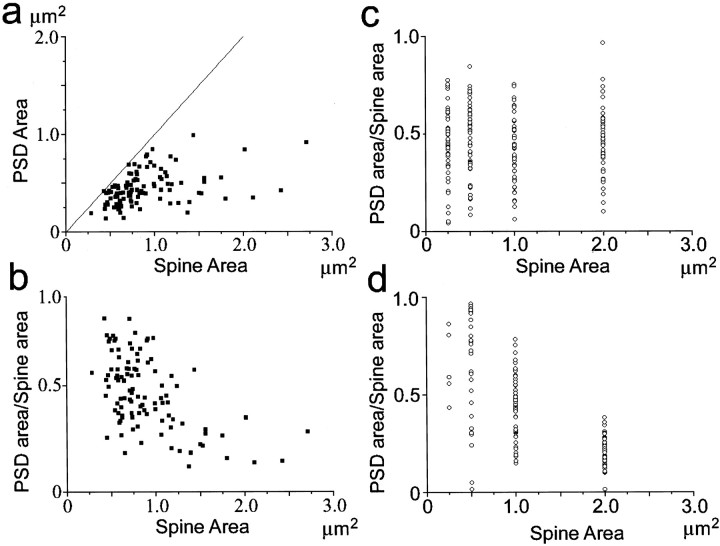
It is possible that the size of PSD-95 clusters is scaled by the volume of dendritic protrusions. In this case, the absence of GFP signals in newly generated protrusions does not reflect the absence of PSD-95 clusters but is caused by the failure of detecting fluorescence signals from smaller structures. To test this possibility, we calculated the ratio of the PSD-95 cluster area and the spine area and plotted this ratio against the spine area (Fig.6a,b). If the size of PSD-95 clusters simply scale with that of the protrusions, the ratio should distribute along a fixed y value and should be independent of the spine area (Fig. 6c). However, the distribution of the experimental data has a strong tendency to decrease the ratio as the spine area increases. This result is consistent with the model of the distribution of PSD-95 cluster size independent of the spine size (Fig. 6d). Thus, it is less likely that our experiments systematically exclude the PSD-95 clusters within newly generated, small dendritic protrusions.
Fig. 6.
Relationship between PSD-95 cluster size and spine size. a, Spine areas and PSD-95-YFP cluster areas were measured from 14 PSD-95-YFP-expressing neurons stained with lipophilic dye DiI. All data points are located below the identity line (PSD-95 cluster area = spine area) (n = 103).b, Relationship between the area ratio and the spine size. Ratio between the PSD-95 cluster area and the whole spine area was plotted against the whole spine area. Decrease of the area ratio and its variability with increasing spine size is observed.c, Simulation of the PSD–spine ratio distribution with a model of scaling PSD size with spine size. Mean and SD of simulated data sets for specific spine sizes were determined by calculating the linear regression of the data shown in _a_and scaling both parameters with the spine size. Number of data points at each spine size is 50. d, Simulation of the PSD–spine ratio distribution with a model of the distribution of PSD-95 cluster size independent of the spine size. Mean and SD of the total data set in a were used for simulation. Number of data points at each spine size is 50. Decrease of the mean area ratio and variability with increasing spine size is characteristic of this plot, as in b.
Correlation of synaptic vesicles accumulation with PSD-95 cluster formation
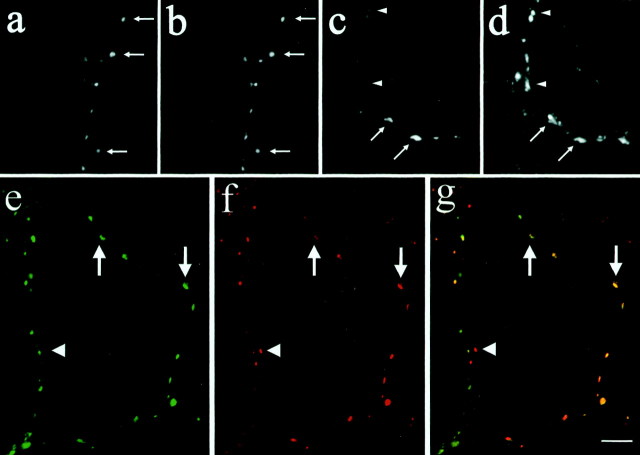
To further characterize the time course of assembly of presynaptic and postsynaptic molecules, we prepared a CFP fusion construct of synaptophysin (synaptophysin–CFP). When synaptophysin–CFP was expressed in hippocampal neurons using recombinant adenoviruses, selective localization to the axon was observed. Anti-synaptophysin staining of infected neurons revealed extensive colocalization (Fig.7a,b). The amount of the expressed fusion protein did not exceed that of endogenous synaptophysin, because the axons containing varying degrees of CFP fluorescence showed a similar level of total synaptophysin immunoreactivity (Fig. 7c,d). Synaptophysin–CFP also colocalized with another presynaptic protein, synapsin I (Fig.7e–g, arrows). There were a few synapsin I-positive clusters without synaptophysin–CFP fluorescence (Fig. 7e–g, arrowheads). These clusters suggest the presence of presynaptic structures that do not express synaptophysin–CFP.
Fig. 7.
Distribution of synaptophysin–CFP in hippocampal neurons in culture. The 18 DIV neurons were infected with recombinant adenovirus to express synaptophysin–CFP. a, b,Synaptophysin–CFP (arrows in a) showed extensive colocalization with total synaptophysin molecules detected by anti-synaptophysin immunocytochemistry (arrows in_b). c, d, Synapses with a greater amount of synaptophysin–CFP (arrows in c) and those with a smaller amount (arrowheads in_c) showed a similar level of synaptophysin immunoreactivity (d). This indicated that the expression level of synaptophysin–CFP did not exceed the endogenous level of synaptophysin. e–g, Synaptophysin–CFP (arrows in e) showed extensive colocalization with synapsin I immunoreactivity (_arrows_in f). Overlap of the distribution of synaptophysin–CFP (green) and synapsin I (red) in g indicates colocalization of most of the clusters, with a few synapsin I-positive puncta without CFP fluorescence (arrowhead). Scale bar, 6 μm.
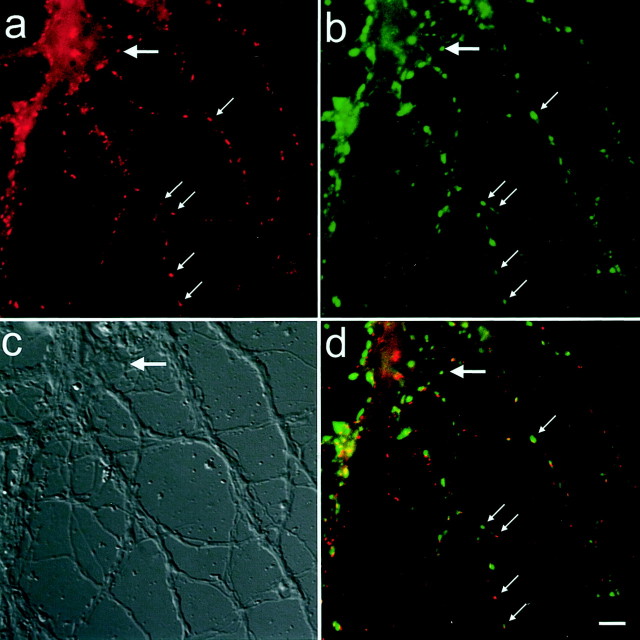
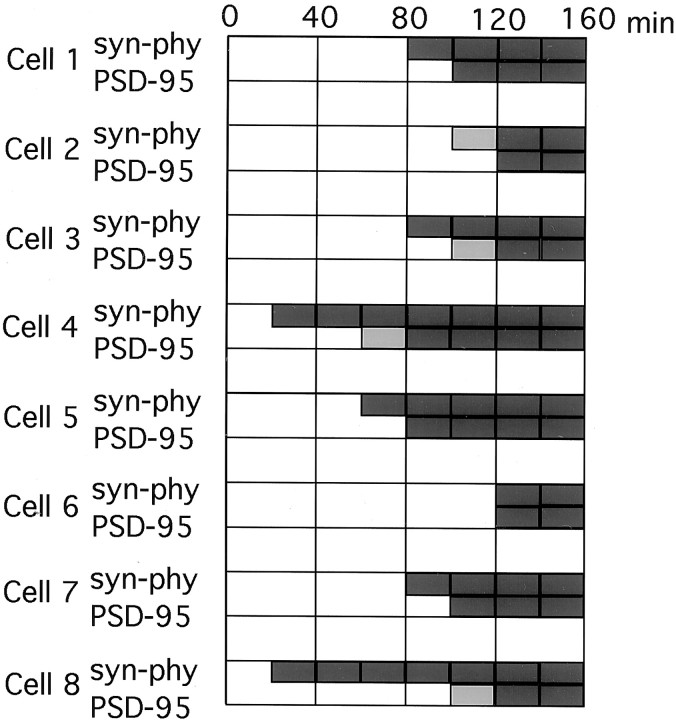
Pyramidal neurons expressed both PSD-95-YFP and synaptophysin–CFP by simultaneous application of two recombinant adenoviruses. Two fluorescent probes were correctly targeted to either presynaptic or postsynaptic sites and these two types of fluorescent clusters were closely associated with each other (Fig.8). We selected microscopic fields where a single synaptophysin–CFP-positive axon contacted the branching dendrites of a pyramidal neuron expressing PSD-95-YFP (Fig.9). We observed 16 dendritic fields from 16 culture dishes, and the image fields contained 543 PSD-95 clusters and 326 synaptophysin-positive boutons. Of these, 240 synaptic sites were positive with both PSD-95-YFP and synaptophysin–CFP from the beginning of the time-lapse recording. We could identify seven events in which generation of PSD-95 clusters followed assembly of synaptophysin clusters at the same location (Fig.10). In one case, appearance of PSD95 and synaptophysin clusters took place within the same time frame. We could not detect formation of new synaptophysin clusters at the sites of preexisting PSD-95 clusters. These observations indicate that the accumulation of synaptic vesicles precedes the PSD formation in immature synapses. Because most PSD-95 clusters were generated in filopodia–spines, our results suggest that the initial contact between the dendritic filopodia–spines and axons induced synaptic vesicle accumulation, and the clustering of PSD-95 followed this presynaptic morphological maturation.
Fig. 8.
Coexpression of PSD-95-YFP and synaptophysin–CFP using recombinant adenovirus. a, A dendritic field of a single hippocampal neuron (large arrow) expressing PSD-95-YFP. PSD-95-YFP clusters localized to dendrites (small arrows). b, Localization of synaptophysin–CFP puncta in the same dendritic field. Axons from neurons expressing synaptophysin–CFP contacted the postsynaptic cell. There was an extensive colocalization of synaptophysin–CFP clusters with PSD-95-YFP clusters (small arrows). c, DIC image of the same dendritic field. d, Superposition of images_a_ and b, illustrating the association of presynaptic and postsynaptic structures. Scale bar, 5 μm.
Fig. 9.
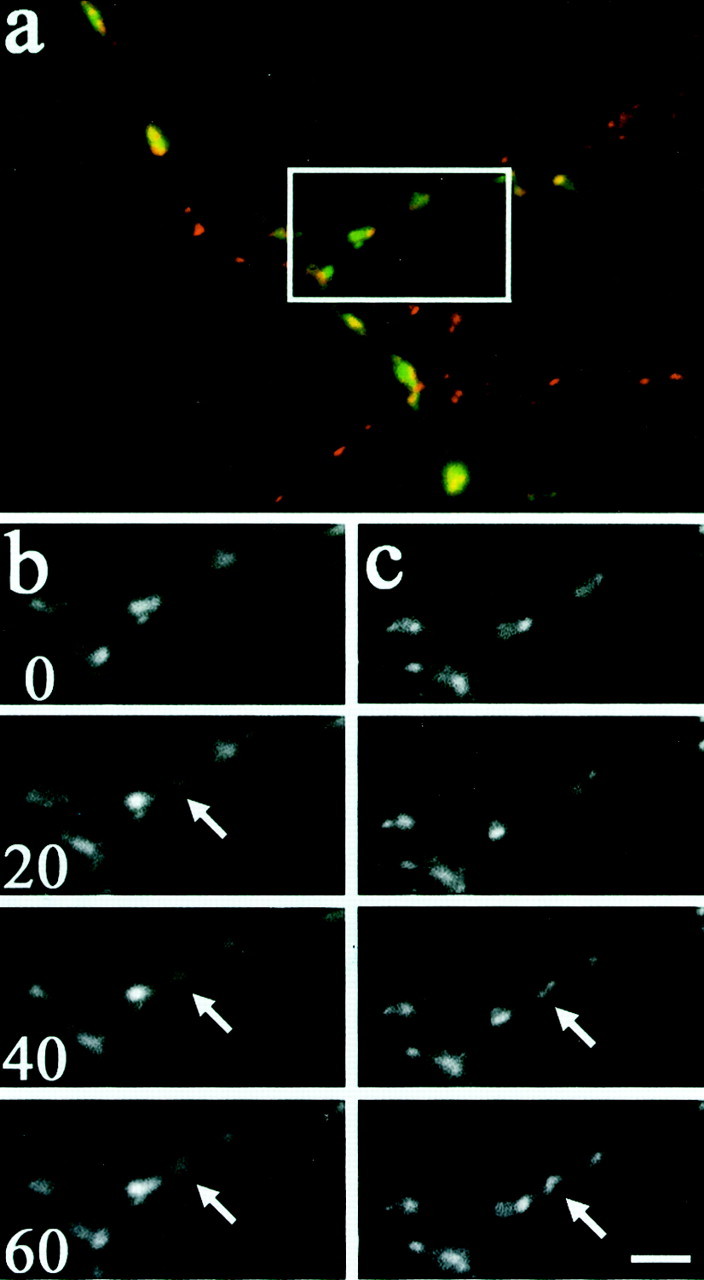
Simultaneous observation of postsynaptic PSD-95-YFP clusters and presynaptic synaptophysin–CFP clusters.a, Superposition of PSD-95-YFP clusters (red) and synaptophysin–CFP clusters (green) in the field where a single axon contacted a dendritic arborization of a single pyramidal neuron.b, Time-lapse images of synaptophysin–CFP clusters in the region enclosed by the white box in_a_. Time stamps are shown in the bottom left corners of images. A new fluorescent cluster was first detected at t = 20 min, and this cluster increased its fluorescence signal gradually (arrows).c, Time-lapse images of PSD-95-YFP clusters in the same region. A YFP fluorescence signal was first detected at the location of the new synaptophysin cluster at t = 40 min. This new cluster also increased its fluorescence (arrows). Scale bar, 3 μm.
Fig. 10.
Temporal order of cluster formation of PSD-95 and synaptophysin. We could identify eight events of PSD-95 cluster formation at the sites of synaptophysin–CFP clusters. The presence of unambiguous clusters was indicated by dark gray rectangles. _Light gray rectangles_indicate the presence of fluorescent signals within 150% of the background fluorescence signal at the location of future unambiguous clusters.
Local disassembly of PSD-95 clusters in dendritic shafts
Local assembly of PSDs within filopodia–spines and the absence of protrusive activity at the sites of shaft PSD-95 clusters suggest that preexisting PSDs within dendritic shafts do not contribute to the formation of spine synapses. Because there was a clear decrease of the density of shaft PSD-95 clusters, local disassembly of PSD-95 clusters in dendritic shafts should take place. Our time-lapse imaging experiments identified 14 PSD-95 clusters that disappeared during the observation period (Fig. 11). The frequency of the disassembly was comparable with, but less than that of the assembly (29 events of appearance vs 14 events of disappearance in 34 experimental runs). All of these lost clusters were located in dendritic shafts. Sites of the lost clusters were retrospectively analyzed for the presence of GluR2 immunoreactivity (Fig.11c), and none of the clusters showed colocalization (n = 10). We also analyzed the presence of synaptophysin in apposition to the sites where PSD-95 clusters were lost. Two out of four sites of lost PSD-95 clusters were associated with the synaptophysin-positive puncta. These results indicate that dissociation of PSD-95 clusters specifically takes place within the trunk of dendrites at this developmental stage, and this process is highly correlated with the disappearance of postsynaptic glutamate receptor clustering.
Fig. 11.
Dissociation of PSD-95 clusters within dendritic shafts. a, Time-lapse images of CFP fluorescence showing morphology of a dendritic segment. Time stamps are shown in minutes in the bottom right corners of images in b.b, Time-lapse images of PSD-95-YFP fluorescence in the same region. Dissociation of a pre-existing shaft cluster (arrows) and formation of a new cluster within a filopodium–spine (arrowheads) were observed.c, Retrospective immunocytochemistry using anti-GluR2 antibody. The specimen was fixed at t = 90 min and reacted with anti-GluR2 antibody. Note the absence of GluR2 cluster at the site where the PSD-95 cluster had disappeared. Scale bar, 3 μm.
DISCUSSION
In this study we used three fluorescent probes to detect distinct components of the synaptic structure. First, we detected the structure of PSDs by using PSD-95-YFP, a fusion protein between PSD-95, a predominant component of PSD, and YFP (Cho et al., 1992; Kistner et al., 1993; Kornau et al., 1995). PSD-95-GFP, a similar fusion construct between PSD-95 and GFP, had been characterized extensively in our previous study (Okabe et al., 1999b). Colocalization of PSD-95-YFP with both synaptophysin (Fig. 4g) and dendritic spines (Fig.4a,e) was also confirmed in this study. These observations indicate that PSD-95-YFP can reliably indicate the localization of PSDs in hippocampal neurons. Second, we monitored filopodia–spine structure with CFP fluorescence. It is possible that our microscope system does not have sufficient sensitivity to identify very thin protrusions. The advantage of dual wavelength fluorescence microscopy was that the comparison between PSD-95-YFP and CFP signal could determine the localization of individual spines unambiguously. In general, there was no PSD-95 cluster that did not correspond to a CFP-positive protrusion (Fig. 4). Therefore, our fluorescence detection system had sufficient sensitivity to visualize most filopodia–spine structures containing PSD-95 clusters. The third fluorescent probe was synaptophysin–CFP, which showed selective association with the presynaptic boutons. Synaptophysin is an integral membrane protein and a major component of small synaptic vesicles in both neurons and neuroendocrine cells (Navone et al., 1984; Leube et al., 1987; Fletcher et al., 1991). A previous report has shown that a similar GFP fusion of synaptophysin selectively localized to synaptic vesicles (Nakata et al., 1998). It is possible that some of the synaptophysin–CFP clusters represent mobile clusters of synaptic vesicles in the process of transport along the axon (Kraszewski et al., 1995; Nakata et al., 1998;Ahmari et al., 2000). These mobile clusters were abundant within the region where axons did not contact dendrites. Within microscopic fields where a single axon contacted a dendritic arborization, we detected few mobile synaptophysin–CFP clusters. Furthermore, formation of stable synaptophysin–CFP clusters was highly correlated with PSD-95-YFP clustering (Fig. 9). None of the synaptophysin–CFP clusters associated with PSD-95-YFP puncta showed motile behavior. These arguments support the notion that synaptophysin–CFP clusters analyzed in this study represent stable transmitter release sites.
Another technical caveat in the colocalization study of synaptophysin–CFP and PSD-95-YFP is the presence of unlabeled axons in the image field. We estimate that 50–75% of neurons express synaptophysin–CFP. This suggests that a certain number of unlabeled axons are likely to contact the postsynaptic neurons in a selected image field. Indeed, we identified 543 PSD-95 clusters and 326 synaptophysin clusters in the time-lapse experiments, and this suggests the possible association of 217 PSD-95 clusters with unlabeled axons. It is possible to argue that our analysis is contaminated with the clustering of PSD-95-YFP to the unlabeled presynaptic sites close to the labeled ones. In our culture system, axons tend to segregate their synaptic sites along the dendrites with each other. Within these segments, PSD-95 clusters and synaptophysin clusters showed complete colocalization, and the generation of new clusters usually takes place among them (Fig. 9). Therefore, contribution of unlabeled axonal structures to the synapse formation is likely to be small.
Involvement of dendritic filopodia–spines in synapse formation has been suggested both in real time observations of filopodial dynamics and in serial-section electron microscopy (Dailey and Smith, 1996; Ziv and Smith, 1996; Fiala et al., 1998). Our observation is consistent with these reports and further clarifies the sequential steps of synapse maturation in hippocampus. In dendrites of 11 DIV neurons, filopodia-like thin protrusions were numerous, but their locations were independent of the sites of PSD-95 clusters. Highly motile behavior of these thin protrusions indicated that the majority of these structures did not provide a structural basis for stable synaptic connections. Interestingly, our time-lapse observations revealed that a selected population of the motile processes were stabilized and started to accumulate PSD-95 molecules. It is possible that the assembly of PSD-95 clusters itself induces the structural rigidity of the PSD and suppresses extension and retraction of filopodia–spines. Another possibility is that other factors, such as adhesion of filopodia–spines to the presynaptic membrane, play a role in the stabilization. In a small number of experiments, time-lapse recordings revealed both presynaptic and postsynaptic structures by CFP fluorescence (Fig. 4a–c). In these cases, initial axodendritic contact preceded the assembly of postsynaptic PSD-95 clusters. These observations strongly suggest that the adhesion event, initiated by dendritic protrusions, promotes recruitment of postsynaptic molecules. Formation of PSD-95 clusters within newly generated filopodia–spines is likely to represent an essential step toward the formation of functional synapses, because clustering of PSD-95 was highly correlated with the clustering of the AMPA receptor subunit GluR2 and the accumulation of a presynaptic vesicle protein, synaptophysin. Recent imaging experiments revealed that assembly of both presynaptic and postsynaptic molecules took place within 1–2 hr after initial axodendritic contact (Ahmari et al., 2000; Friedman et al., 2000). Our study is consistent with these observations and provides evidence of involvement of dendritic protrusive activity in this process.
We visualized the process of assembly of a presynaptic vesicle protein, synaptophysin, and a postsynaptic protein, PSD-95, at individual synaptic sites by using dual wavelength time-lapse fluorescence microscopy. This experiment revealed two important features of synaptogenesis. First, assembly of presynaptic vesicles and that of PSD-95 clusters were highly correlated both spatially and temporally. This observation further supported the notion that assembly of PSD-95 clusters within filopodia–spines in our time-lapse observations represented the process of establishment of full synaptic structure. Second, there was a tendency for the assembly of synaptophysin to precede that of the PSD-95 (Fig. 10). This temporal sequence was also confirmed by the fact that all newly formed PSD-95 clusters were associated with synaptophysin immunoreactivity. Using a fluorescent endocytotic dye in combination with immunocytochemistry of postsynaptic marker proteins, Friedman et al. (2000) observed that the appearance of postsynaptic components lagged behind the formation of functional transmitter release sites. We identified both presynaptic and postsynaptic components at individual contact sites in living neurons. The results provided direct confirmation of the proposed temporal order. It should be emphasized that the observed sequence does not necessarily imply an inductive role of the presynaptic components on the assembly of postsynaptic structure. It is possible that accumulation of other signaling molecules, such as neuroligin, on the surface of dendrites plays a role in the differentiation of presynaptic structure before the accumulation of presynaptic vesicles (Scheiffele et al., 2000). Our study supports the view that assembly of presynaptic and postsynaptic structures takes place on a time scale of a few hours. Further classification of signaling molecules according to their temporal order of appearance at synaptic sites will be necessary to identify initial molecular events in synaptogenesis.
Footnotes
This work was supported by grants from the Ministry of Education, Science, and Culture of Japan, the Agency of Industrial Science and Technology of Japan, the Core Research for Evolutional Science and Technology of Japan Science and Technology Corporation, and Special Coordination Funds of the Science and Technology Agency of Japan. We thank I. Kawabata for cell culture and Y. Kanegae and I. Saito for materials used in adenovirus construction.
Correspondence should be addressed to Shigeo Okabe, Department of Anatomy and Cell Biology, School of Medicine, Tokyo Medical and Dental University, 1-5-45, Yushima, Bunkyo-ku, Tokyo, 113-8519, Japan. E-mail:okabe.cbio@tmd.ac.jp.
REFERENCES
- 1.Ahmari SE, Buchanan J, Smith SJ. Assembly of presynaptic active zones from cytoplasmic transport packets. Nat Neurosci. 2000;3:445–451. doi: 10.1038/74814. [DOI] [PubMed] [Google Scholar]
- 2.Cho KO, Hunt CA, Kennedy MB. The rat brain postsynaptic density fraction contains a homolog of the Drosophila discs-large tumor suppressor protein. Neuron. 1992;9:929–942. doi: 10.1016/0896-6273(92)90245-9. [DOI] [PubMed] [Google Scholar]
- 3.Dailey ME, Smith SJ. The dynamics of dendritic structure in developing hippocampal slices. J Neurosci. 1996;16:2983–2994. doi: 10.1523/JNEUROSCI.16-09-02983.1996. [DOI] [PMC free article] [PubMed] [Google Scholar]
- 4.El-Husseini AE, Schnell E, Chetkovich DM, Nicoll RA, Bredt DS. PSD-95 involvement in maturation of excitatory synapses. Science. 2000;290:1364–1368. [PubMed] [Google Scholar]
- 5.Engert F, Bonhoeffer T. Dendritic spine changes associated with hippocampal long-term synaptic plasticity. Nature. 1999;399:66–70. doi: 10.1038/19978. [DOI] [PubMed] [Google Scholar]
- 6.Fiala JC, Feinberg M, Popov V, Harris KM. Synaptogenesis via dendritic filopodia in developing hippocampal area CA1. J Neurosci. 1998;18:8900–8911. doi: 10.1523/JNEUROSCI.18-21-08900.1998. [DOI] [PMC free article] [PubMed] [Google Scholar]
- 7.Fletcher TL, Cameron P, De Camilli P, Banker G. The distribution of synapsin I and synaptophysin in hippocampal neurons developing in culture. J Neurosci. 1991;11:1617–1626. doi: 10.1523/JNEUROSCI.11-06-01617.1991. [DOI] [PMC free article] [PubMed] [Google Scholar]
- 8.Friedman HV, Bresler T, Garner CC, Ziv NE. Assembly of new individual excitatory synapses: time course and temporal order of synaptic molecule recruitment. Neuron. 2000;27:57–69. doi: 10.1016/s0896-6273(00)00009-x. [DOI] [PubMed] [Google Scholar]
- 9.Harris KM, Jensen FE, Tsao B. Three-dimensional structure of dendritic spines and synapses in rat hippocampus (CA1) at postnatal day 15 and adult ages: implications for the maturation of synaptic physiology and long-term potentiation. J Neurosci. 1992;12:2685–2705. doi: 10.1523/JNEUROSCI.12-07-02685.1992. [DOI] [PMC free article] [PubMed] [Google Scholar]
- 10.Kanegae Y, Makimura M, Saito I. A simple and efficient method for purification of infectious recombinant adenovirus. Jpn J Med Sci Biol. 1994;47:157–166. doi: 10.7883/yoken1952.47.157. [DOI] [PubMed] [Google Scholar]
- 11.Kanegae Y, Lee G, Sato Y, Tanaka M, Nakai M, Sakaki T, Sugano S, Saito I. Efficient gene activation in mammalian cells by using recombinant adenovirus expressing site-specific Cre recombinase. Nucleic Acids Res. 1995;23:3816–3821. doi: 10.1093/nar/23.19.3816. [DOI] [PMC free article] [PubMed] [Google Scholar]
- 12.Kennedy MB. Signal transduction molecules at the glutamatergic postsynaptic membrane. Brain Res Brain Res Rev. 1998;26:243–257. doi: 10.1016/s0165-0173(97)00043-x. [DOI] [PubMed] [Google Scholar]
- 13.Kim JH, Huganir RL. Organization and regulation of proteins at synapses. Curr Opin Cell Biol. 1999;11:243–257. doi: 10.1016/s0955-0674(99)80033-7. [DOI] [PubMed] [Google Scholar]
- 14.Kistner U, Wenzel BM, Veh RW, Cases-Langhoff C, Garner AM, Appeltauer U, Voss B, Gundelfinger ED, Garner CC. SAP90, a rat presynaptic protein related to the product of the Drosophila tumor suppressor gene dlg-A. J Biol Chem. 1993;268:4580–4583. [PubMed] [Google Scholar]
- 15.Kornau HC, Schenker LT, Kennedy MB, Seeburg PH. Domain interaction between NMDA receptor subunits and the postsynaptic density protein PSD-95. Science. 1995;269:1737–1740. doi: 10.1126/science.7569905. [DOI] [PubMed] [Google Scholar]
- 16.Kraszewski K, Mundigl O, Daniell L, Verderio C, Matteoli M, De Camilli P. Synaptic vesicle dynamics in living cultured hippocampal neurons visualized with CY3-conjugated antibodies directed against the lumenal domain of synaptotagmin. J Neurosci. 1995;15:4328–4342. doi: 10.1523/JNEUROSCI.15-06-04328.1995. [DOI] [PMC free article] [PubMed] [Google Scholar]
- 17.Lendvai B, Stern EA, Chen B, Svoboda K. Experience-dependent plasticity of dendritic spines in the developing rat barrel cortex in vivo. Nature. 2000;404:876–881. doi: 10.1038/35009107. [DOI] [PubMed] [Google Scholar]
- 18.Leube RE, Kaiser P, Seiter A, Zimbelmann R, Franke WW, Rehm H, Knaus P, Prior P, Betz H, Reinke H, Beyreuther K, Wiedenmann B. Synaptophysin: molecular organization and mRNA expression as determined from cloned cDNA. EMBO J. 1987;6:3261–3268. doi: 10.1002/j.1460-2075.1987.tb02644.x. [DOI] [PMC free article] [PubMed] [Google Scholar]
- 19.Maletic-Savatic M, Malinow R, Svoboda K. Rapid dendritic morphogenesis in CA1 hippocampal dendrites induced by synaptic activity. Science. 1999;283:1923–1927. doi: 10.1126/science.283.5409.1923. [DOI] [PubMed] [Google Scholar]
- 20.Miyake S, Makimura M, Kanegae Y, Harada S, Sato Y, Takamori K, Tokuda C, Saito I. Efficient generation of recombinant adenoviruses using adenovirus DNA-terminal protein complex and a cosmid bearing the full-length virus genome. Proc Natl Acad Sci USA. 1996;93:1320–1324. doi: 10.1073/pnas.93.3.1320. [DOI] [PMC free article] [PubMed] [Google Scholar]
- 21.Nakata T, Terada S, Hirokawa N. Visualization of the dynamics of synaptic vesicle and plasma membrane proteins in living axons. J Cell Biol. 1998;140:659–674. doi: 10.1083/jcb.140.3.659. [DOI] [PMC free article] [PubMed] [Google Scholar]
- 22.Navone F, Greengard P, De Camilli P. Synapsin I in nerve terminals: selective association with small synaptic vesicles. Science. 1984;226:1209–1211. doi: 10.1126/science.6438799. [DOI] [PubMed] [Google Scholar]
- 23.Niwa H, Yamamura K, Miyazaki J. Efficient selection for high-expression transfectants with a novel eukaryotic vector. Gene. 1991;108:193–199. doi: 10.1016/0378-1119(91)90434-d. [DOI] [PubMed] [Google Scholar]
- 24.O'Brien RJ, Mammen AL, Blackshaw S, Ehlers MD, Rothstein JD, Huganir RL. The development of excitatory synapses in cultured spinal neurons. J Neurosci. 1997;17:7339–7350. doi: 10.1523/JNEUROSCI.17-19-07339.1997. [DOI] [PMC free article] [PubMed] [Google Scholar]
- 25.Okabe S, Vicario-Abejon C, Segal M, McKay RDG. Survival and synaptogenesis of hippocampal neurons without NMDA receptor function in culture. Eur J Neurosci. 1998;10:2192–2198. doi: 10.1046/j.1460-9568.1998.00233.x. [DOI] [PubMed] [Google Scholar]
- 26.Okabe S, Miwa A, Okado H. Alternative splicing of the C-terminal domain regulates cell surface expression of the NMDA receptor NR1 subunit. J Neurosci. 1999a;19:7781–7792. doi: 10.1523/JNEUROSCI.19-18-07781.1999. [DOI] [PMC free article] [PubMed] [Google Scholar]
- 27.Okabe S, Kim HD, Miwa A, Kuriu T, Okado H. Continual remodeling of postsynaptic density and its regulation by synaptic activity. Nat Neurosci. 1999b;2:804–811. doi: 10.1038/12175. [DOI] [PubMed] [Google Scholar]
- 28.Papa M, Bundman MC, Greenberger V, Segal M. Morphological analysis of dendritic spine development in primary cultures of hippocampal neurons. J Neurosci. 1995;15:1–11. doi: 10.1523/JNEUROSCI.15-01-00001.1995. [DOI] [PMC free article] [PubMed] [Google Scholar]
- 29.Rao A, Craig AM. Activity regulates the synaptic localization of the NMDA receptor in hippocampal neurons. Neuron. 1997;19:801–812. doi: 10.1016/s0896-6273(00)80962-9. [DOI] [PubMed] [Google Scholar]
- 30.Rao A, Kim E, Sheng M, Craig AM. Heterogeneity in the molecular composition of excitatory postsynaptic sites during development of hippocampal neurons in culture. J Neurosci. 1998;18:1217–1229. doi: 10.1523/JNEUROSCI.18-04-01217.1998. [DOI] [PMC free article] [PubMed] [Google Scholar]
- 31.Scheiffele P, Fan J, Choih J, Fetter R, Serafini T. Neuroligin expressed in nonneuronal cells triggers presynaptic development in contacting axons. Cell. 2000;101:657–669. doi: 10.1016/s0092-8674(00)80877-6. [DOI] [PubMed] [Google Scholar]
- 32.Schwartz IR, Pappas GD, Purpura DP. Fine structure of neurons and synapses in the feline hippocampus during postnatal ontogenesis. Exp Neurol. 1968;22:394–407. doi: 10.1016/0014-4886(68)90005-8. [DOI] [PubMed] [Google Scholar]
- 33.Sheng M, Pak DT. Glutamate receptor anchoring proteins and the molecular organization of excitatory synapses. Ann NY Acad Sci. 1999;868:483–493. doi: 10.1111/j.1749-6632.1999.tb11317.x. [DOI] [PubMed] [Google Scholar]
- 34.Toni N, Buchs PA, Nikonenko I, Bron CR, Muller D. LTP promotes formation of multiple spine synapses between a single axon terminal and a dendrite. Nature. 1999;402:421–425. doi: 10.1038/46574. [DOI] [PubMed] [Google Scholar]
- 35.Ziv NE, Smith SJ. Evidence for a role of dendritic filopodia in synaptogenesis and spine formation. Neuron. 1996;17:91–102. doi: 10.1016/s0896-6273(00)80283-4. [DOI] [PubMed] [Google Scholar]

