Proliferation and Differentiation of Progenitor Cells Throughout the Intact Adult Rat Spinal Cord (original) (raw)
Abstract
The existence of multipotent progenitor populations in the adult forebrain has been widely studied. To extend this knowledge to the adult spinal cord we have examined the proliferation, distribution, and phenotypic fate of dividing cells in the adult rat spinal cord. Bromodeoxyuridine (BrdU) was used to label dividing cells in 13- to 14-week-old, intact Fischer rats. Single daily injections of BrdU were administered over a 12 d period. Animals were killed either 1 d or 4 weeks after the last injection of BrdU. We observed frequent cell division throughout the adult rodent spinal cord, particularly in white matter tracts (5–7% of all nuclei). The majority of BrdU-labeled cells colocalized with markers of immature glial cells. At 4 weeks, 10% of dividing cells expressed mature astrocyte and oligodendroglial markers. These data predict that 0.75% of all astrocytes and 0.82% of all oligodendrocytes are derived from a dividing population over a 4 week period. To determine the migratory nature of dividing cells, a single BrdU injection was given to animals that were killed 1 hr after the injection. In these tissues, the distribution and incidence of BrdU labeling matched those of the 4 week post injection (pi) groups, suggesting that proliferating cells divide_in situ_ rather than migrate from the ependymal zone. These data suggest a higher level of cellular plasticity for the intact spinal cord than has previously been observed and that glial progenitors exist in the outer circumference of the spinal cord that can give rise to both astrocytes and oligodendrocytes.
Keywords: spinal cord, progenitor, proliferation, rat, neurogenesis, stem cell, adult, gliogenesis
Using3H-thymidine as a mitotic marker, Adrian and Walker (1962) labeled a population of dividing cells in the intact adult rat spinal cord. Labeled cells had a limited life span beyond 1 week, suggesting that dividing cells play a limited role in the adult spinal cord. In 1983, a glial progenitor, the O-2A, was cultured from the neonatal optic nerve that retained the ability to differentiate into astrocytes or oligodendrocytes in vitro (Raff et al., 1983). Since their discovery, these cells have been used extensively as a transplantable source of myelinating cells in models of dysmyelinating diseases and trauma (Warrington et al., 1992; Laeng et al., 1996; Espinosa de los Monteros et al., 1997; Franklin and Blakemore, 1997; Hammang et al., 1997). Until 1997, however, no data existed regarding the location and frequency of the O-2A cell (GPC)in situ. In 1997, Reynolds and Hardy showed that cells expressing immature glial markers persisted in the adult rat cerebral cortex. Gensert and Goldman (1997) showed that a dividing population of cells resides in the subcortical white matter and occasionally gives rise to oligodendrocytes. These cells can differentiate into mature oligodendrocytes but do not appear to migrate in the intact or injured adult brain (Gensert and Goldman, 1997).
Recently, there has been considerable attention focused on the existence of an adult stem cell. In vitro and in vivo experiments have shown that cells exist in the intact adult brain that are self-propagating and capable of producing all of the major neuronal phenotypes. In the spinal cord, adult stem cells can be isolated, expanded, and differentiated in vitro (Weiss et al., 1996; Shihabuddin et al., 1997). The anatomical location and morphology of these cells in vivo have not been determined. Evidence suggests that a stem-like cell can be localized in or near the ependymal layer of the brain and spinal cord (Morshead et al., 1994;Garcia-Verdugo et al., 1998; Chiasson et al., 1999; Doetsch et al., 1999; Johansson et al., 1999).
In the present experiments, we sought to quantitatively examine cell proliferation in the intact adult rat spinal cord and determine patterns of migration and the degree of differentiation of mitotically active cells. The existence of spinal glial progenitors and stem cells in the adult has been determined by several in vitro_experiments; however, the activity, location, and role these cells play_in vivo have not been adequately described. Work by Adrian and Walker (1962) suggests that these cells are quiescent and make little contribution to mature neural phenotypes in the adult spinal cord. In the present study, we used bromodeoxyuridine (BrdU) to label dividing cells and triple epitope immunohistochemistry to determine their phenotypic fate. The data indicate that significant cell division occurs in the adult and that a clear medial to lateral gradient of cell division exists. BrdU-incorporating cells primarily persist as immature glial progenitors that may be bipotent. Specifically, unlike glial progenitors described for the brain, these cells express mature oligodendrocyte and astrocyte markers after 4 weeks.
MATERIALS AND METHODS
Experimental groups. Male Fischer-344 albino rats (n = 36; Harlan Sprague Dawley, Indianapolis, IN) were used in this experiment. The animals were 13–14 weeks of age and weighed between 260 and 300 gm at the start of the experiment. All animals were housed in pairs in a large, well-lit laboratory controlled for temperature (21°C) and maintained with a daily photoperiod of 12 hr of light between 6:00 A.M. and 6:00 P.M. Each animal had ad libitum access to food and water and was fed on a complete and balanced standard laboratory diet (Teklad 4% rat diet 7001; Harlan Teklad, Madison, WI). Anesthesia was induced by an intramuscular injection consisting of 44 mg/kg ketamine (Ketaset, 100 mg/ml; Bristol Laboratories, Syracuse, NY), 4 mg/kg xylazine (Rompun, 20 mg/ml; Miles Laboratories, Shawnee, KS), and 0.75 mg/kg of acepromazine maleate (10 mg/ml; TechAmerica Group, Elwood, KS) diluted in 0.9% sterile saline.
Bromodeoxyuridine injection paradigms. In Experiment 1, 16 animals were given a single injection of BrdU (50 mg/kg i.p., Sigma, St. Louis, MO) and anesthetized 1 or 24 hr, 5 or 7 d after injection as above (n = 4 each time point). In Experiment 2, 20 animals received one intraperitoneal injection of BrdU (50 mg/kg; Sigma) each day for 12 d. At 14 d after the first intraperitoneal injection, half of the animals (n = 10) were anesthetized deeply and perfused intracardially with 4% paraformaldehyde in 100 mm phosphate buffer, pH 7.4. Four weeks after the final injection, a second group (n = 10) was anesthetized and perfused as above. Spinal cords were removed, post-fixed over 7 d in 4% paraformaldehyde, and transferred to 0.32 m sucrose for cryopreservation.
Tissue processing. Spinal cords were cut into 3 mm coronal segments and embedded in cryomolds (Fisher Scientific, Pittsburgh, PA) with O.C.T. mounting medium (Tissue Tek, Torrance, CA). Blocked spinal cord segments were stored frozen at −70°C until sectioned coronally on a cryostat (Jung Frigcut 2800E; Leica, Nussloch, Germany) at 40 μm and stored on slides at −20°C. Slides representative of all groups were selected for both BrdU immunohistochemistry and triple immunofluorescence labeling.
Immunohistochemistry. For the stereological quantitation of BrdU-labeled cells, cryostat sections were stained for diaminobenzadine (DAB) immunohistochemistry. Specifically, sections were pretreated with 50% formamide in 2× SSC for 2 hr at 65°C; followed by 15 min in 2× SSC, 30 min in 2 N HCl at 37°C, 10 min in 0.1 m borate buffer, and six 15 min rinses in Tris-buffered saline (TBS), pH 7.5. Nonspecific labeling was blocked with TBS + 0.1% Triton X-100 and 3% normal donkey serum for 30 min. A monoclonal mouse antibody against BrdU (1:400; Boehringer Mannheim, Indianapolis, IN) was incubated with the tissue for 2 d at 4°C. After primary antibody incubation, sections were quenched with 0.6% H2O2 in TBS for 30 min in the dark. Tissue was rinsed in TBS before incubation with secondary antibody. A polyclonal donkey α mouse IgG was applied for 1 hr at room temperature (Accurate Chemicals, Westbury, NY; 1:200 in TBS). Sections were then rinsed three times in TBS for 15 min both before and after a 1 hr incubation with avidin–biotin complex (ABC-Elite; Vector Laboratories, Burlingame, CA). BrdU labeling was then visualized using DAB (0.25 mg DAB, 0.009% H2O2, and 0.04% NiCl in TBS) for 9 min. DAB incubation was terminated by rinsing in tap water, and slides were then dehydrated through alcohols and coverslipped.
Immunofluorescence. Sections were processed for multiple markers to determine the cellular phenotype of BrdU-labeled nuclei. Primary antibodies were chosen that recognize immature and mature astrocytes (S-100β polypeptide), immature neurons (β-tubulin, TUJ1), mature neurons [neuronal nuclear antigen clone A60 (NeuN)], mature astrocytes [glial fibrillary acidic protein (GFAP)], mature oligodendrocytes (RIP), and immature/mature astrocytes and oligodendrocytes [adenomatous polyposis coli tumor suppresser gene (APC)] (Boyes et al., 1986; Friedman et al., 1989; Lee et al., 1990;Jhaveri et al., 1992; Bhat et al., 1996; Wolf et al., 1996; Sarnat et al., 1998). The antibody recognizing APC is directed against the N-terminal segment of APC and is specific for glial cells (Calbiochem, La Jolla, CA). This antibody does not show cross-reactivity with neurons, as has been reported with antibodies directed against the C terminus of APC or by _in situ_hybridization (Senda et al., 1998; Brakeman et al., 1999). Cryostat sections (40 μm) were pretreated for BrdU detection as described above. Three compatible primary antibodies were applied together for 2 d at 4°C in TBS + 0.1% Triton X-100 + 5% donkey serum. The following primary antibodies were used at the following concentrations: rat αBrdU (1:100; Accurate Chemicals), rabbit αS-100β (1:10,000; Swant, Bellinzona, Switzerland), mouse αNeuN (1:10; clone A60; Dr. R. Mullin, Salt Lake City, UT), rabbit αGFAP (1:1000; Dako, Carpinteria, CA), mouse αAPC (1:500; Calbiochem), and mouse αRIP (supernatant, 1:20; Hybridoma Bank, Iowa City, IA), mouse αNG2 (1:500; gift of Dr. William Stallcup, Burnham Institute, La Jolla, CA), mouse αRECA-1 (1:10; Serotec, Oxford, UK). Sections were rinsed twice in 0.1 m TBS, pH 7.5, and once in 0.1 m TBS pH 7.5 + 0.1% Triton X-100 for 15 min before application of secondary antibodies. The following secondary antibodies were applied in 0.1 m TBS, pH 7.5, and 0.1% Triton X-100, each at a concentration of 1:250 for 2 hr in the dark: donkey α rat IgG conjugated to FITC (1:250; Jackson ImmunoResearch, West Grove, PA), donkey α mouse IgG conjugated to biotin (1:250; Jackson ImmunoResearch), and donkey α rabbit conjugated to CY5 (1:250; Jackson ImmunoResearch). Incubation with secondary antibodies was followed by three rinses (15 min) in TBS. Visualization of one primary antibody was enhanced by incubation with streptavidin conjugated with Texas Red in TBS at a concentration of 1:250 for 1 hr. Streptavidin incubation was also followed by three rinses (15 min) in TBS. Slides were then immediately coverslipped using polyvinyl alcohol-1,4 diazabicyclo[2.2.2]octane and then kept in the dark at 4°C until analysis.
Criteria for microscopic analysis of BrdU labeling. BrdU incorporation is used as a marker for mitotically active cells. Two basic criteria were established for proper interpretation of BrdU immunohistochemical labeling. The first criterion was to establish that the BrdU staining was located in the nucleus. At the light microscopic level, the presence of BrdU labeling was determined to be nuclear by alternating between standard light microscopy to clearly observe the DAB reaction product followed by differential interference contrast optics to visualize the nuclear compartment of cells. By alternating between these settings, BrdU labeling could be localized to the nucleus. In the case of fluorescent images, the nuclear stain 4′,6-diamidino-2-phenylindole (DAPI) was applied. BrdU immunofluorescent labeling was compared to that of DAPI to ensure nuclear localization. The second criterion for a BrdU profile to be considered for quantification is the morphology of the DAB reaction product. Only uniformly labeled nuclei were considered for inclusion. BrdU nuclei were excluded from the study if they exhibited punctate staining in part of the nucleus or the DNA appeared to be condensed. One exception is in the case in which BrdU immunoreactivity was detected throughout the nucleus, but the intensity was higher at the periphery of the nucleus compared to the center. This is thought to represent an artifact resulting from decreased antibody penetration to the center of the nucleus.
Quantification of proliferating cells. The total number of BrdU-positive cells per 40 μm section was determined from coronal sections taken from segments C7, T8, and L2 (Fig.1A). Cells were counted using a template that was overlaid onto coronal sections. The template divides the spinal cord into concentric circles (annuli) and quadrants (sectors) (Fig. 1B,C). The template was superimposed onto BrdU-labeled (DAB) spinal sections with the aid of a mechanical stage attached to an Olympus (Melville, NY) BH-2 microscope and Dage (Michigan City, IN) MTI CCD-300TIFG video camera. Cell counts were recorded using Stereo Investigator Software (MicroBrightfield, Colchester, VT), which allowed the stage to be moved accurately between template regions under high magnification. Where the template met the outer edge of the spinal cord, the sector or annulus was closed by tracing the outer circumference of the spinal cord just medial to the pial layer (Fig. 1D). A corrected area was calculated for template regions that were manipulated in this manner. BrdU-labeled nuclear counts were presented as either (1) cell density defined as the number of BrdU-labeled nuclei per area sampled or (2) a labeling index defined as the percentage of all nuclei in each region that immunolabeled for BrdU. Cell density was calculated by dividing the number of cells counted per annulus or sector by the measured area of the template region. Cell density per template area was then extrapolated to the number of cells per cubic millimeter of tissue. A labeling index was calculated by taking the total number of BrdU-immunoreactive cells per region and dividing it by the total number of DAPI-labeled nuclei from the corresponding template region. Representative sections of the three spinal levels were chosen by an independent observer for analysis (minimum of three sections per spinal level with a separation of 200 μm) based on the structure of the gray matter. Nuclear counts were performed by an additional investigator. The total number of BrdU-positive cells within the ependymal layer of the central canal was counted separately; pial cells were excluded from counting.
Fig. 1.
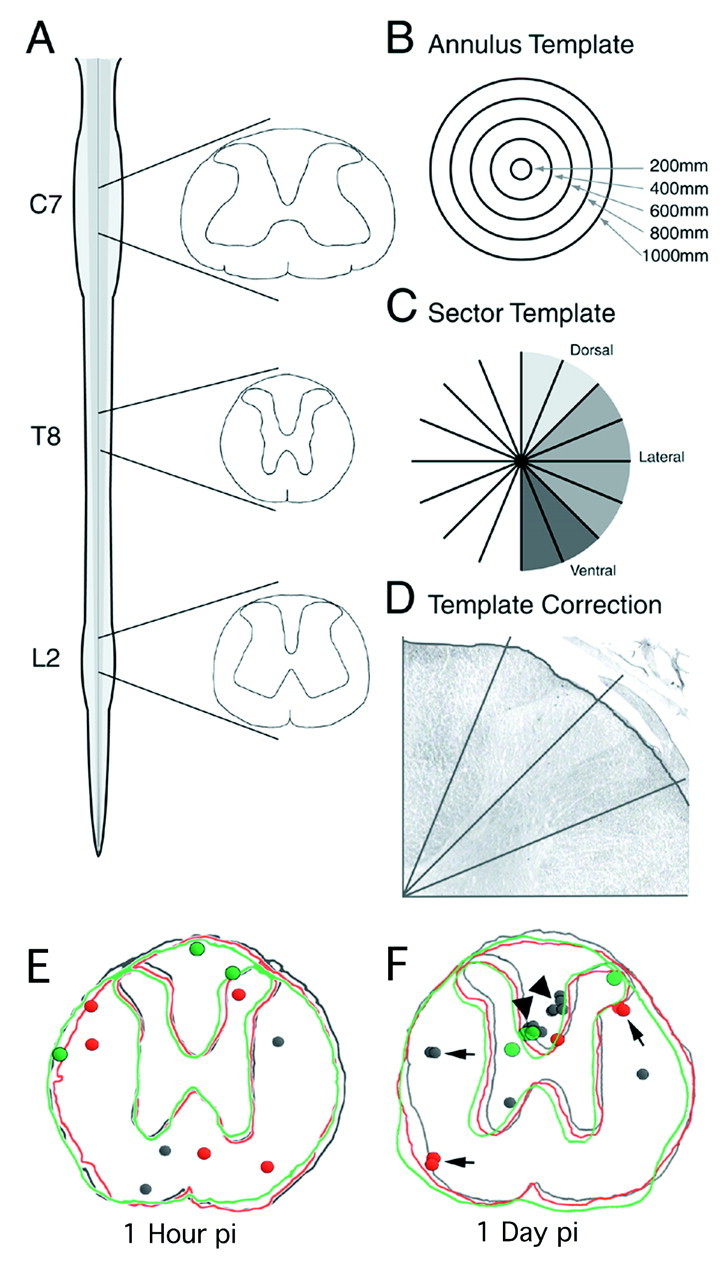
Quantitative method for counting BrdU-positive nuclei in the intact spinal cord. Coronal sections (40 μm) from C7, T8, and L2 were selected for quantitation and immunohistochemically labeled for BrdU (A). Electronic templates that divided the spinal cord into concentric annuli (B) and radial sectors (C) were overlaid onto stained sections. With the aid of an image analysis system, the perimeters of the templates were delineated by electronically circumscribing the outer circumference of each tissue section (D). The limit was drawn just beneath the pial surface. All BrdU-positive nuclei were counted, and the area of each region was calculated after the regions were delineated. BrdU-labeled cells at the ependymal layer of the central canal were counted independently. BrdU distribution and cell migration was determined in a group of animals, where a single injection of BrdU was given followed by killing at 1 hr or 1 day after injection (E, F). Three consecutive 40 μm sections from a representative animal were traced at the level of T8.Dots indicate the presence of a BrdU-labeled nucleus. Each section and corresponding nuclei are represented as a separate color. At 1 hr pi most BrdU-labeled cells are found as single nuclear profiles, and nuclei are distributed in the medial and outer circumference of the spinal cord (E). At 1 day pi, the number of BrdU-labeled nuclei increases, and many of the nuclear profiles are located in clusters of two (arrows) and four (arrowhead) nuclei, indicating cell division.
Quantification of immunofluorescent images. Multiple label immunofluorescent images were collected and quantified using confocal microscopy (MRC 1000; Bio-Rad, Hercules, CA; Carl Zeiss, Thornwood, NY). Single confocal plane images of BrdU or phenotype markers (see above) were collected and combined to determine label colocalization. Counts were made by dividing the annulus template into two regions: (1) a medial annulus (<600 μm from the central canal) and (2) an outer annulus (>600 μm from the central canal). As before, ependymal and pial cells were not included in this analysis. A cell was counted as an astrocyte or oligodendrocyte if a well-defined BrdU-labeled nucleus was associated with an immunopositive (e.g., GFAP, RIP, S100-β etc.) cell body. The complete cell nucleus was followed through the _z_-axis, and only cells with a well-circumscribed, immunopositive cell body were considered positive for a particular phenotype. A total of 100 BrdU cells were randomly counted from at least four sections from each of the medial and outer annuli.
Estimation of nuclear, astrocytic, and oligodendrocyte labeling indexes. The total number of nuclei per region was estimated from three animals (four sections each) by counting DAPI-labeled nuclei using the templates described above. Because of the high number of nuclei, the indicator fractionator method was used. The total number of astrocytes and oligodendrocytes from three animals (four sections each) was estimated by counting all APC/GFAP− and APC/GFAP+ cells using the templates described above. A nuclear index was derived by dividing the number of BrdU-labeled nuclei (counted as above) by the total number of nuclei for each region analyzed. The labeling index for BrdU-labeled astrocytes and BrdU-labeled oligodendrocytes was calculated by dividing the number of BrdU+/APC+/GFAP− or BrdU+/APC+/GFAP+ cells by the respective total.
Data analysis. Differences among experimental groups were evaluated by a one-way ANOVA. Comparisons were made between the 1 d and 4 week group for each template region examined and for the total number of cells per section, the percentage of total BrdU or the percentage of total nuclei between the cervical, thoracic, and lumbar regions. A Tukey–Kramer post hoc analysis was used for follow-up tests of between-group differences when the overall_F_ was found to be significant. For all statistical analyses, significance was accepted at a p value of 0.05.
RESULTS
Distribution, migration, and cell cycle of BrdU-incorporating cells
To determine where BrdU incorporation was most frequent and to assess whether BrdU-incorporating cells undergo migration, we injected a single dose of BrdU into animals that were killed at 1 hr or 1, 5, or 7 d postinjection (pi) (Experiment 1). BrdU is incorporated into the DNA of cells undergoing S-phase. The 1 hr pi time point labels cells that are undergoing DNA replication and do not have time to migrate from the site of incorporation. At this time point, cells were found predominantly as single cell profiles (Fig.1E). BrdU-labeled cells were found most commonly in the outer circumference of the gray and white matter. By 1 d pi, many BrdU-labeled cells were found in clusters of two or four cells, indicating cell division had taken place (Fig. 1F) and that BrdU incorporation remains detectable after multiple cell divisions.
For quantification of Experiment 1, the distribution of BrdU-labeled cells was broken down into ependymal, medial (<600 μm from the central canal), and outer (>600 μm from the central canal) spinal cord compartments. At 1, 5, and 7 d pi, the total number of BrdU-labeled cells per section increased. Because the bioavailability of BrdU persists for only 2 hr pi (Table1), an increase in the number of BrdU-labeled cells indicates cell division. There was an increase in BrdU-incorporating cells between 1 hr (4.1 nuclei per section) and 7 d (9.3 nuclei per section) of >100%, indicating that the doubling time of spinal cord progenitors is likely between 5 and 7 d. This cell-doubling time indicates a long cell cycle length. However, without multiple labeling (e.g., BrdU followed by3H-thymidine) of nuclei, the contribution of cell death cannot be ruled out. If significant cell death of BrdU-incorporating cells occurs, then cell cycle length may be overestimated by these data. At all time points, there was a gradient of BrdU-labeled cells with almost none residing in the ependymal layer, few in the medial annulus, and many in the outer annulus. Interestingly, cells do not appear to migrate between the medial and outer annuli during this period. These single pulse measurements can be compared to Experiment 2, in which animals were injected with BrdU once a day for 12 d and killed at 1 d or 4 weeks after the last injection (Table 1). Comparison of these experimental groups reveals that the incidence of BrdU-incorporating cells after a single BrdU injection closely matches the distributions seen at 1 d or 4 weeks after the last of 12 daily BrdU injections (Table 1). Collectively these data show that cell division at the ependymal layer of the central canal is rare and that the pattern of mitotic cells does not change, indicating limited migration between medial and outer annuli after cell division.
Table 1.
Quantification of nuclei after single or multiple injections of BrdU
| Average number of BrdU-labeled nuclei per section (% of total BrdU-labeled cells/section) | ||||||
|---|---|---|---|---|---|---|
| Experiment 1. Single BrdU injection | Experiment 2. 12 daily BrdU injections | |||||
| Time after last BrdU injection | 1 hr | 1 d | 5 d | 7 d | 1 d | 4 weeks |
| Ependyma | 0.0064 (0.2) | 0 (0) | 0.0069 (0.1) | 0.01 (0.1) | 1.27 (0.76) | 1.3 (0.93) |
| Medial annulus | 1.1 (26.8) | 1.7 (31.5) | 1.9 (25.0) | 2 (21.5) | 60.2 (36.0) | 42.0 (30.0) |
| Outer annulus | 3.0 (73.0) | 3.7 (68.5) | 5.7 (75.0) | 8.2 (88.2) | 105.9 (63.2) | 96.5 (69.0) |
| Total | 4.1 | 5.4 | 7.6 | 9.3 | 167.4 | 139.8 |
Morphological appearance of BrdU-labeled nuclei
BrdU-labeled nuclei within the spinal parenchyma at all levels could be separated into two distinct morphologies. First, elongated or ellipsoid, small nuclei were primarily associated with radial elements in the spinal white matter (Fig.2A). Secondly, a less common form was more rounded, large nuclei not typically associated with radial elements (Fig. 2B). Whereas the majority of cells were found in white matter of the outer annuli, one gray matter region, the substantia gelatinosa, contained numerous BrdU-positive nuclei (Fig. 2C). Dividing cells were also found in the ependymal layer surrounding the central canal (Fig.2D); however, this was a rare event. The presence of labeled cells near the central canal indicates that cell division in this population can be detected with the current labeling protocol. Labeled cells in the pial layers were also noted (Fig.2E), but their numbers were low and not included in the quantitative assessments. The distribution and morphological appearance of BrdU labeling were similar among all three spinal levels examined.
Fig. 2.
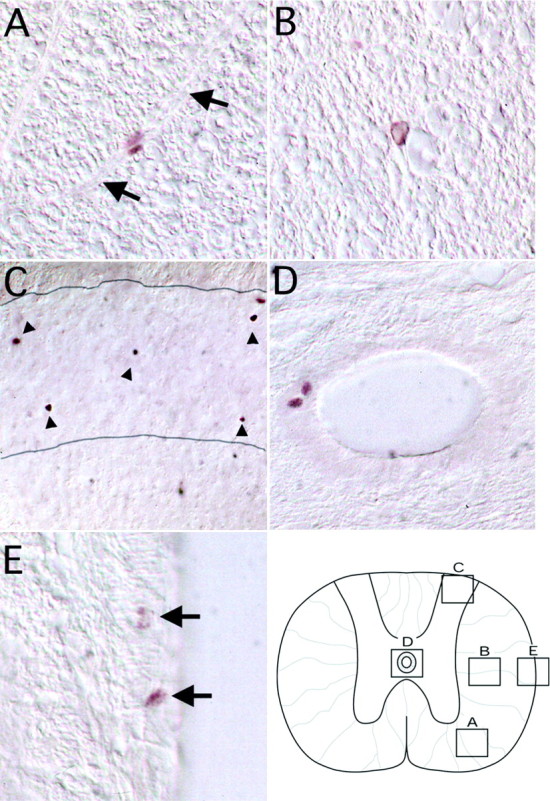
Immunohistochemical staining for BrdU in the adult cervical spinal cord. Photomicrographs are taken from 1 d after the last of 12 daily BrdU injections. BrdU-labeled nuclei were most commonly found in the outer white matter where they typically exhibited small, ellipsoid nuclei that were associated with radial elements (A, arrows indicate radial elements, 200×). A less common but distinct nuclear morphology was that of a rounded, large nucleus not associated with radial elements of the spinal cord (B, 200×). Dense BrdU labeling was also noted in the gray matter, particularly in the superficial dorsal horn (C, 100×). The substantia gelatinosa (delineated by_lines_) was the only gray matter region where clusters of BrdU-labeled nuclei were noted (arrowheads). BrdU labeling was rarely noted in the ependymal layer of the central canal, but occasional clusters of these cells could be detected (D, 400×). BrdU-labeled pial cells were also noted (E, arrows, 400×). The template maps the anatomical origin of photomicrographs A–E.
Quantitative assessment of BrdU distribution (Experiment 2)
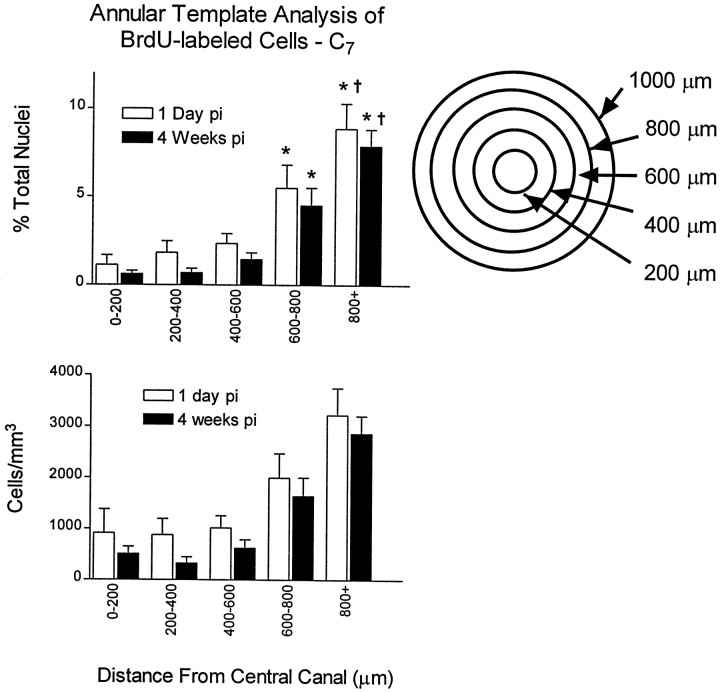
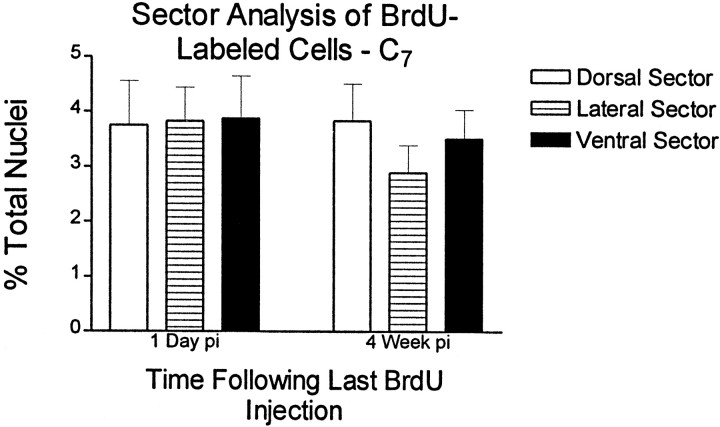
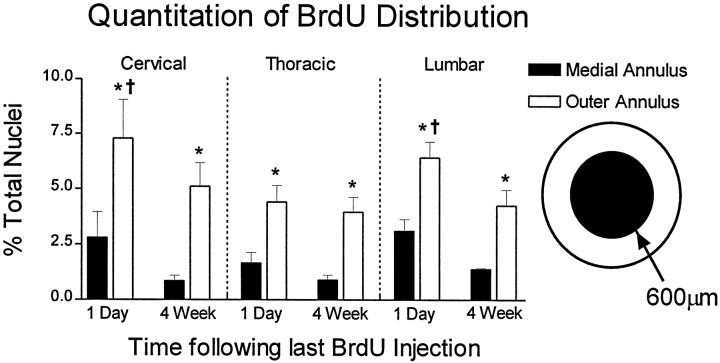
Repeated pulses of BrdU resulted in many BrdU-labeled nuclei per section. For example, in the cervical spinal cord, an average of 141 ± 14 and 133 ± 7 BrdU-incorporating nuclei were labeled per 40-μm-thick section at the 1 d and 4 week time points, respectively. These raw counts were used to calculate labeling indexes as described in Materials and Methods. The annulus template was used to count cells at 200 μm intervals starting at the central canal. Results of the radial analysis of the cervical spinal cord are presented diagramatically in Figure 3. The data confirm the qualitative observation that cell densities are greatest near the outer circumference of the spinal cord. This was true for all three spinal levels. For example, in the thoracic cord 1 d after the last BrdU injection, the density of BrdU cells <200 μm from the central canal is 525 ± 170 cells/mm3 or 0.59% of all nuclei. In medial regions of this level (600–800 μm from the central canal), the cell density is 1975 ± 536 cells/mm3 or 5.4% of all nuclei. Interestingly, cell densities at the various anatomical locations are very similar between the 1 d and 4 week pi time points, suggesting that BrdU-incorporating cells are not lost during this time period. Furthermore, radial migration of cells is not appreciable. When the cell densities are analyzed according to the sector template, no significant differences were noted between dorsal, lateral, or ventral sectors (Fig. 4). This sector analysis also confirms that cell populations are stable with regard to distribution between template regions and total density over time. This does not rule out the possibility of limited migration of cells within template regions or small subpopulations of cells migrating between delineated template zones. When BrdU distributions are compared between spinal levels, however, more BrdU labeling was found in the outer annuli of C7 or L2 sections when compared to the outer annuli of T8 (Fig. 5). Overall, the percentage of BrdU labeling in cervical, thoracic, and lumbar spinal cord is significantly higher in the outer versus the medial annuli, suggesting that this pattern exists throughout the spinal cord (Fig. 5).
Fig. 3.
Quantitation of BrdU-labeled nuclei using an annulus template. BrdU-positive nuclei were counted using a template that divides the spinal cord into five concentric annuli consisting of 200 μm steps beginning at the central canal. The number of BrdU-positive nuclei is expressed as a percentage of the total number of DAPI-labeled nuclei for each region. All comparisons are corrected for surface area. The index of BrdU increases from the medial to the outer annuli, indicating a gradient of cell division. In addition, only a small decrease in BrdU density is found between the 1 d and 4 week pi time period. This finding indicates that labeled cells persist for at least 4 weeks. (*p < 0.05 when compared to the 0–200 μm annulus, †p < 0.05 when compared to the 600–800 μm annulus.)
Fig. 4.
Quantitation of BrdU-labeled nuclei using a sector template. BrdU-positive nuclei were counted using a template that divides the spinal cord into radial sectors. Dorsal, lateral, and ventral sectors from C7 are compared. The number of BrdU-positive nuclei is expressed as a percentage of the total number of DAPI-labeled nuclei for each region. Comparisons are corrected for surface area. No statistical differences were noted among sectors. This finding indicates that cell division cannot be modeled by dorsal to ventral gradients. Non-pooled sectors were also compared, but no statistical differences were found (data not shown).
Fig. 5.
Comparison of the incidence of BrdU-positive nuclei at all three spinal segments. The gradient of BrdU-positive nuclei from the medial to outer annuli described for the cervical cord is also present at thoracic and lumbar levels. The number of BrdU-positive nuclei is expressed as a percentage of the total number of DAPI-labeled nuclei for each region, and comparisons are corrected for surface area. Note that the concentration of BrdU-labeled cells is initially higher in the outer annulus of cervical and lumbar versus that of the thoracic cord (†p < 0.05 when compared to the same region and time of the thoracic spinal cord). Importantly, cells persist at all levels with only a slight decrease in BrdU number between the 1 d and 4 week time points (*p < 0.01 when compared to the medial annulus of the same spinal level).
Quantification of BrdU-positive neurons
TUJ1 and NeuN immunoreactivity were used to assess the number of dividing neurons. Despite the high density of BrdU labeling in the substantia gelatinosa, a careful search for BrdU and NeuN or TUJ1 colocalization yielded no definitive associations. Twenty-two sections from 10 animals representing a total of 2200 BrdU-positive cells were examined for colocalization of NeuN and BrdU in the spinal gray matter. In several instances BrdU nuclei were intimately associated with small neurons in the superficial dorsal horn, but confocal microscopy revealed that these nuclei likely belonged to closely associated, or satellite cells. Therefore, no evidence for neurogenesis could be found in this or any other region of the spinal gray matter.
Quantification of BrdU-positive glial cells
Several glial-associated markers were chosen to classify BrdU-labeled glial cells. The presence of glial progenitor cells was determined by colocalization with the proteoglycan marker NG2. Immature and mature astrocytes were identified by two separate methods: expression of S-100β or the colocalization of APC and GFAP (APC/GFAP+). Astrocytes were morphologically distinguished from other glia by their limited cytoplasm and small nucleus. The presence of BrdU-incorporating oligodendrocytes was also detected by two separate methods. APC immunoreactivity in the absence of GFAP colocalization was used to detect immature or mature oligodendrocytes (APC/GFAP−). Mature oligodendrocytes were also labeled with the myelin factor RIP. Oligodendrocytes typically contained a round or oval cell body with a large nucleus. Microglial cells were labeled with OX-42 and vascular endothelial cells with RECA.
NG2 was abundantly expressed by BrdU-incorporating cells. Glial progenitors were located throughout the spinal cord and accounted for as much as 70% of the BrdU population (Fig.6A; see Fig.9C). NG2/BrdU-expressing cells tended to decrease in number between 1 d and 4 weeks pi, but this decrease did not reach significance (see Fig. 9). Cells expressing NG2 exhibited three basic morphologies, including a unipolar, bipolar, and a complex multipolar form. The most abundant NG2 morphology that also showed incorporation of BrdU was that of the bipolar cell (Fig. 6B, top). Complex, multipolar cells were found predominantly at the 4 week pi time point, but represented only a small portion of the BrdU/NG2 cell population (Fig. 6A,B, bottom). NG2 colabeled with ∼70% of cells that incorporated BrdU 1 hr pi (Fig. 6C). This finding indicates that the majority of dividing cells have an immature glial phenotype. In particular, NG2 was the only antigen coexpressed at 1 hr pi.
Fig. 6.
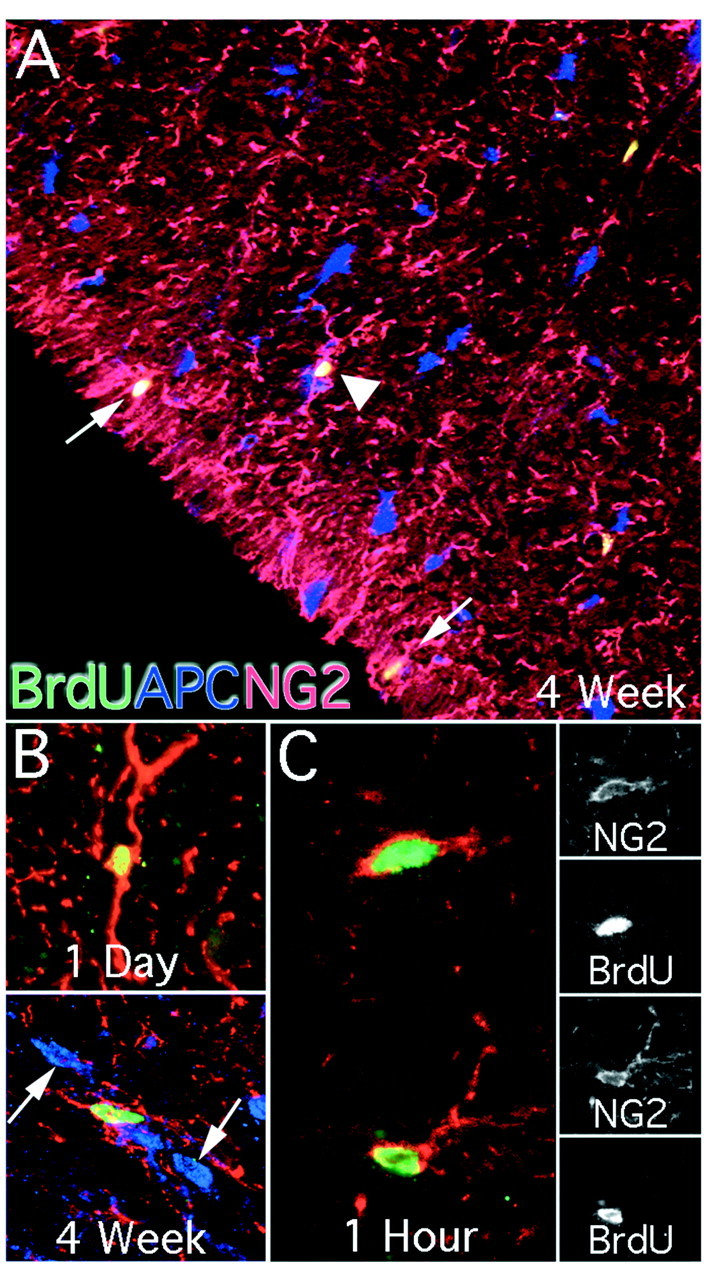
NG2 colocalization with BrdU in the adult spinal cord. NG2 immunoreactivity was used to classify BrdU-positive cells as glial progenitor cells. NG2 immunoreactivity was found throughout the spinal cord and labeled cells exhibited unipolar, bipolar, and multipolar cell morphologies in both gray and white matter. NG2 colocalized with BrdU more commonly than any other immunohistochemical marker. Throughout the spinal cord BrdU/NG2 colocalized cells were found that did not colabel with the glial marker APC (A, arrowhead, 100×). Many BrdU/NG2-colabeled cells were located near the pial layer with processes extending into this region (A, arrows). These cells were not found near the central canal. The predominant morphology was that of a bipolar cell (B, top, 400×). At 4 weeks, a small population had complex, multipolar processes (B, bottom, 400×). These cells did not colocalize with the mature glial marker APC. At 1 hr after a single pulse of BrdU, most BrdU-labeled cells colocalized with NG2 (C, 630×). Single confocal sections of each marker are presented for both NG2-immunoreactive cells.
Fig. 9.
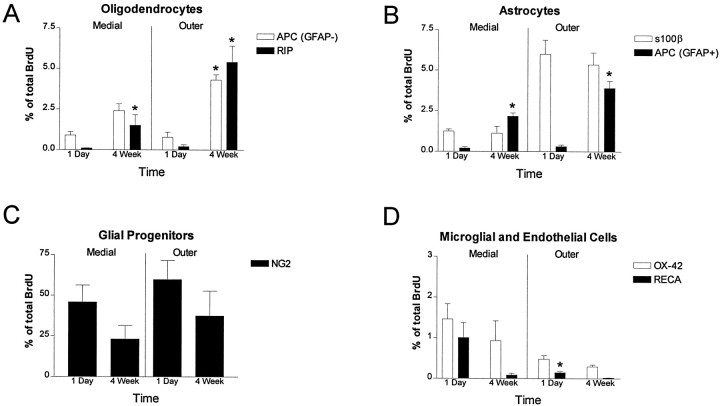
Quantitation of BrdU-labeled cells in the adult spinal cord. One hundred BrdU-positive cells from at least three sections from spinal levels C7, T8, and L2 were examined with a confocal microscope. Only nuclei that could be localized to one of the phenotypic markers throughout the z plane were considered positive. Medial measurements are taken from the medial annulus (0–600 μm from the central canal), and outer measurements are taken from the outer annulus (>600 μm from the central canal). Cells were counted as oligodendrocytes (A) if they were immunoreactive for RIP/BrdU or APC/GFAP−/BrdU. At all spinal levels the number of oligodendrocytes was low 1 d after the last BrdU injection, but significantly increased to 5% at 4 weeks. APC/GFAP+/BrdU-labeled astrocytes followed a similar progression (B) and significantly increased at the 4 week time point. S100β/BrdU-immunoreactive astrocytes (B) represented a unique population in that their numbers did not significantly increase over time. Note that 1 d after the last injection, the number of S100β/BrdU-immunoreactive astrocytes in the outer annulus is ∼6% and remains stable at 4 weeks (C). The most abundant population of BrdU-labeled cells were immunoreactive for NG2/BrdU. This population of glial progenitors was ∼50–60% of the total BrdU-labeled cells at 1 d. Although there was a trend toward decreased NG2/BrdU colabeling at 4 weeks, this did not reach statistical significance. A small portion of BrdU labeling was associated with microglial or microvascular markers (D). OX-42/BrdU-immunoreactive microglia and RECA/BrdU-immunoreactive endothelial cells accounted for <2% of the total BrdU, and these populations decreased significantly at 4 weeks. (*p < 0.01 when compared to the 1 d time point of the same phenotype).
BrdU-positive astrocytes that colabeled with either S-100β or APC/GFAP+ were found in all segments of the spinal cord. Colabeling was not found at the ependymal layer. S-100β-immunoreactive cells typically had small, oblong nuclei with limited cytoplasm and were most commonly found in the white matter of the outer annuli (Fig.7B; see Fig. 9B). Many of the S-100β-positive cells had long radial processes (Fig.7C). Interestingly, the number of cells that react for S-100β remained stable between 1 d and 4 weeks (see Fig.9B). Although this marker reacts with both mature and immature glial cells, APC/GFAP+ colocalization probably indicates a more differentiated cell (Ghandour et al., 1981). By the APC/GFAP+ colocalization criteria, astrocytes were rarely seen at the 1 d time point, whereas the number of these cells significantly increased at 4 weeks (see Fig. 9B). At 4 weeks these BrdU-labeled astrocytes accounted for 0.75% of the total APC/GFAP+ population.
Fig. 7.
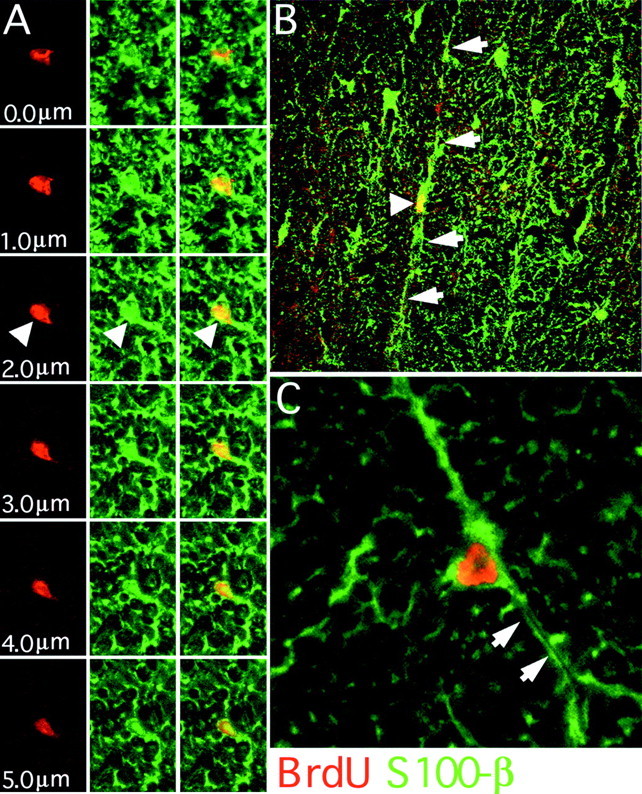
BrdU/S100β colocalization in the adult spinal cord. Confocal microscopy was used to determine the incidence of BrdU/S100β colocalization. A confocal _z_-series allows examination of nuclei through their entire _z_-axis in 1 μm steps (A, 400×). In this series a BrdU-positive nucleus (red only) is associated with S100β immunoreactivity (green only). These markers consistently colocalize (red and _green_merge) throughout the series (arrowheads). S100β astrocytes (arrowhead) often exhibited a radial morphology with long central to lateral processes (B,arrows, 200×). Occasionally BrdU-positive astrocytes had processes that contained a lumen associated with microvascular elements (C, arrows, 800×).
Both immature and mature oligodendrocytes were determined by counting the number of APC/GFAP− cells that colocalized with BrdU. These cells exhibited large round cell bodies with round nuclei (Fig.8A,C) and were easily distinguished from the small, ovoid cellular morphology of APC/GFAP+ astrocytes (Fig. 8A,B). APC-immunoreactive oligodendrocytes were rarely observed at 1 d pi. Similar to APC-positive astrocytes, these cells significantly increased in number between 1 d and 4 weeks pi (Fig.9A). At 4 weeks, these BrdU-labeled oligodendrocytes accounted for 0.82% of the total APC/GFAP− population. To determine if any of these cells could be mature myelinating cells, we also quantified the number of RIP-immunoreactive cells (Fig. 9A). Many cells were RIP-immunopositive, and in some instances these cells were closely associated with myelin profiles (Fig. 8D,E). Together these results suggest that oligodendrocytes born in the adult spinal cord exhibit a mature phenotype. Electron microscopy or coloabeling with myelin specific antigens will be necessary to determine if these BrdU-labeled cells produce myelin.
Fig. 8.
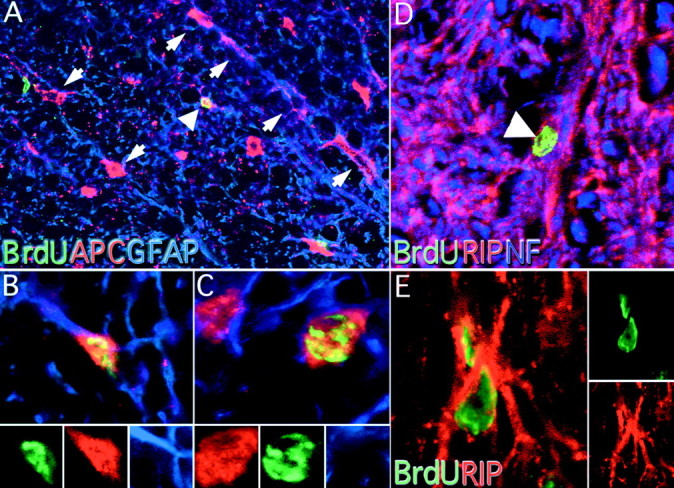
APC, GFAP, and RIP colocalization with BrdU in the adult spinal cord. APC and GFAP immunoreactivity were used to classify BrdU-positive cells into immature oligodendrocytes or astrocytes. APC immunoreactivity was found throughout the spinal cord, especially in the white matter where astrocytes and oligodendrocytes were found in radially oriented chains (A, arrows, 200×). Astrocytes were characterized by a small somal size and colocalization with GFAP (A, arrowhead;B, 800×). Oligodendrocytes were also detected with this method. Oligodendrocytes contained large, rounded cell bodies that did not colocalize with GFAP (C, 8000×). Separate color channels are presented at the bottom of B and_C_. Mature oligodendrocytes were identified by colocalization of BrdU and RIP immunoreactivity (D, arrowhead, 400×). Confocal microscopy was used to determine if RIP-positive cell bodies contained BrdU-positive nuclei (E, 800×). Separate confocal channels are presented to the right.
A small portion of BrdU labeling was associated with microglial or microvascular markers (Fig. 9D). OX-42/BrdU-immunoreactive microglia and RECA/BrdU-immunoreactive endothelial cells accounted for <2% of the total BrdU labeling, and these populations decreased significantly at 4 weeks. These data indicate that the microglial/endothelial populations are either dividing at a significantly lower rate than other glial populations or that cell division is much higher and that the BrdU signal is lost because of dilution.
DISCUSSION
In the brain, glial progenitors have been labeled with NG2 and are thought to persist throughout adulthood (Levine and Stallcup, 1987;Nishiyama et al., 1996; Reynolds and Hardy, 1997; Keirstead et al., 1998). However, the in vivo proliferation rate of these cells has not been determined for the adult brain. The division rate of adult spinal cord progenitors is thought to be low (Adrian and Walker, 1962) with increased mitosis after growth factor stimulation or injury (Bruni et al., 1985; Prayoonwiwat and Rodriguez, 1993; Frisen et al., 1995; Beattie et al., 1997; McTigue et al., 1998). Our data provide evidence of an active progenitor population that persists after postnatal glial cell formation is thought to have ceased. The current work shows a direct correlation between immature NG2-expressing cells and a proliferative cell population in the outer annuli (>600 μm from the central canal) of the adult spinal cord. The data indicate that 0.6–0.7% of the glial cells in the adult spinal cord incorporate BrdU over a 4 week period and that cell division of glial progenitors is a common feature of this process.
Persistence of glial progenitors after mitosis in the spinal cord
Adrian and Walker (1962) demonstrated that a single day of3H-thymidine injections in the adult mouse (six single injections given at 4 hr intervals) resulted in 4.35 mitotic profiles per horizontal section (7 μm) at 24 hr after the first injection. Although many of these cells resembled glial cells morphologically, only 25% of labeled nuclei persisted longer than 4 d after the first injection. It was concluded that newborn glial cells were transient and that a significant glial or neuronal renewal system in the adult spinal cord does not exist. These data are surprising considering data in the brain demonstrating glial cell division in adult animals (Altman, 1963; Hommes and Leblond, 1967;Mares et al., 1975; Kaplan and Hinds, 1980; McCarthy and Leblond, 1988). In the present experiments, 12 daily injections of BrdU resulted in over 100 labeled nuclei per cross section (40 μm). In the outer annulus, this represents up to 8% of the total nuclei. The majority of these cells incorporate BrdU and coincidentally express NG2, indicating that these cells are progenitors. One reason why we observe the persistence of labeled cells not seen in previous studies in the adult spinal cord may be methodological. Adrian and Walker (1962) reported a high incidence of pyknotic nuclei in their studies that might reflect cell death as a result of repeated3H-thymidine dosing over 1 d. This result could explain the initially high incidence of nuclear labeling that was followed by a rapid loss of labeled cells. Using the current method (single pulses of BrdU over 12 d), we were able to detect relatively high levels of cell division and could demonstrate that these cells persist for at least 1 month. In addition, pyknotic nuclei were very rare.
Glial-restricted progenitors divide more slowly in the adult spinal cord
The majority of BrdU-labeled nuclei are glial-restricted progenitors that express NG2. Interestingly, BrdU/NG2-colabeled cells exhibit similar morphologies to the three described by Wren et al. (1992) for O2-A cells in vitro. The predominant form is a bipolar cell thought to be a proliferative perinatal progenitor. In the present experiments, the majority of BrdU-labeled cells exhibit this morphology, indicating that this cell remains mitotically active in the adult in vivo. We also found BrdU/NG2 colabeled cells that resembled the unipolar and oligodendrocyte-like morphologies described as adult progenitors. The 1 hr labeling data (Experiment 1) suggest a long cell cycle of 5–7 d for BrdU-colabeled NG2 cells that agrees with that measured for adult glial progenitor cells in vitro(65 ± 18 hr; Wren et al., 1992). However, without multiple labeling of nuclei (e.g., BrdU followed by3H-thymidine) the contribution of cell death or asymmetric cell division cannot be calculated (Takahashi et al., 1996).
Majority of dividing progenitors reside in the outer circumference of the spinal cord
Our data reveal that there is no statistical difference in the rate of division or persistence of dividing cells between dorsal, lateral, or ventral regions. However, there was a striking regional gradient between the medial and outer aspects of the spinal cord. This finding does not coincide with a blunt demarcation between gray and white matter. When the analysis was broken down into annuli 200 μm in width, there was a significant increase between the 800 μm annulus and the 1000 μm annulus. Because both of these annuli consist primarily of white matter, this finding suggests that cell division is highest in outer versus more medial white matter zones.
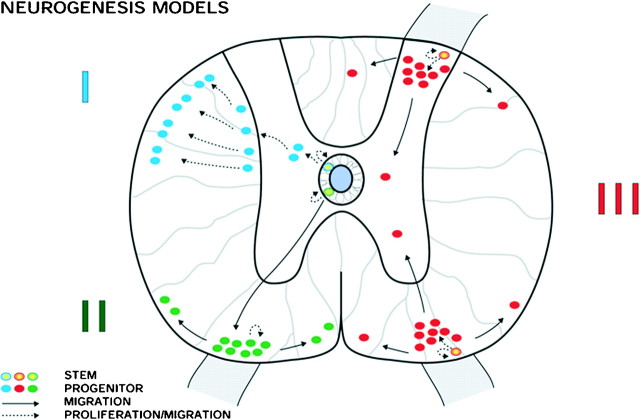
The results of our single BrdU injection paradigm indicate that BrdU-labeled cells do not migrate extensively between template regions. This does not rule out the possibility of limited migration within the template regions we analyzed. However, this finding indicates that BrdU-labeled cells do not commonly migrate from the central canal as previously described for the early postnatal spinal cord (Fig.10, I). We have diagrammed two alternative models that are in part supported by our data. (Fig. 10, II, III). In model II, a stem cell exists at the ependymal layer that divides asymmetrically. A daughter cell then migrates to the outer circumference of the spinal cord where it exists as a bipotent or glial progenitor and begins to divide more rapidly. This model separates the slowly dividing stem cell at the central canal from a proliferative progenitor that migrates first and then divides in the outer annuli of the spinal cord. An alternative possibility, model III, predicts that a glial progenitor and stem cell population may exist in the outer circumference of the spinal cord where cell division is more common. This model functionally separates ependymal cell division from the proliferative zone of the outer annuli.
Fig. 10.
Models of stem cell proliferation and migration in the intact adult spinal cord. Three models illustrate how dividing stem cells may give rise to progenitors that migrate and proliferate. Model I corresponds to early postnatal gliogenesis. The current data suggest that in the adult, dividing cells are located primarily in the outer circumference of the spinal cord, and therefore Models II and III more likely reflect adult gliogenesis in the intact spinal cord.
Do dividing adult spinal cord cells form mature phenotypes?
Recently, it has been postulated that stem cells in the brain express GFAP (Doetsch et al., 1999). In the present study we did not observe GFAP colocalization at the ependymal layer. However, ∼10% of the BrdU-labeled cells exhibited a radial morphology and expressed the glial marker S-100β. Interestingly, a shift in cell distribution did not occur between 1 d and 4 weeks after the last BrdU injection. These data do not delineate between a stable, maturing astrocytic population or one that is transiently expressing an astrocytic phenotype. In addition, it has been shown that intrafasiculur oligodendrocytes express S-100β (Korr et al., 1994). Future experiments are required to determine the maturity of these cells and the role they may play in the spinal cord.
Gensert and Goldman (1996) have proposed that clonal populations of dividing progenitors exist in the subcortical white matter of the adult forebrain. Virally labeled cells were initially distributed uniformly within the subcortical white matter, but by 30 d cells were located in clusters, indicating continued division with limited migration. This pattern is strikingly similar to our results in the outer annuli of the adult spinal cord. In Gensert and Goldman's studies, nearly 20% of labeled cells expressed the mature oligodendrocyte marker RIP, but none expressed astrocytic markers. The authors concluded that a progenitor existed with the potential for myelin formation. In contrast to the subcortical white matter, our findings suggest that adult spinal cord glial progenitors produce both astrocytes and oligodendrocytes. S-100β/BrdU-colabeled cells were detected at 1 d pi, and this population was maintained at 4 weeks post pi, indicating the continued presence of dividing astrocytes. Importantly, no evidence for mature astrocytes or oligodendrocytes was observed at 1 d after the last BrdU injection. However, by 4 weeks pi, nearly 5% of dividing cells expressed either mature or immature markers associated with oligodendrocytes, and 3–5% of the total BrdU-labeled cells expressed mature astrocyte markers. Thus, progenitor proliferation could account for a modest turnover of spinal astrocytes and oligodendrocytes during the life of the rat. Future experiments are required to determine if the differentiated cells observed here arise from glial restricted progenitor cells or a combination of astrocyte restricted and oligodendrocyte restricted progenitors.
Ontogeny of spinal tracts
One possible explanation for the persistent birth of glial cells in the outer annuli of the spinal cord is the presence of late-developing axonal tracts (Barres and Raff, 1993, 1994; Burne et al., 1996). The outer annuli, where BrdU incorporation is highest, contain the dorsal and ventral spinocerebellar tract (Ashwell and Zhang, 1992). However, these tracts are complete by postnatal day 7 (Arsenio Nunes and Sotelo, 1985). Two tracts continue to develop postnatally for up to 2 weeks, specifically the corticospinal tract and the rubrospinal tract (Kudo et al., 1993). These tracts travel in distinct regions of the spinal cord (Joosten et al., 1987; Antal et al., 1992), but there does not seem to be a higher density of cell division in either of these regions.
Conclusions
The present study demonstrates that cell division occurs in glial progenitors throughout the adult spinal cord. Importantly, these data demonstrate that BrdU-labeled cells persist for at least 4 weeks after dividing and that up to 10% of these cells differentiate into mature astroglia and oligodendroglia. In the future, experimental manipulation of adult spinal progenitor populations in vivo should provide a clearer understanding of how these cells may be induced to proliferate, migrate, and differentiate to promote repair of the spinal cord.
Footnotes
This work was supported by grants from the Christopher Reeve Paralysis Foundation, The Hollfelder Foundation, The Lookout Fund, and the National Institute on Aging. J.W. is a fellow of the National Brookdale Foundation, and A.E.P. and J.W. are supported by a grant from the Sam and Rose Stein Institute for Research on Aging (San Diego, CA). This work was also supported by a contract (NO1-NS-6–2348) from the National Institutes of Health. We greatly appreciate Dr. Eleni Markakis for her expert contributions to figures in this manuscript and Dr. Eugene Brandon and Mary Lynn Gage's helpful editorial assistance. The NG2 antibody was a generous gift of Dr. William Stallcup. We also gratefully acknowledge the excellent technical assistance of Linda Kitabyashi and Steve Forbes.
Correspondence should be addressed to Dr. Fred H. Gage, The Salk Institute, Laboratory of Genetics, 10010 North Torrey Pines Road, La Jolla, CA 92037. E-mail: fgage@salk.edu.
REFERENCES
- 1.Adrian EK, Jr, Walker BE. Incorporation of thymidine-H3 by cells in normal and injured mouse spinal cord. J Neuropathol Exp Neurol. 1962;21:597–609. doi: 10.1097/00005072-196210000-00007. [DOI] [PubMed] [Google Scholar]
- 2.Altman J. Autoradiographic investigation of cell proliferation in the brains of rats and cats. Anat Rec. 1963;145:573–591. doi: 10.1002/ar.1091450409. [DOI] [PubMed] [Google Scholar]
- 3.Antal M, Sholomenko GN, Moschovakis AK, Storm-Mathisen J, Heizmann CW, Hunziker W. The termination pattern and postsynaptic targets of rubrospinal fibers in the rat spinal cord: a light and electron microscopic study. J Comp Neurol. 1992;325:22–37. doi: 10.1002/cne.903250103. [DOI] [PubMed] [Google Scholar]
- 4.Arsenio Nunes ML, Sotelo C. Development of the spinocerebellar system in the postnatal rat. J Comp Neurol. 1985;237:291–306. doi: 10.1002/cne.902370302. [DOI] [PubMed] [Google Scholar]
- 5.Ashwell KW, Zhang LL. Ontogeny of afferents to the fetal rat cerebellum. Acta Anat (Basel) 1992;145:17–23. doi: 10.1159/000147336. [DOI] [PubMed] [Google Scholar]
- 6.Barres BA, Raff MC. Proliferation of oligodendrocyte precursor cells depends on electrical activity in axons. Nature. 1993;361:258–260. doi: 10.1038/361258a0. [DOI] [PubMed] [Google Scholar]
- 7.Barres BA, Raff MC. Control of oligodendrocyte number in the developing rat optic nerve. Neuron. 1994;12:935–942. doi: 10.1016/0896-6273(94)90305-0. [DOI] [PubMed] [Google Scholar]
- 8.Beattie MS, Bresnahan JC, Komon J, Tovar CA, Van Meter M, Anderson DK, Faden AI, Hsu CY, Noble LJ, Salzman S, Young W. Endogenous repair after spinal cord contusion injuries in the rat. Exp Neurol. 1997;148:453–463. doi: 10.1006/exnr.1997.6695. [DOI] [PubMed] [Google Scholar]
- 9.Bhat RV, Axt KJ, Fosnaugh JS, Smith KJ, Johnson KA, Hill DE, Kinzler KW, Baraban JM. Expression of the APC tumor suppressor protein in oligodendroglia. Glia. 1996;17:169–174. doi: 10.1002/(SICI)1098-1136(199606)17:2<169::AID-GLIA8>3.0.CO;2-Y. [DOI] [PubMed] [Google Scholar]
- 10.Boyes BE, Kim SU, Lee V, Sung SC. Immunohistochemical co-localization of S-100β and the glial fibrillary acidic protein in rat brain. Neuroscience. 1986;17:857–865. doi: 10.1016/0306-4522(86)90050-3. [DOI] [PubMed] [Google Scholar]
- 11.Brakeman JS, Gu SH, Wang XB, Dolin G, Baraban JM. Neuronal localization of the Adenomatous polyposis coli tumor suppressor protein. Neuroscience. 1999;91:661–672. doi: 10.1016/s0306-4522(98)00605-8. [DOI] [PubMed] [Google Scholar]
- 12.Bruni JE, Del Bigio MR, Clattenburg RE. Ependyma: normal and pathological. A review of the literature. Brain Res. 1985;356:1–19. doi: 10.1016/0165-0173(85)90016-5. [DOI] [PubMed] [Google Scholar]
- 13.Burne JF, Staple JK, Raff MC. Glial cells are increased proportionally in transgenic optic nerves with increased numbers of axons. J Neurosci. 1996;16:2064–2073. doi: 10.1523/JNEUROSCI.16-06-02064.1996. [DOI] [PMC free article] [PubMed] [Google Scholar]
- 14.Chiasson BJ, Tropepe V, Morshead CM, van der Kooy D. Adult mammalian forebrain ependymal and subependymal cells demonstrate proliferative potential, but only subependymal cells have neural stem cell characteristics. J Neurosci. 1999;19:4462–4471. doi: 10.1523/JNEUROSCI.19-11-04462.1999. [DOI] [PMC free article] [PubMed] [Google Scholar]
- 15.Doetsch F, Caille I, Lim DA, Garcia-Verdugo JM, Alvarez-Buylla A. Subventricular zone astrocytes are neural stem cells in the adult mammalian brain. Cell. 1999;97:703–716. doi: 10.1016/s0092-8674(00)80783-7. [DOI] [PubMed] [Google Scholar]
- 16.Espinosa de los Monteros A, Zhao P, Huang C, Pan T, Chang R, Nazarian R, Espejo D, de Vellis J. Transplantation of CG4 oligodendrocyte progenitor cells in the myelin-deficient rat brain results in myelination of axons and enhanced oligodendroglial markers. J Neurosci Res. 1997;50:872–887. doi: 10.1002/(SICI)1097-4547(19971201)50:5<872::AID-JNR23>3.0.CO;2-1. [DOI] [PubMed] [Google Scholar]
- 17.Franklin RJ, Blakemore WF. Transplanting oligodendrocyte progenitors into the adult CNS. J Anat. 1997;190:23–33. doi: 10.1046/j.1469-7580.1997.19010023.x. [DOI] [PMC free article] [PubMed] [Google Scholar]
- 18.Friedman B, Hockfield S, Black JA, Woodruff KA, Waxman SG. In situ demonstration of mature oligodendrocytes and their processes: an immunocytochemical study with a new monoclonal antibody, Rip. Glia. 1989;2:380–390. doi: 10.1002/glia.440020510. [DOI] [PubMed] [Google Scholar]
- 19.Frisen J, Johansson CB, Torok C, Risling M, Lendahl U. Rapid, widespread, and long-lasting induction of nestin contributes to the generation of glial scar tissue after CNS injury. J Cell Biol. 1995;131:453–464. doi: 10.1083/jcb.131.2.453. [DOI] [PMC free article] [PubMed] [Google Scholar]
- 20.Garcia-Verdugo JM, Doetsch F, Wichterle H, Lim DA, Alvarez-Buylla A. Architecture and cell types of the adult subventricular zone: in search of the stem cells. J Neurobiol. 1998;36:234–248. doi: 10.1002/(sici)1097-4695(199808)36:2<234::aid-neu10>3.0.co;2-e. [DOI] [PubMed] [Google Scholar]
- 21.Gensert JM, Goldman JE. In vivo characterization of endogenous proliferating cells in adult rat subcortical white matter. Glia. 1996;17:39–51. doi: 10.1002/(SICI)1098-1136(199605)17:1<39::AID-GLIA4>3.0.CO;2-2. [DOI] [PubMed] [Google Scholar]
- 22.Ghandour MS, Labourdette G, Vincendon G, Gombos G. A biochemical and immunohistological study of S100 protein in developing rat cerebellum. Dev Neurosci. 1981;4:98–109. doi: 10.1159/000112745. [DOI] [PubMed] [Google Scholar]
- 23.Hammang JP, Archer DR, Duncan ID. Myelination following transplantation of EGF-responsive neural stem cells into a myelin-deficient environment. Exp Neurol. 1997;147:84–95. doi: 10.1006/exnr.1997.6592. [DOI] [PubMed] [Google Scholar]
- 24.Hommes OR, Leblond CP. Mitotic division of neuroglia in the normal adult rat. J Comp Neurol. 1967;129:269–278. doi: 10.1002/cne.901290304. [DOI] [PubMed] [Google Scholar]
- 25.Jhaveri S, Erzurumlu RS, Friedman B, Schneider GE. Oligodendrocytes and myelin formation along the optic tract of the developing hamster: an immunohistochemical study using the Rip antibody. Glia. 1992;6:138–148. doi: 10.1002/glia.440060208. [DOI] [PubMed] [Google Scholar]
- 26.Johansson CB, Momma S, Clarke DL, Risling M, Lendahl U, Frisen J. Identification of a neural stem cell in the adult mammalian central nervous system. Cell. 1999;96:25–34. doi: 10.1016/s0092-8674(00)80956-3. [DOI] [PubMed] [Google Scholar]
- 27.Joosten EA, Gribnau AA, Dederen PJ. An anterograde tracer study of the developing corticospinal tract in the rat: three components. Brain Res. 1987;433:121–130. doi: 10.1016/0165-3806(87)90070-8. [DOI] [PubMed] [Google Scholar]
- 28.Kaplan MS, Hinds JW. Gliogenesis of astrocytes and oligodendrocytes in the neocortical grey and white matter of the adult rat: electron microscopic analysis of light radioautographs. J Comp Neurol. 1980;193:711–727. doi: 10.1002/cne.901930309. [DOI] [PubMed] [Google Scholar]
- 29.Keirstead HS, Levine JM, Blakemore WF. Response of the oligodendrocyte progenitor cell population (defined by NG2 labeling) to demyelination of the adult spinal cord. Glia. 1998;22:161–170. [PubMed] [Google Scholar]
- 30.Korr H, Horsmann C, Schurmann M, Delaunoy JP, Labourdette G. Problems encountered when immunocytochemistry is used for quantitative glial cell identification in autoradiographic studies of cell proliferation in the brain of the unlesioned adult mouse. Cell Tissue Res. 1994;278:85–95. doi: 10.1007/BF00305780. [DOI] [PubMed] [Google Scholar]
- 31.Kudo N, Furukawa F, Okado N. Development of descending fibers to the rat embryonic spinal cord. Neurosci Res. 1993;16:131–141. doi: 10.1016/0168-0102(93)90080-a. [DOI] [PubMed] [Google Scholar]
- 32.Laeng P, Molthagen M, Yu EG, Bartsch U. Transplantation of oligodendrocyte progenitor cells into the rat retina: extensive myelination of retinal ganglion cell axons. Glia. 1996;18:200–210. doi: 10.1002/(SICI)1098-1136(199611)18:3<200::AID-GLIA4>3.0.CO;2-2. [DOI] [PubMed] [Google Scholar]
- 33.Lee MK, Tuttle JB, Rebhun LI, Cleveland DW, Frankfurter A. The expression and posttranslational modification of a neuron-specific β-tubulin isotype during chick embryogenesis. Cell Motil Cytoskel. 1990;17:118–132. doi: 10.1002/cm.970170207. [DOI] [PubMed] [Google Scholar]
- 34.Levine JM, Stallcup WB. Plasticity of developing cerebellar cells in vitro studied with antibodies against the NG2 antigen. J Neurosci. 1987;7:2721–2731. doi: 10.1523/JNEUROSCI.07-09-02721.1987. [DOI] [PMC free article] [PubMed] [Google Scholar]
- 35.Mares V, Lodin Z, Jilek M. An estimate of the number of cells arising by division in mouse cerebral hemispheres from age one to 12 months: an autoradiographic study of DNA synthesis. J Comp Neurol. 1975;161:471–482. doi: 10.1002/cne.901610311. [DOI] [PubMed] [Google Scholar]
- 36.McCarthy GF, Leblond CP. Radioautographic evidence for slow astrocyte turnover and modest oligodendrocyte production in the corpus callosum of adult mice infused with 3H-thymidine. J Comp Neurol. 1988;271:589–603. doi: 10.1002/cne.902710409. [DOI] [PubMed] [Google Scholar]
- 37.McTigue DM, Horner PJ, Stokes BT, Gage FH. Neurotrophin-3 and brain-derived neurotrophic factor induce oligodendrocyte proliferation, migration, and myelination in the contused adult rat spinal cord. J Neurosci. 1998;18:5354–5365. doi: 10.1523/JNEUROSCI.18-14-05354.1998. [DOI] [PMC free article] [PubMed] [Google Scholar]
- 38.Morshead CM, Reynolds BA, Craig CG, McBurney MW, Staines WA, Morassutti D, Weiss S, van der Kooy D. Neural stem cells in the adult mammalian forebrain: a relatively quiescent subpopulation of subependymal cells. Neuron. 1994;13:1071–1082. doi: 10.1016/0896-6273(94)90046-9. [DOI] [PubMed] [Google Scholar]
- 39.Nishiyama A, Lin XH, Giese N, Heldin CH, Stallcup WB. Colocalization of NG2 proteoglycan and PDGF alpha-receptor on O2A progenitor cells in the developing rat brain. J Neurosci Res. 1996;43:299–314. doi: 10.1002/(SICI)1097-4547(19960201)43:3<299::AID-JNR5>3.0.CO;2-E. [DOI] [PubMed] [Google Scholar]
- 40.Prayoonwiwat N, Rodriguez M. The potential for oligodendrocyte proliferation during demyelinating disease. J Neuropathol Exp Neurol. 1993;52:55–63. doi: 10.1097/00005072-199301000-00007. [DOI] [PubMed] [Google Scholar]
- 41.Raff MC, Miller RH, Noble M. A glial progenitor cell that develops in vitro into an astrocyte or an oligodendrocyte depending on culture medium. Nature. 1983;303:390–396. doi: 10.1038/303390a0. [DOI] [PubMed] [Google Scholar]
- 42.Reynolds R, Hardy R. Oligodendroglial progenitors labeled with the O4 antibody persist in the adult rat cerebral cortex in vivo. J Neurosci Res. 1997;47:455–470. doi: 10.1002/(sici)1097-4547(19970301)47:5<455::aid-jnr1>3.0.co;2-g. [DOI] [PubMed] [Google Scholar]
- 43.Sarnat HB, Nochlin D, Born DE. Neuronal nuclear antigen (NeuN): a marker of neuronal maturation in early human fetal nervous system. Brain Dev. 1998;20:88–94. doi: 10.1016/s0387-7604(97)00111-3. [DOI] [PubMed] [Google Scholar]
- 44.Senda T, Iino S, Matsushita K, Matsumine A, Kobayashi S, Akiyama T. Localization of the adenomatous polyposis coli tumour suppressor protein in the mouse central nervous system. Neuroscience. 1998;83:857–866. doi: 10.1016/s0306-4522(97)00459-4. [DOI] [PubMed] [Google Scholar]
- 45.Shihabuddin LS, Ray J, Gage FH. FGF-2 is sufficient to isolate progenitors found in the adult mammalian spinal cord. Exp Neurol. 1997;148:577–586. doi: 10.1006/exnr.1997.6697. [DOI] [PubMed] [Google Scholar]
- 46.Takahashi T, Nowakowski RS, Caviness VS. The leaving or Q fraction of the murine cerebral proliferative epithelium: a general model of neocortical neuronogenesis. J Neurosci. 1996;16:6183–6196. doi: 10.1523/JNEUROSCI.16-19-06183.1996. [DOI] [PMC free article] [PubMed] [Google Scholar]
- 47.Warrington AE, Barbarese E, Pfeiffer SE. Stage specific, (O4+GalC-) isolated oligodendrocyte progenitors produce MBP+ myelin in vivo. Dev Neurosci. 1992;14:93–97. doi: 10.1159/000111652. [DOI] [PubMed] [Google Scholar]
- 48.Weiss S, Dunne C, Hewson J, Wohl C, Wheatley M, Peterson AC, Reynolds BA. Multipotent CNS stem cells are present in the adult mammalian spinal cord. J Neurosci. 1996;16:7599–7609. doi: 10.1523/JNEUROSCI.16-23-07599.1996. [DOI] [PMC free article] [PubMed] [Google Scholar]
- 49.Wolf HK, Buslei R, Schmidt-Kastner R, Schmidt-Kastner PK, Pietsch T, Wiestler OD, Bluhmke I. NeuN: a useful neuronal marker for diagnostic histopathology. J Histochem Cytochem. 1996;44:1167–1171. doi: 10.1177/44.10.8813082. [DOI] [PubMed] [Google Scholar]
- 50.Wren D, Wolswijk G, Noble M. In vitro analysis of the origin and maintenance of O-2Aadult progenitor cells. J Cell Biol. 1992;116:167–176. doi: 10.1083/jcb.116.1.167. [DOI] [PMC free article] [PubMed] [Google Scholar]
