Dendritic Dynamics In Vivo Change during Neuronal Maturation (original) (raw)
Abstract
In vivo imaging of optic tectal neurons in the intact_Xenopus_ tadpole permits direct observation of the structural dynamics that occur during dendritic arbor formation. Based on images of single DiI-labeled neurons collected at daily intervals over a period of 6 d, we divided tectal cell development into three phases according to the total length of the dendritic arbor. During phase 1, the cell differentiates from a neuroepithelial cell type and extends an axon out of the tectum. The total dendritic branch length (TDBL) is <100 μm. During phase 2, when TDBL is 100–400 μm, the dendritic arbor grows rapidly. During phase 3, when TDBL is >400 μm, the dendritic arbor grows slowly and appears stable. Neurons at different positions along the rostrocaudal developmental axis of the tectum were imaged at 2 hr intervals over 6 hr and at 24 hr intervals over several days. Images collected at 2 hr intervals were analyzed to determine rates of branch additions and retractions. Morphologically complex, phase 3 neurons show half the rate of branch additions and retractions as phase 2 neurons. Therefore, rapidly growing neurons have dynamic dendritic arbors, and slower-growing neurons are structurally stable. The change in growth rate and dendritic arbor dynamics from phase 2 to phase 3 correlates with the developmental increase in synaptic strength in neurons located along the rostrocaudal tectal axis. The data are consistent with the idea that strong synaptic inputs stabilize dendritic arbor structures and that weaker synaptic inputs are permissive for a greater degree of dynamic rearrangements and a faster growth rate in the dendritic arbor.
Keywords: activity-dependent, Xenopus, dendrite, retinotectal, glutamate receptor, plasticity
The process of dendritic arbor development and the mechanisms that control it are not fully understood. Several studies have suggested that synaptic inputs promote dendritic arbor development and stability. The dendritic fields of neurons in many sensory systems are oriented with respect to their afferent inputs (Greenough and Chang, 1988; Katz and Constantine-Paton, 1988; Katz et al., 1989; Schweitzer, 1991; Kossel et al., 1995), likely because of either directed growth or stabilization of local dendrites by afferents. In dissociated cell cultures, afferents appear to operate locally to sculpt the dendritic arbor (Mattson et al., 1988;Kossel et al., 1997). Time-lapse images of developing axons and dendrites in cultured hippocampal slices suggest that contacts between presynaptic and postsynaptic elements stabilized dendritic branches (Dailey and Smith, 1996; Ziv and Smith, 1996). Manipulations of excitatory or inhibitory transmitter systems in brain slice preparations and in vivo lead to changes in dendritic arbor development (Kalb, 1994; Vogel and Prittie, 1995; McAllister et al., 1996; Sanes and Hafidi, 1996; Rajan and Cline, 1998), suggesting that the influence of afferents is not based solely on physical contact. Information on the time course of development of the dendritic arbor in intact tissue has for the most part been generated from static images of neurons collected at different stages of development, which do not permit one to determine dynamic structural changes that contribute to neuronal development. In vivo time-lapse observations of dendritic growth during synaptogenesis would provide valuable information on the potential mechanisms controlling dendritic arbor development.
The optic tectum of Xenopus laevis is organized along a rostrocaudal maturational gradient, such that neurons in rostral and lateral tectum are chronologically older and morphologically more complex than those located in the younger caudomedial pole of the tectum (Straznicky and Gaze, 1972; Lázár, 1973). The synaptic physiology of tectal neurons also follows a maturational program that follows the rostrocaudal developmental gradient (Wu et al., 1996). Young neurons in caudal tectum receive glutamatergic retinal synapses that are mediated principally by the NMDA type glutamate receptor (NMDA R). As the neurons mature, their somata are displaced rostrolaterally by newly generated cells in the caudomedial germinal zone (Straznicky and Gaze, 1972), and their retinotectal synapses strengthen as a result of the addition of AMPA R-mediated currents (Wu et al., 1996). Therefore, both synaptic strength and morphological complexity increase along the rostrocaudal development axis in the tectum, and these two aspects of neuronal maturation are concurrent (Wu et al., 1996; Rajan and Cline, 1998; Wu and Cline, 1998). In experiments correlating the strength of synaptic inputs with the sensitivity of the dendritic arbor development to glutamate receptor blockade, dendritic arbor growth was most severely impaired early during development of the arbor when glutamatergic synapses were mediated principally by NMDA R. More mature neurons were less sensitive to glutamate receptor blockade (Rajan and Cline, 1998). These data suggest that more mature neurons with strong synaptic inputs have more stable dendritic arbors than younger neurons, which receive weaker inputs.
To determine whether dendritic arbor stability correlates with the strength of synaptic inputs, we collected in vivo time-lapse images of single optic tectal neurons at different locations along the rostrocaudal axis of the tectum over periods of 3–6 d. We find that the dynamic rearrangements of the developing tectal cell dendritic arbors change as the neurons mature; younger neurons with simple dendritic arbors are in a rapid growth phase and exhibit rapid dendritic arbor dynamics. More mature neurons with complex dendritic arbors grow more slowly and are significantly less dynamic. These observations indicate that in vivo dendritic arbor dynamics in individual neurons change in a manner that is correlated with the strength of their synaptic inputs. The data support the idea that strong synaptic inputs stabilize dendritic arbor structure.
MATERIALS AND METHODS
Image acquisition. Albino Xenopus laevis tadpoles were obtained by matings induced by human chorionic gonadotropin injections. Single optic tectal neurons in stage 39–48 tadpoles (Nieuwkoop and Faber, 1956) were fluorescently labeled by 1,1′-dioctadecyl-3,3,3′,3′-tetramethylindocarbocyanine perchlorate (DiI) iontophoresis (0.02% in absolute ethanol; Molecular Probes, Eugene, OR), as described in detail previously (Cline et al., 1999). Briefly, 1–10 nA of positive current were applied in 3–10 pulses of 200 msec duration. This results in a tiny crystal deposit of DiI near the cell body. The dye intercalates into the plasma membrane and rapidly labels the entire plasma membrane, based on observations that fine filopodia at distal tips of dendrites and axons are dye-labeled. Two hours after dye labeling, animals were screened for those with single DiI-labeled neurons. Confocal images were collected through the entire Z dimension of single dye-labeled neurons using a Noran Instruments (Middleton, WI) XL laser scanning confocal attachment mounted on an upright Nikon (Tokyo, Japan) Optiphot equipped with a 40× Nikon lens (0.8 NA). Each optical section is an average of 8–16 frames and is separated from the next optical section in the Z dimension by 1–4 μm. Dye injection, screening, and imaging were done in animals anesthetized with 0.02% 3-aminobenzoic acid ethyl ester (MS222) (Sigma, St. Louis, MO) in Steinberg’s rearing solution. Animals recovered from anesthetic between imaging sessions, except when images were collected at 10 min intervals. For these experiments, animals remained anesthetized throughout the imaging session.
Image analysis. Line drawings of the images were produced by tracing each optical section in series onto an acetate sheet until the entire arbor was completed. This type of three-dimensional reconstruction provides a more detailed representation of the morphology than the computer generated three-dimensional image, because finer processes visible in the individual optical sections are lost in the computer-generated reconstructions. The number of branch tips was manually counted. To measure total dendritic branch length (TDBL), the line drawings were scanned into a Macintosh personal computer, and the NIH Image program 1.61 was used to skeletonize the image and measure the total dendritic branch length. Branch dynamics were assessed by superimposing drawings from sequential time points. Additions and retractions of branches for each time point were tabulated. Statistical significance was estimated using the two-tailed_t_ test.
BrdU labeling. BrdU labeling reagent (Zymed, San Francisco, CA) was diluted 1:10 in PBS with 0.1% fast green, and ∼200 nl was injected into the tectal ventricle. Animals were fixed in 4% paraformaldehyde either 2 hr or 6 d later, and horizontal cryostat sections through the brains were processed for BrdU immunohistochemistry according to the manufacturer’s protocol.
RESULTS
Morphogenesis of the tectum
Retinal ganglion cells first innervate the optic tectum at stage 39/40, when the tectum consists of narrow bilateral lobes on the roof of the midbrain (Holt, 1989). Tectal cells are generated in a crescent-shaped proliferative zone extending through the caudal and medial borders of the optic tectum (Fig.1). The continuous production of new cells in the proliferative zone results in extension of the tectum caudally and medially. By stage 46, the lobes of the tectum have grown medially to meet at the midline so the dorsal midbrain obtains a distinct hourglass appearance. At the same time, the tectum thickens dorsoventrally as a result of cell addition and the growth of the existing cells. The majority of DiI-labeled cells that we observed in stage 39/40 tecta were extremely simple in structure. The cell bodies extend a single process oriented laterally and rostrally (Fig. 1). Animals of these stages are still feeding off their yolk and exhibit no detectable visually guided behaviors.
Fig. 1.
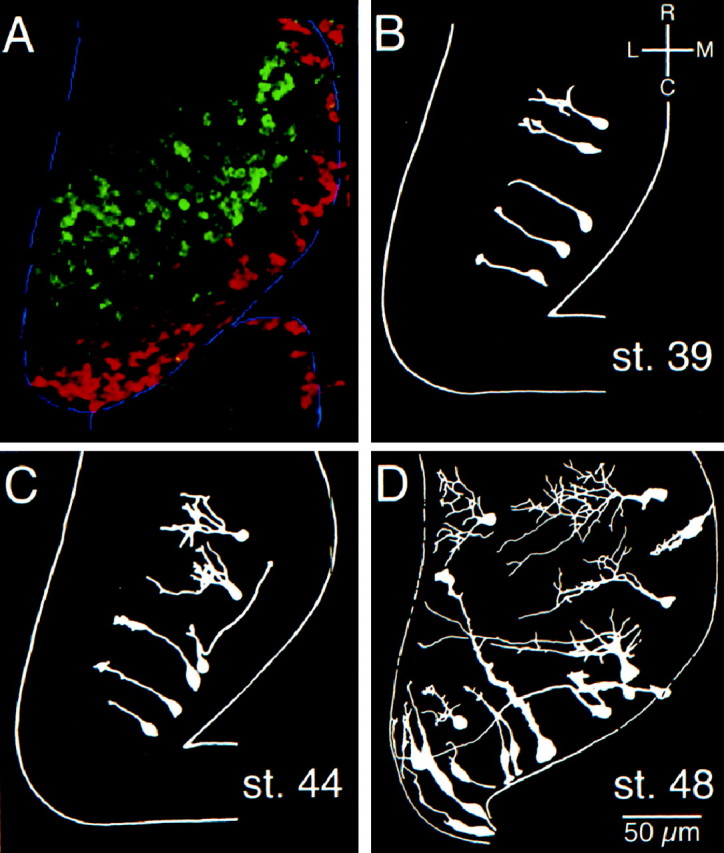
Gross morphogenesis of the tectum.A, Superimposition of images of a single optic lobe from an animal injected with BrdU at stage 40, 6 d before being killed, and an animal injected with BrdU, 2 hr before being killed at stage 48. The cells that incorporated BrdU at stage 40 (green) were displaced rostrally and laterally over the 6 d period by more recently added cells in the caudomedial proliferative zone. Cells that incorporated BrdU 2 hr before being killed and that therefore mark the proliferative zone are shown in red. The border of the tectum is outlined in_blue_. B–D, Summary drawings showing morphological complexities of optic tectum cells labeled by DiI iontophoresis and imaged by confocal microscopy _in vivo_in stage 39, stage 44, and stage 48 tadpoles, respectively. Cells shown are representative of the range of complexities of cells imaged at each stage. For simplicity, axons of complex cells were omitted.
Albino tadpoles progress from stage 40 to 42 in ∼14 hr at room temperature. Behaviorally, stage 42 tadpoles are mostly immobile. Touch and vibration result in escape behaviors: frantic short bouts of swimming, after which the animal is again immobile. Neurons with slightly more complex morphologies could be dye-labeled in the rostral tectum at stage 42 compared with those seen at stage 40. Cells in the caudal tectum of these animals were morphologically simple, consistent with their recent differentiation (Fig. 1C). Retinal innervation has increased by this stage; however, the majority of retinal axons are still extremely simple in their morphology (Sakaguchi and Murphey, 1985). Retinal stimulation results in glutamatergic synaptic responses mediated by both NMDA and AMPA type glutamate receptors (Zhang et al., 1998).
Approximately 2 d later, when animals reach stage 46, they are behaviorally more active and exhibit visually responsive behaviors. At this stage, the rostrocaudal gradient of morphological development of tectal neurons is more pronounced than in younger stages; in rostral tectum, neurons of different morphological classes, such as interneurons, and efferent neurons with rostrally or caudally projecting axons can be identified by DiI labeling, whereas cells in caudal tectal include undifferentiated neuroepithelial cells and recently differentiated neurons and glia.
Animals reach stage 47 the following day. They begin to swim continuously as they feed and are visually responsive. Whole-cell recordings from tectal neurons in animals of stage 46 and older reveal a clear rostrocaudal gradient of glutamatergic responses in which rostral neurons have stronger synapses, with a relatively large proportion of synaptic current mediated by the AMPA R, with neurons in progressively more caudal locations in the tectum having lower AMPA/NMDA ratios in their glutamatergic retinal synaptic currents (Wu et al., 1996). At this time, the tectum has become laminated, and many of the morphological cell types identified by Lázár (1973)in Golgi stained stage 49 tadpole tectum can be identified in DiI-labeled material.
Overall pattern of dendrite arbor elaboration
To determine the time course of dendritic arbor development, single DiI-labeled neurons were imaged at daily intervals over a period of 5–6 d (Fig. 2). For this series of experiments, cells were labeled and imaged in animals starting at stage 46 and followed through the imaging period to stage 48; however, the general pattern of morphological development that we describe occurs for newly generated neurons in animals at least through stage 49 and likely throughout the later tadpole stages of development.
Fig. 2.

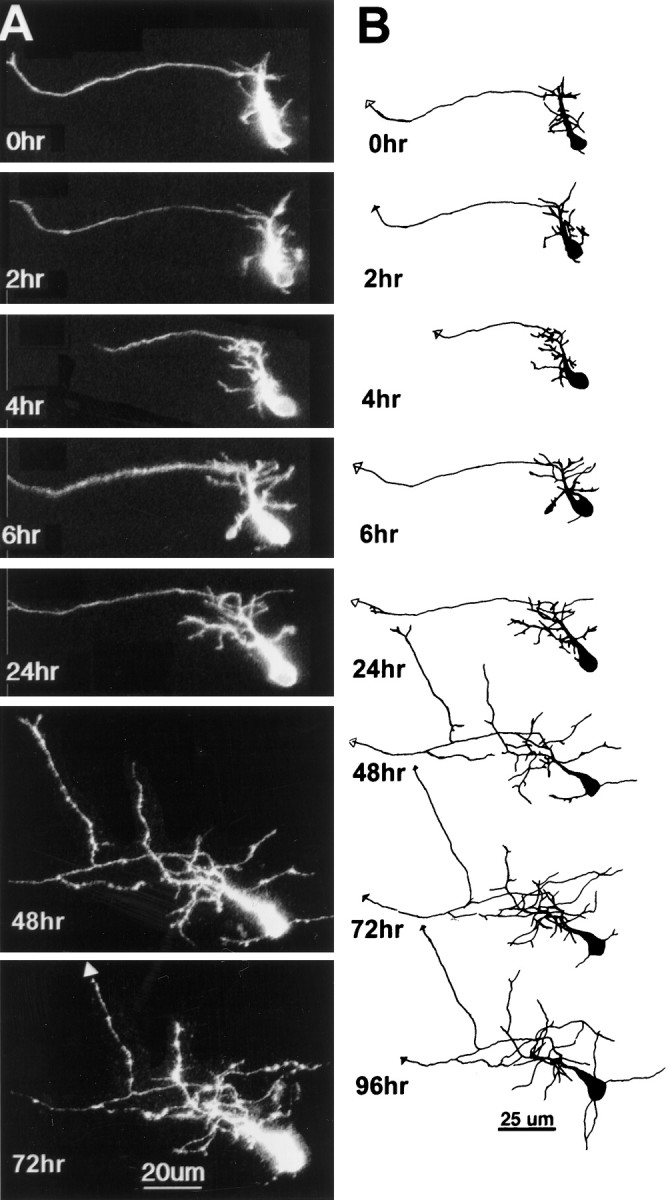
Dendritic arbor development. A, Drawings of a neuron imaged at daily intervals over a period of 6 d. The arrowhead marks the efferent axon.B, Change in TDBL for neurons imaged over 5–6 d (n = 8). Scale bar, 25 μm.
This paper includes an analysis of projection neurons, which extend an axon either rostrally or caudally out of the optic tectum. The efferent axon of the neurons is marked by an arrowhead in the figures. Cells located at the caudomedial pole of the tectum were selected for imaging. In general, these neurons have extremely simple morphologies on the first day and typically do not increase their dendritic arbor branch length significantly over the first day of imaging. Over the next few days, the dendritic arbor rapidly elaborates, after which it appears to grow more slowly (Fig.2B). Based on these observations, we divided development of the dendritic arbor into three distinct phases according to their growth rates. Phase 1 is the initial period of development during which the neuron differentiates from a neuroepithelial cell type and extends an efferent axon toward lateral tectum. During this period, there is little significant increase in dendritic branch length. Phase 2 is a period of rapid dendritic arbor growth, and phase 3 is a later period of slower branch growth. Furthermore, neurons could be categorized as phase 1, phase 2, or phase 3 based on measurements of their TDBL. In general, phase 1 neurons have TDBL of less than ∼100 μm, phase 2 neurons have TDBL ranging from ∼100–400 μm, and phase 3 neurons have TDBL >400 μm. Shorter interval observations indicate that the transition between phases 2 and 3 is gradual (Rajan et al., 1999). Synaptic physiology also matures during these phases: in phase 1 neurons, no retinotectal evoked synaptic responses are recorded; phase 2 neurons have retinal glutamatergic responses with low AMPA/NMDA ratios; and phase 3 neurons have higher AMPA/NMDA responses (Wu et al., 1996; Rajan and Cline, 1998). Because the magnitude of the AMPA R-mediated current recorded near the resting potential of the neuron is a measure of the strength of synaptic transmission (Hestrin et al., 1990), these data suggest that dendritic arbor growth rate might correlate with the strength of glutamatergic synaptic inputs to the neuron.
We analyzed a total of 96 neurons imaged at different locations along the rostrocaudal gradient of development in the optic tectum to test whether growth rate correlates with dendritic branch length. Many of these neurons passed through two phases of development (i.e., phase 1 to 2 or phase 2 to 3) over the time course of the observations. Approximately half of the neurons were also imaged at 2 hr intervals within the first day of the experiment to test whether the dynamic rearrangements in dendritic arbors correlate with growth rates and whether dendritic dynamics change with the strength of synaptic inputs. Three-dimensional reconstructions of the in vivo images are shown, as well as drawings of the neuron generated from each of the optical sections. The drawings show more detail and were used for quantification of dendritic growth. Further details of phase 1 of development are not included in this paper, because this phase does not include significant dendritic arbor elaboration.
Phase 2 of dendritic arbor development
Three examples of phase 2 tectal neurons are shown in Figures3-5to demonstrate the range of dynamic behaviors and growth rates observed. The neuron in Figure 3 was among the simplest phase 2 neurons imaged, with the dendritic branch length measuring 125 μm at the first image. The dendritic arbor develops as a profusion of fine branches extending from a major apical process. Fine branches are added and retracted from these initial branches, as seen in the observations collected at 2 hr intervals. In this neuron, there is little net increase in dendritic arbor branch length over the first 24 hr period, but growth rate increases rapidly over the next 24 hr and is maintained for the next several days.
Fig. 3.
Initial dendritic arbor development. Time-lapse confocal images (A) and drawings (B) of an early phase 2 neuron collected at time points specified. Dendritic branch length at the first image was 125 μm. The axon is distinguishable as a thin unbranched process extending toward lateral tectum. The dendritic arbor starts as a profusion of fine filopodial branches extending from an apical process. The dendritic branches rearrange considerably over the first 6 hr of imaging. There is little net growth of the arbor, even over 24 hr (TDBL at 6 hr, 170 μm; TDBL at 24 hr, 200 μm), but the arbor does enlarge by the 48 hr time point. At the 48 hr time point, a branch emerges from the axon, which exits the tectum rostrally at the 72 hr time point.
Fig. 4.

Early stages of dendritic arbor development. Time-lapse confocal images (A) and drawings (B) of a phase 2 neuron collected at time points specified. Dendritic branch length at the first image was 140 μm, 170 μm at 6 hr, and 400 μm at 24 hr. Note the large dendritic growth cone at the first image and the dramatic rearrangements revealed by the short interval observations for 0–6 hr. A second efferent axon exits the tectum rostrally at the 48 hr time point.
Fig. 5.

Dendritic arbors are dynamic in rapidly growing neurons. Images (A) and drawings (B) of a phase 2 neuron collected at time points specified. Dendritic branch length at the first image was 240 μm. Note the dendritic dynamics at short observation intervals and the rapid increase in branch length over each day of imaging. The cell body was not included in the reconstruction of the 48 hr image. Scale bar:A, B, 25 μm; inset in_B_, 50 μm.
The neuron shown in Figure 4 illustrates several types of dynamic rearrangements in the dendrites of these young neurons. Images collected at 2 hr intervals reveal that dendritic branches extend and retract repeatedly. A large growth cone tips one of the major dendritic branches; however, this growth cone is not the site of a branch point seen at the following observation. Indeed, that branch does extend over the next 4 hr but is almost completely retracted at the 6 hr observation and does not reappear at later time points. The arbor transiently increases in branch tip number and branch length at the 4 hr time point, but many branches are retracted by the following observation, so this growth spurt did not contribute to net growth of the arbor. These rapid rearrangements are comparable with those described in tectal neurons of zebrafish (Kaethner and Stuermer, 1997).
The dendritic arbor significantly increases in TDBL from 140 μm at 0 hr to 400 μm at 24 hr. Despite the increased dendritic branch length, the arbor does not appear to cover significantly more tangential area in the tectum than it did at the earlier 4 hr time point, because the dendritic arbor became more densely branched. The arbor continues to increase in branch length and branch number over the next 2 d of imaging. By the 24 hr time point, this neuron has extended a second axonal branch tipped with a lamellar growth cone. Both axons subsequently exited the tectum. The additional relatively unbranched processes toward the rostral tectum in this neuron may be a local axon arbor, as seen in a minority of neurons imaged. The local axon arbor elaboration is typically delayed until after the dendritic arbor has already become complex.
When neurons whose cell bodies were positioned rostrally and laterally from the proliferative zone were labeled, the first images revealed neurons with dendritic arbors somewhat more complex than the simple neurons located close to the caudal pole of the tectum (Fig. 5), consistent with the rostrocaudal gradient of morphological development in the optic tectum (Lázár, 1973; Wu and Cline, 1998). Figure 5 shows such a phase 2 neuron, measuring 240 μm at the first observation. The dendritic arbor of this neuron included many branch tips with growth cones and fine filopodia. Note the high degree of rearrangements in the dendritic branches from one 2 hr observation to the next in this neuron and the other phase 2 neurons in Figures 3 and4. The dendritic rearrangements include addition of new branches, complete retraction of branches, as well as both extension or shortening of branches that were present in the previous observation. The dendritic arbors of these phase 2 neurons grew rapidly over the next 48 hr. The axon of the neuron shown in Figure 5 sent projections both rostrally to the contralateral tegmentum via the posterior commissure and caudally to the spinal cord.
Phase 3 of dendritic arbor development
Neurons with cell bodies located further rostrally and laterally within the optic tectum have more complex dendritic arbors at the first day of imaging (Figs. 6,7). Compared with the rapid increases in dendritic arbor elaboration seen in the neurons in Figures 3-5, the arbors of these more complex neurons are remarkably similar from one observation to the next, indicating that slower-growing neurons also have more stable dendritic arbors. Despite the overall structural similarity in the dendritic arbors over days of imaging, the 2 hr observations do show branch additions and retractions at each 2 hr interval, indicating that complex neurons are capable of modest structural rearrangements. As the neurons elaborate their dendritic arbor, continual cell proliferation in the caudomedial proliferative zone of the tectum adds cells so the cell bodies of the differentiated neurons occupy positions more rostrally and laterally within the tectum (Fig. 7, insets).
Fig. 6.

Later stages of dendritic arbor development. Images (A) and drawings (B) of a phase 3 neuron collected at time points specified. Dendritic branch length at the first image was 580 μm. Note the structural stability of the dendritic arbor over the 3 d of imaging.
Fig. 7.

Dendritic arbors are stable in morphologically complex neurons. Images (A, C) and drawings (B, D) of two phase 3 neurons collected at the time points specified. Dendritic branch lengths at the first image were 580 and 450 μm for the cells in A and_C_, respectively. Insets in_B_ and D show rostrolateral shift in cell body location as the cells mature. Dendritic arbor structures are very similar from the first to last observations. Fine dendritic rearrangements do occur, even in complex neurons.
Localized dendritic arbor growth
Neurons can display clear regionalized elaboration (Figs. 4,8). For the neuron shown in Figure8A, a burst of short branches is added to the neurons at the arrow between the 1 and 2 hr time points. Over the following 2 hr, longer branches emerge at the same site. Other regions of the arbor also become more elaborate. In particular, one branch, marked by the arrowhead, adds many side branches, which rearrange again before the 6 hr time point. For the neuron in Figure8B, the part of the arbor on the _left_shows localized branch retraction followed by branch additions, whereas the portion of the arbor on right of the figure shows less net growth over the 6 hr observation period. It is not clear whether the localized growth in these latter 2 neurons will result in longer-lasting regional bias in dendritic elaboration or whether the local elaboration is transient as in the neuron in Figure 4.
Fig. 8.

Regionalized dendritic elaboration. Images collected at the designated intervals for either phase 2 (A) or phase 3 (B) neurons show regionalized dendritic arbor growth (arrows and_arrowhead_).
Quantification of dendritic arbor growth parameters
Neurons showed different growth rates that correlated with their TDBL on the first day of imaging (Fig.9), supporting the idea that dendritic development can be divided into phases that correlate with the dendritic arbor size and growth rate of the arbor. Phase 2 neurons are characterized by a rapid growth rate of the neurons, in terms of increases in dendritic branch length, branch tip numbers, and arbor density (data not shown). The increases in numbers of dendritic branch tips change in a parallel manner to the branch length during phase 2 (Fig. 9B), indicating that dendritic arbor development involves a coordination of mechanisms controlling new branch additions and extension of branches. For phase 3 neurons, TDBL continues to increase, although branch tip numbers remain constant. This suggests that more complex neurons continue to elaborate by increasing segmental branch lengths rather than adding new branches,
Fig. 9.

Coordinate changes in multiple features of the dendritic arbor with phases of dendritic arbor development.A, Total dendritic branch length. B, Dendritic branch tip number, graphed for each day of imaging. Neurons were divided into phases 1, 2, or 3 based on TDBL measurements on the first day of imaging. Because phase 1 lasts ∼24 hr, neurons that start as phase 1 transition into phase 2 during the 3 d observation period. C, Growth rates for phases 1, 2, and 3 neurons. D, Sholl analysis of dendritic arbors from phase 2 (black squares) and phase 3 neurons (gray circles).
Sholl analysis was used to quantify complexity and tangential extent of dendritic arbors from neurons at different phases of development (Fig.9D). Phase 2 neurons were significantly less complex than phase 3 neurons and covered less tectal area than phase 3 neurons. Phase 2 neurons had a maximum of 3.75 ± 0.3 branches crossing the concentric rings, whereas phase 3 neurons had a maximum of 7.25 ± 0.4 branches crossing. Furthermore, phase 3 neurons extended as far as 140 μm from the cell body, whereas phase 2 neurons extended only 100 μm from the cell body.
Quantification of dendritic dynamics in phase 2 and phase 3 neurons
To test whether dynamic rearrangements of rapidly growing phase 2 neurons are greater than the slower-growing phase 3 neurons, we analyzed the images of neurons collected at 2 hr intervals over a period of 6 hr. This protocol allows us to identify every branch in the dendritic arbor at each time point and to compare changes in dendritic branches by superimposing drawings of the neurons from sequential observations. A 2 hr imaging protocol is sufficiently frequent to permit accurate superimposition of drawings from each time point while also being sufficiently long to permit significant changes in branch tip numbers and branch length during the observation period. We determined the rates of branch additions and retractions at each 2 hr time point and over the 6 hr observation period (Fig.10). We analyzed two additional parameters indicative of arbor stability: the skeleton of the arbor, or the fraction of branches that persist throughout the 6 hr observation period, and the average relative lifetime of branches.
Fig. 10.

Dendritic arbor stability increases with neuronal maturity. A, Branch dynamics. Initial and final branch numbers and cumulative branch additions and retractions in phase 2 (black bars; n = 19) and phase 3 (gray bars; n = 10) neurons over the 6 hr observation, graphed relative to initial branch tip number. B, The skeleton, or the fraction of branches that persists through the observation period, for phase 2 and phase 3 neurons. C, The average relative lifetime of branches in phase 2 and phase 3 neurons. **p < 0.001.
Phase 2 neurons average ∼14.4 ± 1.3 (n = 19) branch tips at the initial observation and add ∼10 branches at each of the 2 hr intervals. Slightly fewer branch tips are retracted at each of the time points than are added over the same interval. These constant rates of branch additions and retractions over the observation period, as well as the continuous elaboration of the dendritic arbor after the 6 hr period, indicates that the imaging protocol is not detrimental to the neuronal growth rate. Summed over the 6 hr period, phase 2 neurons add approximately twice as many branches (28.3 ± 1.9) as are initially present. Again, fewer branches are retracted (25.4 ± 2.3), such that the branch tip number at the final observation (18.6 ± 1.7) is significantly greater (p < .05) than the initial branch tip number. Phase 3 neurons have approximately twice as many branch tips at the initial observation as phase 2 neurons (34.7 ± 4.8;n = 10). At each 2 hr time point, the more complex neurons add and retract an average of ∼10 branches, so that the final branch tip number (32.5 ± 3.5) is not significantly different from the initial value.
We observed two principle differences in the dynamics of phase 2 and phase 3 neurons. (1) The phase 3 neurons are structurally more stable that phase 2 neurons. The relative rates of branch additions and retractions of phase 3 neurons is half that in phase 2 neurons (Fig.10A). The fraction of the branches that persist throughout the 6 hr observation period, or the skeleton, is significantly greater in phase 3 neurons than phase 2 neurons. In addition, an analysis of the lifetimes of new branches added during the 6 hr observation period indicates that branches in phase 3 neurons have a longer lifetime than those in phase 2 neurons. (2) The second principle difference between phase 2 and 3 neurons is that rearrangements in phase 3 neurons are confined to short branch tips within the complex arbor (Figs. 6, 7), whereas phase 2 neurons show larger structural changes over the same 2 hr periods (Figs. 3-5).
Short-term dendritic dynamics
To illustrate the difference in dynamics between phase 2 and phase 3 neurons, we collected images of neurons at 10 min intervals and superimposed three of these images. Portions of the dendritic arbor are color coded according to the degree to which the branches were superimposable (Fig. 11). White branches were completely superimposable for all the time points, and colored branches do not superimpose during the different time points. The complex phase 3 neuron in Figure11B is mostly white with a little color at some branch tips. This indicates that the structure of this neuron is very stable over the imaging period. In contrast, the phase 2 neuron is very colorful in all the dendritic branches. Only the soma and proximal dendritic regions are white, indicating that they are the only stable portions of the neuron during this imaging period.
Fig. 11.

Colorized dendritic arbors show sites of branch dynamics. Composite images of a phase 2 (A) and phase 3 (B) neuron, each imaged three times at 10 min intervals and pseudocolored to show dynamics of dendritic branches in superimposed images. The first image is red, the second is green, and the third is blue.White portions of the arbor are stable, and_colored_ branches are dynamic over the imaging period.
DISCUSSION
High-resolution confocal time-lapse images of single neurons in the Xenopus optic tectum were collected over periods of days. Our data demonstrate that neurons have different dendritic arbor growth rates and branch dynamics. Because electrophysiological recordings cannot be taken from the same neurons from which we collected time-lapse images, we compared the dynamics of the dendritic arbors from the imaging experiments with the properties of retinotectal synaptic physiology from neurons occupying similar locations along the rostrocaudal axis of the tectum (Wu et al., 1996). Our previous experiments have shown that, during this time, synaptic responses mature from relatively weak, low AMPA/NMDA synapses to stronger, high AMPA/NMDA synapses. Therefore, the data further suggest that growth rates and branch dynamics correlate with synaptic maturation; neurons with relatively simple dendritic arbors have low AMPA/NMDA ratios (Wu et al., 1996), rapid dendritic growth rates, and rapid arbor dynamics. Neurons with more complex dendritic arbors and higher AMPA/NMDA ratios have slower growth rates and fewer dendritic branch rearrangements.
In vivo imaging of dendritic dynamics
We categorized tectal cell development into three phases. During phase 1, neurons differentiate from neuroepithelial progenitors, and projection neurons extend their efferent axon. Further details of phase 1 of development are not included in this paper. Phase 2 neurons are characterized by dendritic arbors within ∼100–400 μm TDBL, a rapid dendritic growth rate, and rapid arbor dynamics. Phase 3 neurons have dendritic arbors with >400 μm TDBL, slower growth rates, and fewer dendritic branch rearrangements.
Phase 2 neurons grow rapidly and show dramatic rearrangements in the dendritic arbor over 2 hr intervals and even over 10 min intervals (Fig. 11). The rearrangements include addition of new branches, complete retraction of branches, as well as both extension or shortening of branches that were present in the previous observation. Slightly more branch additions than retractions occur over 6 hr, which accounts for the net increase in arbor elaboration over longer periods. Branches are added at any point along a parent dendrite, indicating that backbranching is a means of dendritic arbor growth in vivo, as has been shown previously for axon arbor elaboration (Harris et al., 1987; O’Rourke et al., 1994). Growth cones are often seen with active lamellopodial and filopodial rearrangements, characteristic of exploratory behaviors. Arbors show a coordinated increase in branch length and branch tips, indicating that dendritic arbors do not develop first by extending long branches that subsequently add side branches.
Time-lapse imaging of morphologically complex phase 3 neurons indicates that they continue to exhibit modest dynamic rearrangements in their branch tips, consistent with their continued elaboration during later phases of development (Lázár, 1973). Dendritic stabilization is caused by a decreased rate of branch retractions, consistent with the stabilization of synaptic contacts and their supporting branches. Stabilization is also caused by a decreased rate of branch additions. This decreased rate of branch additions is not necessarily predicted from the hypothesis that strong synapses stabilize dendritic structure and suggests that a stop-growing signal exists, which decreases rates of branch additions in response to increased synaptic strength.
Structural dynamics and synaptic strength
The higher growth rate and rapid structural dynamics of phase 2 neurons correlate with the presence of relatively weak retinotectal inputs, mediated principally by NMDA R, in this group of neurons. The slower growth rate and stable dendritic structure of phase 3 neurons correlate with the stronger synaptic inputs, with high AMPA/NMDA ratios, which these more mature neurons receive. Because the amplitude of the NMDA currents do not change significantly over the developmental window we have examined (Wu et al., 1996), the increased AMPA/NMDA ratio represents an increased amplitude of the AMPA R-mediated synaptic currents during neuronal maturation. The data support the model that strong synaptic inputs stabilize dendritic arbors; however, we suggest a modification of the model in two respects. First, we suggest that silent or pure NMDA R-mediated synapses provide a means by which synapses can form, which will have no impact on the activity of the postsynaptic neuron unless that input is coactive with the tectal cell. In a visual projection that is actively establishing and maintaining a retinotopic projection, the ability to form such trial synapses to test for coactivity without degrading information transfer would seem to be a distinct advantage (Cline et al., 1997). We suggest that the pure NMDA trial synapses would retract if they were not coactive with tectal cell activity, and the presynaptic and postsynaptic branches may also retract. This might account for a large degree of structural dynamics in young neurons that have a large fraction of their synapses mediated solely by NMDA R. Second, we suggest that the addition of AMPA R and the stronger synaptic transmission that comes with the addition of AMPA R-mediated responses stabilize the dendritic arbor. Arbor stability can then be dynamically regulated as synaptic strength can be dynamically regulated. Weaker inputs, with lower amplitude AMPA responses, permit the dendritic arbor to undergo greater structural rearrangements. Greater dendritic dynamics correlate with a faster arbor growth rate, suggesting some relationship between high rates of branch additions and retractions and net growth of the arbor.
Inherent in this model is the idea that branches supporting weaker synaptic inputs remain dynamic, even in mature neurons. Indeed, recordings from mature neurons in rostral tectum show that they continue to have some synapses mediated principally by NMDA R (Wu et al., 1996), and we do observe fine branch dynamics in phase 3 neurons imaged at 2 hr intervals (Figs. 6, 7). Furthermore, the model predicts that modifying synaptic strength will lead to corresponding changes in branch dynamics. In support of this idea, we found that blocking AMPA receptors led to modest increases in rates of branch retractions and a decrease in TDBL in complex neurons with high AMPA/NMDA ratios (Rajan and Cline, 1998) and that increasing synaptic strength by expressing CaM kinase II (CaMKII) in tectal neurons decreased dendritic dynamics (Wu et al., 1996; Wu and Cline, 1998). It would be interesting to see whether experimental conditions that result in reorganization of sensory projections and a recapitulation of the developmental program of synaptic maturation, as seen in the prism-shifted visual projection of the barn owl (Feldman et al., 1996; Feldman and Knudsen, 1997,1998), also result in an increase in structural dynamics of those neurons with increased NMDA receptor-mediated responses.
As mentioned above, we reported previously that increased CaMKII activity in tectal neurons increases the amplitude of AMPA R-mediated synaptic currents (Wu et al., 1996) and stabilizes dendritic arbor structure (Wu and Cline, 1998). These experiments suggest that an interaction between strong synaptic inputs and CaMKII activity may stabilize dendrites. Indeed, the developmental decrease in arbor dynamics from phase 2 to phase 3 neurons (Fig. 10) is comparable with the decreased dynamics seen in phase 2 neurons when CaMKII is expressed by viral gene transfer (Wu and Cline, 1998). This supports our previous conclusion that the developmental increase in tectal cell CaMKII expression provides them with a mechanism to translate strong synaptic input into stable dendritic structure. The interplay between glutamate receptor activity, CaMKII, and as yet undefined downstream effectors that control cytoskeletal assembly and disassembly remain an area of active research effort. Glutamate receptor activity and CaMKII can activate a RasGTPase (SynGap) (Chen et al., 1998; Kim et al., 1998). Although the ras signaling pathway is known to activate gene transcription via mitogen-activated protein kinase, recent evidence also indicate that ras may regulate actin cytoskeletal dynamics (Leblanc et al., 1998; Sharma, 1998; Harden et al., 1999), suggesting a mechanism by which dendrite dynamics can be locally controlled by synaptic activity.
A developmental decrease in dendritic branch dynamics has been observed previously in hippocampal slice cultures (Dailey and Smith, 1996) and dissociated hippocampal neuronal cultures (Ziv and Smith, 1996). Using dissociated hippocampal neuronal cultures in which the presence of synapses was assessed by uptake of FM 4–64 into presynaptic sites, Ziv and Smith (1996) demonstrated that FM 4–64-labeled presynaptic sites were associated with persistent dendritic branches compared with the dynamic dendritic branches, which were apparently without presynaptic contact. Although Ziv and Smith (1996) concluded that synaptogenesis stabilizes dendritic branches, our data indicate that it is more likely the addition of AMPA R and the increased synaptic strength that comes about with the addition of these receptors that specifically promotes dendritic arbor stability rather than synaptogenesis per se.
Many factors contribute to the regulation of dendritic arbor development. These may be as diverse in mechanisms of action as developmental expression of adhesion molecules and their receptors (Lander et al., 1997), metabotropic glutamate receptors (Zirpel and Rubel, 1996; Reid et al., 1997; Liu et al., 1998), neurotrophins (McAllister et al., 1995), activity-induced genes (Nedivi et al., 1998), or the developmental changes in responses to transmitters (Cherubini et al., 1991; Hestrin, 1992). In addition, many of these regulatory factors develop concurrently and are interdependent in their actions on the development of neuronal structure and function. Therefore, our observations that a developmental decrease in dendritic arbor stability correlates with increased synaptic strength represents a first step in determining the mechanisms through which synaptic inputs can regulate dendritic structure.
Afferents inputs and dendritic arbor orientation
The dendritic arbors of tectal neurons we imaged are highly polarized, with the arbor extending rostrally and laterally toward the retinal afferents. In some cases, such as the neurons shown in Figures4 and 8, we observed clear regionalized arbor elaboration and regionalized retractions. Such localized branch elaboration may reflect the trophic effect of inputs on dendritic arbor growth and over time would be expected to result in a polarized dendritic arbor. A trophic effect of afferents has been convincingly demonstrated in the auditory system in which different afferents terminate on different portions of the dendritic arbor in neurons in nucleus laminaris, which exhibit an increase in dendritic arbor complexity that correlates with afferent ingrowth (Smith and Rubel, 1979). Deafferentation of specific afferents leads to selective atrophy of the corresponding part of the dendritic arbor (Gray et al., 1982; Smith et al., 1983; Deitch and Rubel, 1984). Katz and Constantine-Paton (1988) noted previously a rostral bias in dendritic arbor elaboration in tectal neurons from postmetamorphic Rana pipiens and suggested that it might be caused by a trophic influence of retinal afferents. We subsequently reported that NMDA R activity promotes dendritic arbor development by increasing rates of branch additions and branch length extensions (Rajan and Cline, 1998), supporting the idea that glutamate released from retinal afferents acts trophically to increase dendritic growth in phase 2 neurons. The data in the present study provide evidence for a distinct effect of glutamatergic inputs in stabilizing dendritic arbor structure in more mature phase 3 neurons. It appears that, during phase 2 of dendritic arbor elaboration when AMPA/NMDA ratios are low, glutamate, acting through NMDA R, may have a trophic effect on tectal neuronal dendrites, promoting branch additions and branch lengthening. Such a trophic effect could be mediated through tyrosine kinases, which form a complex that may be activated by NMDA R (Tezuka et al., 1999). In more mature phase 3 neurons that already receive strong synapses, glutamatergic inputs now shape the dendritic arbor in a distinct manner by stabilizing those branches with the strong synaptic inputs.
Conclusion
Here, we use in vivo imaging techniques with vital dyes to observe the development and structural dynamics of optic tectal cells. By taking images of DiI-labeled cells at short intervals, we have been able to directly observe rapid morphological dynamics in neurons. Images collected at longer intervals reveal larger scale structural rearrangements in these cells. Neuronal development can be divided into three phases according to the dendritic arbor size and growth rate. Phase 2 neurons are in a rapid growth phase, and growth rate slows down when the dendritic arbor reaches a mature size, measured as TDBL. One of the striking findings that we report here is the great degree to which neurons modify their dendritic structure. Furthermore, we find that dendritic arbor dynamics change in a consistent manner during the development of the arbor, such that rapidly growing phase 2 neurons are twice as dynamic as phase 3 neurons. As neurons mature, the increased structural stability is concurrent with an increase in the strength of retinotectal synaptic inputs. These data are consistent with the idea that strong synaptic inputs stabilize the dendritic arbor.
Footnotes
This work was supported by the Hoffritz Trust, the National Science Foundation, and National Institutes of Health. We thank Kim Bronson for excellent technical assistance and David Baek, Dominik Rosa, and Julia Jay for help with the data analysis.
Correspondence should be addressed to Hollis Cline, Cold Spring Harbor Laboratory, Beckman Building, 1 Bungtown Road, Cold Spring Harbor, NY 11724.
REFERENCES
- 1.Chen H-J, Rojas-Soto M, Oguni A, Kennedy MB. A synaptic Ras-GTPase activating protein (p135 SynGAP) inhibited by CaM kinase II. Neuron. 1998;20:895–904. doi: 10.1016/s0896-6273(00)80471-7. [DOI] [PubMed] [Google Scholar]
- 2.Cherubini E, Gaiarsa JL, Ben Ari Y. GABA: an excitatory transmitter in early postnatal life. Trends Neurosci. 1991;14:515–519. doi: 10.1016/0166-2236(91)90003-d. [DOI] [PubMed] [Google Scholar]
- 3.Cline HT, Wu G-Y, Malinow R. In vivo development of neuronal structure and function. Cold Spring Harb Symp Quant Biol. 1997;61:95–104. [PubMed] [Google Scholar]
- 4.Cline HT, Edwards JA, Rajan I, Wu GY, Zou DJ. In vivo imaging of CNS neuron development (Cline HT, Edwards JA, Rajan I, Wu GY, Zou DJ, eds). Cold Spring Harbor Laboratory; Cold Spring Harbor, NY: 1999. [Google Scholar]
- 5.Dailey ME, Smith SJ. The dynamics of dendritic structure in developing hippocampal slices. J Neurosci. 1996;16:2983–2994. doi: 10.1523/JNEUROSCI.16-09-02983.1996. [DOI] [PMC free article] [PubMed] [Google Scholar]
- 6.Deitch JS, Rubel EW. Afferent influences on brain stem auditory nuclei of the chicken: time course and specificity of dendritic atrophy following deafferentation. J Comp Neurol. 1984;229:66–79. doi: 10.1002/cne.902290106. [DOI] [PubMed] [Google Scholar]
- 7.Feldman DE, Knudsen EI. An anatomical basis for visual calibration of the auditory space map in the barn owl’s midbrain. J Neurosci. 1997;17:6820–6837. doi: 10.1523/JNEUROSCI.17-17-06820.1997. [DOI] [PMC free article] [PubMed] [Google Scholar]
- 8.Feldman DE, Knudsen EI. Pharmacological specialization of learned auditory responses in the inferior colliculus of the barn owl. J Neurosci. 1998;18:3073–3087. doi: 10.1523/JNEUROSCI.18-08-03073.1998. [DOI] [PMC free article] [PubMed] [Google Scholar]
- 9.Feldman DE, Brainard MS, Knudsen EI. Newly learned auditory responses mediated by NMDA receptors in the owl inferior colliculus. Science. 1996;271:525–528. doi: 10.1126/science.271.5248.525. [DOI] [PubMed] [Google Scholar]
- 10.Gray L, Smith Z, Rubel EW. Developmental and experimental changes in dendritic symmetry in n. laminaris of the chick. Brain Res. 1982;244:360–364. doi: 10.1016/0006-8993(82)90098-1. [DOI] [PubMed] [Google Scholar]
- 11.Greenough WT, Chang F-LF. Dendritic pattern formation involves both oriented regression and oriented growth in the barrels of mouse somatosensory cortex. Dev Brain Res. 1988;43:148–152. doi: 10.1016/0165-3806(88)90160-5. [DOI] [PubMed] [Google Scholar]
- 12.Harden N, Ricos M, Ong YM, Chia W, Lim L (1999) Participation of small GTPases in dorsal closure of the Drosophila embryo: distinct roles for Ρ subfamily proteins in epithelial morphogenesis. J Cell Sci 273–284. [DOI] [PubMed]
- 13.Harris WA, Holt CE, Bonhoeffer F. Retinal axons with and without their somata, growing to and arborizing in the tectum of Xenopus embryos: a time-lapse video study of single fibres in vivo. Development. 1987;101:123–133. doi: 10.1242/dev.101.1.123. [DOI] [PubMed] [Google Scholar]
- 14.Hestrin S. Developmental regulation of NMDA receptor-mediated synaptic currents at a central synapse. Nature. 1992;357:686–689. doi: 10.1038/357686a0. [DOI] [PubMed] [Google Scholar]
- 15.Hestrin S, Perkel DJ, Sah P, Manabe T, Renner P, Nicoll RA. Physiological properties of excitatory synaptic transmission in the central nervous system. Cold Spring Harb Symp Quant Biol. 1990;55:87–94. doi: 10.1101/sqb.1990.055.01.011. [DOI] [PubMed] [Google Scholar]
- 16.Holt CE. A single-cell analysis of early retinal ganglion cell differentiation in Xenopus: from soma to axon tip. J Neurosci. 1989;9:3123–3145. doi: 10.1523/JNEUROSCI.09-09-03123.1989. [DOI] [PMC free article] [PubMed] [Google Scholar]
- 17.Kaethner R, Stuermer C. Dynamics of process formation during differentiation of tectal neurons in embryonic zebrafish. J Neurobiol. 1997;32:627–639. [PubMed] [Google Scholar]
- 18.Kalb RG. Regulation of motor neuron dendrite growth by NMDA receptor activation. Development. 1994;120:3063–3071. doi: 10.1242/dev.120.11.3063. [DOI] [PubMed] [Google Scholar]
- 19.Katz LC, Constantine-Paton M. Relationships between segregated afferents and postsynaptic neurons in the optic tectum of three-eyed frogs. J Neurosci. 1988;8:3160–3180. doi: 10.1523/JNEUROSCI.08-09-03160.1988. [DOI] [PMC free article] [PubMed] [Google Scholar]
- 20.Katz LC, Gilbert C, Wiesel T. Local circuits and ocular dominance columns in monkey striate cortex. J Neurosci. 1989;9:1389–1399. doi: 10.1523/JNEUROSCI.09-04-01389.1989. [DOI] [PMC free article] [PubMed] [Google Scholar]
- 21.Kim JH, Liao D, Lau L-F, Huganir RL. SynGAP: a synaptic RasGAP that associates with the PSD-95/SAP90 protein family. Neuron. 1998;20:683–691. doi: 10.1016/s0896-6273(00)81008-9. [DOI] [PubMed] [Google Scholar]
- 22.Kossel A, Lowel S, Bolz J. Relationships between dendritic fields and functional architecture in striate cortex of normal and visually deprived cats. J Neurosci. 1995;15:3913–3926. doi: 10.1523/JNEUROSCI.15-05-03913.1995. [DOI] [PMC free article] [PubMed] [Google Scholar]
- 23.Kossel A, Williams C, Schweizer M, Kater S. Afferent innervation influences the development of dendritic branches and spines via both activity-dependent and non-activity-dependent mechanisms. J Neurosci. 1997;17:6314–6324. doi: 10.1523/JNEUROSCI.17-16-06314.1997. [DOI] [PMC free article] [PubMed] [Google Scholar]
- 24.Lander C, Kind P, Maleski M, Hockfield S. A family of activity-dependent neuronal cell-surface chondroitin sulfate proteoglycans in cat visual cortex. J Neurosci. 1997;17:1928–1939. doi: 10.1523/JNEUROSCI.17-06-01928.1997. [DOI] [PMC free article] [PubMed] [Google Scholar]
- 25.Lázár G. The development of the optic tectum in Xenopus laevis: a Golgi study. J Anat. 1973;116:347–355. [PMC free article] [PubMed] [Google Scholar]
- 26.Leblanc V, Tocque B, Delumeau I. Ras-GAP controls Rho-mediated cytoskeletal reorganization through its SH3 domain. Mol Cell Biol. 1998;18:5567–5578. doi: 10.1128/mcb.18.9.5567. [DOI] [PMC free article] [PubMed] [Google Scholar]
- 27.Liu XB, Munoz A, Jones EG. Changes in subcellular localization of metabotropic glutamate receptor subtypes during postnatal development of mouse thalamus. J Comp Neurol. 1998;395:450–465. doi: 10.1002/(sici)1096-9861(19980615)395:4<450::aid-cne3>3.0.co;2-0. [DOI] [PubMed] [Google Scholar]
- 28.Mattson MP, Hunter AT, Kater SB. Neurite outgrowth in individual neurons of a neuronal population is differentially regulated by calcium and cyclic AMP. J Neurosci. 1988;8:1704–1711. doi: 10.1523/JNEUROSCI.08-05-01704.1988. [DOI] [PMC free article] [PubMed] [Google Scholar]
- 29.McAllister AK, Lo DC, Katz LC. Neurotrophins regulate dendritic growth in developing visual cortex. Neuron. 1995;15:791–803. doi: 10.1016/0896-6273(95)90171-x. [DOI] [PubMed] [Google Scholar]
- 30.McAllister AK, Katz LC, Lo DC. Neurotrophin regulation of cortical dendritic growth requires activity. Neuron. 1996;17:1057–1064. doi: 10.1016/s0896-6273(00)80239-1. [DOI] [PubMed] [Google Scholar]
- 31.Nedivi E, GY W, Cline HT. Promotion of dendritic growth by CPG15, an activity-induced signaling molecule. Science. 1998;281:1863–1866. doi: 10.1126/science.281.5384.1863. [DOI] [PMC free article] [PubMed] [Google Scholar]
- 32.Nieuwkoop PD, Faber J. Normal table of Xenopus laevis (Daudin). Elsevier; Amsterdam: 1956. [Google Scholar]
- 33.O’Rourke NA, Cline HT, Fraser SE. Rapid remodeling of retinal arbors in the tectum with and without blockade of synaptic transmission. Neuron. 1994;12:921–934. doi: 10.1016/0896-6273(94)90343-3. [DOI] [PubMed] [Google Scholar]
- 34.Rajan I, Cline HT. Glutamate receptor activity is required for normal development of tectal cell dendrites in vivo. J Neurosci. 1998;18:7836–7846. doi: 10.1523/JNEUROSCI.18-19-07836.1998. [DOI] [PMC free article] [PubMed] [Google Scholar]
- 35.Rajan I, Witte S, Cline HT. NMDA receptor activity stabilizes presynaptic retinotectal axons and postsynaptic optic tectal cell dendrites in vivo. J Neurobiol. 1999;38:2089–2096. doi: 10.1002/(sici)1097-4695(19990215)38:3<357::aid-neu5>3.0.co;2-#. [DOI] [PubMed] [Google Scholar]
- 36.Reid SN, Romano C, Hughes T, Daw NW. Developmental and sensory-dependent changes of phosphoinositide-linked metabotropic glutamate receptors. J Comp Neurol. 1997;389:577–583. doi: 10.1002/(sici)1096-9861(19971229)389:4<577::aid-cne3>3.0.co;2-y. [DOI] [PubMed] [Google Scholar]
- 37.Sakaguchi DS, Murphey RK. Map formation in the developing Xenopus retinotectal system: an examination of ganglion cell terminal arborizations. J Neurosci. 1985;5:3228–3245. doi: 10.1523/JNEUROSCI.05-12-03228.1985. [DOI] [PMC free article] [PubMed] [Google Scholar]
- 38.Sanes DH, Hafidi A. Glycinergic transmission regulates dendrite size in organotypic culture. J Neurobiol. 1996;31:503–511. doi: 10.1002/(SICI)1097-4695(199612)31:4<503::AID-NEU9>3.0.CO;2-D. [DOI] [PubMed] [Google Scholar]
- 39.Schweitzer L. Morphometric analysis of developing neuronal geometry in the dorsal cochlear nucleus of the hamster. Dev Brain Res. 1991;59:39–47. doi: 10.1016/0165-3806(91)90027-g. [DOI] [PubMed] [Google Scholar]
- 40.Sharma SV. Rapid recruitment of p120RasGAP and its associated protein, p190RhoGAP, to the cytoskeleton during integrin mediated cell-substrate interaction. Oncogene. 1998;17:271–281. doi: 10.1038/sj.onc.1201921. [DOI] [PubMed] [Google Scholar]
- 41.Smith DJ, Rubel EW. Organization and development of brain stem auditory nuclei of the chicken: dendritic gradients in nucleus laminaris. J Comp Neurol. 1979;186:213–239. doi: 10.1002/cne.901860207. [DOI] [PubMed] [Google Scholar]
- 42.Smith DJ, Gray L, Rubel EW. Afferent influences on brainstem auditory nuclei in the chicken: n. laminaris dendritic length following monaural conductive hearing loss. J Comp Neurol. 1983;220:199–205. doi: 10.1002/cne.902200207. [DOI] [PubMed] [Google Scholar]
- 43.Straznicky K, Gaze RM. The development of the tectum in Xenopus laevis: an autoradiographic study. J Embryol Exp Morphol. 1972;28:87–115. [PubMed] [Google Scholar]
- 44.Tezuka T, Umemori H, Akiyama T, Nakanishi S, Yamamoto T. PSD-95 promotes fyn-mediated tyrosine phosphorylation of the N-methyl-d-aspartate receptor subunit NR2A. Proc Natl Acad Sci USA. 1999;96:435–440. doi: 10.1073/pnas.96.2.435. [DOI] [PMC free article] [PubMed] [Google Scholar]
- 45.Vogel MW, Prittie J. Purkinje cell dendritic arbors in chick embryos following chronic treatment with an N-methyl-d-aspartate receptor antagonist. J Neurobiol. 1995;26:537–552. doi: 10.1002/neu.480260407. [DOI] [PubMed] [Google Scholar]
- 46.Wu G-Y, Cline HT. Stabilization of dendritic arbor structure in vivo by CaMKII. Science. 1998;279:222–226. doi: 10.1126/science.279.5348.222. [DOI] [PubMed] [Google Scholar]
- 47.Wu G-Y, Malinow R, Cline HT. Maturation of a central glutamatergic synapse. Science. 1996;274:972–976. doi: 10.1126/science.274.5289.972. [DOI] [PubMed] [Google Scholar]
- 48.Zhang LL, Tao HW, Holt CE, Harris WA, Poo M-M. A critical window for cooperation and competition among developing retinotectal synapses. Nature. 1998;395:37–44. doi: 10.1038/25665. [DOI] [PubMed] [Google Scholar]
- 49.Zirpel L, Rubel EW. Eighth nerve activity regulates intracellular calcium concentration of avian cochlear nucleus neurons via a metabotropic glutamate receptor. J Neurophysiol. 1996;76:4127–4139. doi: 10.1152/jn.1996.76.6.4127. [DOI] [PubMed] [Google Scholar]
- 50.Ziv NE, Smith SJ. Evidence for a role of dendritic filopodia in synaptogenesis and spine formation. Neuron. 1996;17:91–102. doi: 10.1016/s0896-6273(00)80283-4. [DOI] [PubMed] [Google Scholar]