Paraspeckles are constructed as block copolymer micelles (original) (raw)
Abstract
Paraspeckles are constructed by NEAT1_2 architectural long noncoding RNAs. Their characteristic cylindrical shapes, with highly ordered internal organization, distinguish them from typical liquid–liquid phase‐separated condensates. We experimentally and theoretically investigated how the shape and organization of paraspeckles are determined. We identified the NEAT1_2 RNA domains responsible for shell localization of the NEAT1_2 ends, which determine the characteristic internal organization. Using the soft matter physics, we then applied a theoretical framework to understand the principles that determine NEAT1_2 organization as well as shape, number, and size of paraspeckles. By treating paraspeckles as amphipathic block copolymer micelles, we could explain and predict the experimentally observed behaviors of paraspeckles upon NEAT1_2 domain deletions or transcriptional modulation. Thus, we propose that paraspeckles are block copolymer micelles assembled through a type of microphase separation, micellization. This work provides an experiment‐based theoretical framework for the concept that ribonucleoprotein complexes (RNPs) can act as block copolymers to form RNA‐scaffolding biomolecular condensates with optimal sizes and structures in cells.
Keywords: biomolecular condensate, block copolymer, long noncoding RNA, micellization, microphase separation
Subject Categories: RNA Biology
Experiment‐based theoretical frameworks imply that RNA‐based paraspeckles are assembled through micellization, a type of microphase separation.

Introduction
Membraneless organelles, also known as cellular bodies or biomolecular condensates, have attracted much attention because of their involvement in biological processes and pathological conditions, and because of the physical process of their formation by phase separation (Hyman et al, 2014; Banani et al, 2017; Shin & Brangwynne, 2017; Alberti & Dormann, 2019). In particular, liquid–liquid phase separation (LLPS), a type of phase separation, is widely used in a variety of biological processes (Banani et al, 2017; Shin & Brangwynne, 2017; Alberti et al, 2019; Strom & Brangwynne, 2019; Sabari et al, 2020). Many biomolecular condensates contain proteins, such as intrinsically disordered proteins and oligomer‐forming proteins, and RNAs (Sawyer et al, 2019; Choi et al, 2020; Sabari et al, 2020). Although the mechanisms of protein phase separation have been extensively studied, the role of RNA remains poorly understood.
A class of RNA, termed architectural RNA (arcRNA), plays an essential scaffolding role in the formation of phase‐separated condensates in various eukaryotic species from yeast to human (Chujo et al, 2016; Chujo et al, 2017; Yamazaki et al, 2018; Yamazaki et al, 2019; Roden & Gladfelter, 2021). The arcRNAs include several categories of RNA transcripts, mainly long noncoding RNAs (lncRNAs), which are pervasively transcribed from eukaryotic genomes and are important cellular regulatory factors (Quinn & Chang, 2016; Schmitt & Chang, 2017). Among the lncRNAs, non‐repetitive lncRNAs, repeat‐derived lncRNAs, short tandem repeat‐enriched RNAs, and disease‐associated repetitive RNAs have been identified as arcRNAs (Sasaki et al, 2009; Chujo et al, 2016; Chujo et al, 2017; Hall et al, 2017; Dumbović et al, 2018; Fox et al, 2018; Yap et al, 2018; Swinnen et al, 2019; Ninomiya & Hirose, 2020). NEAT1_2 lncRNA is a representative arcRNA and constructs paraspeckle nuclear bodies (Chen & Carmichael, 2009; Clemson et al, 2009; Sasaki et al, 2009; Sunwoo et al, 2009). NEAT1_2 lncRNA (22.7 kb) is a longer isoform of the NEAT1 gene and is essential for paraspeckle formation, whereas NEAT1_1 (3.7 kb), a shorter isoform, is not essential for paraspeckle formation (Naganuma et al, 2012). NEAT1_2 lncRNAs are upregulated by several factors, including proteasome inhibition, p53 activation, and viral infections, and play critical roles in various physiological and pathological conditions (Hirose et al, 2014; Imamura et al, 2014; Nakagawa et al, 2014; Standaert et al, 2014; Mello et al, 2017; Nakagawa et al, 2018). At the molecular level in HeLa cells, a single spherical paraspeckle has been shown to contain approximately 50 NEAT1_2 molecules (Chujo et al, 2017). More than 60 paraspeckle proteins (PSPs) are enriched in paraspeckles, and several of these PSPs are required for the paraspeckle formation processes (Naganuma et al, 2012; Kawaguchi et al, 2015; Yamazaki & Hirose, 2015). Proteins, including SFPQ and NONO, are required for the expression of NEAT1_2 lncRNA, and several proteins, including NONO, FUS, and RBM14, are required for paraspeckle assembly (Naganuma et al, 2012; Hennig et al, 2015; Yamazaki et al, 2018). Specifically, oligomerization of NONO through NOPS and coiled‐coil domains and interactions through the low‐complexity domains of FUS and RBM14 are required for paraspeckle assembly (Hennig et al, 2015; Yamazaki et al, 2018). We have used CRISPR/Cas9‐mediated dissection of NEAT1_2 in human haploid HAP1 cells to demonstrate that NEAT1_2 has modular functional RNA domains for RNA stabilization, isoform switching from NEAT1_1 to NEAT1_2, and paraspeckle assembly (Yamazaki et al, 2018). The middle domain of NEAT1_2 contains multiple binding sites for NONO and SFPQ that are necessary and sufficient for paraspeckle assembly through phase separation (Yamazaki et al, 2018). Previous studies using electron microscopy (EM) and super‐resolution microscopy (SRM) have shown that paraspeckles can have a spherical or cylindrical shape (Souquere et al, 2010; West et al, 2016). The short axis (Sx) of paraspeckles is constrained (~ 360 nm), while the long axis (Lx) elongates upon transcriptional NEAT1_2 upregulation in cylindrical paraspeckles (Souquere et al, 2010; Yamazaki et al, 2018). Additionally, NEAT1_2 is looped and highly spatially organized within paraspeckles with the 5′ and 3′ ends of NEAT1_2 localized in the shell of the paraspeckle and the middle domain localized in the core of the paraspeckle (Souquere et al, 2010; West et al, 2016; Yamazaki et al, 2018). The 5′ and 3′ domains appear to be bundled and form distinct domains in the shells of the paraspeckles (West et al, 2016). PSPs also show specific patterns of localization within paraspeckles, suggesting a core‐shell structure for the paraspeckles (West et al, 2016). These characteristic shapes and the internal organization of paraspeckles are distinct from those of the typical condensates formed by LLPS that are spherical and have non‐ordered internal structures, although phase‐separated condensates with core‐shell or multi‐layered architectures have been also reported (e.g., Feric et al, 2016; Fei et al, 2017; Harmon et al, 2018; Boeynaems et al, 2019). At present, it is unknown how the NEAT1_2 lncRNA determines both the paraspeckle shape and the highly ordered NEAT1_2 organization within it.
Here, we addressed these questions both experimentally and theoretically. We first experimentally identified the 5′ and 3′ RNA domains of NEAT1_2 that determine the shell localization by dissecting NEAT1_2 lncRNA in vivo. We then applied soft matter physics theories to understand the principles of the formation of the paraspeckle structure. We treated the paraspeckles as amphipathic block copolymer micelles, which form spherical and cylindrical shapes with ordered internal structures analogous to paraspeckles. Our theoretical model could explain and predict the observed behaviors of the paraspeckles formed by wild type (WT) and mutant NEAT1_2 in terms of the internal organization, size, number, and shape. Thus, this study provides a conceptual framework for the formation and structure of nuclear biomolecular condensates with RNA scaffolds.
Results
The 3′ terminal domain of NEAT1_2 is required for localization of the 3′ end in the shell of paraspeckles
In HAP1 WT cells, quantitative analyses using SRM have shown that the 5′ and 3′ ends of NEAT1_2 are localized in the shell of paraspeckles, as previously indicated by EM analyses (Souquere et al, 2010) (Figs 1A and F, and EV1A and B). It has been suggested that the 5′ and 3′ terminal domains of NEAT1_2 determine the shell localization of the 5′ and 3′ ends of the NEAT1_2 transcripts. We found that the truncated 3′ end of the NEAT1_2 Δ16.6–22.6 kb mutant (Δ3′ mutant) was localized in the core of paraspeckles, even in the presence of the 3′‐terminal triple‐helix structure (Yamazaki et al, 2018). We have also observed that the expression of NEAT1_1 and NEAT1_2 in Δ3′ mutant cells was comparable to that in WT cells (Yamazaki et al, 2018). Then, we further characterized this Δ3′ mutant. In Δ3′ mutant cells, in which no paraspeckle assembly defects were detected (Fig EV1C), quantitative analysis using SRM showed the localization of the 3′ end of the Δ3′ mutant to the core of the paraspeckles, whereas the 5′ end remained localized in the shell (Figs 1A, B, and F, and EV1B). The EM analysis confirmed that the truncated 3′ end of the Δ3′ mutant was localized in the core without affecting the localization of the 5′ end in the shell (Figs 1C and F, and EV1D). 5′ and D2 probes for EM were used to detect the localization in the shells and cores, respectively, in WT cells, as previously reported (Souquere et al, 2010) (Fig EV1E and F). Thus, the 16.6–22.6 kb region of NEAT1_2 is required for the shell localization of the 3′ end of NEAT1_2, but its deletion does not appreciably affect the assembly of the paraspeckles.
Figure 1. Deletion of the 3′ terminal domain of NEAT1_2 causes core localization of the 3′ ends of NEAT1_2 within the paraspeckle.
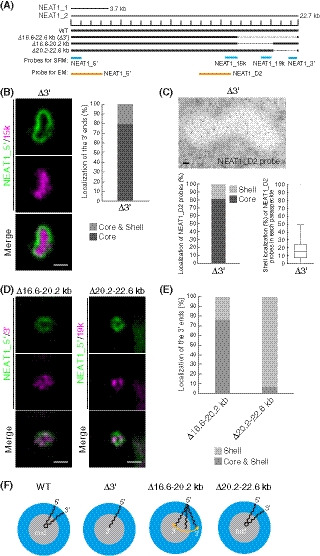
- The schematics of human NEAT1_2 (WT) and the mutants with deletions in the 3′ terminal regions. The NEAT1 transcripts are shown above with a scale. The gray dashed lines represent the deleted regions. The positions of NEAT1 probes used in SRM (blue) and EM (orange) are shown.
- (left) SRM images of paraspeckles in HAP1 NEAT1 Δ3′ mutant cells (Δ3′) detected by NEAT1_5′ (green) and NEAT1_15k (magenta) FISH probes in the presence of MG132 (5 μM for 6 h). Scale bar, 500 nm. (right) Graph showing the proportion of paraspeckles with localization of the NEAT1 3′ ends in the core or in the core and shell (n = 44).
- (upper) EM observation of the paraspeckles in Δ3′ cells using NEAT1_D2 probes in the presence of MG132 (5 μM for 17 h). Scale bar, 100 nm. (lower, left) Graph showing the proportion of localization of the NEAT1 region detected by NEAT1_D2 probe (248 gold particles) within the paraspeckles in Δ3′ cells. (lower, right) Graph showing the proportion of localization of NEAT1_D2 probes in each paraspeckle in Δ3′ cells (n = 17). The box plot shows the median (inside line), 25–75 percentiles (box bottom to top), and 10–90 percentiles (whisker bottom to top).
- SRM images of the paraspeckles in Δ16.6–20.2 and Δ20.2–22.6 kb cells detected by NEAT1_5′ (green) and NEAT1_3′ or 19k (magenta) FISH probes in the presence of MG132 (5 μM for 6 h). Scale bar, 500 nm.
- Graph showing the proportion of paraspeckles with localization of the NEAT1 3′ ends to the core and shell or the core in Δ16.6–20.2 and Δ20.2–22.6 kb cells treated with MG132 (5 μM for 6 h). (Δ16.6–20.2 kb: n = 230, Δ20.2–22.6 kb: n = 99)
- Schematics of the NEAT1_2 configuration in WT and deletion mutants.
Source data are available online for this figure.
Figure EV1. Characterization of NEAT1 mutants with deletions in the NEAT1_2 3′ terminal regions.

- (left) SRM images of the paraspeckles in HAP1 WT cells detected by NEAT1_5′ (green) and NEAT1_3′ (magenta) FISH probes with MG132 treatment (5 μM for 6 h). Scale bar, 500 nm. (right) Graph showing the proportion of paraspeckles with localization of the NEAT1 3′ ends to the core and shell or the shell in WT cells (n = 167).
- Graph showing the proportion of paraspeckles with localization of the NEAT1 5′ ends to the core and shell or the shell in WT, Δ3′, Δ16.6–20.2 kb, and Δ20.2–22.6 kb cells treated with MG132 (5 μM for 6 h; WT: n = 115, Δ3′: n = 21, Δ16.6–20.2 kb: n = 161, and Δ20.2–22.6 kb: n = 89).
- (left) Detection of NEAT1_2 by single‐molecule FISH (smFISH; magenta) in HAP1 WT, Δ3′, Δ16.6–20.2 kb, and Δ20.2–22.6 kb cells treated with MG132 (5 μM for 6 h). Nuclei were stained with DAPI. Scale bar, 10 nm. (right) Quantitation of area and sum intensity per paraspeckle in each cell line (WT: n = 407, Δ3′: n = 314, Δ16.6–20.2 kb: n = 302, and Δ20.2–22.6 kb: n = 609). (***P = 0.0001, ****P < 0.0001, compared with WT: Kruskal–Wallis test with Dunn's multiple comparison test). Each box plot shows the median (inside line), 25–75 percentiles (box bottom to top), and 10–90 percentiles (whisker bottom to top).
- (left) EM observations of the paraspeckles in MG132‐treated (5 μM for 17 h) HAP1 Δ3′ cells using NEAT1_5′ probe. Scale bar, 100 nm. (middle) Graph showing the proportion of the localization of NEAT1_5′ probes (838 gold particles) within the paraspeckles in Δ3′ cells. (right) Graph showing the proportion of localization of NEAT1_5′ probes in each paraspeckle in Δ3′ cells (n = 21). The box plot shows the median (inside line), 25–75 percentiles (box bottom to top), and 10–90 percentiles (whisker bottom to top).
- (left) EM observation of the paraspeckles in MG132‐treated (5 μM for 17 h) HAP1 WT cells using NEAT1_5′ probe. Scale bar, 100 nm. (middle) Graph showing the proportion of localization of NEAT1_5′ probes (601 gold particles) within the paraspeckles in WT cells. (right) Graph showing the proportion of localization of NEAT1_5′ probes in each paraspeckle in WT cells (n = 16). The box plot shows the median (inside line), 25–75 percentiles (box bottom to top), and 10–90 percentiles (whisker bottom to top).
- (left) EM observation of the paraspeckles in MG132‐treated (5 μM for 17 h) HAP1 WT cells using the NEAT1_D2 probe. Scale bar, 100 nm. (middle) Graph showing the proportion of localization of NEAT1_D2 probes (461 gold particles) within the paraspeckles in WT cells. (right) Graph showing the proportion of localization of NEAT1_D2 probes in each paraspeckle in WT cells (n = 24). The box plot shows the median (inside line), 25–75 percentiles (box bottom to top), and 10–90 percentiles (whisker bottom to top).
- Quantitation of the relative expression levels of NEAT1_1 and NEAT1_2 by RT–qPCR in HAP1 WT, Δ16.6–20.2 kb, and Δ20.2–22.6 kb cells treated with MG132 (5 μM for 6 h). Data are represented as mean ± SD (n = 3).
- SRM images of the paraspeckles in MG132‐treated (5 μM for 6 h) WT cells detected by NEAT1_5′ (green) and NEAT1_19k (magenta) FISH probes. Scale bar, 500 nm.
- Graph showing the proportion of paraspeckles with localization of the NEAT1_19k probes to the core and shell or the core in WT cells treated with MG132 (5 μM for 6 h; n = 103).
Source data are available online for this figure.
To determine the precise region of the NEAT1_2 domain that is required for the shell localization, we established two HAP1 mutant cell lines (Δ16.6–20.2 and Δ20.2–22.6 kb; Fig 1A). In both cell lines, the NEAT1_2 expression levels were comparable to that of the WT, and the paraspeckles were formed similarly to the WT (Fig EV1C and G). As shown by SRM, in the majority of the Δ16.6–20.2 kb cells, the 3′ ends of this NEAT1_2 mutant were distributed in both the core and shell of the paraspeckles (Fig 1D and E). In contrast, the 3′ ends of NEAT1_2 in the Δ20.2–22.6 kb cells were mostly detected in the shell, similar to the WT paraspeckles, indicating that this region played only a minor role in the shell localization (Figs 1D and E, and EV1H, and I). Altogether, these data revealed that, unlike the WT and Δ3′ mutant, the Δ16.6–20.2 kb mutant showed a random distribution of the 3′ end within the paraspeckles (Fig 1F); thus, the NEAT1_2 16.6–20.2 kb region has a major role in the proper shell localization of the 3′ end of NEAT1_2.
The 5′ terminal domain of NEAT1_2 is required for shell localization of the 5′ end within the paraspeckles
We next investigated whether the 5′ terminal domain of NEAT1_2 has a role in the shell localization of the 5′ end. We used two mutant cell lines, the previously established NEAT1 Δ0–0.8 kb and a newly established Δ0–1.9 kb (Δ5′ mutant), in which NEAT1_2 was expressed comparably to that in WT cells, although a NEAT1 0–1 kb deletion has been previously shown to prevent NEAT1_2 accumulation (Yamazaki et al, 2018) (Figs 2A and EV2A). No paraspeckle assembly defects were observed in these cell lines (Fig EV2B). Our SRM analysis showed that the signals of the 5′ end were randomly localized within the paraspeckles for both mutants, whereas the signals of the 3′ end were detected in the shells in both cell lines (Figs 2B and C, and EV2C). Consistent with these data, EM observations confirmed the random localization of the 5′ region of NEAT1_2 in the Δ5′ mutant cells (Fig 2D). We also examined the localization of the middle region of NEAT1_2 in detail using the D2 probe for EM (Fig 2A). The middle region was mainly detected in the inner and middle layers of the paraspeckles in WT cells, as has been previously reported (Souquere et al, 2010), but in the Δ5′ mutant cells, the middle region was mainly detected in the outer and middle layers of the paraspeckles, suggesting that this region had a tendency toward being localized in the shells of the paraspeckles (Fig EV2D). Collectively, these data showed that the 5′ terminal domain of NEAT1 is required for the shell localization of the 5′ end and influences the internal distribution of the NEAT1_2 transcripts within the paraspeckles (Fig 2E).
Figure 2. Deletion of 5′ terminal domain of NEAT1_2 causes random distribution of the NEAT1_2 5′ ends within the paraspeckle.
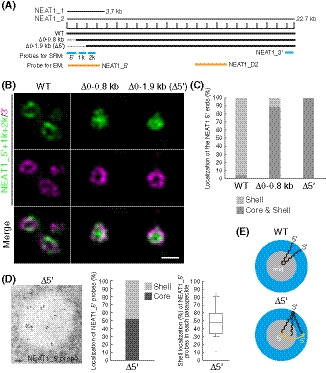
- The schematics of WT NEAT1_2 and mutants with deletions in the 5′ terminal regions are shown in Fig 2A. The positions of NEAT1 probes used in SRM (blue) and EM (orange) are shown.
- SRM images of the paraspeckles in Δ0–0.8 and Δ0–1.9 kb (Δ5′) cells treated with MG132 (5 μM for 6 h) detected by NEAT1_5′, 1k, and 2k (green) and NEAT1_3′ (magenta) FISH probes. Scale bar, 500 nm.
- Graph showing the proportion of paraspeckles with localization of the NEAT1 5′ ends to the core and shell or the shell in WT, Δ0–0.8 kb, and Δ5′ cells treated with MG132 (5 μM for 6 h). (WT: n = 159, Δ0–0.8 kb: n = 54, Δ5′: n = 48)
- (left) EM observation of the paraspeckles in Δ5′ cells treated with MG132 (5 μM for 17 h) using NEAT1_5′ probes. Scale bar, 100 nm. (middle) Graph showing the proportion of localization of NEAT1_5′ probes (347 gold particles) within the paraspeckles in Δ5′ cells. (right) Graph showing the proportion of the localization of NEAT1_5′ probes in each paraspeckle in Δ5′ cells (n = 20). The box plot shows the median (inside line), 25–75 percentiles (box bottom to top), and 10–90 percentiles (whisker bottom to top).
- Schematics of the NEAT1_2 configuration in the WT and Δ5′ mutant.
Source data are available online for this figure.
Figure EV2. Characterization of NEAT1 mutants with deletions in the NEAT1_2 5′ terminal regions.

- Quantitation of the relative expression levels of NEAT1_1 and NEAT1_2 by RT–qPCR in HAP1 WT, Δ5′, and Δ5′/ΔPAS cells treated with MG132 (5 μM for 6 h). Data are represented as mean ± SD (n = 3).
- (upper) Detection of NEAT1_2 by smFISH (magenta) in WT, Δ0–0.8 kb, Δ5′, and Δ5′/ΔPAS kb cells treated with MG132 (5 μM for 6 h). Nuclei were stained with DAPI. Scale bar, 10 nm. (lower) Quantitation of area and sum intensity per paraspeckle in each cell line (WT: n = 839, Δ0–0.8 kb: n = 845, Δ5′: n = 535, and Δ5′/ΔPAS: n = 652). (*P = 0.0420, ****P < 0.0001, compared with WT: Kruskal–Wallis test with Dunn's multiple comparison test). Each box plot shows the median (inside line), 25–75 percentiles (box bottom to top), and 10–90 percentiles (whisker bottom to top).
- Graph showing the proportion of paraspeckles with localization of the NEAT1 3′ ends to the core and shell or the shell in WT, Δ0–0.8 kb, and Δ5′ cells treated with MG132 (5 μM for 6 h) by SRM analyses (WT: n = 167, Δ0–0.8 kb: n = 77, Δ5′: n = 48).
- (upper panels) EM observations of the paraspeckles in MG132‐treated (5 μM for 17 h) WT and Δ5′ cells using the NEAT1_D2 probe. Scale bar, 100 nm. (bottom, left) Graph showing the proportion of localization (three layers: outer, middle, and inner layers [black circles indicate the boundaries]) of NEAT1_D2 probes (WT: 307 gold particles, Δ5′: 167 gold particles) within the paraspeckles in HAP1 Δ5′ cells. (bottom, right) Graph showing the proportion of localization of NEAT1_D2 probes in each paraspeckle in WT (n = 22) and Δ5′ cells (n = 15). (***P = 0.0001, ****P < 0.0001, compared with WT: Mann–Whitney test (two‐tailed)). Each box plot shows the median (inside line), 25–75 percentiles (box bottom to top), and 10–90 percentiles (whisker bottom to top).
- Quantitation of the relative expression levels of NEAT1_1 and NEAT1_2 by RT–qPCR in HAP1 WT and Δ0–2.8 kb cells. Data are represented as mean ± SD (n = 3).
- Detection of the paraspeckles by smFISH in WT and Δ0–2.8 kb cells. Scale bar, 10 nm.
- (left) The paraspeckles in Δ5′/ΔPAS cells treated with MG132 treatment (5 μM for 6 h) detected with SRM by NEAT1_2k (green) and 3′ (magenta) FISH probes. Scale bar, 500 nm. (right) Graph showing the proportion of paraspeckles with localization of the NEAT1 5′ ends to the core and shell or the shell in Δ5′/ΔPAS cells (n = 31).
Source data are available online for this figure.
As the truncated 3′ terminal region of NEAT1_2 was localized in the paraspeckle core in the Δ3′ mutant cells, we attempted to obtain the corresponding 5′ terminal deletion clone of NEAT1 with exclusive core localization of the 5′ end, by establishing the additional 5′ terminal deletion cell line, NEAT1 Δ0–2.8 kb. However, in this cell line, NEAT1_2 was not expressed at all; hence, paraspeckles were not formed (Fig EV2E and F), precluding further analysis.
NEAT1_1 overlaps with the 5′ terminal region of NEAT1_2, and it is impossible to distinguish these two transcripts by fluorescence in situ hybridization (FISH). Thus, to validate the configuration of the 5′ end of NEAT1_2 in the Δ5′ mutant cells, we established the Δ5′/ΔPAS cell line, which lacks a polyadenylation signal (PAS) for NEAT1_1 production. In this cell line, NEAT1_1 expression was reduced (Fig EV2A). The localization of the 5′ region of NEAT1_2 was still random within the paraspeckles, as observed in the Δ5′ mutant cells (Fig EV2G), suggesting that NEAT1_1 did not affect the arrangement of NEAT1_2 observed above. Thus, 5′ terminal deletion triggers the internalization of the 5′ truncated end of NEAT1_2.
Simultaneous deletion of the 5′ and 3′ terminal domains of NEAT1_2 causes random distribution of NEAT1_2 within the paraspeckles
As we had identified the NEAT1_2 RNA domains required for the shell localization of the 5′ and 3′ regions of NEAT1_2, we next investigated how the deletion of both the domains, 0–1.9 kb and 16.6–22.6 kb, influenced the NEAT1_2 spatial organization. We established a Δ5′/Δ3′ (Δ0–1.9 kb/Δ16.6–22.6 kb) mutant cell line, in which NEAT1_2 was expressed comparable to that in WT cells and no paraspeckle assembly defects were observed (Figs 3A and EV3A and B). In contrast to the highly ordered core‐shell NEAT1_2 organization of the paraspeckles in WT cells, SRM observations clearly showed that the core‐shell organization of the NEAT1_2 was totally lost in the Δ5′/Δ3′ mutant cells (Fig 3B and C). In addition, the 5′ and 3′ terminal regions of NEAT1_2 occupied different spaces within the paraspeckle, which might reflect the bundles of NEAT1_2 RNPs (West et al, 2016) and/or the hydrophilic nature of the NEAT1_2 5′ and 3′ regions to gather within the hydrophobic core. Additionally, EM analyses revealed that the 5′ terminal region was detected equally in both the shell and core of the paraspeckles, while the 3′ terminal region was almost randomly distributed with a slight tendency toward core localization (Fig 3D and E). These data were confirmed by SRM of the Δ5′/Δ3′/ΔPAS mutant cell line, which has reduced NEAT1_1 expression compared with the WT (Fig EV3C and D). Together with the data shown in Figs 1 and 2, these data suggested that both the 5′ and 3′ domains were essential for localizing both the ends of NEAT1_2 in the shell of paraspeckles.
Figure 3. Deletion of both the 5′ and 3′ terminal domains of NEAT1_2 causes random distribution of both the 5′ and 3′ ends of NEAT1_2 within the paraspeckle.
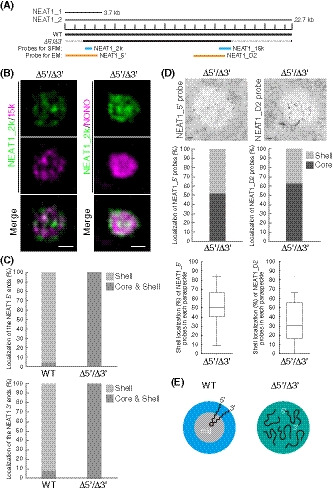
- The schematics of the WT and the mutant (Δ5′/Δ3′) with deletion of the 5′ and 3′ terminal regions are shown as Fig 1A. The positions of the NEAT1 probes used in SRM (blue) and EM (orange) are shown.
- SRM images of the paraspeckles in MG132‐treated (5 μM for 6 h) HAP1 NEAT1 Δ5′/Δ3′ cells detected by NEAT1_2k (green) and NEAT1_15k FISH probes (left, magenta) or NONO immunofluorescence (IF; right, magenta). Scale bar, 500 nm.
- Graph showing the proportion of paraspeckles with localization of the NEAT1 5′ (upper; WT: n = 41, Δ5′/Δ3′ kb: n = 44) and 3′ (lower: WT, n = 167, Δ5′/Δ3′ kb: n = 34) ends to the core and shell or the shell in WT and Δ5′/Δ3′ kb cells treated with MG132 (5 μM for 6 h).
- (upper) EM observation of the paraspeckles in MG132‐treated (5 μM for 17 h) Δ5′/Δ3′ cells using NEAT1_5′ (left) and NEAT1_D2 probes (right). Scale bar, 100 nm. (middle) Graph showing the proportion of the localization of NEAT1_5′ (left, 310 gold particles) and NEAT1_D2 (right, 294 gold particles) probes within the paraspeckles in HAP1 NEAT1 Δ5′/Δ3′ cells. (lower) Graph showing the proportion of the localization of NEAT1_5′ (left, 19 cells) and D2 (right, 22 cells) probes in each paraspeckle in Δ5′/Δ3′ cells. Each box plot shows the median (inside line), 25–75 percentiles (box bottom to top), and 10–90 percentiles (whisker bottom to top).
- Schematics of the NEAT1_2 configuration in the WT and Δ5′/Δ3′ mutant.
Source data are available online for this figure.
Figure EV3. Characterization of NEAT1 mutants with deletions in both the NEAT1_2 5′ and 3′ regions.
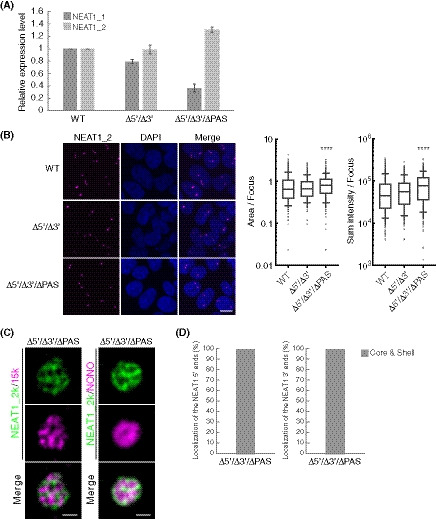
- Quantitation of the relative expression levels of NEAT1_1 and NEAT1_2 by RT–qPCR in HAP1 WT, Δ5′/Δ3′, and Δ5′/Δ3′/ΔPAS cells treated with MG132 (5 μM for 6 h). Data are represented as mean ± SD (n = 3).
- (left) Detection of NEAT1_2 by smFISH (magenta) in WT, Δ5′/Δ3′, and Δ5′/Δ3′/ΔPAS cells treated with MG132 (5 μM for 6 h). Nuclei were stained with DAPI. Scale bar, 10 nm. (right) Quantitation of area and sum intensity per paraspeckle in each cell line (WT: n = 744, Δ5′/Δ3′: n = 425, and Δ5′/Δ3′/ΔPAS: n = 435). (****P < 0.0001, compared with WT: Kruskal–Wallis test with Dunn's multiple comparison test). Each box plot shows the median (inside line), 25–75 percentiles (box bottom to top), and 10–90 percentiles (whisker bottom to top).
- The paraspeckles detected with SRM by NEAT1_2k FISH probe (green), and NEAT1_15k FISH probe or NONO IF (magenta) in the Δ5′/Δ3′/ΔPAS cells treated with MG132 (5 μM for 6 h). Scale bar, 500 nm.
- Graph showing proportion of paraspeckles with localization of the NEAT1 5′ (left, n = 41) and 3′ (right, n = 14) ends to the core and shell in Δ5′/Δ3′/ΔPAS cells treated with MG132 (5 μM for 6 h).
Source data are available online for this figure.
Block copolymer micelle model of paraspeckles
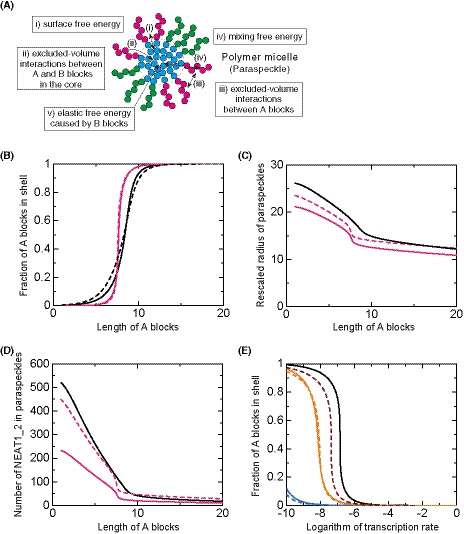
We have recently established the framework for arcRNA‐induced phase separation using an extension of the Flory–Huggins theory, which is the standard theory for the phase separation of polymers in solutions (Yamamoto et al, 2020a). In this framework, arcRNA‐induced, phase‐separated assemblies are treated as disordered condensates formed through macroscopic phase separation, such as LLPS. However, this premise does not fit the nature of paraspeckles. Paraspeckles possess highly ordered internal structures and their shapes can be cylindrical, as well as spherical, which is distinct from LLPS‐induced spherical droplets (Souquere et al, 2010; West et al, 2016). The 5′ and 3′ terminal domains compose the shell, whereas, the middle domain, which is the primary paraspeckle assembly domain that interacts with oligomer‐forming NONO proteins, composes the core of paraspeckles (Souquere et al, 2010; West et al, 2016; Yamazaki et al, 2018). The core‐shell structure is analogous to the micelle structure of block copolymers, that is, polymers composed of two or more chemically distinct polymer blocks (Mai & Eisenberg, 2012; Bates & Bates, 2017). The simplest AB diblock copolymers, which are composed of two distinct polymer blocks, self‐assemble to form various shapes, including spheres and cylinders (Fig 4A). These shapes are determined by (i) the ratio of the lengths of the A and B blocks; (ii) the interaction strength between the monomer units in the A and B blocks; and (iii) the polymer concentration (Mai & Eisenberg, 2012; Bates & Bates, 2017). The size of the phases depends on the length of the block copolymer because the A and B blocks are connected and cannot separate from each other. Such phase separation, in which the assemblies have an optimal size and shape, is called microphase separation. In a narrow sense, microphase separation often refers to the formation of a pattern of microphases across the entire system and occurs discontinuously across the spinodal line. The microphase separation would be related to micellization. In the micellization, micelles are assembled locally and the number of micelles increases continuously as the concentration of amphiphiles increases (Safran, 2003; Mai & Eisenberg, 2012). In a broad sense, the micellization can be regarded as a type of microphase separation because the assemblies have an optimal size and shape in both of the processes. Thus, we here refer to the assembly of paraspeckles as micellization, a type of microphase separation to emphasize the difference from macroscopic phase separation, such as LLPS. Amphipathic block copolymers, in which two or more blocks with different affinities to a solvent (e.g., hydrophilic and hydrophobic blocks) are connected, self‐assemble into spherical and cylindrical micelles in water (Mai & Eisenberg, 2012; Bates & Bates, 2017). The characteristics of paraspeckles, such as the cylindrical shape and the ordered internal organization of NEAT1_2, are reminiscent of block copolymer micelles. Because NEAT1_2 forms RNPs with various RNA‐binding proteins (RBPs), in which each of 5′ and 3′ terminal domains and the middle domain all form distinct RNP domains within a paraspeckle (Naganuma et al, 2012; West et al, 2016; Nakagawa et al, 2018), we considered NEAT1_2 RNPs to be analogous to ABC triblock copolymers (Moughton et al, 2012) (Fig 4B). The A and C blocks corresponding to the 5′ and 3′ terminal regions, respectively, of NEAT1_2 outside of the major middle domain (8–16.6 kb) can be treated as hydrophilic domains exposed to the nucleoplasm. The B block, that is, the middle domain of NEAT1_2 that NONO proteins interact with and oligomerize to bridge NEAT1_2 to induce paraspeckle assembly with associated proteins, such as FUS (Naganuma et al, 2012; Hennig et al, 2015; Yamazaki et al, 2018), can be treated as the hydrophobic core domain of a paraspeckle, where the NONO forms dimers largely through hydrophobic interactions (Passon et al, 2012) (Fig 4B). We then constructed a theoretical model of paraspeckle formation by treating paraspeckles as ABC triblock copolymer micelles (preprint: Yamamoto et al, 2020b). In this model, we treated paraspeckles as spherical micelles and each block was considered to be composed of identical units for simplicity (also see the Discussion section). We used this model to analyze the localization of the A (and C) blocks, corresponding to the 5′ (and 3′) ends of NEAT1_2, and the size of the micelles (paraspeckles; Fig 4C). A fraction, α, of the A blocks is localized in the shell, and the other fraction, 1 − α, is localized in the core. The fraction α is determined by minimizing the free energy of the micelle, which takes into account: (i) the surface free energy (which is the energy cost because the B block units at the surface of the core cannot bind with other B block units, unlike the units in the interior of the core, and is proportional to the surface area); (ii) the excluded‐volume interactions between the A and B blocks in the core (which is the energy cost because the A block units in the core disturb the binding between the B block units); (iii) the excluded‐volume interactions between the A blocks, and between the C blocks, in the shell (which are repulsive interactions between A or C blocks because these blocks are hydrophilic and thus tend to mix with the solvent); and (iv) the mixing free energy (which is the contribution of thermal fluctuations to randomly distribute the A blocks between the core and the shell) (Doi, 1996; preprint: Yamamoto et al, 2020b). Theoretical analysis of the localization of A (and C) blocks (the 5′ [and 3′] terminal domains of NEAT1_2) could rationalize the phenotypes observed in the NEAT1_2 deletion mutants described above: As the length of the A or C block becomes shorter, the A or C block is redistributed to the core of the micelles (paraspeckles; Fig 4D). Therefore, our micelle model can be used to explain the reorganization of the NEAT1_2 ends within the paraspeckles as observed in the NEAT1_2 mutants.
Figure 4. Block copolymer micelle model of paraspeckles.
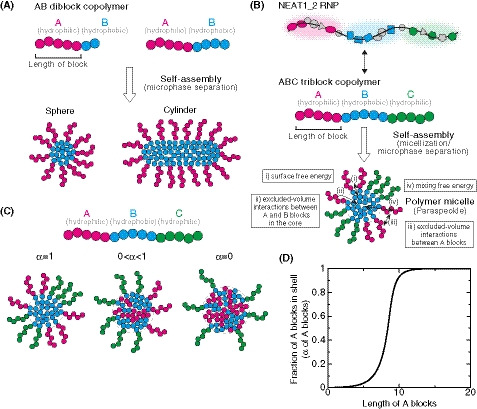
- Schematics of AB diblock copolymers with different lengths of blocks and examples of the microphases (sphere and cylinder) that they form. Different blocks are shown in different colors (magenta and cyan).
- Schematics showing analogies between NEAT1_2 RNP (upper) and ABC triblock copolymer (middle), and a triblock copolymer micelle and a paraspeckle (lower). Different blocks consisting of RNA and the putative partner RBPs are shown in different colors (magenta, cyan, and green). The energetic contributions that are considered in the theoretical model (from i to iv) are also shown. They include (i) the surface free energy of the core (B block) of the polymer micelle (the paraspeckle), (ii) the excluded‐volume interactions between the A and B blocks, which are energy cost in entering the A blocks into the core (B blocks), (iii) the excluded‐volume interactions between the A (or C) blocks in the shell, (iv) the mixing free energy of thermal fluctuations that randomly distribute A (or C) blocks between the core and the shell (see the text for further details).
- In the copolymer micelle model, B blocks are localized in the core and C blocks are localized in the shell. A fraction, α, of A blocks are localized in the shell, and the other fraction, 1 − α, are localized in the core.
- The fraction α of the A blocks in the shell versus the length of the A blocks (represented by the number of segments) of spherical paraspeckles in the steady state. The parameters used for the calculations are shown in the Materials and Methods.
Paraspeckles behave as triblock copolymer micelles
We further attempted to validate our theoretical model experimentally. The model predicts that the organization within triblock copolymer micelles will influence the size of the assemblies. In this model, based on the theory of block copolymers (Halperin & Alexander, 1989; Semenov et al, 1995; Zhulina et al, 2005), the size of the paraspeckles is constrained by the repulsive excluded‐volume interactions between the A blocks, or between the C blocks, localized in the shell of the paraspeckles because these interactions limit the number of the incorporated NEAT1_2 molecules and the size of the paraspeckles (preprint: Yamamoto et al, 2020b). Without these repulsive interactions, as in the case of typical condensates assembled by LLPS, the shape and dynamics of the condensates are governed by the surface tension; condensates are therefore always spherical and grow via coalescence to minimize the surface area (Doi, 2013). The fact that paraspeckles of WT NEAT1_2 can form cylinders and be present as clusters, instead of showing coalescence (Visa et al, 1993; Souquere et al, 2010; Hirose et al, 2014; West et al, 2016), suggested the repulsive excluded‐volume interactions between the 3′ terminal regions, and those between the 5′ terminal regions, are analogous to the interactions in polymer micelles (Halperin & Alexander, 1989; Semenov et al, 1995; Zhulina et al, 2005). The deletion of the 5′ and/or 3′ terminal domains of NEAT1_2, corresponding to the A and/or C blocks, reduced the excluded‐volume interactions (which decreased with a decrease in the local concentration of the A and/or C blocks) because of the redistribution of the terminal domains to the core (Fig 4D). Then, the number of incorporated NEAT1_2 molecules was increased, leading to the enlargement of the paraspeckles. Our model therefore predicts that, as the length of the A or C blocks decreases, both the size of the paraspeckles and the number of incorporated NEAT1_2 molecules become larger (Fig 5A and B).
Figure 5. Paraspeckles behave as triblock copolymer micelles.
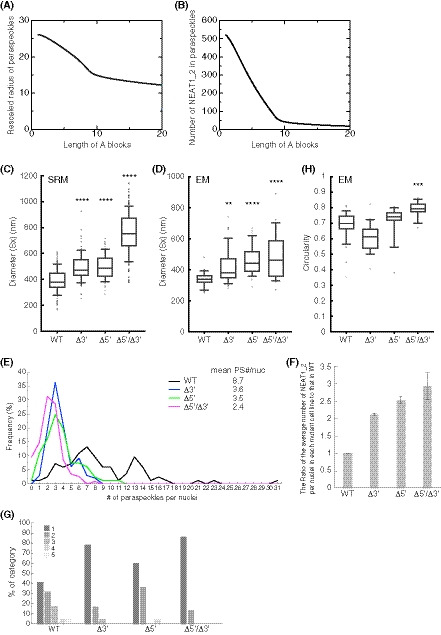
- Theoretical calculation of the radius of paraspeckles versus the length of the A blocks (represented by the number of segments) of spherical paraspeckles in the steady state. The radius was rescaled by the segment length. The parameters used for the calculations are shown in the Materials and Methods.
- Theoretical calculation of the number of NEAT1_2 transcripts versus the length of the A blocks (represented by the number of segments) of spherical paraspeckles in the steady state. The parameters used for the calculations are shown in the Materials and Methods.
- Diameters (Sx) of the paraspeckles in WT, Δ3′, Δ5′, and Δ5′/Δ3′ cells treated with MG132 (5 μM for 6 h) determined by SRM (WT: n = 129, Δ3′: n = 106, Δ5′: n = 100, Δ5′/Δ3′: n = 292). WT (mean size: 387.5 nm), Δ3′ (mean size: 492.4 nm), Δ5′ (mean size: 497.7 nm), and Δ5′/Δ3′ mutant (mean size: 753.3 nm). (****P < 0.0001, compared with WT: Kruskal–Wallis test with Dunn's multiple comparison test). Each box plot shows the median (inside line), 25–75 percentiles (box bottom to top), and 10–90 percentiles (whisker bottom to top).
- Diameter (Sx) of the paraspeckles in WT, Δ3′, Δ5′, and Δ5′/Δ3′ cells treated with MG132 (5 μM for 17 h) determined by EM (WT: n = 35, Δ3′: n = 49, Δ5′: n = 39, Δ5′/Δ3′: n = 28). WT (mean size: 339.4 nm), Δ3′ (mean size: 416.4 nm), Δ5′ (mean size: 457.4 nm), and Δ5′/Δ3′ (mean size: 488.9 nm). (**P = 0.0041, ****: P < 0.0001, compared with WT: Kruskal–Wallis test with Dunn's multiple comparison test). Each box plot shows the median (inside line), 25–75 percentiles (box bottom to top), and 10–90 percentiles (whisker bottom to top).
- The number of paraspeckles per nuclei in each cell line. The mean numbers are shown (mean PS (paraspeckle) #/nuc; WT: n = 83, Δ3′: n = 99, Δ5′: n = 103, Δ5′/Δ3′: n = 115). Statistical analysis showed a significant reduction in the paraspeckle numbers in the Δ3′ (P < 0.0001), Δ5′ (P < 0.0001), and Δ5′/Δ3′ (P < 0.0001) mutants compared with the WT. The number of paraspeckles in the Δ5′/Δ3′ was significantly fewer than that in the Δ3′ and Δ5′ (P < 0.0001 compared with Δ3′, P = 0.0023 compared with Δ5′).
- The ratio of the average number of NEAT1_2 per nuclei in each mutant cell line to that in the WT. Data are represented as mean ± SD (n = 3).
- The proportion of the number of the paraspeckles in each cluster determined by EM in HAP1 WT, Δ3′, Δ5′, and Δ5′/Δ3′ cells treated with MG132 (5 μM for 17 h). (WT: n = 82, Δ3′: n = 37, Δ5′: n = 53, Δ5′/Δ3′: n = 34).
- Circularity (4π × surface area/[perimeter]2) of the paraspeckles in HAP1 WT, Δ3′, Δ5′, and Δ5′/Δ3′ cells treated with MG132 (5 μM for 17 h) determined by EM (WT: n = 33, Δ3′: n = 21, Δ5′: n = 19, Δ5′/Δ3′: n = 19). WT (mean: 0.6844), Δ3′ (mean: 0.6057), Δ5′ (mean: 0.7151), Δ5′/Δ3′ (mean: 0.7921). (***P = 0.0001, compared with WT: Kruskal–Wallis test with Dunn's multiple comparison test). Each box plot shows the median (inside line), 25–75 percentiles (box bottom to top), and 10–90 percentiles (whisker bottom to top).
To experimentally examine this prediction, we measured the sizes of the paraspeckles in the WT, Δ3′, Δ5′, and Δ5′/Δ3′ mutant cell lines. Measurements using SRM showed that the Sx values of the paraspeckles in the Δ3′ and Δ5′ mutants were larger than that in the WT (Fig 5C). The Sx value of the paraspeckles in the Δ5′/Δ3′ mutant was much larger than those in the WT and the other mutants, although the length of the NEAT1_2 Δ5′/Δ3′ arcRNA itself was the shortest (Fig 5C). We validated these data using EM and obtained similar results (Fig 5D). The Sx values of all the deletion mutants, Δ3′, Δ5′, and Δ5′/Δ3′, were larger than that of the WT, although the Sx value of the Δ5′/Δ3′ mutant may have been underestimated because of the spherical shape of the paraspeckles (as described below). Additionally, the Lx values of the paraspeckles in the Δ3′, Δ5′, and Δ5′/Δ3′ cells tended to be larger compared with those of the paraspeckles in the WT cells (Fig EV4A). The surface areas of the paraspeckles, as observed by EM, were larger in the Δ3′, Δ5′, and Δ5′/Δ3′ cells than those of the paraspeckles in the WT cells (Fig EV4B). We also experimentally examined whether more NEAT1_2 RNA molecules were incorporated into the paraspeckles in the Δ3′, Δ5′, and Δ5′/Δ3′ cells than into those in the WT cells as theoretically predicted. The NEAT1_2 expression levels were quantified by reverse transcription‐quantitative PCR (RT–qPCR) and the paraspeckle number per nuclei was determined by high‐resolution microscopy in these cell lines. Because NEAT1_2 arcRNAs are exclusively localized in paraspeckles (Sasaki et al, 2009; Chujo et al, 2017), we estimated the number of NEAT1_2 molecules per paraspeckle, relative to the value in the WT, as the expression level divided by the average number of paraspeckles per nuclei. The analysis revealed that the number of paraspeckles per nuclei was greater in the WT compared with that in the other mutants, although the expression levels of NEAT1_2 were similar in all the cell lines (Figs 5E and EV4C). The calculated numbers of NEAT1_2 per paraspeckle were two to threefold higher in the Δ3′, Δ5′, and Δ5′/Δ3′ mutants than in the WT cells (Fig 5F), which was in agreement with the sizes of the paraspeckles as shown in Fig 5C and D. Furthermore, EM analysis showed that the number of paraspeckles per cluster in the deletion mutant cells was fewer than that in the WT cells (Figs 5G and EV4D). Approximately 79, 60, and 87% of the paraspeckles in the Δ3′, Δ5′, and Δ5′/Δ3′ mutant cells, respectively, were present as a single entity. The deletion of the 5′ and/or 3′ terminal domains, corresponding to the A and C blocks, led to the enlargement of the paraspeckles through incorporation of more NEAT1_2 transcripts into the paraspeckles, which is consistent with our theoretical predictions.
Figure EV4. Additional size and structure parameters determined by EM for the paraspeckles of NEAT1 mutants.
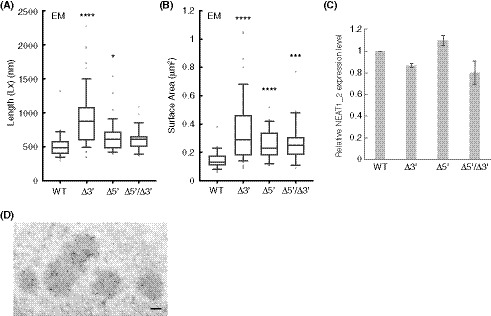
- Length (Lx) of the paraspeckles determined by EM in HAP1 WT, Δ3′, Δ5′, and Δ5′/Δ3′ cells treated with MG132 (5 μM for 17 h). WT (mean size: 518.6 nm, n = 35), Δ3′ (mean size: 937.1 nm, n = 49), Δ5′ (mean size: 648.1 nm, n = 39), and Δ5′/Δ3′ (mean size: 608.9 nm, n = 28). (*P = 0.0451, ****P < 0.0001, compared with WT). Each box plot shows the median (inside line), 25–75 percentiles (box bottom to top), and 10–90 percentiles (whisker bottom to top).
- Surface area of the paraspeckles determined by EM in WT, Δ3′, Δ5′, and Δ5′/Δ3′ cells treated with MG132 (5 μM for 17 h). WT (mean area: 0.1497 μm2, n = 35), Δ3′ (mean area: 0.3684 μm2, n = 49), Δ5′ (mean area: 0.2582 μm2, n = 39), and Δ5′/Δ3′ (mean area: 0.2657 μm2, n = 28). (***P = 0.0008, ****P < 0.0001, compared with WT). Each box plot shows the median (inside line), 25–75 percentiles (box bottom to top), and 10–90 percentiles (whisker bottom to top).
- An analysis of the NEAT1_2 expression levels for quantification of the NEAT1_2 number per paraspeckle. Data are represented as mean ± SD (n = 3).
- A representative image of a cluster of paraspeckles detected by paraspeckle marker proteins, BRG1 (gold particles) under EM in the presence of MG132. In this image, five paraspeckles form a cluster. Scale bar, 100 nm.
The block copolymer theory also predicted that the internal organization of NEAT1_2 will influence the shape of the paraspeckles. When the repulsive interactions are reduced or diminished, the condensates form more spherical shapes. The surface repulsive interactions between the A blocks, and those between the C blocks, are reduced by the redistribution of these blocks into the core, so surface tension becomes the dominant contribution that determines the shape of the condensates, leading to the formation of spherical condensates to minimize the surface free energy (Doi, 2013). Our circularity analyses based on the EM observations revealed that the shapes of the paraspeckles in the Δ5′/Δ3′ mutant cells, which have random internal NEAT1_2 organization, were closer to spherical than those in the WT and the other mutants, as theoretically predicted (Fig 5H). These data suggested that the Δ5′/Δ3′ mutant paraspeckles appear to lack most of the A and C blocks, leading to the formation of spherical paraspeckles with random internal organization, similar to macroscopic phase separation.
The transcriptional level of NEAT1_2 is a key determinant for the size and organization of the paraspeckles
We observed that the paraspeckles in the Δ5′/Δ3′ mutant cells formed large spherical condensates without core‐shell architectures. This situation is similar to our theoretical model of arcRNA‐driven phase separation using an extension of the Flory–Huggins theory (Yamamoto et al, 2020a). This model predicts that the size of the condensates will become larger with increasing NEAT1_2 expression levels (Fig 6A). To test this prediction experimentally, we examined the sizes of the paraspeckles in the Δ5′/Δ3′/ΔPAS mutant cells with different NEAT1_2 expression levels. We measured the Sx values of the paraspeckles by SRM in changing the NEAT1_2 expression levels using various concentrations of a transcriptional activator of NEAT1_2, the proteasome inhibitor MG132, which activates NEAT1 transcription without changing the expression levels of essential PSPs, whereas MG132 (5 μM) was used in previous experiments as shown in Figs 1, 2, 3 (Hirose et al, 2014). The NEAT1_2 levels increased in a MG132 dose‐dependent manner (Fig 6B). As the expression levels increased, the paraspeckles in the mutant cell line formed larger spheres with larger Sx values (Fig 6C and D). In contrast, as the expression levels increased, the paraspeckles in the WT cells were elongated with almost constant Sx values, as has been reported previously for HeLa cells (Hirose et al, 2014) (Fig 6B–D). These data suggested that, unlike in the WT cells, the size of the spherical paraspeckles in the Δ5′/Δ3′/ΔPAS mutant cells increased by coalescence as long as NEAT1_2 RNPs were available because of the loss of surface repulsive interactions; thus, the size was determined primarily by the NEAT1_2 expression level, which is similar to the situation with macroscopic phase separation.
Figure 6. The transcription level of NEAT1_2 is a key determinant for the size and organization of paraspeckles.

- Theoretical calculation of the rescaled radius of paraspeckles versus the rescaled transcription rate for the case in which the A and C blocks were deleted by CRISPR/Cas9 in the steady state. The graph is derived by assuming that NEAT1_2 is produced at a constant rate. The produced NEAT1_2 RNPs diffuse in the solution and the free diffusion is hindered by the attractive interactions between NEAT1_2 RNPs with the interaction parameter χ (we used χ = 1.0). NEAT1_2 was degraded at the constant rate k 0. The radius was rescaled by the length scale D/k0 and the transcription rate was rescaled by the inverse time scale k0D/k03/2/v0.
- Quantitation of NEAT1_2 by RT–qPCR in WT and Δ5′/Δ3′/ΔPAS cells with or without MG132 treatment (6 h). Data are represented as mean ± SD (n = 3).
- The paraspeckles in WT and Δ5′/Δ3′/ΔPAS cells detected by SRM using NEAT1_5′ and 2k FISH probes (green), and NONO IF (magenta) under the conditions shown in (B). Scale bar, 500 nm.
- Quantitation of the diameter (Sx) observed by SRM in WT and Δ5′/Δ3′/ΔPAS cells under the conditions shown in (B). WT (mean size: MG132 (−), 354.2 nm [n = 32]; MG132 0.25 μM, 380.5 nm [n = 68]; MG132 1 μM, 394.1 nm [n = 108]; MG132 5 μM, 409.6 nm [n = 103]), Δ5′/Δ3′/ΔPAS (mean size: MG132 (−), 344.4 nm [n = 18]; MG132 0.25 μM, 472.1 nm [n = 27]; MG132 1 μM, 601.4 nm [n = 27]; MG132 5 μM, 721.2 nm [n = 26]). (*P = 0.029, ****P < 0.0001, compared with WT: Kruskal–Wallis test with Dunn's multiple comparison test). Each box plot shows the median (inside line), 25–75 percentiles (box bottom to top), and 10–90 percentiles (whisker bottom to top).
- Theoretical calculation of the fraction of A (or C) blocks in the shell vs the logarithm of the transcription rate (rescaled by the rate at which the transcripts are spontaneously incorporated in the paraspeckle). The numbers of segments of A blocks were 5.0 (cyan), 7.5 (orange), 10.0 (green), and 12.5228 (black). The parameters used for the calculations are shown in the Materials and Methods.
- Quantitation of NEAT1_2 by RT–qPCR in Δ0–0.8 kb cells with or without MG132 treatment (5 μM for 6 h). Data are represented as mean ± SD (n = 3).
- The paraspeckles detected by SRM with NEAT1_5′, 1k, and 2k (green), and NEAT1_3′ (magenta) FISH probes in the Δ0–0.8 kb cells under the conditions shown in (H). Scale bar, 500 nm.
- Graph showing proportion of paraspeckles with localization of the NEAT1 5′ ends to the core and shell or the shell in Δ0–0.8 kb cells under the conditions shown in (F) (MG132 (−): n = 78, MG132 (+): n = 127).
Source data are available online for this figure.
In the block copolymer micelle model, the transcription level of NEAT1_2 is one of the most important parameters controlling the internal organization of NEAT1_2 in the paraspeckles (preprint: Yamamoto et al, 2020b). Our theory predicts that as the transcription rate increases, the fractions of the 5′ and 3′ terminal regions that are localized in the shell will decrease (Fig 6E), and these regions are redistributed to the core or become randomly distributed. This redistribution is because increasing the number of NEAT1_2 molecules in the paraspeckle has a greater effect on the repulsive interactions between the A blocks (and those between the C blocks) in the shell compared with the repulsive interactions between the B blocks and A or C blocks in the core (preprint: Yamamoto et al, 2020b). To experimentally test this prediction, we observed the paraspeckles in Δ0–0.8 kb mutant cells in the absence and presence of MG132. MG132 treatment strongly enhanced the expression (~ 7‐fold) of NEAT1_2 in the Δ0–0.8 kb mutant cells (Fig 6F). In the absence of MG132, most of the paraspeckles showed shell localization of the 5′ ends as predicted, whereas, in the presence of MG132, most of the paraspeckles showed random localization of the NEAT1 5′ regions (Fig 6G and H), these results were consistent with the data shown in Fig 2B and C. Collectively, our triblock copolymer micelle model of paraspeckles can explain the experimentally observed characteristics of paraspeckles.
Discussion
We identified the 5′ and 3′ terminal domains of NEAT1_2 arcRNA as the shell‐forming domains that determine the spatial organization of NEAT1_2 within paraspeckles (Fig 7A). These shell‐forming domains are distinct RNA domains that are located outside of the major assembly domain of NEAT1_2 (8–16.6 kb) (Yamazaki et al, 2018), the deletion of which did not affect the paraspeckle assembly itself. Paraspeckles possess characteristic cylindrical shapes with restricted Sx values and are distinct from other cellular bodies formed by macroscopic phase separation, such as LLPS (Peng & Weber, 2019; Yamazaki et al, 2019). Thus, paraspeckles are most likely formed through micellization, a type of microphase separation, that dictates an optimal structure and size of the assemblies (Mai & Eisenberg, 2012; Moughton et al, 2012; Bates & Bates, 2017). Our theoretical approach that treats paraspeckles as amphipathic ABC triblock copolymer micelles could explain and predict the spatial organization of NEAT1_2 within paraspeckles in WT and 5′ and/or 3′ terminal deletion mutants, and how changes in the spatial organizational influenced the size, number, and shape of the paraspeckles (Fig 7B). The model also predicted that the transcription level of NEAT1_2 will influence the size of the paraspeckles and the internal NEAT1_2 organization (Fig 7B). All the predictions were experimentally supported by SRM and EM analyses using the NEAT1_2 deletion mutants. Our experimental and theoretical data suggested that the presence of the 5′ and 3′ domains of NEAT1_2 switches the paraspeckle formation process from macroscopic phase separation to microphase separation. Thus, we propose that the paraspeckles are constructed as block copolymer micelles (Fig 7B).
Figure 7. Summary of the block copolymer micelle model of paraspeckles.
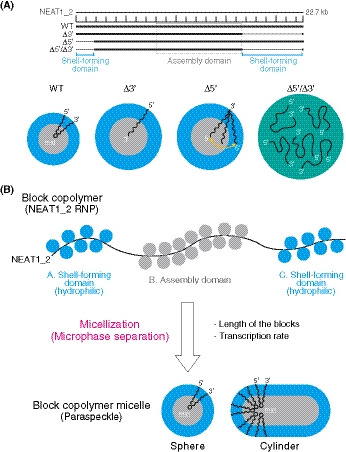
- Functional NEAT1_2 RNA domains for paraspeckle assembly and shell localization of the 5′ and 3′ ends of the NEAT1_2 within the paraspeckles. Summary of the NEAT1_2 organization within the paraspeckle and the size of the paraspeckles in the representative NEAT1_2 mutants used in this study.
- The triblock copolymer micelle model for paraspeckles. NEAT1_2 RNPs are treated as ABC triblock copolymers. Putative RNA‐binding proteins (blue circles) interact with the shell‐forming domains and the proteins involved in the paraspeckle assembly (e.g., NONO; gray circles) mainly bind to the middle assembly domain. The NEAT1_2 RNPs are microphase‐separated into paraspeckles as block copolymer micelles to form spherical and cylindrical shapes. The length of the blocks and the transcription rate of NEAT1_2 influence the organization, size, and shape of the paraspeckles.
Cells usually require a mechanism to control the size of phase‐separated structures that would otherwise grow without bound by coarsening and coalescence. Several mechanisms for size limitation, such as the elastic energy of the cytoskeleton, kinetic limitations on coarsening, stoichiometric constraints, multiple nucleation sites, and emulsification, have been reported (Brangwynne et al, 2009; Berry et al, 2015; Berry et al, 2018; Style et al, 2018; Dar & Pappu, 2020; Ranganathan & Shakhnovich, 2020; Rosowski et al, 2020; Sabari et al, 2020; Wei et al, 2020). Our study shows that paraspeckles employ a different mechanism—micellization to control their size. Micellization likely provides a tighter control over sizes, which are defined by the block sizes, when compared with that of other reported mechanisms, and this control is limited to molecular dimensions. In addition to the size control, micellization differs from LLPS; micellization is a continuous process where the number of assemblies increases continuously, whereas an LLPS is a discontinuous process, in which phase separation occurs across a certain threshold (which is called the binodal line), although the nucleation dynamics of the assembly on the short time scale is similar for both processes. These distinct features of micellization may contribute to the functions of the paraspeckle (discussed below).
In our theoretical model, we treated NEAT1_2 RNPs as triblock copolymers (Fig 7B). lncRNAs usually interact with RBPs to perform their functions and NEAT1_2 has various partner RBPs, such as NONO, which is a major partner protein of the middle assembly domain (the B block) (Nakagawa et al, 2018; Yamazaki et al, 2018). Thus, it is likely that proteins interacting with RNA sequences and/or secondary structures in the 5′ and 3′ shell‐forming domains determine the hydrophilic nature of these domains and thus, the localization of these domains in the shell (Fig 7B). In polymer physics, polymer blocks are hydrophilic when the mixing entropy, that is, the contribution of thermal fluctuations, dominates the block–block, water–water, and water–block interactions (Doi, 1996). In such cases, the hydrophilic blocks tend to be mixed with the water molecules and the interaction between hydrophilic blocks is considered as effective repulsion (Doi, 1996). Further investigations, including an analysis of how the partner proteins of the shell‐forming domains generate repulsive interactions, would advance our understanding of the mechanism of paraspeckle structural formation.
In the current theoretical model, for simplicity we assumed that the A and C blocks were composed of identical units, as is the case for uniform polymers, such as synthetic polymers. This would be the situation if the RBPs uniformly interacted with the NEAT1_2 A and C blocks. However, it is plausible that the RBPs bind to specific sub‐regions of the NEAT1_2 A and C blocks. Our deletion analyses suggest that the 0–0.8 kb and 16.6–20.2 kb regions of NEAT1_2 are sub‐domains that play major roles in the shell localization of the 5′ and 3′ terminal domains, respectively, although we do not rule out the possibility that NEAT1_2 regions outside of these sub‐domains also have roles in the shell localization. It has been previously reported that in a mini‐NEAT1 mutant that consisted of 0–1 kb and middle assembly (8–16.6 kb) domains and the triple‐helix structure of NEAT1_2, the 5′ domain was localized in the shell of paraspeckles, suggesting that the 0–1 kb domain was sufficient for shell localization, which is consistent with the results of the present study (Yamazaki et al, 2018). In the Δ16.6–20.2 kb mutant, the 3′ ends were localized in both the core and shell of the paraspeckle, whereas in the Δ3′ mutant, the 3′ ends were localized in the core. One interpretation of these results is that in the Δ16.6–20.2 kb mutant, the 20.2–22.6 kb regions can fluctuate between the core and shell of the paraspeckle. In contrast, the 3′ ends are localized in the core because the Δ3′ mutant lacks the 3′ terminal region that can fluctuate between the core and shell. This interpretation can be applied to the Δ0–0.8 kb and Δ5′ mutants. Thus, in such cases, while the current theoretical model incorporates important aspects of paraspeckle formation, it would be of interest to extend this theoretical model to reflect this fluctuation to model the paraspeckle formation more precisely.
Paraspeckles are often found as clusters (Visa et al, 1993; Hirose et al, 2014) (Fig 5G). This phenomenon can be explained by our block copolymer micelle model. The repulsive interactions between the A blocks, or between the C blocks, in the shell of the paraspeckles may suppress the coalescence of the paraspeckles. This explanation is consistent with the data that the number of paraspeckles in clusters was considerably decreased in the 5′ and/or 3′ deletion mutants (Fig 5G). Repulsive interactions are also crucial in assembling cylindrical paraspeckles. In the micelle model, the structure of the paraspeckles is determined by minimizing the free energy. When the paraspeckles are enlarged upon prolonged transcriptional activation, cylindrical shapes are favorable because i) the free energy owing to the repulsive interactions between A, or C blocks, in the shells of cylindrical paraspeckles is less than that in spherical paraspeckles and ii) the free energy of the middle region of NEAT1_2 in cylindrical paraspeckles is less than that in spherical paraspeckles (Halperin & Alexander, 1989; Semenov et al, 1995; Zhulina et al, 2005). The latter free energy is the elastic energy caused by the polymer blocks, such as the middle region of NEAT1_2, being stretched as springs toward the center of the paraspeckle core because of their connectivity (Semenov, 1985; Doi, 1996). A cylindrical shape is therefore stable above a certain threshold of the NEAT1_2 expression level, which is consistent with the frequent observations of cylindrical paraspeckles in MG132‐treated human, mouse, and opossum cells (Hirose et al, 2014; Cornelis et al, 2016; Yamazaki et al, 2018). In addition to the WT paraspeckles, the paraspeckles in Δ3′ mutant cells often showed elongated shapes (Figs 5H and EV4A). The mechanism for the sphere–cylinder morphological transition can be explained by the theory of micelles of AB block copolymers (Halperin & Alexander, 1989; Semenov et al, 1995; Zhulina et al, 2005), although we need to extend our theory to understand the transition from a sphere to a cylinder more quantitatively.
As introduced above, the elastic free energy in the B blocks may contribute to the structure and size of the paraspeckle. Thus, we constructed a different version of triblock copolymer micelle model of the spherical paraspeckle by also taking into account the elastic free energy in the B blocks (Fig EV5A). The data generated from this model gave essentially the same results as the data from the original triblock copolymer model (Fig EV5B–E) (see the Materials and Methods for details). Thus, our model represents and predicts features of the paraspeckle effectively.
Figure EV5. Contributions of stretching free energy of B blocks in the core to the structure of paraspeckles.
- Energetic contributions of triblock copolymer micelle model of the paraspeckle considering elastic free energy of B blocks (see the Materials and Methods for details).
- Theoretical calculation of the fraction α of the A blocks in the shell versus the length of the A blocks (represented by the number of segments) of spherical paraspeckles in the steady state with (magenta) and without (black) the stretching free energy of B blocks in the core. The parameters used for the calculations are shown in the Materials and Methods (the broken curves are results for the excluded volume vA/b3=0.5 and vC/b3=0.5). These data are related to Fig 4D.
- Theoretical calculation of the radius of paraspeckles versus the length of the A blocks (represented by the number of segments) of spherical paraspeckles in the steady state with (magenta) and without (black) the stretching free energy of B blocks in the core. The radius was rescaled by the segment length. The parameters used for the calculations are shown in the Materials and Methods (the broken curves are the results for the excluded volume vA/b3=0.5 and vC/b3=0.5). These data are related to Fig 5A.
- Theoretical calculation of the number of NEAT1_2 transcripts versus the length of the A blocks (represented by the number of segments) of spherical paraspeckles in the steady state with (magenta) and without (black) the stretching free energy of B blocks in the core. The parameters used for the calculations are shown in the Materials and Methods (the broken curves are the results for the excluded volume vA/b3=0.5 and vC/b3=0.5). These data are related to Fig 5B.
- Theoretical calculation of the fraction of A (or C) blocks in the shell vs the logarithm of the transcription rate (rescaled by the rate at which the transcripts are spontaneously incorporated in the paraspeckle). The numbers of segments of A blocks were 5.0 (cyan), 7.5 (orange), 8.15785 (brown), and 8.86482 (black). The parameters used for the calculations are shown in the Materials and Methods (the broken curves are the results for the excluded volume vA/b3=0.5 and vC/b3=0.5). These data are related to Fig 6E.
In the present study, we determined that the 5′ and 3′ terminal regions contained shell‐forming domains that were independent of the localization of the other region. A previous study has suggested that NEAT1_2 RNPs are looped within a paraspeckle (the looped hypothesis) (Souquere et al, 2010). It has also been proposed that RNA–RNA base pairing mediated long‐range interactions between the 5′ and 3′ terminal regions of NEAT1_2 that contributed to the looping (Lin et al, 2018). These long‐range interactions might also be mediated by proteins. Although the looping alone cannot explain the core‐shell structure of paraspeckles and definitive in vivo experimental evidence for the long‐range interactions is lacking, further investigations may elucidate a possible role of the looping in the NEAT1_2 arrangement within a paraspeckle.
Block copolymers composed of synthetic monomers have been well studied to generate a variety of materials with distinct physical properties and functions, and various nano‐order shapes of the self‐assemblies, including spheres, cylinders, lamellae, and vesicles, can be formed by changing the length of the blocks (Mai & Eisenberg, 2012; Moughton et al, 2012). In this study, we generated paraspeckles with different sizes and shapes by deleting the NEAT1_2 A and/or C blocks. Thus, it is tempting to speculate that RNAs have the potential to form various structures with distinct properties as polymer scaffolds, likely with RBPs, in cells. Nuclear stress bodies constructed by HSATIII arcRNAs possess a sea‐island structure, a typical structure formed by block copolymers, and thus, these bodies might be formed by a similar mechanism (Chiodi et al, 2000; Kawaguchi et al, 2015; Ninomiya et al, 2019). Furthermore, as NEAT1_2 has modular domains, such as UG repeats for TDP‐43 recruitment (Modic et al, 2019), it might be possible that addition of such modular domains to arcRNAs may result in the acquisition of new functions by the recruitment of specific RBPs. A similar concept has been shown in block copolymer research (Ouchi et al, 2011; Lutz et al, 2013). Therefore, the domains of arcRNAs may be used to determine the size, structure, and function of condensates, and thus, it may be possible to design RNA‐based microphase‐separated condensates or “RNP block copolymer micelles (RNP micelles)”.
In addition to our theoretical framework for RNA‐driven macroscopic phase separation (Yamamoto et al, 2020a), our block copolymer micelle model will be useful for further experimental investigation and theoretical modeling of RNA‐driven phase separation. As various molecular functions of paraspeckles have been reported (Chen & Carmichael, 2009; Hirose et al, 2014; Imamura et al, 2014; West et al, 2014; West et al, 2016; Jiang et al, 2017; Li et al, 2017; Bonetti et al, 2020; Cai et al, 2020), using this model may contribute to understanding the relationship between the core‐shell structures, the number and size of paraspeckles, and the paraspeckle functions. For example, it has been reported that paraspeckles that form in close proximity to the NEAT1 gene locus are released from the locus and widely distributed to the nucleoplasm (Mao et al, 2011), which is likely to be important for genome‐wide targeting of the paraspeckles to chromatins (Li et al, 2017; Bonetti et al, 2020; Cai et al, 2020). Herein, we demonstrated that micellization limits the size of the paraspeckle and increases the number of the paraspeckles. Moreover, spherical Δ5′/Δ3′ mutant paraspeckle form a few large condensates per nucleus, which are presumably localized near NEAT1_2 transcription sites. Thus, these features of the size and the number of the paraspeckles likely contribute to the genome‐wide targeting of the paraspeckles to chromatins and facilitate interactions with other nucleoplasmic complexes. In addition, the hydrophilic surface of the micellar structure is important for dispersion or motility of paraspeckles in the nucleoplasm by solubilizing the paraspeckles in the nucleoplasm. A further possible importance of micellization of the paraspeckle is that fusion of the paraspeckles is repressed. Because NEAT1 is a highly expressed lncRNA and the paraspeckles globally interact with chromatins, formation of too large condensates and frequent coalescences of paraspeckles might influence various nuclear events such as chromatin organization. These features of micelles might minimize such adverse effects. A recent report of the CasDrop system has shown that fusion of condensates formed by LLPS reorganize nuclear chromatin architectures (Shin et al, 2018). Therefore, there may be such an influence if coalescence of the paraspeckles frequently occurs. Another possible importance is that the micellar structure of the paraspeckle may be suitable for the sequestration of the specific RNA molecules to or kinetic enhancement of pre‐miRNA processing onto the surface of the paraspeckles (Hirose et al, 2014; Imamura et al, 2014; Jiang et al, 2017). Many paraspeckles produced by micellization are also expected to increase the surface area of the paraspeckles, which would be beneficial for the efficient sequestration and/or chromatin interaction. Hence, it would be interesting to investigate these possibilities in the future.
It has been recently proposed that chromatins, which are long polymers, behave as block copolymers (Belanghzal et al, 2021; Hildebrand & Dekker, 2020) and our work develops the concept that RNPs can function as block copolymers to form highly ordered RNP micelles in cells. Further work is needed to elucidate the molecular details (e.g., the components, including RBPs, and the RNA sequence and structural elements) of the RNP block copolymers. Finally, this work provides a foundation for future studies of microphase‐separated RNP block copolymer micelles in cells.
Materials and Methods
Cell culture
HAP1 cells (Horizon Discovery) were maintained in IMDM (Gibco) supplemented with 10% FBS purchased from Gibco or Sigma‐Aldrich (Appendix Table S2).
Genome editing using CRISPR/Cas9
CRISPR‐mediated deletions of the NEAT1 gene were performed as previously described (Yamazaki et al, 2018) (Appendix Table S2). The sequences of the sgRNA and HAP1 mutant cell lines established in this study are listed in Appendix Table S1. The sgRNAs were cloned into a PX330‐B/B vector (Yamazaki et al, 2018) for use for the deletions of the NEAT1 gene.
Reverse transcription‐quantitative PCR
Purification, reverse‐transcription of total RNA, and qPCR for NEAT1_1 and NEAT1_2 were performed as previously described in detail (Yamazaki et al, 2018) (Appendix Table S2). The primers used in this study are listed below. For NEAT1_2 detection, the NEAT1–2′ primer set (forward primer: 5′‐CAATTACTGTCGTTGGGATTTAGAGTG‐3′, reverse primer: 5′‐TTCTTACCATACAGAGCAACATACCAG‐3′) was used. For detection of NEAT1_2, the NEAT1–6 primer set (forward primer: 5′‐CAGTTAGTTTATCAGTTCTCCCATCCA‐3′, reverse primer: 5′‐GTTGTTGTCGTCACCTTTCAACTCT‐3′) or NEAT1–12 primer set (forward primer: 5′‐TGTGTGTGTAAAAGAGAGAAGTTGTGG‐3′, reverse primer: 5′‐AGAGGCTCAGAGAGGACTGTAACCTG‐3′) was used. 18S (forward primer: 5′‐TTTAAGTTTCAGCTTTGCAACCATACT‐3′, reverse primer: 5′‐ATTAACAAGAACGAAAGTCGGAGGT‐3′) or GAPDH (forward primer: 5′‐ATGAGAAGTATGACAACAGCCTCAAGAT‐3′ reverse primer: 5′‐ATGAGTCCTTCCACGATACCAAAGTT‐3′) primer sets were used as loading controls.
RNA‐FISH and immunofluorescence
RNA‐FISH and immunofluorescence were performed as previously described (Yamazaki et al, 2018). Confocal and super‐resolution microscopic analyses (structured illumination microscopy: SIM) were performed as previously described (Yamazaki et al, 2018). LSM900 with Airyscan2 for super‐resolution imaging was used in the analysis of the quantification of paraspeckle numbers per nucleus. The antibodies used in this study are listed in Appendix Table S2. The NEAT1 FISH probes for SRM analyses against 5′ (NEAT1: +1 to +1,000), 1k (+1,208 to +1,935), 2k (+2,025 to +2,783), 15k (+1,5401 to +16,612), and 19k (+19,401 to +20,040) and 3′ (+21,743 to +22,580) were transcribed as antisense RNAs. smFISH was performed using the human NEAT1_m probe (LGC Biosearch Technologies) as previously described (Yamazaki et al, 2018) (Appendix Table S2).
Electron microscopy
Ultrastructural studies were carried out on ultra‐thin sections of Lowicryl K4 M‐embedded cell pellets as previously described (Souquere & Pierron, 2015). Duplicated samples of WT and mutant HAP1 cells grown in the absence or presence of 5 μM MG132 for 17 h were fixed in situ with 1.6% glutaraldehyde (Electron Microscopic Sciences) or 4% formaldehyde (Electron Microscopic Sciences), scraped off from the plastic containers, and centrifuged. The cell pellets were equilibrated in 30% methanol and deposited in a Leica EM AFS2/FSP automatic reagent handling apparatus (Leica Microsystems). Lowicryl polymerization under UV was performed for 40 h at –20°C and 40 h at 20°C. The DNA probes for high‐resolution in situ hybridization (EM‐ISH) were PCR‐amplified DNA fragments, biotinylated by nick translation (Roche) with biotin‐16‐dUTP (Roche) but with no TTP in the reaction mix. The NEAT1_5′ DNA probe (+230–1,721 and +1,751–3,244), the D2 probe (+1,2841–14,160 and +14,735–15,897) and hybridization conditions, and detection of RNA/DNA hybrids with goat anti‐biotin antibody conjugated to 10 nm gold particles (BBI International) were as previously described (Souquere et al, 2010; Souquere & Pierron, 2015). Occasionally, ultra‐thin sections of formaldehyde‐fixed cells were pre‐treated with protease (0.2 mg/ml) for 15 min at 37°C to enhance access of the biotinylated DNA probes to the NEAT1 targets. The thin sections were briefly contrasted with uranyl acetate and analyzed with a Tecnai Spirit (FEI). Digital images were taken with an SIS Megaview III charge‐coupled device camera (Olympus). The geometry of the nuclear body sections (short axes [Sx], long axes [Lx], and surface areas) and gold particle distribution were determined with AnalySIS (Olympus Soft Imaging Solutions). Resources used in the EM are listed in Appendix Table S2.
Triblock copolymer micelle model
We have recently developed a model that treats paraspeckles as micelles of triblock copolymers (preprint: Yamamoto et al, 2020b, in which the details of the mathematical formalism are described). The construction of the model was motivated by the fact that paraspeckles show a core‐shell structure, analogous to polymer micelles. In our theory, NEAT1_2 is treated as an ABC triblock copolymer. The B blocks are localized in the core, and the C blocks are localized in the shell. A fraction, α of the A blocks are in the shell and the other fraction, 1 − α are in the core. A blocks and C blocks form distinct domains in the shell. The feature of each block results from the nature of RBPs bound to the block. Here, the B blocks tend to associate with each other because RBPs that are prone to dimerize/oligomerize to assemble the core, such as NONO, bind to these blocks (Yamazaki et al, 2018), whereas A and C blocks have higher affinity toward the nucleoplasm because RBPs that exhibit hydrophilic properties bind to these blocks to form the shell. We treat simple cases by considering that the number of RBPs in the nucleoplasm is large, the binding energy between RBPs and NEAT1_2 transcripts is large, and the binding of RBPs to NEAT1_2 is fast. In such cases, the complexes can be treated as copolymers, where RBPs are implicitly taken into account in the interaction parameters of polymer units (Yamamoto et al, 2020a).
Polymer micelle theory predicts that the optimal size of polymer micelles composed of AB block copolymers (B blocks form the core, and A blocks form the shell) is determined by the free energy composed of (i) the surface free energy (which is the total surface area of the core multiplied by the surface tension) and (ii) the free energy because of the repulsive excluded‐volume interactions between the segments of A blocks in the shell (Halperin & Alexander, 1989; Semenov et al, 1995; Zhulina et al, 2005). The magnitudes of the latter interactions are represented by the excluded volumes of A units v A and C units v C, which take into account the entropy of mixing of polymer units and solvent molecules and the interaction energy difference between the different molecular species and the same molecular species (Doi, 1996). Many theories regarding polymer micelles assume that all the A blocks are in the shell. In paraspeckles, the A and C blocks in the shell are separated in different domains and a fraction, 1 − α of the A blocks are in the core. Therefore, we took into account (iii) the free energy from the repulsive excluded‐volume interactions between the C blocks in the shell; (iv) the free energy from the repulsive interactions between the B blocks and the A blocks in the core; and (v) the free energy from the mixing entropy (that contributes to equally distributing the A blocks to the shell and the core) in an extension of the free energy calculations for polymer micelles. We determined the fraction, α of A blocks in the shell by minimizing the free energy, Fn (α). With an optimal value of the fraction, α, the free energy is a function only of the number n of NEAT1_2 molecules. This treatment is effective for cases in which the reorganization of paraspeckles is faster than the transcription dynamics.
Polymer blocks in the core stretch as the radius of the paraspeckle increases and this increases the stretching free energy (Halperin & Alexander, 1989; Semenov et al, 1995; Zhulina et al, 2005). The stretching free energy also contributes to the structure of paraspeckles (see also Fig EV5). The stretching free energy of B blocks decreases the radius of paraspeckles (Fig EV5C) because this energy term decreases the number of transcripts in paraspeckles (Fig EV5D). The stretching free energy therefore plays a similar role to the free energy due to the excluded‐volume interactions between A blocks and those between C blocks in the shell. The stretching free energy is small for cases in which B blocks are relatively long (Halperin & Alexander, 1989; Semenov et al, 1995). For simplicity, we thus excluded the stretching free energy in the calculation in the manuscript, although this energy term is significant for cases where B blocks are relatively short.
In contrast to polymer micelles spontaneously assembled in a solution at equilibrium, the assembly of paraspeckles had a strong correlation with the transcription of NEAT1_2. This correlation is probably because RNA‐binding proteins already bind to nascent NEAT1_2 transcripts, the production of which is not yet completed, and these nascent transcripts are incorporated one by one into the paraspeckle at a constant rate k tx. Nascent transcripts are connected to the transcription site via RNA polymerase II and, thus, can be incorporated in the paraspeckle at the transcription site without translational entropy cost.
The growth of the paraspeckle was analyzed by using the Master equation
with n = 2,3,⋯, and
| Jnt=k0ϕpqnt‐k0e‐Fn+F1‐Fn+1kBTn+1qn+1t+ktxqnt, | (3) |
|---|
where qn(t) is the probability that the paraspeckle is composed of n NEAT1_2 transcripts, and Jn(t) is the flux of the probability. The first term on the right side of equation (3) is the rate that a NEAT1_2 transcript associates with the paraspeckle from solution. The second term is the rate that a NEAT1_2 in the paraspeckle dissociates and the third term is the rate that a nascent NEAT1_2 transcript associates with the paraspeckle. The factor n + 1 in the second term accounts for the fact that any of the n + 1 NEAT1_2 transcripts dissociate with equal probability. k 0 is the rate constant that accounts for the association of NEAT1_2 with the paraspeckle. ϕp is the volume fraction of NEAT1_2 in solution. Fn is the free energy Fn (α), which has been already minimized with respect to α. k B is the Boltzmann constant, T is the absolute temperature k tx is the rate constant that accounts for the production of nascent NEAT1_2 transcripts. The first and second terms of equation (3) are determined so that they satisfy the detailed balance when transcription is suppressed, ktx→0. In the following, we set ϕp→0 because most NEAT1_2 transcripts are incorporated into paraspeckles.
In the steady state, Jnt→0, the solution of equations (1) and (2) has the form
where Fn is the effective free energy of the paraspeckle composed of n NEAT1_2 transcripts
| Fn=Fn‐nF1‐n‐1kBTlogktxk0+kBTlogn! | (5) |
|---|
and Zst is the effective partition function
The most probable number n of NEAT1_2 transcripts in the steady state is derived by minimizing the effective free energy Fn. Our model can predict the number n of transcripts in a paraspeckle, the fraction α of A blocks in the shell, the radius of the paraspeckle in the steady state as a function of the transcription rate k tx and the number of segments in the A blocks.
The following parameters were used for the numerical calculations: the number of segments in the B blocks was 40, the number of segments in the C blocks was 20, the dimensionless surface tension was 0.5, the interaction parameter between the A segments and B segments in the core was 1.0, the excluded volume of the A and C blocks was the cubic of the segment length (athermal solvent conditions). In Figs 4D and 5A and B, we used logktx/k0=‐8.0.
Phase separation model
Both the A and C blocks of Δ3′/Δ5′ NEAT1_2 transcripts are either absent or short. The excluded‐volume interactions between the A blocks and those between the C blocks are small and thus, the dynamics of paraspeckles composed of such transcripts is governed by the surface tension. Therefore, we used an extension of the Flory–Huggins theory (which is the standard theory of phase separation in a polymer solution [see standard textbooks of polymer physics, such as Doi, 1996]) to predict the growth of paraspeckles composed of Δ3′/Δ5′ NEAT1_2 (Yamamoto et al, 2020a, in which the details of the mathematical formalism are described).
In our theory, Δ3′/Δ5′ NEAT1_2 transcripts are produced at the transcription site at a constant rate. These transcripts diffuse in the solution and the diffusion is slowed down by the attractive interactions between transcripts. The magnitude of the attractive interactions is represented by the interaction parameter χ. The transcripts degrade at a constant rate. Our theory predicts that when the interaction parameter χ is larger than the critical value χ c at equilibrium, the local volume fraction of transcripts jumps from a relatively large value to a smaller value at a distance from the transcription site. This distance defines the radius of the paraspeckle. The jump in volume fraction results from the instability because of the phase separation. This theory can predict the radius of the paraspeckle in the steady state as a function of the transcription rate, the diffusion constant, and the degradation rate.
Quantification and statistical analysis
Volocity (PerkinElmer) was used for quantification of the paraspeckle size and sum intensity of smFISH signals with intensity and size threshold. Fiji software (NIH) was used for quantification of the Sx values (distance between the peak and peak) of the paraspeckles observed by SRM using a plot profile (West et al, 2016). The sizes of paraspeckles observed by EM were determined with AnalySIS (Olympus Soft Imaging Solutions). The procedure to count the population of gold particles in core/shell domains or outer/middle/inner layers has been described previously (Souquere et al, 2010). Briefly, the surface area of the paraspeckle was divided into two (for core/shell domains) or three (for the outer/middle/inner layers) domains that have same area and the number of gold particles within each of these areas was counted. Prism 7 software (GraphPad) was used for graphing and statistical analysis. Each box plot shows the median (inside line), 25–75 percentiles (box bottom to top), and 10–90 percentiles (whisker bottom to top). Kruskal–Wallis test with Dunn's multiple comparison test was used for Figs 5C–E, H, 6D, EV1C, EV2B, EV3B, and, EV4A and B. Mann–Whitney test (two‐tailed) was used for Fig EV2D.
Author contributions
ToY, TeY, and TH conceived and designed this study. ToY and HY conducted the experiments, except for the EM and theoretical analyses. SS and GP performed the EM analyses. TeY performed the theoretical analyses. SN technically supported the SRM. ToY, TeY, GP, and TH wrote the manuscript.
Conflict of interest
The authors declare that they have no conflict of interest.
Supporting information
Appendix
Expanded View Figures PDF
Source Data for Expanded View
Review Process File
Source Data for Figure 1
Source Data for Figure 2
Source Data for Figure 3
Source Data for Figure 6
Acknowledgements
The authors thank C. Fujikawa and A. Kubota for technical support and the members of the Hirose laboratory for valuable discussions. This research was supported by KAKENHI grants from the Ministry of Education, Culture, Sports, Science, and Technology (MEXT) of Japan [to T. Yamazaki (17K15058, 19K06479, 19H05250), T. Yamamoto (19H05259, 18K03558), and TH (26113002, 17H03630, 17K19335, 19K22374, 20H00448, 20H05377)], JST, CREST Grant Number JPMJCR20E6 (to TH) and PRESTO Grant Number JPMJPR18KA (to T. Yamamoto), the Mochida Memorial Foundation for Medical and Pharmaceutical Research (to T. Yamazaki), the Naito Foundation (to T. Yamazaki), the Takeda Science Foundation (to T. Yamazaki), and Tokyo Biochemical Research Foundation (to TH).
The EMBO Journal (2021) 40: e107270.
Contributor Information
Tomohiro Yamazaki, Email: tyamazaki@fbs.osaka-u.ac.jp.
Tetsuro Hirose, Email: hirose@fbs.osaka-u.ac.jp.
Data availability
The scripts used for the theoretical modeling are available in the following database: figshare: sourcecode, https://doi.org/10.6084/m9.figshare.12961559 (https://figshare.com/s/be1d03f274642ed1416a).
References
- Alberti S, Dormann D (2019) Liquid‐liquid phase separation in disease. Annu Rev Genet 53: 171–194 [DOI] [PubMed] [Google Scholar]
- Alberti S, Gladfelter A, Mittag T (2019) Considerations and challenges in studying liquid‐liquid phase separation and biomolecular condensates. Cell 176: 419–434 [DOI] [PMC free article] [PubMed] [Google Scholar]
- Banani SF, Lee HO, Hyman AA, Rosen MK (2017) Biomolecular condensates: organizers of cellular biochemistry. Nat Rev Mol Cell Biol 18: 285–298 [DOI] [PMC free article] [PubMed] [Google Scholar]
- Bates CM, Bates FS (2017) Block polymers ‐ pure potential. Macromolecules 50: 3–22 [Google Scholar]
- Belanghzal H, Borrman T, Stephens AD, Lafontaine DL, Venev SV, Weng Z, Marko JF, Dekker J (2021) Liquid chromatin Hi‐C characterizes compartment‐dependent chromatin interaction dynamics. Nat Genet 53: 367–378 [DOI] [PMC free article] [PubMed] [Google Scholar]
- Berry J, Weber SC, Vaidya N, Haataja M, Brangwynne CP (2015) RNA transcription modulates phase transition‐driven nuclear body assembly. Proc Natl Acad Sci USA 112: E5237–E5245 [DOI] [PMC free article] [PubMed] [Google Scholar]
- Berry J, Brangwynne CP, Haataja M (2018) Physical pirinciples of intracellular organization via active and passive phase transitions. Rep Prog Phys 81: 046601 [DOI] [PubMed] [Google Scholar]
- Boeynaems S, Holehouse AS, Weinhardt V, Kovacs D, Van Lindt J, Larabell C, Van Den Bosch L, Das R, Tompa PS, Pappu RV_et al_ (2019) Spontaneous driving forces give rise to protein‐RNA condensates with coexisting phases and complex material properties. Proc Natl Acad Sci USA 116: 7889–7898 [DOI] [PMC free article] [PubMed] [Google Scholar]
- Bonetti A, Agostini F, Suzuki AM, Hashimoto K, Pascarella G, Gimenez J, Roos L, Nash AJ, Ghilotti M, Cameron CJF_et al_ (2020) RADICL‐seq identifies general and cell type‐specific principles of genome‐wide RNA‐chromatin interactions. Nat Commun 11: 1018 [DOI] [PMC free article] [PubMed] [Google Scholar]
- Brangwynne CP, Eckmann CR, Courson DS, Rybarska A, Hoege C, Gharakhani J, Julicher F, Hyman AA (2009) Germline P granules are liquid droplets that localize by controlled dissolution/condensation. Science 324: 1729–1732 [DOI] [PubMed] [Google Scholar]
- Cai Z, Cao C, Ji L, Ye R, Wang D, Xia C, Wang S, Du Z, Hu N, Yu X_et al_ (2020) RIC‐seq for global in situ profiling of RNA‐RNA spatial interactions. Nature 582: 432–437 [DOI] [PubMed] [Google Scholar]
- Chen LL, Carmichael GG (2009) Altered nuclear retention of mRNAs containing inverted repeats in human embryonic stem cells: functional role of a nuclear noncoding RNA. Mol Cell 35: 467–478 [DOI] [PMC free article] [PubMed] [Google Scholar]
- Chiodi I, Biggiogera M, Denegri M, Corioni M, Weighardt F, Cobianchi F, Riva S, Biamonti G (2000) Structure and dynamics of hnRNP‐labelled nuclear bodies induced by stress treatments. J Cell Sci 113(Pt 22): 4043–4053 [DOI] [PubMed] [Google Scholar]
- Choi JM, Holehouse AS, Pappu RV (2020) Physical principles underlying the complex biology of intracellular phase transitions. Annu Rev Biophys 49: 107–133 [DOI] [PMC free article] [PubMed] [Google Scholar]
- Chujo T, Yamazaki T, Hirose T (2016) Architectural RNAs (arcRNAs): a class of long noncoding RNAs that function as the scaffold of nuclear bodies. Biochim Biophys Acta 1859: 139–146 [DOI] [PubMed] [Google Scholar]
- Chujo T, Yamazaki T, Kawaguchi T, Kurosaka S, Takumi T, Nakagawa S, Hirose T (2017) Unusual semi‐extractability as a hallmark of nuclear body‐associated architectural noncoding RNAs. EMBO J 36: 1447–1462 [DOI] [PMC free article] [PubMed] [Google Scholar]
- Clemson CM, Hutchinson JN, Sara SA, Ensminger AW, Fox AH, Chess A, Lawrence JB (2009) An architectural role for a nuclear noncoding RNA: NEAT1 RNA is essential for the structure of paraspeckles. Mol Cell 33: 717–726 [DOI] [PMC free article] [PubMed] [Google Scholar]
- Cornelis G, Souquere S, Vernochet C, Heidmann T, Pierron G (2016) Functional conservation of the lncRNA NEAT1 in the ancestrally diverged marsupial lineage: Evidence for NEAT1 expression and associated paraspeckle assembly during late gestation in the opossum Monodelphis domestica. RNA Biol 13: 826–836 [DOI] [PMC free article] [PubMed] [Google Scholar]
- Dar F, Pappu RV (2020) Restructing the sizes of condensates. eLife 9: e59663 [DOI] [PMC free article] [PubMed] [Google Scholar]
- Doi M (1996) Introduction to polymer physics. Oxford: Oxford University Press; [Google Scholar]
- Doi M (2013) Soft matter physics. Oxford: Oxford University Press; [Google Scholar]
- Dumbović G, Biayna J, Banús J, Samuelsson J, Roth A, Diederichs S, Alonso S, Buschbeck M, Perucho M, Forcales S‐V (2018) A novel long non‐coding RNA from NBL2 pericentromeric macrosatellite forms a perinucleolar aggregate structure in colon cancer. Nucleic Acids Res 46: 5504–5524 [DOI] [PMC free article] [PubMed] [Google Scholar]
- Fei J, Jadaliha M, Harmon TS, Li ITS, Hua B, Hao Q, Holehouse AS, Reyer M, Sun Q, Freier SM_et al_ (2017) Quantitative analysis of multilayer organization of proteins and RNA in nuclear speckles at super resolution. J Cell Sci 130: 4180–4192 [DOI] [PMC free article] [PubMed] [Google Scholar]
- Feric M, Vaidya N, Harmon TS, Mitrea DM, Zhu L, Richardson TM, Kriwacki RW, Pappu RV, Brangwynne CP (2016) Coexisting liquid phases underlie nucleolar subcompartments. Cell 165: 1686–1697 [DOI] [PMC free article] [PubMed] [Google Scholar]
- Fox AH, Nakagawa S, Hirose T, Bond CS (2018) Paraspeckles: where long noncoding RNA meets phase separation. Trends Biochem Sci 43: 124–135 [DOI] [PubMed] [Google Scholar]
- Hall LL, Byron M, Carone DM, Whitfield TW, Pouliot GP, Fischer A, Jones P, Lawrence JB (2017) Demethylated HSATII DNA and HSATII RNA foci sequester PRC1 and MeCP2 into cancer‐specific nuclear bodies. Cell Rep 18: 2943–2956 [DOI] [PMC free article] [PubMed] [Google Scholar]
- Halperin A, Alexander S (1989) Polymer micelles: their relaxation kinetics. Macromolecules 22: 2403–2412 [Google Scholar]
- Harmon TS, Holehouse AS, Pappu RV (2018) Differential solvation of intrinsically disordered linkers drives the formation of spatially organized droplets in ternary systems of linear multivalent proteins. New J Phys 20: 045002 [Google Scholar]
- Hennig S, Kong G, Mannen T, Sadowska A, Kobelke S, Blythe A, Knott GJ, Iyer KS, Ho D, Newcombe EA_et al_ (2015) Prion‐like domains in RNA binding proteins are essential for building subnuclear paraspeckles. J Cell Biol 210: 529–539 [DOI] [PMC free article] [PubMed] [Google Scholar]
- Hildebrand EM, Dekker J (2020) Mechanisms and functions of chromosome compartmentalization. Trends Biochem Sci 45: 385–396 [DOI] [PMC free article] [PubMed] [Google Scholar]
- Hirose T, Virnicchi G, Tanigawa A, Naganuma T, Li R, Kimura H, Yokoi T, Nakagawa S, Benard M, Fox AH_et al_ (2014) NEAT1 long noncoding RNA regulates transcription via protein sequestration within subnuclear bodies. Mol Biol Cell 25: 169–183 [DOI] [PMC free article] [PubMed] [Google Scholar]
- Hyman AA, Weber CA, Julicher F (2014) Liquid‐liquid phase separation in biology. Annu Rev Cell Dev Biol 30: 39–58 [DOI] [PubMed] [Google Scholar]
- Imamura K, Imamachi N, Akizuki G, Kumakura M, Kawaguchi A, Nagata K, Kato A, Kawaguchi Y, Sato H, Yoneda M_et al_ (2014) Long noncoding RNA NEAT1‐dependent SFPQ relocation from promoter region to paraspeckle mediates IL8 expression upon immune stimuli. Mol Cell 53: 393–406 [DOI] [PubMed] [Google Scholar]
- Jiang L, Shao C, Wu QJ, Chen G, Zhou J, Yang B, Li H, Gou LT, Zhang Y, Wang Y_et al_ (2017) NEAT1 scaffolds RNA‐binding proteins and the microprocessor to globally enhance pri‐miRNA processing. Nat Struct Mol Biol 24: 816–824 [DOI] [PMC free article] [PubMed] [Google Scholar]
- Kawaguchi T, Tanigawa A, Naganuma T, Ohkawa Y, Souquere S, Pierron G, Hirose T (2015) SWI/SNF chromatin‐remodeling complexes function in noncoding RNA‐dependent assembly of nuclear bodies. Proc Natl Acad Sci USA 112: 4304–4309 [DOI] [PMC free article] [PubMed] [Google Scholar]
- Li X, Zhou B, Chen L, Gou LT, Li H, Fu XD (2017) GRID‐seq reveals the global RNA‐chromatin interactome. Nat Biotechnol 35: 940–950 [DOI] [PMC free article] [PubMed] [Google Scholar]
- Lin Y, Schmidt BF, Bruchez MP, McManus CJ (2018) Structural analyses of NEAT1 lncRNAs suggest long‐range RNA interactions that may contribute to paraspeckle architecture. Nucleic Acids Res 46: 3742–3752 [DOI] [PMC free article] [PubMed] [Google Scholar]
- Lutz JF, Ouchi M, Liu DR, Sawamoto M (2013) Sequence‐controlled polymers. Science 341: 1238149 [DOI] [PubMed] [Google Scholar]
- Mai Y, Eisenberg A (2012) Self‐assembly of block copolymers. Chem Soc Rev 41: 5969–5985 [DOI] [PubMed] [Google Scholar]
- Mao YS, Sunwoo H, Zhang B, Spector DL (2011) Direct visualization of the co‐transcriptional assembly of a nuclear body by noncoding RNAs. Nat Cell Biol 13: 95–101 [DOI] [PMC free article] [PubMed] [Google Scholar]
- Mello SS, Sinow C, Raj N, Mazur PK, Bieging‐Rolett K, Broz DK, Imam JFC, Vogel H, Wood LD, Sage J_et al_ (2017) Neat1 is a p53‐inducible lincRNA essential for transformation suppression. Genes Dev 31: 1095–1108 [DOI] [PMC free article] [PubMed] [Google Scholar]
- Modic M, Grosch M, Rot G, Schirge S, Lepko T, Yamazaki T, Lee FCY, Rusha E, Shaposhnikov D, Palo M_et al_ (2019) Cross‐Regulation between TDP‐43 and paraspeckles promotes pluripotency‐differentiation transition. Mol Cell 74: 951–965.e913 [DOI] [PMC free article] [PubMed] [Google Scholar]
- Moughton AO, Hillmyer MA, Lodge TP (2012) Multicompartment block copolymer micelles. Macromolecules 45: 2–19 [Google Scholar]
- Naganuma T, Nakagawa S, Tanigawa A, Sasaki YF, Goshima N, Hirose T (2012) Alternative 3'‐end processing of long noncoding RNA initiates construction of nuclear paraspeckles. EMBO J 31: 4020–4034 [DOI] [PMC free article] [PubMed] [Google Scholar]
- Nakagawa S, Shimada M, Yanaka K, Mito M, Arai T, Takahashi E, Fujita Y, Fujimori T, Standaert L, Marine JC_et al_ (2014) The lncRNA Neat1 is required for corpus luteum formation and the establishment of pregnancy in a subpopulation of mice. Development 141: 4618–4627 [DOI] [PMC free article] [PubMed] [Google Scholar]
- Nakagawa S, Yamazaki T, Hirose T (2018) Molecular dissection of nuclear paraspeckles: towards understanding the emerging world of the RNP milieu. Open Biol 8: 180150 [DOI] [PMC free article] [PubMed] [Google Scholar]
- Ninomiya K, Adachi S, Natsume T, Iwakiri J, Terai G, Asai K, Hirose T (2019) LncRNA‐dependent nuclear stress bodies promote intron retention through SR protein phosphorylation. EMBO J 39: e102729 [DOI] [PMC free article] [PubMed] [Google Scholar]
- Ninomiya K, Hirose T (2020) Short tandem repeat‐enriched architectural RNAs in nuclear bodies: functions and associated diseases. Noncoding RNA 6: 6 [DOI] [PMC free article] [PubMed] [Google Scholar]
- Ouchi M, Badi N, Lutz JF, Sawamoto M (2011) Single‐chain technology using discrete synthetic macromolecules. Natue Chemistry 3: 917–924 [DOI] [PubMed] [Google Scholar]
- Passon DM, Lee M, Rackham O, Stanley WA, Sadowska A, Filipovska A, Fox AH, Bond CS (2012) Structure of the heterodimer of human NONO and paraspeckle protein component 1 and analysis of its role in subnuclear body formation. Proc Natl Acad Sci USA 109: 4846–4850 [DOI] [PMC free article] [PubMed] [Google Scholar]
- Peng A, Weber SC (2019) Evidence for and against liquid‐liquid phase separation in the nucleus. Noncoding RNA 5: 50 [DOI] [PMC free article] [PubMed] [Google Scholar]
- Quinn JJ, Chang HY (2016) Unique features of long non‐coding RNA biogenesis and function. Nat Rev Genet 17: 47–62 [DOI] [PubMed] [Google Scholar]
- Ranganathan S, Shakhnovich EI (2020) Dynamic metastable long‐living droplets formed by sticker‐spacer proteins. eLife 9: e56159 [DOI] [PMC free article] [PubMed] [Google Scholar]
- Roden C, Gladfelter AS (2021) RNA contributions to the form and function of biomolecular condensates. Nat Rev Mol Cell Biol 22: 183–195 [DOI] [PMC free article] [PubMed] [Google Scholar]
- Rosowski KA, Sai T, Vidal‐Henriquez E, Zwicker D, Style RW, Dufresne ER (2020) Elastic ripening and inhibition of liquid‐liquid phase separation. Nat Phys 16: 422–425 [DOI] [PMC free article] [PubMed] [Google Scholar]
- Sabari BR, Dall'Agnese A, Young RA (2020) Biomolecular condensates in the nucleus. Trends Biochem Sci 45: 961 [DOI] [PMC free article] [PubMed] [Google Scholar]
- Safran SA (2003) Statistical thermodynamics of surfaces, interfaces, and membranes. Boulder, CO: Westview Press; [Google Scholar]
- Sasaki YT, Ideue T, Sano M, Mituyama T, Hirose T (2009) MENepsilon/beta noncoding RNAs are essential for structural integrity of nuclear paraspeckles. Proc Natl Acad Sci USA 106: 2525–2530 [DOI] [PMC free article] [PubMed] [Google Scholar]
- Sawyer IA, Sturgill D, Dundr M (2019) Membraneless nuclear organelles and the search for phases within phases. Wiley Interdiscip Rev RNA 10: e1514 [DOI] [PubMed] [Google Scholar]
- Schmitt AM, Chang HY (2017) Long Noncoding RNAs: at the intersection of cancer and chromatin biology. Cold Spring Harb Perspect Med 7: a026492 [DOI] [PMC free article] [PubMed] [Google Scholar]
- Semenov AN (1985) Contribution to the theory of microphase layering in block‐copolymer melts. Sov Phys JETP 61: 733–742 [Google Scholar]
- Semenov AN, Nyrkova IA, Khokhlov AR (1995) Polymers with strongly interacting groups: theory for nonspherical multiplets. Macromolecules 28: 7491–7500 [Google Scholar]
- Shin Y, Brangwynne CP (2017) Liquid phase condensation in cell physiology and disease. Science 357: eaaf4382 [DOI] [PubMed] [Google Scholar]
- Shin Y, Chang YC, Lee DSW, Berry J, Sanders DW, Ronceray P, Wingreen NS, Haataja M, Brangwynne CP (2018) Liquid nuclear condensates mechanically sense and restructure the genome. Cell 175: 1481–1491.e1413 [DOI] [PMC free article] [PubMed] [Google Scholar]
- Souquere S, Beauclair G, Harper F, Fox A, Pierron G (2010) Highly ordered spatial organization of the structural long noncoding NEAT1 RNAs within paraspeckle nuclear bodies. Mol Biol Cell 21: 4020–4027 [DOI] [PMC free article] [PubMed] [Google Scholar]
- Souquere S, Pierron G (2015) Ultrastructural analysis of nuclear bodies using electron microscopy. Methods Mol Biol 1262: 105–118 [DOI] [PubMed] [Google Scholar]
- Standaert L, Adriaens C, Radaelli E, Van Keymeulen A, Blanpain C, Hirose T, Nakagawa S, Marine JC (2014) The long noncoding RNA Neat1 is required for mammary gland development and lactation. RNA 20: 1844–1849 [DOI] [PMC free article] [PubMed] [Google Scholar]
- Strom AR, Brangwynne CP (2019) The liquid nucleome ‐ phase transitions in the nucleus at a glance. J Cell Sci 132: jcs235093 [DOI] [PMC free article] [PubMed] [Google Scholar]
- Style RW, Sai T, Fanelli N, Ijavi M, Smith‐Mannschott K, Xu Q, Wilen LA, Dufresne ER (2018) Liquid‐liquid phase separation in an elastic network. Physical Review X 8: 011028 [Google Scholar]
- Sunwoo H, Dinger ME, Wilusz JE, Amaral PP, Mattick JS, Spector DL (2009) MEN epsilon/beta nuclear‐retained non‐coding RNAs are up‐regulated upon muscle differentiation and are essential components of paraspeckles. Genome Res 19: 347–359 [DOI] [PMC free article] [PubMed] [Google Scholar]
- Swinnen B, Robberecht W, Van Den Bosch L (2020) RNA toxicity in non‐coding repeat expansion disorders. EMBO J 39: e101112 [DOI] [PMC free article] [PubMed] [Google Scholar]
- Visa N, Puvion‐Dutilleul F, Bachellerie JP, Puvion E (1993) Intranuclear distribution of U1 and U2 snRNAs visualized by high resolution in situ hybridization: revelation of a novel compartment containing U1 but not U2 snRNA in HeLa cells. Eur J Cell Biol 60: 308–321 [PubMed] [Google Scholar]
- Wei XF, Zhou JJ, Wang YT, Meng FL (2020) Modeling elastically mediated liquid‐liquid phase separation. Phys Rev Lett 125: 268001 [DOI] [PubMed] [Google Scholar]
- West JA, Davis CP, Sunwoo H, Simon MD, Sadreyev RI, Wang PI, Tolstorukov MY, Kingston RE (2014) The long noncoding RNAs NEAT1 and MALAT1 bind active chromatin sites. Mol Cell 55: 791–802 [DOI] [PMC free article] [PubMed] [Google Scholar]
- West JA, Mito M, Kurosaka S, Takumi T, Tanegashima C, Chujo T, Yanaka K, Kingston RE, Hirose T, Bond C_et al_ (2016) Structural, super‐resolution microscopy analysis of paraspeckle nuclear body organization. J Cell Biol 214: 817–830 [DOI] [PMC free article] [PubMed] [Google Scholar]
- Yamamoto T, Yamazaki T, Hirose T (2020a) Phase separation driven by production of architectural RNA transcripts. Soft Matter 16: 4692–4698 [DOI] [PubMed] [Google Scholar]
- Yamamoto T, Yamazaki T, Hirose T (2020b). Triblock copolymer micelle model of spherical paraspecklesTriblock copolymer micelle model of spherical paraspeckles. bioRxiv 10.1101/2020.11.01.364190 [PREPRINT] [DOI] [PMC free article] [PubMed] [Google Scholar]
- Yamazaki T, Hirose T (2015) The building process of the functional paraspeckle with long non‐coding RNAs. Front Biosci (Elite Ed) 7: 1–41 [DOI] [PubMed] [Google Scholar]
- Yamazaki T, Souquere S, Chujo T, Kobelke S, Chong YS, Fox AH, Bond CS, Nakagawa S, Pierron G, Hirose T (2018) Functional domains of NEAT1 architectural lncRNA induce paraspeckle assembly through phase separation. Mol Cell 70: 1038–1053.e1037 [DOI] [PubMed] [Google Scholar]
- Yamazaki T, Nakagawa S, Hirose T (2019) Architectural RNAs for membraneless nuclear body formation. Cold Spring Harb Symp Quant Biol 84: 227–237 [DOI] [PubMed] [Google Scholar]
- Yap K, Mukhina S, Zhang G, Tan JSC, Ong HS, Makeyev EV (2018) A short tandem repeat‐enriched RNA assembles a nuclear compartment to control alternative splicing and promote cell survival. Mol Cell 72: 525–540.e513 [DOI] [PMC free article] [PubMed] [Google Scholar]
- Zhulina EB, Adam M, LaRue I, Sheiko S, Rubinstein M (2005) Diblock copolymer micelles in a dilute solution. Macromolecules 38: 5330–5351 [Google Scholar]
Associated Data
This section collects any data citations, data availability statements, or supplementary materials included in this article.
Supplementary Materials
Appendix
Expanded View Figures PDF
Source Data for Expanded View
Review Process File
Source Data for Figure 1
Source Data for Figure 2
Source Data for Figure 3
Source Data for Figure 6
Data Availability Statement
The scripts used for the theoretical modeling are available in the following database: figshare: sourcecode, https://doi.org/10.6084/m9.figshare.12961559 (https://figshare.com/s/be1d03f274642ed1416a).