NORAD-induced PUMILIO phase separation is required for genome stability (original) (raw)
. Author manuscript; available in PMC: 2022 Jan 1.
Abstract
Liquid-liquid phase separation (LLPS) has emerged as a major mechanism of subcellular compartmentalization1,2. While the segregation of RNA into phase-separated condensates broadly impacts RNA metabolism3,4, whether and how specific RNAs employ phase separation to regulate interacting factors such as RNA binding proteins (RBPs), and the phenotypic consequences of such regulatory interactions, are poorly understood. Here we demonstrate that RNA-driven phase separation is a critical mechanism through which a long noncoding RNA (lncRNA) controls RBP activity and maintains genomic stability in mammalian cells. The lncRNA NORAD prevents aberrant mitosis by inhibiting PUMILIO (PUM) proteins5–8. We show that NORAD is able to out-compete thousands of other PUM-binding transcripts to bind and inhibit PUM by nucleating the formation of phase-separated PUM condensates, termed NP bodies. Dual mechanisms of PUM recruitment, involving multivalent PUM-NORAD and PUM-PUM interactions, enable NORAD to competitively sequester a super-stoichiometric amount of PUM in these condensates. Importantly, disruption of _NORAD_-driven PUM phase separation leads to PUM hyperactivity and genome instability that is rescued by synthetic RNAs that induce PUM condensate formation. These results reveal a new mechanism of RBP regulation by RNA-driven phase separation and uncover an essential role for this process in genome maintenance. The repetitive sequence architecture of NORAD and other lncRNAs9–11 suggests that phase separation may be a widely used mechanism of lncRNA-mediated regulation.
RNA plays a central role in the formation of several phase-separated subcellular compartments, including Cajal bodies, nucleoli, processing bodies (P-bodies), and stress granules4. A major mechanism underlying RNA-driven phase separation is the recruitment of RBPs that frequently contain intrinsically disordered regions (IDRs). Multivalent RBP-RNA interactions facilitate weaker IDR-IDR association, thereby driving a phase separation reaction that leads to the formation of ribonucleoprotein (RNP) granules12. While RNA-driven phase separation influences the localization and fate of diverse classes of RNAs, it remains unknown whether specific RNAs employ this mechanism as a regulatory strategy to control the activity of specific RBPs or other cellular components.
LncRNAs are a heterogenous class of non-protein-coding transcripts that have frequently been proposed to bind and regulate the activity of RBPs13–15. In most cases, however, lncRNA transcripts are greatly outnumbered by their associated RBPs or by other transcripts that can bind the relevant RBPs. Thus, the mechanisms through which lncRNAs are able to efficiently recruit RBPs and regulate their activity have remained unclear. This problem is exemplified by Noncoding RNA activated by DNA damage (NORAD), a highly conserved and abundant cytoplasmic lncRNA that is required for genome stability in mammals5–8. NORAD functions by binding to and negatively regulating PUMILIO RBPs (PUM1 and PUM2). PUM proteins are post-transcriptional repressors that bind with high specificity to PUMILIO Response Elements (PREs) (UGUANAUA)16. Loss of NORAD results in PUM hyperactivity, leading to the repression of PUM target messenger RNAs (mRNAs) that include important regulators of mitosis, ultimately resulting in a dramatic genomic instability phenotype in _NORAD_-deficient cells and mouse tissues6,7. Nevertheless, it remains enigmatic how this lncRNA is able to efficiently regulate these RBPs given that NORAD is greatly outnumbered by other PRE-containing transcripts. For example, in HCT116 cells, a model cell line in which NORAD has been shown to regulate PUM and genomic stability, NORAD is expressed at ~400 copies per cell7. With 18 PREs per transcript, NORAD provides only ~7200 PREs to compete against ~130,000–325,000 PREs in expressed mRNAs (see Methods). Thus, simple competitive titration of PUM by NORAD is unlikely to meaningfully impact the pool of free PUM that is available to regulate target mRNAs. Here we show that NORAD is able to negatively regulate PUM proteins by nucleating the formation of phase-separated cytoplasmic PUM condensates, which we termed _NORAD-_PUM (NP) bodies.
Results
NORAD and PUM co-localize in NP bodies
NORAD localizes to discrete cytoplasmic foci in the human colon cancer cell line (HCT116)5 (Fig. 1a) and murine embryonic fibroblasts (MEFs)6. While NORAD is expressed at ~400 copies per cell in HCT1167, we observed many fewer NORAD foci in each cell, suggesting that each punctum contained multiple NORAD transcripts. Furthermore, super-resolution microscopy demonstrated that endogenous PUM proteins were also organized in punctate foci (Fig. 1b), which co-localized with NORAD foci (Fig. 1c, d). Upon induction of NORAD following DNA damage7, these puncta, which we termed _NORAD_-PUM (NP) bodies, became even larger and more intense (Extended Data Fig. 1a), suggesting the recruitment of additional NORAD and PUM molecules. Loss of NORAD resulted in the dispersal of PUM proteins (Fig. 1b), which was not attributable to decreased PUM protein levels (Extended Data Fig. 1b). NP bodies were distinct from other cytoplasmic condensates, specifically P-bodies and stress granules, the latter of which were not present under baseline conditions, although PUM2 was recruited into these structures upon arsenite treatment, as previously reported17,18 (Extended Data Fig. 1c, d). NP bodies were also observed in other cell lines including HeLa, human fibroblasts, and primary MEFs (Extended Data Fig. 1e, f).
Fig. 1 |. NORAD and PUM co-localize in cytoplasmic foci.
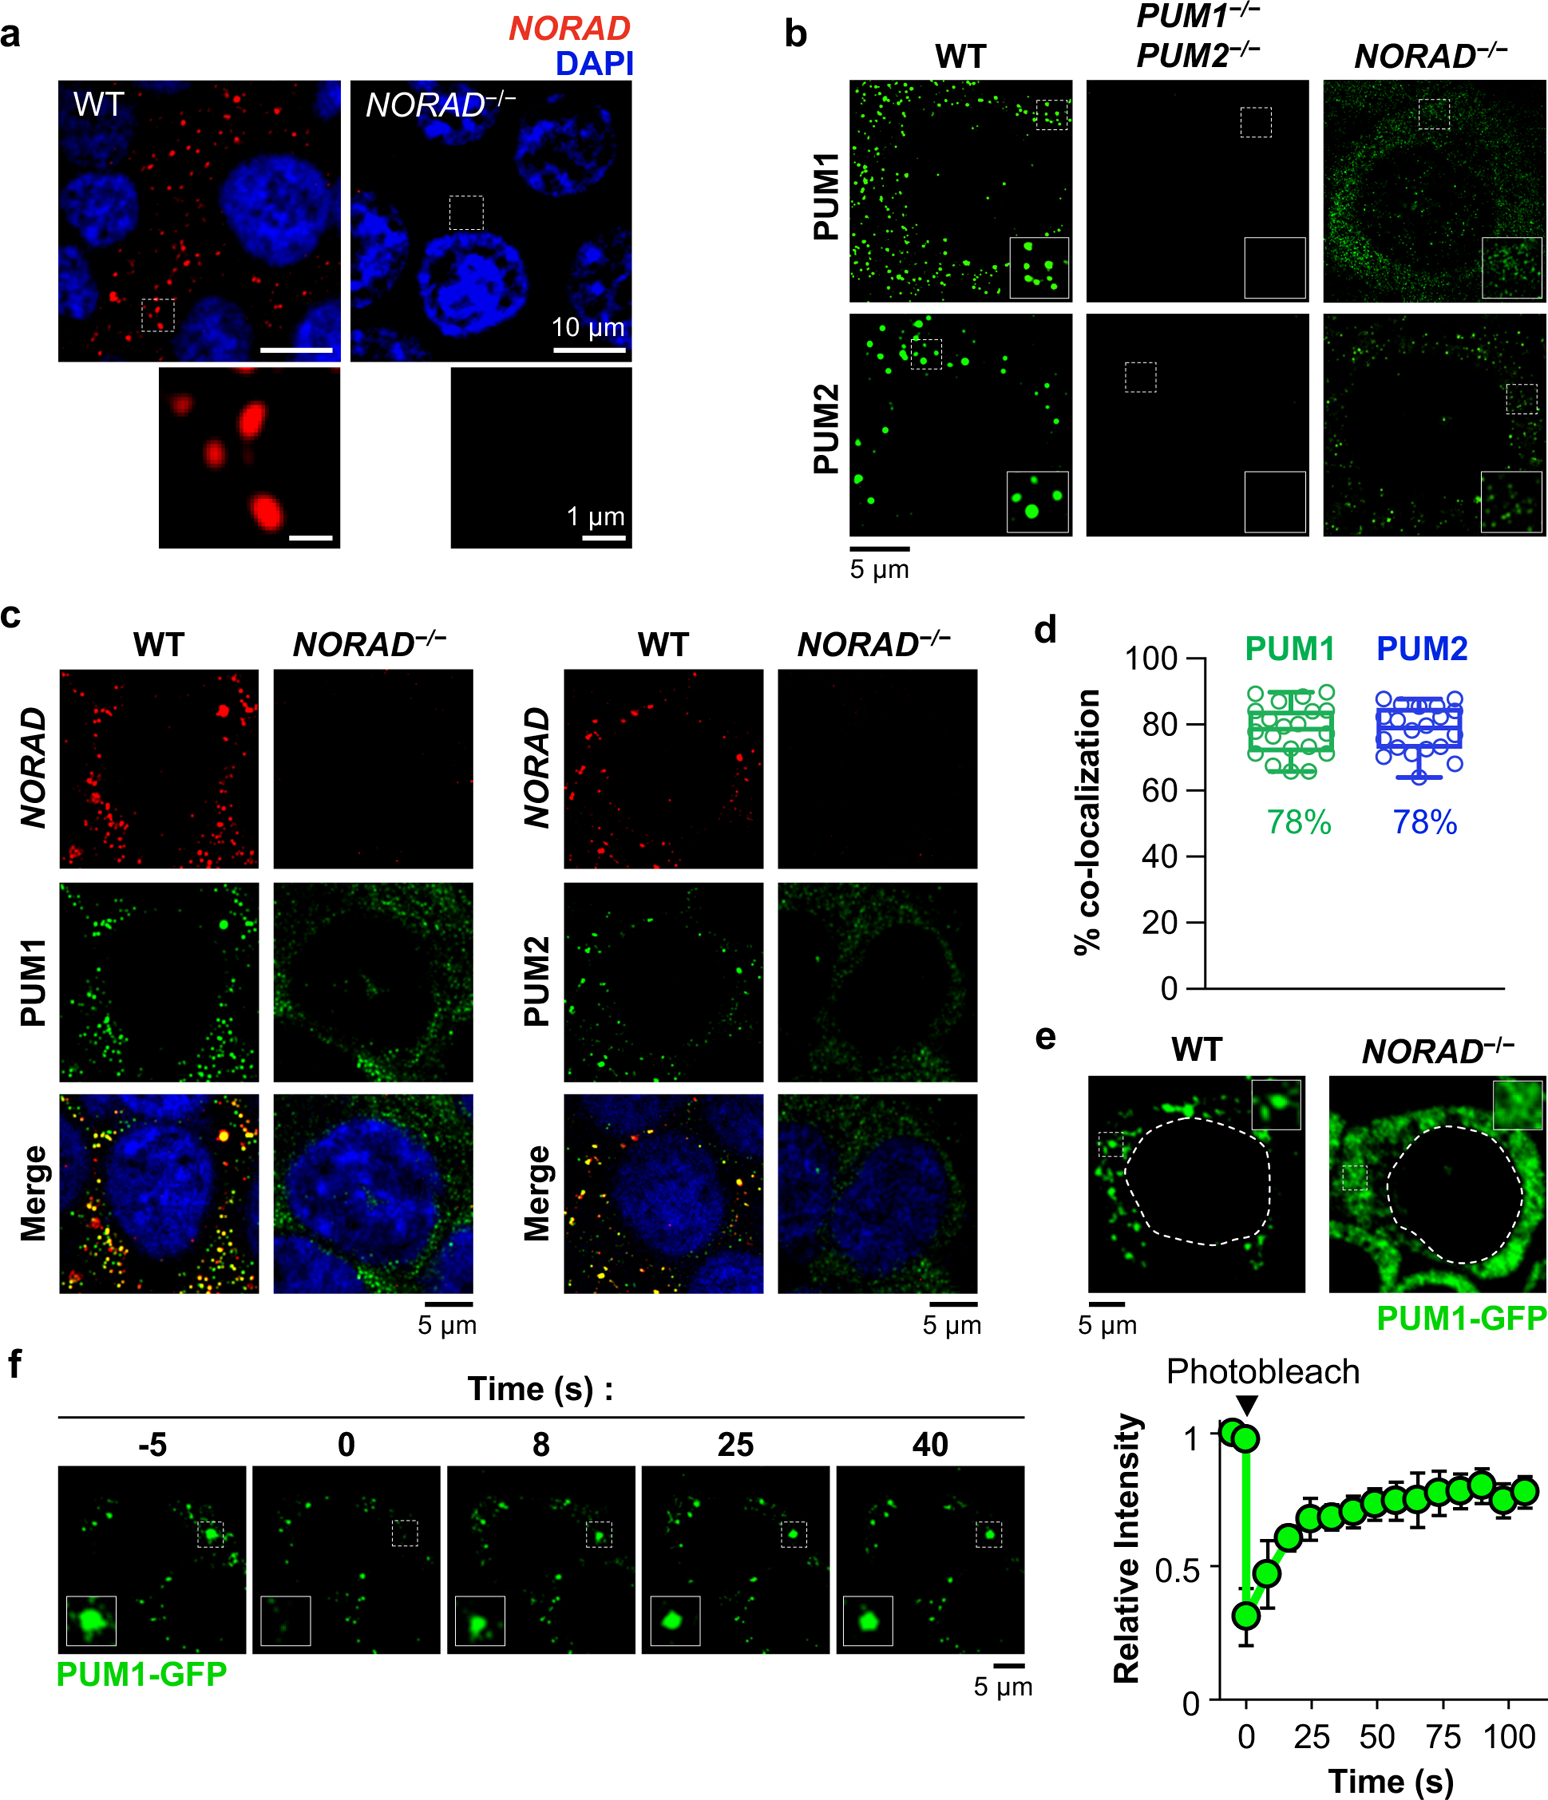
a, Confocal images of NORAD RNA FISH in HCT116 cells. b, PUM immunofluorescence in HCT116 cells of the indicated genotypes, imaged with structured illumination microscopy (SIM). c, SIM images of NORAD and PUM co-stained cells. d, Quantification of NORAD and PUM co-localization (n = 20 cells for each PUM protein). Mean co-localization shown below box plots. Boxes extend from 25th to 75th percentiles; middle line represents median; whiskers extend from minima to maxima. e, Live cell confocal images of endogenous PUM1-GFP. Dashed lines indicate nuclear boundaries. f, Images (left) and quantification (right) of PUM1-GFP FRAP. Fluorescence intensities plotted relative to pre-bleach time point (t = −5 s). Data shown as mean ± SD (n = 3 droplets).
To examine NP bodies in live cells, endogenous PUM1 was tagged with green fluorescent protein (GFP) in NORAD+/+ and _NORAD_−/− HCT116 cells (Extended Data Fig. 2a). PUM1-GFP localized to cytoplasmic foci in NORAD+/+ cells but was diffusely localized in _NORAD_−/− cells (Fig. 1e). PUM1-GFP foci exhibited liquid-like properties, including rapid exchange with the surrounding cytoplasm, as demonstrated by fluorescence recovery after photobleaching (FRAP) (Fig. 1f), and droplet fusion (Extended Data Fig. 2b). NP bodies were significantly smaller than P-bodies and stress granules (Extended Data Fig. 2c, d). Altogether, these results suggested that NP bodies may represent RNP granules that form through LLPS, within which NORAD might sequester PUM proteins.
NORAD promotes PUM phase separation
Similar to other RBPs that undergo LLPS3, PUM1 and PUM2 contain large IDRs located N-terminally to their structured Homology Domains (HDs), the latter of which are responsible for RNA binding (Extended Data Fig. 3a). To test whether PUM proteins undergo phase separation in vitro, SNAP-tagged PUM1 and PUM2 fused to TEV protease-cleavable maltose binding protein (MBP) and histidine (His) tags were purified (Extended Data Fig. 3b). Indeed, after TEV cleavage of the solubilizing MBP tag and His tag, PUM1 and PUM2 condensed into liquid-like droplets when incubated at high concentration (5 μM) with or without polyethylene glycol (PEG), a molecular crowding reagent (Extended Data Fig. 3c, d). These droplets displayed dynamic, liquid-like behavior such as rapid exchange with the bulk phase and fusion (Extended Data Fig. 3e, f). Moreover, in vitro-transcribed NORAD RNA was incorporated into preformed PUM droplets and further increased PUM1 phase separation (Extended Data Fig. 3g, h). Both RNA and protein components remained dynamic within these droplets, although NORAD exhibited slower FRAP recovery than PUM1, as observed in other RNA-protein condensates (Extended Data Fig. 3i)19.
To investigate the phase-separating properties of PUM proteins and NORAD at physiologically-relevant concentrations, we estimated the cytoplasmic volume of HCT116 cells (Extended Data Fig. 4a, b). Together with our previous measurements of the number of NORAD and PUM molecules per cell7, we determined the cytoplasmic concentration of NORAD and PUM1 to be approximately 2–6 nM and 50–200 nM, respectively. At a physiologic concentration of 150 nM, PUM1 alone did not phase separate in vitro (Fig. 2a). The addition of NORAD at or below its endogenous concentration, however, robustly induced PUM1 droplet formation (Fig. 2a, b). In contrast, a full-length NORAD transcript with point mutations that disrupt PUM binding (PREmut; Extended Data Fig. 4c)5 exhibited no PUM phase separating activity at any concentration up to 50 nM. Interestingly, a highly-conserved segment of NORAD harboring 4 PREs, which contains one of several repetitive sequences termed NORAD domains7 and is sufficient to rescue chromosomal segregation defects in _NORAD_-deficient cells5, also promoted droplet formation within the physiologic concentration range (ND4; Fig. 2a, b, Extended Data Fig. 4c). Notably, these assays were performed in the presence of PEG, making a direct comparison to physiologic concentrations inexact. Nevertheless, inclusion of PEG enhanced, but was not required for, _NORAD_-induced PUM droplet formation under these conditions (Extended Data Fig. 4d). Overall, these results demonstrated that binding to NORAD promotes partitioning of PUM into liquid-like droplets at physiologically-relevant concentrations in vitro.
Fig. 2 |. NORAD induces PUM phase separation through multivalent RNA binding.
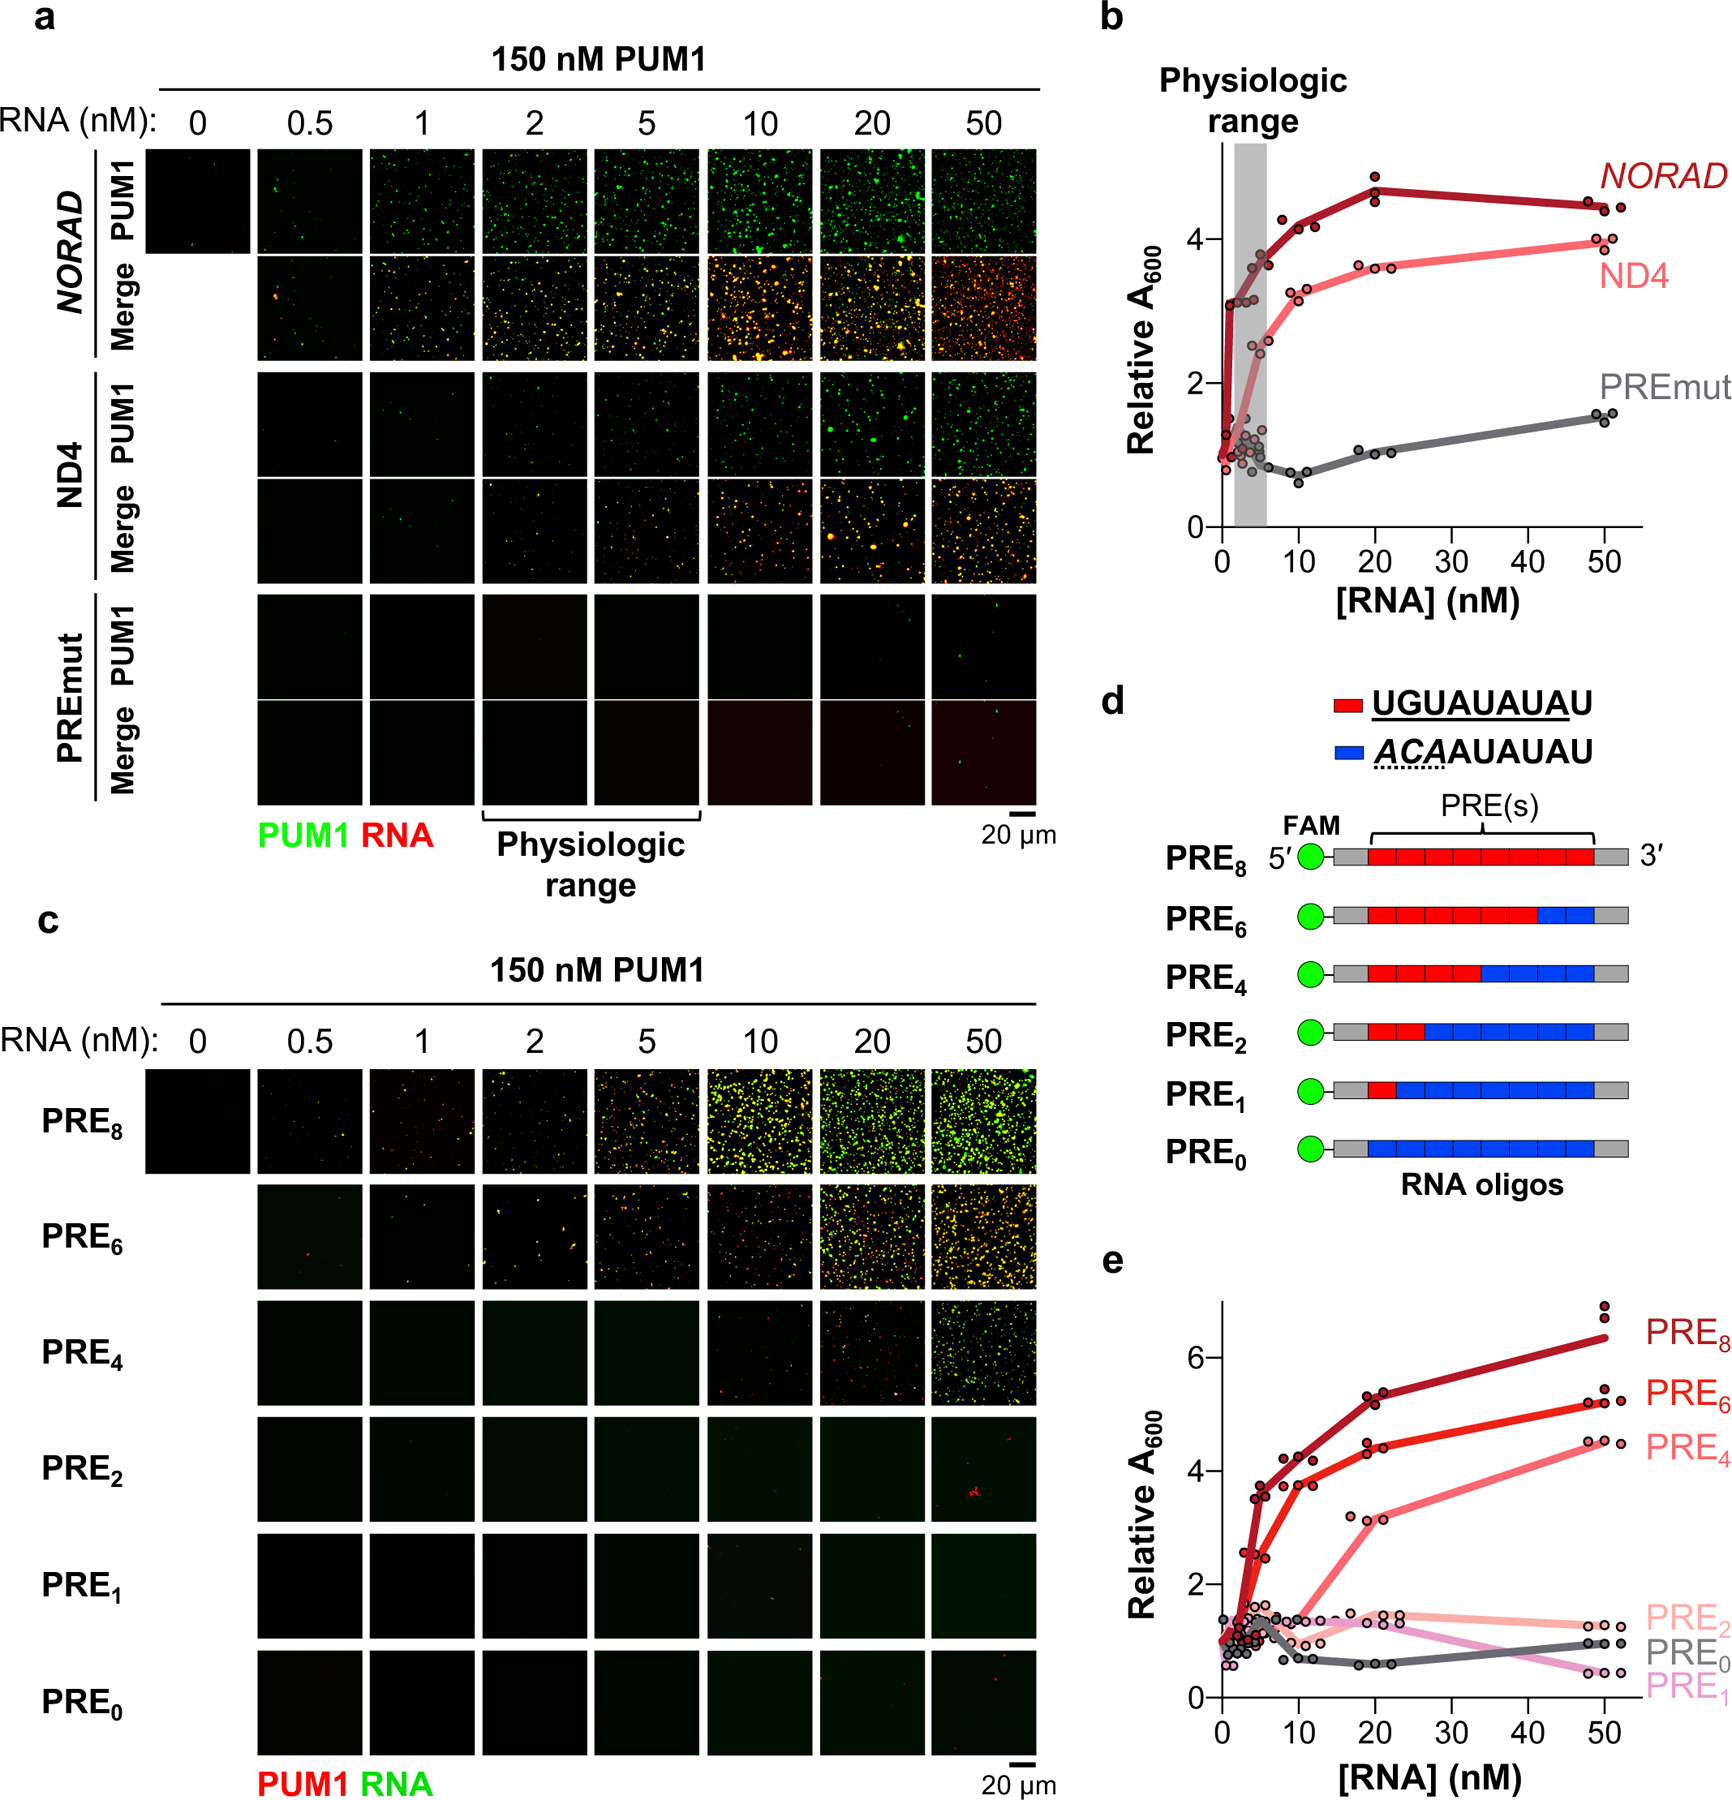
a-e, Confocal images (a, c) or turbidity measurements (absorbance at 600 nm, A600) (b, e) of 150 nM PUM1 solutions in the presence of increasing concentrations of the indicated RNAs or FAM-labeled PRE-containing RNA oligonucleotides (d). Turbidity normalized to A600 at 0 nM RNA (3 replicates per RNA concentration). Red box, consensus PRE; blue box, mutant PRE.
RNA valency and abundance drive PUM LLPS
To test whether the multivalent binding of PUM to a PRE-containing transcript is sufficient to promote phase separation, we synthesized a series of fluorescently-labeled RNA oligonucleotides containing varying numbers of PREs. At a physiologic concentration of PUM1 (150 nM), RNAs containing 0, 1, or 2 PREs had no detectable phase-separating activity (Fig. 2c–e). RNA oligonucleotides with 4 or more PREs, however, induced robust PUM1 droplet formation, with increasing PRE valency correlating inversely with the threshold concentration required to induce PUM1 phase separation.
The presence of multiple PREs is not unique to the NORAD transcript, although this lncRNA is exceptional when PRE valency and copy number are both considered (Extended Data Fig. 5a, b). To assess whether other multivalent PRE-containing transcripts induce PUM phase separation at their physiologic concentrations, we selected four PUM targets with varying numbers of PREs and copy numbers (Extended Data Fig. 5a–d). These included ACTG1, the most abundant PRE-containing transcript in HCT116 cells, and PUM1 and PUM2, which are autoregulated by PUM proteins and contain many PREs in their 3´ UTRs. Unlike NORAD, none of these transcripts promoted PUM1 phase separation at or below their physiologic concentrations in vitro, although the PUM1 and PUM2 3´ UTRs were able to induce the formation of small droplets at concentrations 4–10 times their physiologic levels (Extended Data Fig. 5e). Accordingly, these endogenous mRNAs exhibited minimal co-localization with PUM1 foci in HCT116 cells (Extended Data Fig. 6). Thus, the PRE valency of NORAD coupled with its high copy number are distinguishing features of this lncRNA that promote the nucleation of PUM condensates.
LLPS enables competitive PUM recruitment
Next, we tested whether the formation of NP bodies allows NORAD to out-compete other PRE-containing RNAs and sequester a super-stoichiometric amount of PUM within condensates. We first examined the relative stoichiometry of NORAD and PUM1 in droplets in vitro, where the concentration of each constituent could be measured using fluorescence microscopy calibrated with fluorophore standard curves. At physiologic PUM1 and NORAD concentrations (150 nM and 2 nM, respectively), we observed approximately three molecules of PUM1 per PRE provided by NORAD in the droplet phase (Extended Data Fig. 7a). Similar PUM1:PRE stoichiometry was observed in droplets formed by the PRE8 oligonucleotide. Increasing PUM1 concentration resulted in a corresponding increase in PUM:PRE stoichiometry. Thus, condensate formation increases the capacity for PUM recruitment beyond what would be possible simply by binding to a PRE-containing transcript.
We next assessed the ability of NORAD to compete against other PRE-containing RNAs for recruitment of PUM into the droplet phase. Competitive droplet formation assays were performed to determine the concentration of a single PRE-containing RNA that could reduce partitioning of PUM1 into _NORAD_-induced droplets by 50%, referred to as the PRE1 IC50. This concentration provides an estimate of the relative efficiency of recruitment of PUM1 into droplets by PREs encoded in NORAD versus titration by singleton PREs. When droplets were formed with 2 nM NORAD (equal to a _NORAD_-encoded PRE concentration of 36 nM), we observed a PRE1 IC50 of ~1.5 μM (Fig. 3a), representing an ~42-fold excess of competitor PREs over the number provided by NORAD at equilibrium. As expected, a mutant PRE-containing RNA (PRE0) exhibited no competition activity. These results demonstrated that each PRE encoded by NORAD can recruit PUM1 ~42 times more efficiently than an isolated PRE. Similar experiments in which PUM droplets were formed with the PRE8 RNA also confirmed that this condensate-inducing RNA can out-compete a monovalent RNA for PUM recruitment (Extended Data Fig. 7b).
Fig. 3 |. Competitive, IDR-driven recruitment of PUM into _NORAD_-PUM condensates.
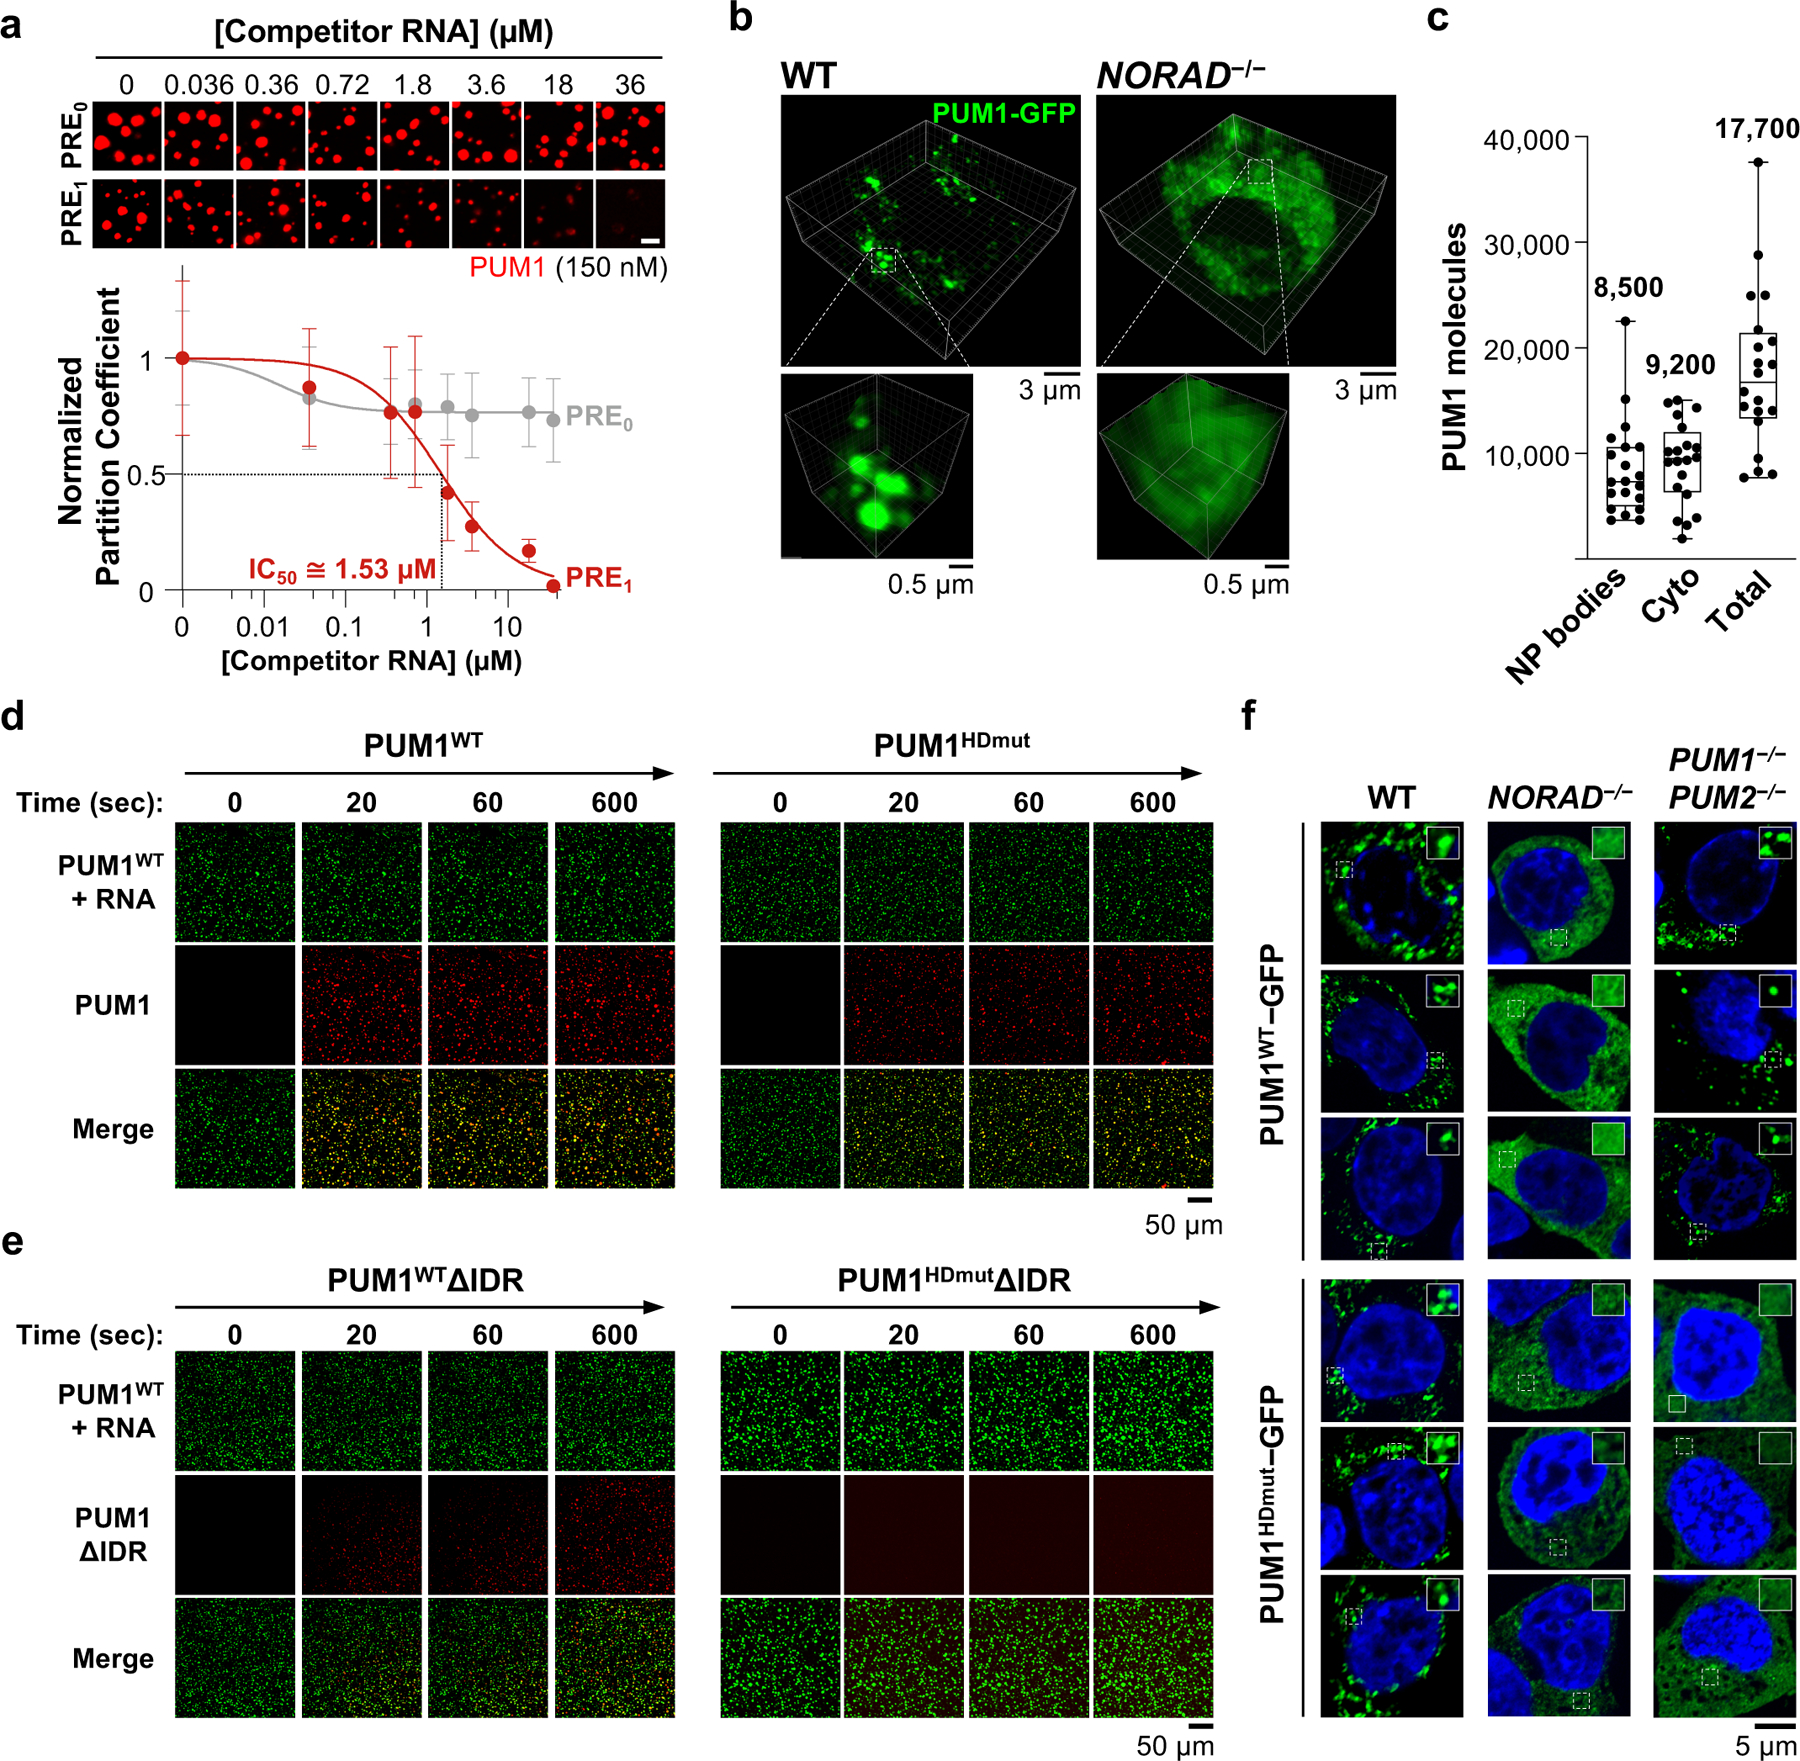
a, (Top) Confocal images of PUM1 droplets (150 nM) formed with NORAD (2 nM) and the indicated concentrations of competitor RNA. (Bottom) Quantification of PUM1 partition coefficients, normalized to partition coefficient at 0 μM competitor RNA. IC50, concentration of PRE1 RNA that reduced PUM1 partitioning by 50%. Data shown as mean ± SD. n = 49 or more droplets per data point. Scale bar, 5 μm. b, 3D-reconstructed live cell confocal images of endogenously-tagged PUM1-GFP HCT116 cells. c, Quantification of PUM1 molecules in NP bodies or cytoplasm per cell (n = 20 cells). Mean number in each compartment shown above box plots. Boxes extend from 25th to 75th percentiles; middle line represents median; whiskers extend from minima to maxima. d, e, Time-lapse confocal images showing recruitment of the indicated wild-type or mutant PUM proteins (red) into preformed PUM1WT-RNA droplets (green, PRE8 RNA oligo). f, Confocal images of PUM1WT-GFP or PUM1HDmut-GFP localization in HCT116 cells of the indicated genotypes.
From these results, we inferred that, with respect to the efficiency of PUM recruitment into NP bodies, the 7,200 PREs provided by ~400 NORAD transcripts per HCT116 cell would be equivalent to ~302,400 singleton PREs (7,200 × 42). Based on our previous estimation of ~130,000–325,000 PREs per cell supplied by expressed mRNAs, we therefore hypothesized that roughly one-half to two-thirds of the cellular pool of PUM protein molecules would be sequestered by NORAD in NP bodies. To test this prediction, we employed the endogenously-tagged PUM1-GFP cell line and confocal microscopy, calibrated with standard curves of GFP fluorescence, to quantify the number of PUM1 molecules in puncta and the surrounding cytoplasm (Fig. 3b, c). Reassuringly, these measurements estimated the total number of PUM1 molecules per cell to be ~17,000–18,000, which was very similar to estimates obtained from quantitative western blotting7. Moreover, in keeping with our predictions derived from competitive droplet formation experiments, we observed that ~50% of PUM1 molecules were localized within NP bodies.
Dual mechanisms of PUM recruitment
Given that IDR-IDR interactions can promote the phase separation of RBPs12, we hypothesized that super-stoichiometric recruitment of PUM into NP bodies may be achieved through multivalent RNA binding interactions, which establish a high local PUM concentration, followed by IDR-mediated recruitment of additional PUM molecules. To investigate this possibility, we examined the phase-separating properties of PUM proteins with mutations in the HD domain that abolish RNA binding (PUMHDmut; Extended Data Fig. 8a, b)20 or with deletion of the IDR. As expected, a PRE-containing RNA did not stimulate PUM1HDmut droplet formation in vitro (Extended Data Fig. 8c, d). However, the addition of PUM1HDmut to pre-assembled droplets formed with wild-type PUM1 and a PRE-containing RNA resulted in efficient recruitment of PUM1HDmut into the droplet phase (Fig. 3d). PUM1 lacking the IDR but retaining RNA-binding activity (PUM1WTΔIDR) was also incorporated into PUM1:RNA condensates, albeit less efficiently, while loss of both the IDR and RNA binding (PUM1HDmutΔIDR) prevented partitioning (Fig. 3e, Extended Data Fig. 8e).
To extend these findings to intact cells, we expressed GFP-tagged wild-type or mutant PUM proteins in HCT116 cells at physiologic levels (Extended Data Fig. 9a). Both PUM1WT-GFP and PUM1HDmut-GFP localized to punctate foci that exhibited similar liquid-like behavior (Extended Data Fig. 9b, c). PUM1WT-GFP was recruited into droplets in a manner dependent upon NORAD expression, as we previously showed, but endogenous PUM proteins were dispensable to establish this localization pattern (Fig. 3f). In contrast, partitioning of PUM1HDmut-GFP into droplets required both NORAD as well as endogenous PUM proteins, supporting the model that PUM1 can be recruited into established NP bodies through PUM-PUM interactions independently of RNA binding. Wild-type and mutant PUM2 proteins behaved similarly in these assays (Extended Data Fig. 9d, e). Additionally, loss of the IDR significantly reduced, while RNA binding was not required for, partitioning of PUM1 into established NP bodies (Extended Data Fig. 9f). Altogether, these experiments established a mechanism whereby NORAD can efficiently recruit PUM proteins into NP bodies through the combined action of direct multivalent binding to PREs within the NORAD transcript and IDR-mediated PUM-PUM interactions. Once NP bodies are established, IDR-mediated interactions play a dominant role in recruiting additional PUM molecules into these condensates.
PUM LLPS maintains genome stability
We next asked whether the partitioning of PUM proteins into phase-separated condensates is the key activity of NORAD that allows it to restrain PUM activity and thereby maintain genome stability. To this end, we expressed a series of RNAs containing an increasing number of PREs, which were protected from PUM-mediated deadenylation and decay by circularization (circPRE transcripts)21 (Extended Data Fig. 10a). CircPRE transcripts containing zero to eight PREs (circPRE0–8) were expressed in HCT116 cells at a range of copy numbers (Extended Data Fig. 10b), such that an approximately equivalent total number of PREs per cell were expressed from each circPRE construct. By carefully controlling the number of PREs expressed in each cell line, we were able to distinguish between a requirement for simple PUM titration versus PUM phase separation in the control of PUM activity and genome maintenance.
In cells depleted of endogenous NORAD by CRISPR interference (CRISPRi) (Extended Data Fig. 10c), circPRE0 and low valency circPRE1–2 were distributed throughout the nucleus and cytoplasm and displayed little to no co-localization with PUM proteins, which were diffusely localized (Fig. 4a, b, Extended Data Fig. 10d, e). In contrast, high valency circPRE transcripts (circPRE4–8) exhibited a strictly cytoplasmic localization pattern, where they co-localized with PUM proteins in punctate foci that resembled NP bodies. These findings corroborated our in vitro results, which demonstrated that a minimum threshold of four PREs is required for nucleation of PUM condensates (Fig. 2c–e).
Fig. 4 |. PUM condensate-inducing RNAs limit PUM activity and rescue genomic instability in _NORAD_-deficient cells.
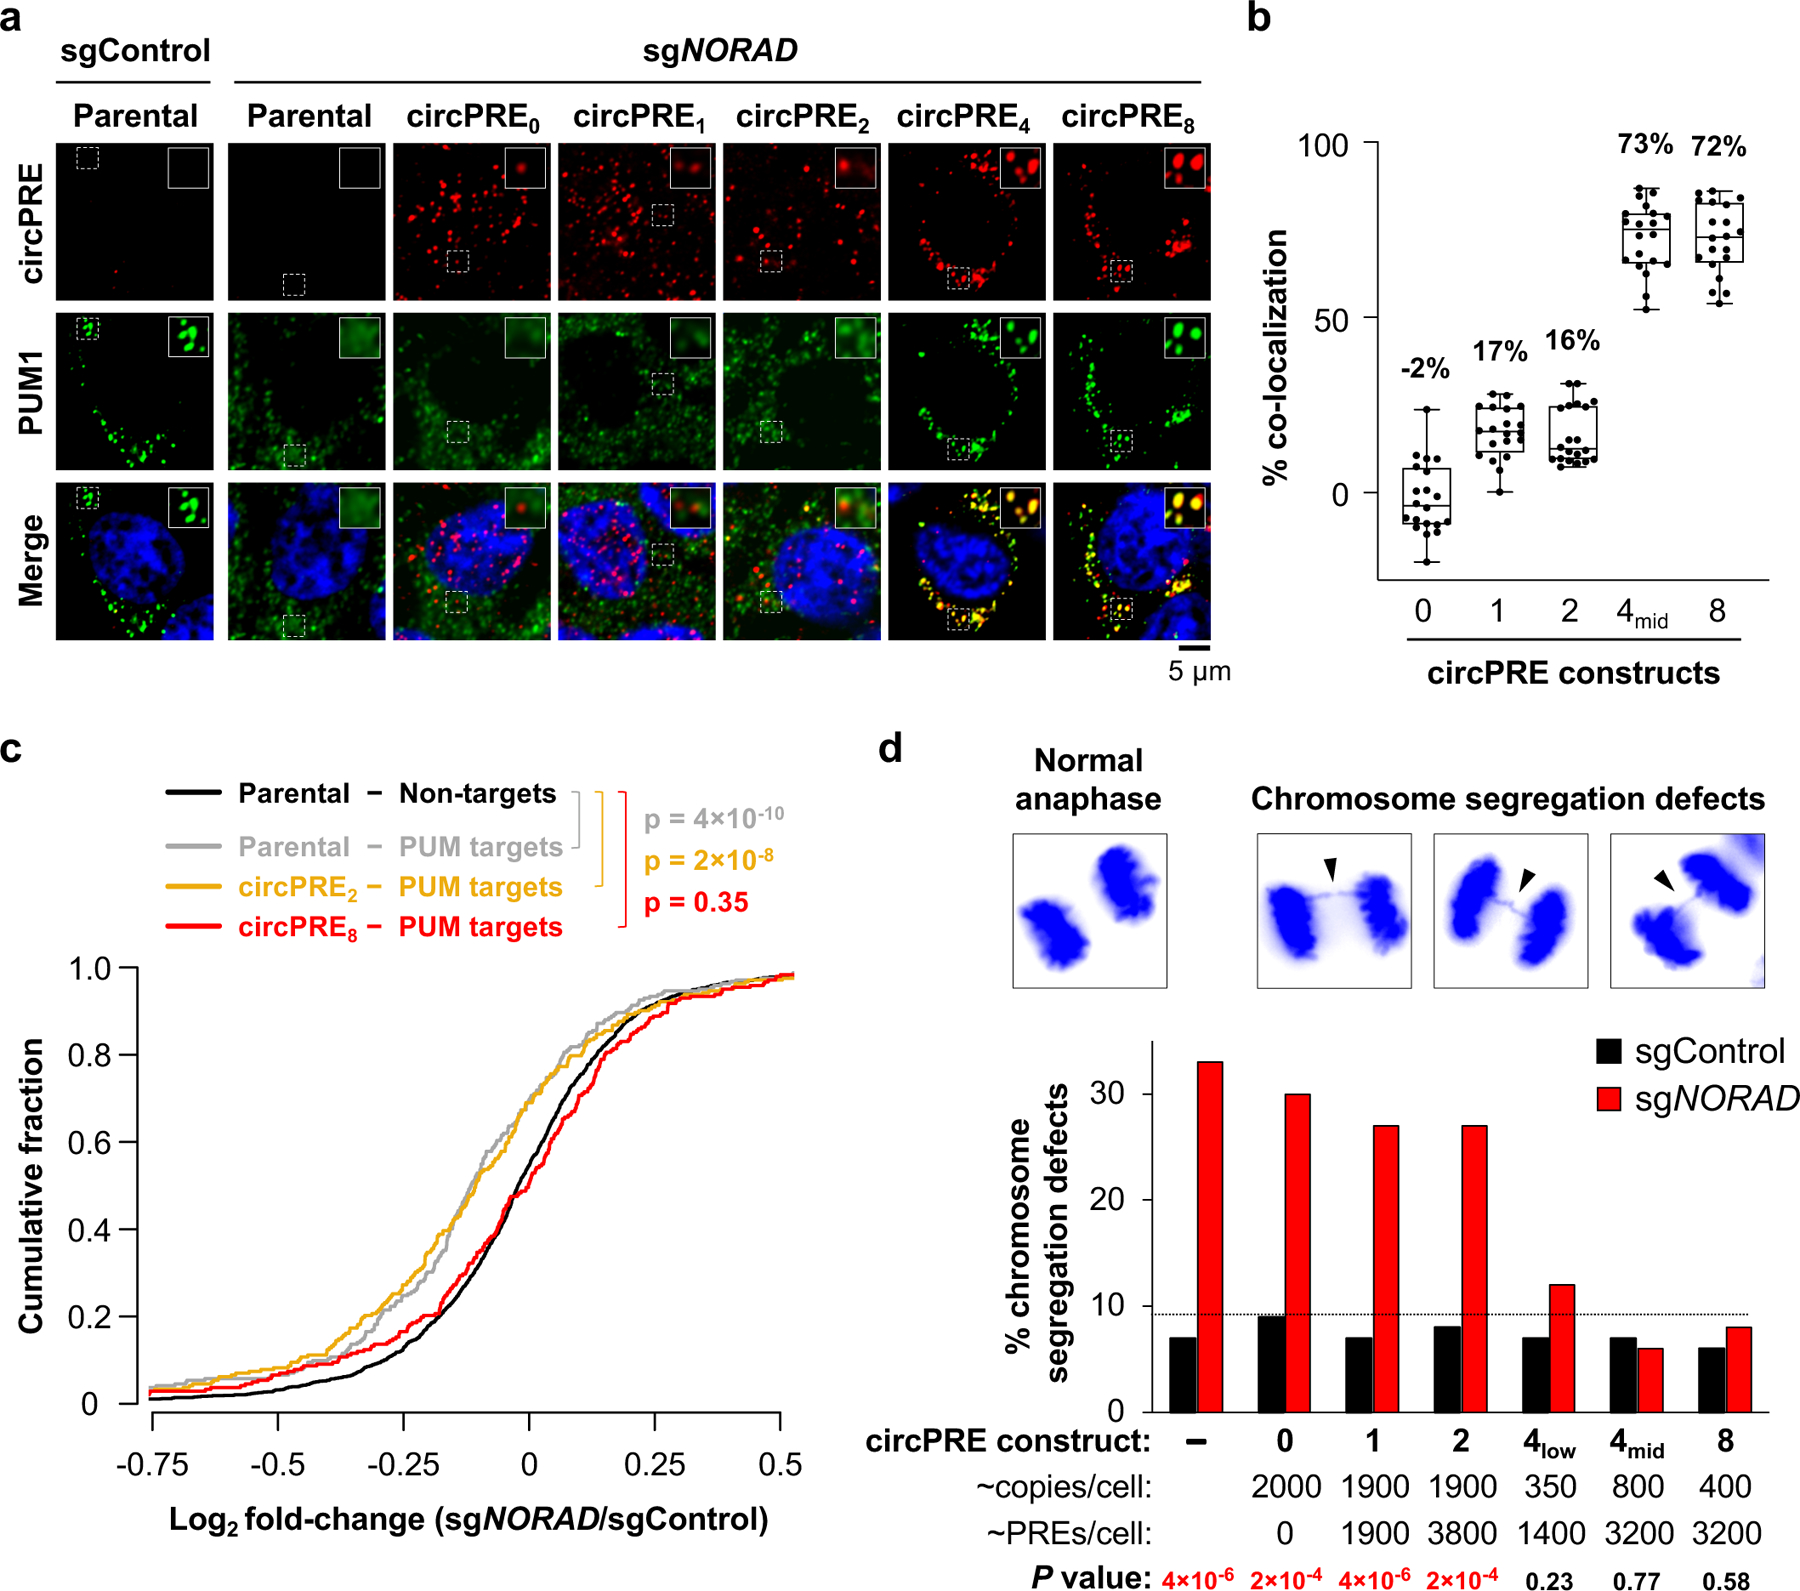
a, Confocal images of circPRE RNA FISH (red) and PUM1 immunofluorescence (green). b, Quantification of circPRE and PUM1 co-localization in sg_NORAD_ cell lines (n = 20 cells for each circPRE cell line). Mean co-localization shown above box plots. Boxes extend from 25th to 75th percentiles; middle line represents median; whiskers extend from minima to maxima. c, Cumulative distribution plot of mRNA expression fold-changes in the indicated sg_NORAD_-infected cell lines compared to parental sgControl-infected cell line. PUM target genes indicated with gray or colored lines (n = 242 genes). Non-target genes in parental cells indicated with black line (n = 1415 genes). P values calculated using one-sided Kolmogorov-Smirnov (K-S) test comparing PUM targets in parental (gray), circPRE2 (yellow), or circPRE8 (red) to non-PUM targets (black). d, (Top) Representative images of DAPI-stained anaphase HCT116 CRISPRi cells. (Bottom) Frequency of mitotic cells exhibiting chromosome segregation defects in circPRE cell populations (n = 100 anaphase cells assayed per sample). Dotted line denotes highest percentage of segregation defects observed in sgControl-infected cells. P values calculated using two-tailed chi-square test comparing sg_NORAD_ to sgControl for each circPRE population.
RNA-seq demonstrated that NORAD depletion in cells lacking circPRE expression resulted in significant repression of PUM targets compared to non-PUM targets, as expected (Fig. 4c, gray versus black curves). NORAD knockdown similarly lead to PUM target repression in cells expressing circPRE2 (Fig. 4c, orange versus black curves). In contrast, PUM targets did not exhibit increased repression in _NORAD_-depleted circPRE8-expressing cells (Fig. 4c, red versus black curves). Thus, PUM condensate formation limits repression of PUM target transcripts.
Finally, to assess the phenotypic consequences of PUM phase separation, the frequency of chromosome segregation errors in each circPRE-expressing cell population was measured (Fig. 4d). NORAD depletion in parental, circPRE0-, or low-valency circPRE1–2-expressing cells resulted in a significant increase in chromosome segregation defects. In contrast, expression of PUM condensate-inducing circPRE4 or circPRE8, at levels that supplied comparable or fewer total PREs per cell than the low-valency constructs, suppressed aberrant chromosome segregation. These results argue against a model in which NORAD simply acts as a stoichiometric PUM-binding RNA decoy, instead supporting the central role of _NORAD_-induced phase separation in the regulation of PUM activity and genomic stability.
Discussion
Here we demonstrate that the lncRNA NORAD is able to out-compete thousands of other transcripts to bind and regulate the activity of PUM proteins by nucleating the formation of liquid-like cytoplasmic RNP condensates, termed NP bodies. NORAD drives the highly efficient condensation and sequestration of PUM proteins in NP bodies through at least two complementary mechanisms: multivalent PUM-NORAD RNA binding interactions and IDR-driven PUM-PUM interactions. Although NORAD is not the only transcript with many PUM binding sites, it is much more abundant than other high valency PRE-containing transcripts. This situates NORAD as a strong and specific scaffold for the assembly of PUM condensates, enabling it to act as a potent PUM inhibitor, while target mRNAs are subjected to PUM-mediated repression. Notably, mammals are particularly sensitive to PUM dosage6,22–24, and thus, phase separation of PUM proteins may provide a means to dynamically buffer and maintain the free cytoplasmic PUM concentration within a narrow range1,25. Furthermore, the formation of NP bodies may shield NORAD from the cytoplasmic deadenylation and decay machineries, potentially explaining why this transcript is largely resistant to PUM-mediated accelerated turnover7. Characterization of the composition of NP bodies and the mechanisms that regulate their formation promises to further illuminate our understanding of RNA-induced phase separation and the role of this process in health and disease.
While other lncRNAs, such as NEAT111 and XIST9, employ phase separation as means to organize subcellular structures and concentrate interacting regulators, our finding that lncRNAs can utilize this mechanism to inhibit the activity of interacting RBPs expands our understanding of the cellular roles and functional consequences of RNA-induced phase separation. Notably, lncRNAs are enriched for repetitive sequences compared to mRNAs10, suggesting that multivalent assembly of interacting proteins and consequent phase separation may be a common principle of lncRNA function.
Methods
Estimation of transcript copy number and the total number of PREs in expressed mRNAs per cell from RNA-seq data
To estimate the total number of PREs in expressed mRNAs per cell, we used previously published RNA-seq data from HCT116 cells7. We first estimated the fractional expression of each protein-coding transcript by dividing the FPKM for each by the sum of FPKM values for all detected protein-coding transcripts. This value was then multiplied by the estimated total number of expressed mRNA molecules per cell (200,000 – 500,000 transcripts per cell)26–28 to yield the approximate copy number of each transcript. Estimated transcript copy number was then multiplied by the number of PREs (UGUANAUN) in each 3´ UTR. These values were summed to obtain the total number of PREs expressed by mRNAs in each cell (130,000 – 325,000 PREs per cell). Copy numbers of PUM targets shown in Extended Data Fig. 5a were estimated as described above, assuming a total number of 200,000 transcripts per cell.
PUM protein disorder plots
Protein disorder prediction for PUM1 (NCBI Reference Sequence: NP_001018494.1) and PUM2 (NCBI Reference Sequence: NP_001339848.1) was performed using the PONDR VSL2 webtool (http://www.pondr.com/). Disorder plots were made using ggplot2 in R (https://www.r-project.org/).
Cell culture
HCT116 cells (ATCC) were cultured in McCoy’s 5a media (ThermoFisher) supplemented with 10% FBS (Gibco, Sigma-Aldrich) and 1X AA (Gibco). The cell line was authenticated by short tandem repeat (STR) analysis. HCT116 _NORAD_−/− and _PUM1_−/−; _PUM2_−/−7 and HCT116 CRISPRi5 cell lines were previously described. HeLa cells (ATCC) were cultured in DMEM media (ThermoFisher) supplemented with 10% FBS (Gibco, Sigma-Aldrich) and 1X AA (Gibco). BJ-5ta cells (ATCC) were cultured in a 4:1 mixture of DMEM and Medium199 supplemented with 10% FBS (Gibco, Sigma-Aldrich) and 1X AA (Gibco). The BJ-5ta _NORAD_−/− cell line was previously described7. Primary Norad+/+ and _Norad_−/− MEFs were generated previously6 and cultured in DMEM (Gibco) supplemented with 10% FBS (Gibco, Sigma-Aldrich), 1X nonessential amino acids (Gibco), and 1X AA (Gibo). Cell lines were routinely tested for mycoplasma contamination by PCR and DAPI/Hoescht staining. All tests were negative.
Generation of endogenously-tagged PUM1-GFP cell lines
CRISPR/Cas9 with a single guide RNA (sgRNA) targeting the endogenous PUM1 locus was used to insert a monomeric enhanced GFP (mEGFP) sequence immediately before the stop codon in HCT116 WT and _NORAD_−/− cell lines. An oligo encoding this sgRNA (Supplementary Table 1) was cloned into pX330, which also encodes Cas9 (Addgene #42230). 6 × 10⁵ HCT116 WT or _NORAD_−/− cells were seeded and transfected with 0.5 μg pX330/sgRNA vector and 1 μg repair template, consisting of mEGFP flanked by 800 base pair (bp) homology arms, along with 0.5 μg pCAGI-mCherry (Addgene # 92015)29 using FuGENE HD (Promega). 2 days after transfection, mCherry-positive cells were collected by sorting. 1 week later, GFP-positive cells were collected by sorting and single cell clones were generated. Successful targeting was verified by sequencing and western blot analysis.
Cloning of PUM and PUMHDmut constructs for protein purification
Full-length human PUM1 and PUM2 sequences were amplified by PCR from pLX302 plasmids containing PUM1 or PUM2 cDNAs7. PCR fragments were cloned into a MBP-TEV-SNAP-linker-TEV-His6 (MTTH-SNAP) bacterial expression plasmid12 digested with BamHI, using NEBuilder HiFi DNA Assembly Master Mix (NEB). The MTTH-SNAP vector was a gift from Michael Rosen. To generate the PUMHDmut constructs, mutant PUM1 and PUM2 Homology Domains (HDs) were synthesized as gene fragments (Integrated DNA Technologies; sequences provided in Supplementary Table 1) and then assembled into full-length PUM1 or PUM2 MTTH-SNAP vectors. PUM1ΔIDR was generated by PCR amplifying the sequence encoding the HD of PUM1WT or PUM1HDmut using primers listed in Supplementary Table 1, which was then cloned into MTTH-SNAP.
Exogenous expression of PUM-GFP
For exogenous expression of GFP-tagged PUM-WT or HDmut proteins in cells (Fig. 2f, Extended Data Fig. 9a–e), DNA sequences were PCR amplified from the aforementioned MTTH-SNAP-PUM vectors. PCR fragments along with an N-terminal EGFP sequence were inserted into pLX304 (Addgene #25890) digested with BamHI and NheI using HiFi assembly. Lentiviruses were packaged in HEK293T cells by co-transfection with psPAX2 and pMD2.G (Addgene #12260 and #12259). Viral supernatants were passed through a 0.45 micron filter and used to transduce HCT116 cells in the presence of 8 μg/mL polybrene (EMD Millipore). Beginning 48 hours after transduction, cells were selected with 10 μg/mL blasticidin (Gibco, ThermoFisher) for at least 7 days. Fluorescence Activated Cell Sorting (FACS) was then used to collect cell populations exhibiting a narrow range of fluorescence, which were then screened by western blot to select populations with comparable PUM-GFP and endogenous PUM expression (as shown in Extended Data Fig. 9a).
For exogenous expression of GFP-tagged full-length or IDR-deleted PUM1 proteins in wild-type HCT116 cells (Extended Data Fig. 9f), PUM1 DNA sequences were PCR amplified (primers in Supplementary Table 1) and inserted into PiggyBac XLone-GFP plasmid (Addgene #96930)30 digested with BsrGI and SpeI. 5 × 10⁵ HCT116 cells were transfected with 1 μg PiggyBac-PUM1 plasmid and 2.5 μg phyPBase transposase vector using FuGENE HD (Promega). Cells were selected with blasticidin (10 μg/mL) for at least 7 days. PUM1-GFP expression was induced with doxycycline (1 μg/mL) for 24 hours, and cells were sorted to obtain similar GFP fluorescence levels.
RNA fluorescent in situ hybridization (RNA FISH)
RNA FISH was performed as described previously5,31. Briefly, DIG-labeled RNA probes for human or mouse NORAD, PUM target mRNAs, or circPRE transcripts were synthesized by in vitro transcription using a DIG-labeling mix (Roche) and purified using Micro Bio-Spin P-30 chromatography columns (Bio-Rad). Primers used for amplification of each DNA template are provided in Supplementary Table 1. 2 × 10⁵ cells were grown on poly-L-lysine coated #1.5 coverslips for 48 hours. For DNA damage treatment, cells were grown for 24 hours and treated with 200 nM camptothecin for an additional 16 hours. Samples were rinsed twice in phosphate buffer saline (PBS), fixed in 4% paraformaldehyde for 10 minutes, washed again in PBS, and permeabilized in PBS solution containing 0.5% Triton X-100 and 40 U/ml Protector RNase Inhibitor (Roche) for 10 minutes. Coverslips were then washed twice with PBS and rinsed with DEPC-treated water prior to incubation in prehybridization buffer (50% formamide, 2X SSC, 1X Denhardt’s solution, 10 mM EDTA, 0.1 mg/mL yeast tRNA, 0.01% Tween-20) for 1 hour. 10 ng/μl DIG-labeled RNA probe was diluted in hybridization buffer (prehybridization buffer with 5% dextran sulfate), melted at 75° C for 10 minutes, and used for hybridization at 55° C for 16 to 20 hours. Following hybridization, samples were washed, treated with RNase A, and blocked using Blocking Reagent (Roche). DIG-labeled probes were detected using mouse monoclonal anti-DIG primary antibody (Roche) and a Cy3-labeled goat anti-mouse IgG secondary antibody (Roche) (Supplementary Table 1).
Immunofluorescence (IF)
Cells were grown for 48 hours on poly-L-lysine coated #1.5 coverslips then washed with PBS, fixed in 4% paraformaldehyde for 10 minutes, washed again in PBS, and permeabilized in 0.5% Triton X-100 for 10 minutes. Coverslips were then washed with PBS and 1X Tris-buffered saline with 0.1% Tween-20 (TBST) prior to blocking with 1X Blocking Reagent (Roche) for 30 minutes. Samples were then incubated with primary antibodies for 1 hour at room temperature, followed by 3 washes in TBST, and then incubated with secondary antibodies for 1 hour at room temperature. Samples were then washed 5 times with TBST and rinsed with deionized water prior to mounting with SlowFade Anti-Diamond with DAPI mounting media (Invitrogen). Primary and secondary antibodies used for IF are provided in Supplementary Table 1.
Western blotting
For western blotting, cells were washed twice with PBS and lysed in 1X NuPage LDS Sample Buffer (Invitrogen) for 5 minutes at 95° C. Proteins were resolved by 8% SDS-PAGE and wet transferred onto nitrocellulose membranes (0.45μm, ThermoFisher). Membranes were blocked with 5% non-fat milk in TBST for 30 min at room temperature and incubated with primary antibodies overnight at 4° C. An infrared fluorescent secondary antibody detection system (LI-COR) was used for protein detection. All antibodies are provided in Supplementary Table 1.
Protein expression and purification
Escherichia coli (E. coli) BL21/pLysS Rosetta-2 (DE3) cells (Sigma) were transformed with MTTH-SNAP-PUM plasmids. Bacteria were grown to an O.D. of 0.6–0.8 and proteins were induced with 1 mM IPTG, after which bacteria were grown for an additional 20 hours at 18° C. Bacteria were collected by centrifugation and resuspended in lysis buffer containing 20 mM Tris-HCl (pH 8.0), 1 M NaCl, 20 mM imidazole, 5 mM β-mercaptoethanol, 0.2 mM PMSF, 10% glycerol, benzonase nuclease (Sigma), and EDTA-free Protease Inhibitor Cocktail (Roche). Cells were lysed by sonication, and lysate was cleared by centrifugation (20,000g × 30 min, 4° C). The supernatant was then incubated with Ni-NTA beads (Qiagen) and washed with 10 column volumes of lysis buffer (without benzonase, PMSF, and Protease Inhibitor Cocktail). After an additional wash with 10 column volumes of wash buffer (20 mM Tris-HCl (pH 8.0), 1 M NaCl, 50 mM imidazole, 5 mM β-mercaptoethanol, 10% glycerol), protein was eluted with elution buffer containing 20 mM Tris-HCl (pH 8.0), 500 mM NaCl, and 300 mM imidazole. Protein fractions were pooled and dialyzed overnight at 4° C against 500 mM NaCl, 20 mM Tris HCl (pH 7.4), 1 mM DTT, and 10% glycerol. Proteins were concentrated via centrifugal filtration (Amicon Ultra Centrifugal Filter Unit, 30K MWCO and Pierce Protein Concentrator, 10K MWCO) and flash-frozen and stored at −80° C. An additional centrifugation step (20,000g, 10 minutes, 4° C) was performed to remove potential aggregates prior to droplet assembly experiments. The concentrations of all proteins were measured by the absorbance at 280 nm on Nanodrop and extinction coefficients were obtained from ExPASy ProtParam (http://web.expasy.org/protparam/).
Fluorescent Labeling of Proteins
SNAP-tag containing proteins were labeled with SNAP-Surface-488 or SNAP-Surface-549 (NEB) according to the manufacturer’s protocol with 1 hour incubation at room temperature. Unreacted substrate was removed by Zeba spin desalting column 7K MWCO (ThermoFisher).
In vitro transcription to generate RNAs for phase separation assays
In vitro transcription of NORAD, PREmut, ND4, or 3´ UTRs was performed using the MEGAscript T7 Transcription Kit (Invitrogen) according to the manufacturer’s instructions with the following modifications: Template DNA was PCR amplified from previously generated AAVS1 donor plasmids5 or, for 3´ UTRs, from cDNA reverse transcribed from RNA extracted from HCT116 cells using primers that incorporated a 5´ T7 promoter (Supplementary Table 1) and gel-purified (Qiagen Gel Extraction kit). Transcription reactions were doped with Cy3-UTP (Enzo Life Sciences) or FITC-UTP (Sigma). Free NTPs were removed using Micro Bio-Spin P-30 chromatography columns (Bio-Rad). Correct RNA product size was verified by denaturing formaldehyde agarose gel electrophoresis. RNAs were aliquoted, flash frozen, and stored at −80° C.
In vitro phase separation and turbidity assays
Purified proteins were mixed with 2–5% SNAP-labeled proteins for fluorescent imaging of droplets. Unless otherwise noted in the figure legend, all in vitro phase separation assays were performed in the presence of polyethylene glycol-3350 (PEG3350). For droplet formation assays at high PUM concentrations (5 μM), proteins were diluted in phase separation buffer [final concentrations: 20 mM Tris HCl pH 7.5, 150 mM NaCl, 1 mM DTT, 10% glycerol, 10% PEG3350, and 1 U TEV protease (Promega)]. For RNA-induced phase separation experiments, in vitro-transcribed RNAs or 5´ FAM-labeled PRE-containing RNA oligos (Integrated DNA Technologies, Supplementary Table 1) were diluted in water and denatured at 70° C for 10 min prior to their addition to protein mixtures in a modified phase separation buffer (final concentrations: 20 mM Tris HCl pH 7.5, 150 mM NaCl, 1 mM MgCl2, 1 mM DTT, 10% glycerol, 5% PEG3350, and 1 U TEV protease). Protein or protein-RNA solutions were incubated at room temperature in 384-well #1.5 glass bottom plates (Cellvis) for 30–60 min prior to imaging.
Turbidity measurements were performed using a GloMax Discover microplate reader (Promega). For each RNA concentration, three independently-assembled 50 μL reaction mixtures, assembled as described above for imaging experiments, were incubated in 384-well plates (Cellvis) for 10–15 minutes at room temperature, and the absorbance at 600 nm wavelength was measured. Absorbance values were corrected by subtracting buffer-only absorbance values.
For recruitment of PUM1WT, PUM1HDmut or PUM1ΔIDR proteins into preformed droplets, 150 nM PUM1WT was first incubated with 20 nM FAM-labeled PRE8 RNA oligo in phase separation buffer (20 mM Tris HCl pH 7.5, 150 mM NaCl, 1 mM MgCl2, 1 mM DTT, 10% glycerol, 5% PEG3350, and 1 U TEV protease) and allowed to form droplets for 30 min. PUM1WT, PUM1HDmut or PUM1ΔIDR protein, 5% of which was labeled with SNAP549, was precleaved with TEV protease for 15 minutes. Precleaved proteins were then added to preformed droplets at a final concentration of 200 nM, and images were taken at subsequent time points.
Image Acquisition and Analysis
Confocal fluorescence microscopy images of RNA FISH, IF, and in vitro phase separation experiments were taken using a Nikon A1R+ confocal microscope with a 60X oil objective and Nikon A1 camera. Images were analyzed using NIS-Elements software (Nikon; NIS-Elements AR v5.10.01) and Fiji (ImageJ v1.52p) for quantification. For structured illumination microscopy (SIM), samples were imaged using a Nikon N-SIM structured illumination microscope equipped with a 100X oil objective and ORCA-Flash 4.0 sCMOS camera (Hamamatsu Photonics K.K.). Super-resolution images were analyzed using NIS-Elements and N-SIM Analysis software (Nikon; NIS-Elements AR v5.10.01). Differential interference contrast (DIC) and fluorescence microscopy images of in vitro PUM droplet formation at 5 μM (Extended Data Fig. 3c, d, g) were taken using an AxioObserver Z1 microscope (Zeiss; ZEN v3.2) equipped with 40X and 100X oil objectives.
Colocalization analysis was performed using the “JACoP” plugin in Fiji32. A Pearson’s correlation coefficient was used to assess colocalization between NORAD, PUM target mRNAs, or circPREs and PUM1/2 foci with an intensity threshold of 2.5x, 1.5x, or 1.5x the mean NORAD, PUM target transcript, or circPRE fluorescence intensity, respectively, and 2.5x the mean PUM1/2 fluorescence cell intensity. Similar colocalization values were obtained using a Costes’ automatic threshold33. Box-and-whisker plots were plotted using GraphPad PRISM 8 (GraphPad Software). Boxes extend from 25th to 75th percentiles, the line in the middle of each box represents the median, and whiskers extend from the minimum to maximum value.
For counting the number of PUM1 or PUM2 puncta in circPRE cell lines (Extended Data Fig. 10d, e), confocal images were analyzed using 3D Object Counter plugin in Fiji (https://imagej.nih.gov/ij/plugins/track/objects.html). Threshold parameters were set such that punctate bodies in close proximity to one another could be identified as individual bodies. The size parameter was set to a minimum of 10 voxels, and the intensity threshold was set to at least 5x or 8x the mean total PUM1 or PUM2 fluorescence intensity in the sg_NORAD_ HCT116 CRISPRi cell line, respectively. The same PUM1 or PUM2 intensity threshold and size parameters were used for all samples. 20 cells were analyzed for each cell line.
Estimation of NP body, P-body, and stress granule volumes
Endogenously tagged PUM1-GFP NORAD+/+ HCT116 cells were used to estimate the volume of NP bodies and stress granules. For stress granule formation, cells were treated with 0.5 mM sodium arsenite for 1 hour, a time-point at which the majority of stress granule assembly is complete34. To measure the volume of P-bodies, 10 ng of a pLX304-DCP2-GFP fusion expression plasmid was transfected into 5 × 10⁴ HCT116 cells and imaged 48 hours later. Live cell Z-stack images were captured using a Nikon A1R+ confocal microscope (NIS-Elements AR v5.10.01) or Zeiss LSM980 confocal microscope (ZEN Blue). 3D reconstructed images (Extended Data Fig. 2c) were generated using Imaris image analysis software (Oxford Instruments). Volumes were calculated using 3D Object Counter plugin in Fiji. At least 10 cells were analyzed for each condensate.
Estimation of HCT116 cytoplasmic volume
The cytoplasmic volume of HCT116 cells was estimated by staining _NORAD_−/− cells for PUM1, which exhibits a diffuse cytoplasmic localization pattern in these cells. Z-stack images of fixed cells stained for PUM1 and DAPI were captured using a Nikon A1R+ confocal microscope. 3D-reconstruction was performed using NIS-Elements software (Nikon; NIS-Elements AR v5.10.01). For each cell, the length (l), width (w), and depth (d) of the entire cell and the nucleus was measured using NIS-Elements. The total cellular and nuclear volumes were calculated using the ellipsoid volume formula [Vellipsoid = (4/3) π (_l/_2 × w/2 × d/2)]. The cytoplasmic volume was calculated as the total volume minus the nuclear volume. The cytoplasmic concentration of NORAD and PUM was calculated using the average cytoplasmic volume measured in 20 cells and the previously determined number of NORAD and PUM molecules in HCT116 cells7.
Live cell imaging
Cells were grown on poly-L-lysine treated #1.5 coverglass chambers (Lab-Tek) for 24–48 hours. Before imaging, culture media was replaced with FluoroBrite DMEM media (ThermoFisher) supplemented with 10% FBS and 1x GlutaMAX (ThermoFisher). Cells were imaged with a Nikon A1R+ confocal microscope with a 60X oil objective and Nikon A1 camera equipped with a heated stage (37° C) and 5% CO2 environment.
Fluorescence Recovery After Photobleaching (FRAP)
FRAP was performed using a Nikon A1R+ microscope with a 488nm or 561nm laser. For in vitro FRAP, fluorescent droplets with sizes around 5 μm were photobleached using 80% laser power, and images were subsequently collected every 5–10 seconds. For FRAP experiments of PUM condensates in living cells, the entire punctum, typically less than 1 μm in diameter, was photobleached using 70% laser power, prior to time-lapse imaging. Fluorescence intensity in the photobleached region was measured using ImageJ and values were normalized to pre-bleach time points.
Analysis of PUM:RNA stoichiometry in droplets
PUM1:NORAD droplets were formed using 150, 300, or 600 nM of PUM1 (5% SNAP488-labeled) plus 2 nM NORAD RNA (1% Cy3-labeled). PUM1:PRE8 RNA oligo droplets were formed using similar concentrations of PUM1 (1.5% SNAP549-labeled) plus 10 nM FAM-labeled PRE8 RNA oligo. After 30 minutes of incubation, images of droplets were taken using a Nikon A1R+ confocal microscope. The fluorescence intensities of at least 100 droplets were measured using Fiji. A standard curve of fluorescence intensity versus concentration was generated for each fluorophore (SNAP488, SNAP549, _NORAD_-Cy3, and FAM-PRE8 RNA oligo) and used to convert droplet fluorescence intensities into absolute molar concentrations of labeled components. The total concentration of protein or RNA within droplets was then calculated by multiplying the labeled concentration by the ratio of unlabeled to labeled components. The ratio of protein to RNA concentration in the droplets was then divided by the number of PREs for each RNA (NORAD, 18 PREs; PRE8 oligo, 8 PREs) to obtain the PUM:PRE stoichiometric ratio.
In vitro competition assay
150 nM PUM1 (1.5% SNAP549-labeled), 2 nM NORAD or 10 nM PRE8 oligo, and increasing concentrations of PRE0 or PRE1 oligo (0–36 mM) were mixed in modified phase separation buffer (final concentrations: 20 mM Tris HCl pH 7.5, 150 mM NaCl, 1 mM MgCl2, 1 mM DTT, 10% glycerol, 5% PEG3350, and 1 U TEV protease) and incubated in 384-well plates for 30 minutes. Images of droplets were taken using a Nikon A1R+ confocal microscope. The mean fluorescence intensities of at least 50 droplets were measured using Fiji. Partition coefficients were calculated as the ratio of PUM1 intensity in each droplet versus the intensity of free PUM1 in solution. Values were normalized to the partition coefficient with 0 nM PRE0 or PRE1 oligo. The concentration at which PRE1 oligo reduced the partitioning of PUM1 into droplets by 50% (IC50) was calculated using GraphPad PRISM 8.
Quantification of PUM1 molecules in puncta and cytoplasm
Live cell Z-stack images (0.1 μm step size) of PUM1-GFP HCT116 WT or _NORAD_−/− cells were taken using a Nikon A1R+ confocal microscope. PUM1-GFP puncta fluorescence intensities and volumes were measured using Fiji 3D Objects Counter plugin. For each cell analyzed, a fluorescence intensity threshold of 3.5x the mean total cell PUM1 fluorescence intensity and a minimum size threshold of 10 voxels was used to identify puncta. Using these parameters, few to no puncta were identified in _NORAD_−/− cells. PUM1-GFP cytoplasmic intensity was calculated by averaging the mean intensities of four cytoplasmic regions of interest (ROIs) outside of puncta for each cell. Fluorescence intensities were converted to concentration using a standard curve of the fluorescence intensity versus concentration of purified recombinant GFP protein (Abcam, ab134853). The number of PUM1 molecules in puncta was then determined by multiplying the concentration by the volume for each punctum. PUM1 molecules in the cytoplasm were calculated by first subtracting the puncta volume from the total volume of the cytoplasm (measured as described above), and then multiplying this corrected cytoplasmic volume by the average concentration of PUM1 in the cytoplasm. 3D reconstructed images (Fig. 2b) were generated using Imaris image analysis software (Oxford Instruments).
Electrophoretic Mobility Shift Assay (EMSA)
EMSAs were performed using purified PUM1HD-WTΔIDR and PUM1HDmutΔIDR proteins together with a 32P end-labeled PRE-containing RNA oligonucleotide (sequence provided in Supplementary Table 1). 1 ng of RNA was mixed with increasing concentrations of purified protein in EMSA Buffer (20 mM Tris pH 8, 100 mM NaCl, 2 mM MgCl2, 5% glycerol, and 100 ng/μL tRNA) and incubated on ice for 1 hour. Prior to loading, 5% Ficoll-400 was added to samples. Samples were separated on a native 6% TBE-polyacrylamide gel (Invitrogen) and transferred to a BrightStar-Plus nylon membrane (Invitrogen) followed by UV-crosslinking at 120 mJ/cm2. Radioactive signal was detected using a Typhoon phosphorimager (GE Life Sciences).
Generation of circPRE HCT116 CRISPRi cell lines
Oligos containing 0–8 PREs (sequences provided in Supplementary Table 1) were cloned into a KflI-digested pAV-U6+27-Tornado-F30-Broccoli plasmid21, which was a gift from Samie Jaffrey. The region encompassing the U6 promoter, 5´ ribozyme, F30 sequences, Broccoli, PREs, 3´ ribozyme, and U6 terminator was then PCR amplified and cloned into a PiggyBac XLone-GFP plasmid (Addgene #96930)30 digested with EcoRV. 5 × 10⁵ HCT116 CRISPRi cells, generated previously5, were transfected with 1 μg PiggyBac-circPRE plasmid and 2.5 μg phyPBase transposase vector using FuGENE HD (Promega). Beginning 48 hours after transfection, cells were selected with blasticidin (10 μg/mL) for at least 7 days. To collect cell populations with an increasing number of PiggyBac integrations, GFP expression was induced with doxycycline (1μg/mL) for 24 hours, and cells were sorted into narrow bins of low, medium, or high GFP fluorescence. circPRE expression level in each cell population was determined by qRT-PCR, using the PiggyBac-circPRE2 plasmid as a standard curve for determining absolute copy number in a defined number of cells (primer sequences in Supplementary Table 1). Cell populations with the desired circPRE copy number were chosen for further analysis.
CRISPRi-mediated knockdown of endogenous NORAD was performed as described previously5. HCT116 CRISPRi cells were transduced with a pU6-sgRNA EF1a-PuroR-T2A-BFP vector (Addgene #60955) containing an sgRNA targeting a sequence upstream of the endogenous NORAD transcription start site (sequence provided in Supplementary Table 1). Transduced cells were selected with 1 μg/mL puromycin (for parental CRISPRi cell lines) or 1 μg/mL puromycin and 10 μg/mL blasticidin (for circPRE cell lines).
RNA isolation and qRT-PCR
RNA was isolated from cells using Trizol (Invitrogen) or the RNeasy kit (Qiagen) and treated with RNase-free DNase (Qiagen). RNA was reverse transcribed with PrimeScript RT-PCR mix (Clonetech), and Power SYBR Green PCR Master Mix (Applied Biosystems) was used for qPCR. Primer sequences are provided in Supplementary Table 1. Absolute transcript copy numbers (Extended Data Fig. 5c, 10b) were measured by performing qRT-PCR on RNA from a defined number of cells. Standard curves were generated with plasmid cDNA to calculate transcript number per cell.
RNA sequencing and analysis
RNA-seq library preparation and next generation sequencing were carried out by GENEWIZ (South Plainfield, NJ). Samples were poly-A selected using oligo-dT beads and sequenced on an Illumina HiSeq 2×150 bp platform. 2 biological replicates per genotype (sgControl parental, sg_NORAD_ parental, sg_NORAD_ circPRE2, and sg_NORAD_ circPRE8 HCT116 CRISPRi cell lines) were sequenced with an average read depth of 60×106 per sample. Reads were aligned to the human reference genome (GRCh38)35 using STAR36. Aligned reads were counted per gene ID using feature counts (v1.6.0)37. Differential gene expression analysis was performed using EdgeR (v3.24.0)38. Raw data and differential gene expression data are available at NCBI Gene Expression Omnibus (GEO) under accession number GSE154812.
For cumulative distribution function (CDF) plots comparing fold-changes of PUM targets in each sg_NORAD_-infected cell line to sgControl cell line, genes were first filtered for those with an average expression level of at least 1 FPKM. PUM targets were defined as PUM2 CLIP targets, identified by Hafner et al.39 or Lee et al.7, that were downregulated upon over-expression of PUM1 or PUM2 in HCT116 cells (p-value <0.05)7. Non-targets were defined as non-CLIP targets containing no PREs in their 3´ UTR. Non-targets were filtered for those whose 3´ UTR length was within 25% of the mean 3´ UTR length in the set of PUM targets.
Chromosome segregation analysis
Quantification of chromosome segregation defects was performed as described previously5. Cells were grown on poly-L-lysine coated coverslips for 24 hours and fixed with 4% PFA in PBS for 10 minutes at room temperature. Samples were then carefully washed with PBS and mounted using SlowFade Diamond Antifade with DAPI mounting media (Invitrogen). For each sample, 100 anaphase nuclei were imaged using an AxioObserver Z1 microscope (Zeiss; ZEN v3.2), and the frequency of chromosome segregation defects was assessed. The experimenter was blinded to the sample identity when counting.
Statistics and Reproducibility
Statistical significance was assessed using the statistical tests indicated in the figure legends. P values were obtained using GraphPad PRISM 8. The number of biological or technical replicates for each experiment are indicated in the figure legends. RNA FISH, immunofluorescence, and live cell confocal images (Fig. 1a–c, 1e, Extended Data Fig. 1a, 1c–e, 2b, and 10d, e) are representative of at least 2 independent experiments. RNA FISH and IF experiments for PUM target transcripts (Extended Data Fig. 6) were performed once, and images are representative of the entire field of cells. Proteins used in this study were obtained from at least 2 independent purifications yielding similar purity and phase separation activity (Extended Data Fig. 3b and 8c, e). For in vitro phase separation experiments comparing titrations of a protein or RNA over a range of concentrations, the same batch of protein was used for all conditions. Unless otherwise noted in the figure legends, in vitro phase separation assays were performed at least twice with reproducible results (Extended Data Fig. 3c, d, g, h, 4d, and 8d). EMSA in Extended Data Fig. 8b was performed twice with similar results. Images of exogenously expressed PUM proteins (Fig. 2f and Extended Data Fig. 9a–e) are representative of the entire field of cells, and consistent results were obtained from three independent experiments. Western blots (Extended Data Fig. 1b, 2a, and 9a) were performed at least twice with similar results.
Extended Data
Extended Data Fig. 1 |. NORAD and PUM co-localize in cytoplasmic condensates.
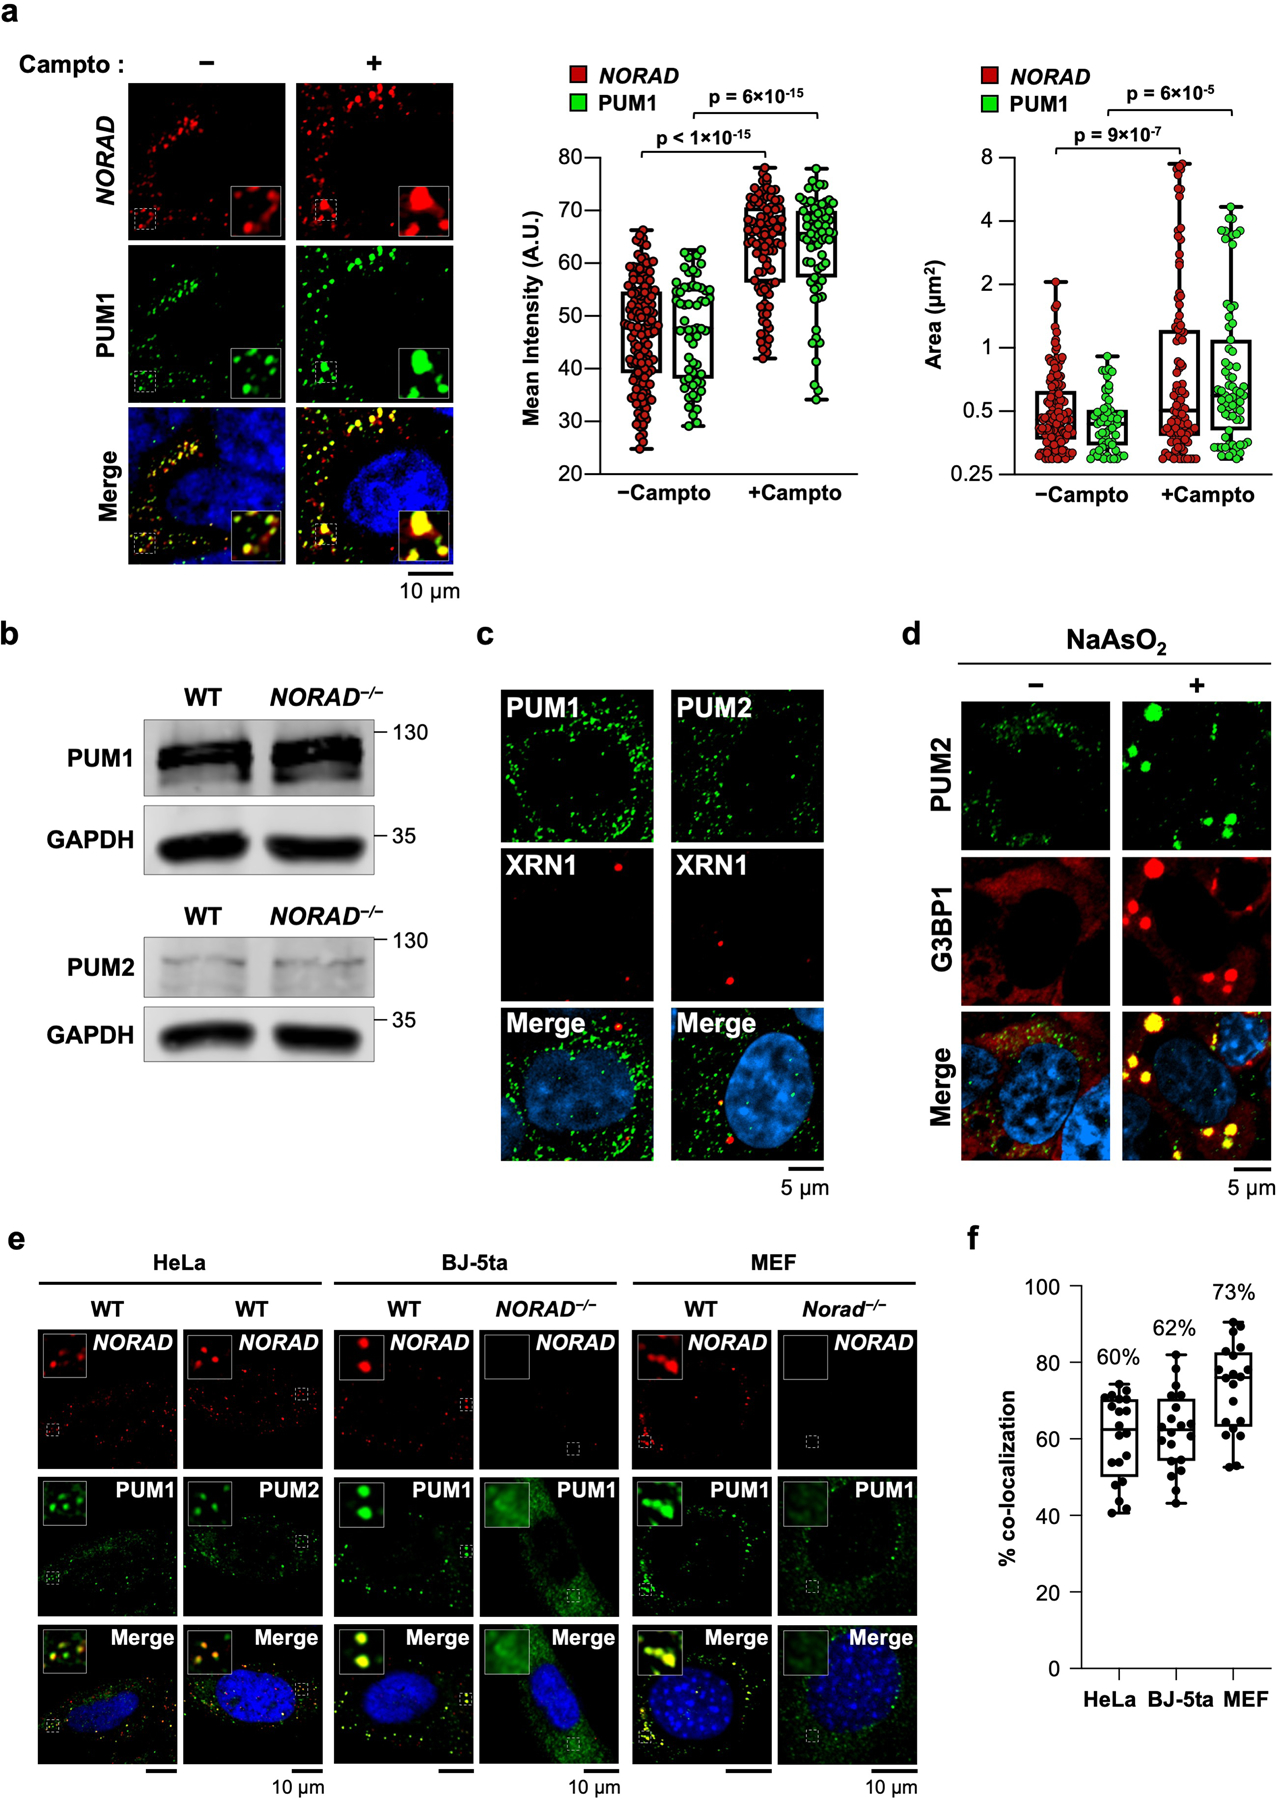
a, (Left) Confocal images of NORAD and PUM1 co-stained HCT116 cells with or without treatment with camptothecin (200 nM) for 24 hours. (Right) Box plots of the mean fluorescence intensity and area of NORAD and PUM1 foci. NORAD, n= 149 foci; PUM1, n = 58 foci; NORAD + camptothecin, n = 97 foci; and PUM1 + camptothecin, n = 67 foci from at least two different fields analyzed. Boxes extend from 25th to 75th percentiles; middle line represents median; whiskers extend from minima to maxima. P values calculated using two-tailed t-test. b, Western blot of PUM1 or PUM2 in HCT116 cells of the indicated genotypes. Molecular weight in kDa shown on right of blots. For gel source data, see Supplementary Figure 1. c, Confocal images of PUM1 or PUM2 co-stained with P-body marker XRN1. d, Confocal images of PUM2 and stress granule marker G3BP1 with or without treatment with sodium arsenite (0.5 mM, 60 min incubation). e, Confocal images of NORAD and PUM localization in the indicated cell lines and genotypes. BJ-5ta cells are TERT-immortalized human fibroblasts. f, Quantification of NORAD and PUM1 co-localization (n = 20 cells for each cell line). Mean co-localization shown above box plots. Boxes extend from 25th to 75th percentiles; the line in the middle of the box represents the median; whiskers extend from minima to maxima.
Extended Data Fig. 2 |. NP bodies are liquid-like condensates distinct from other known cytoplasmic granules.
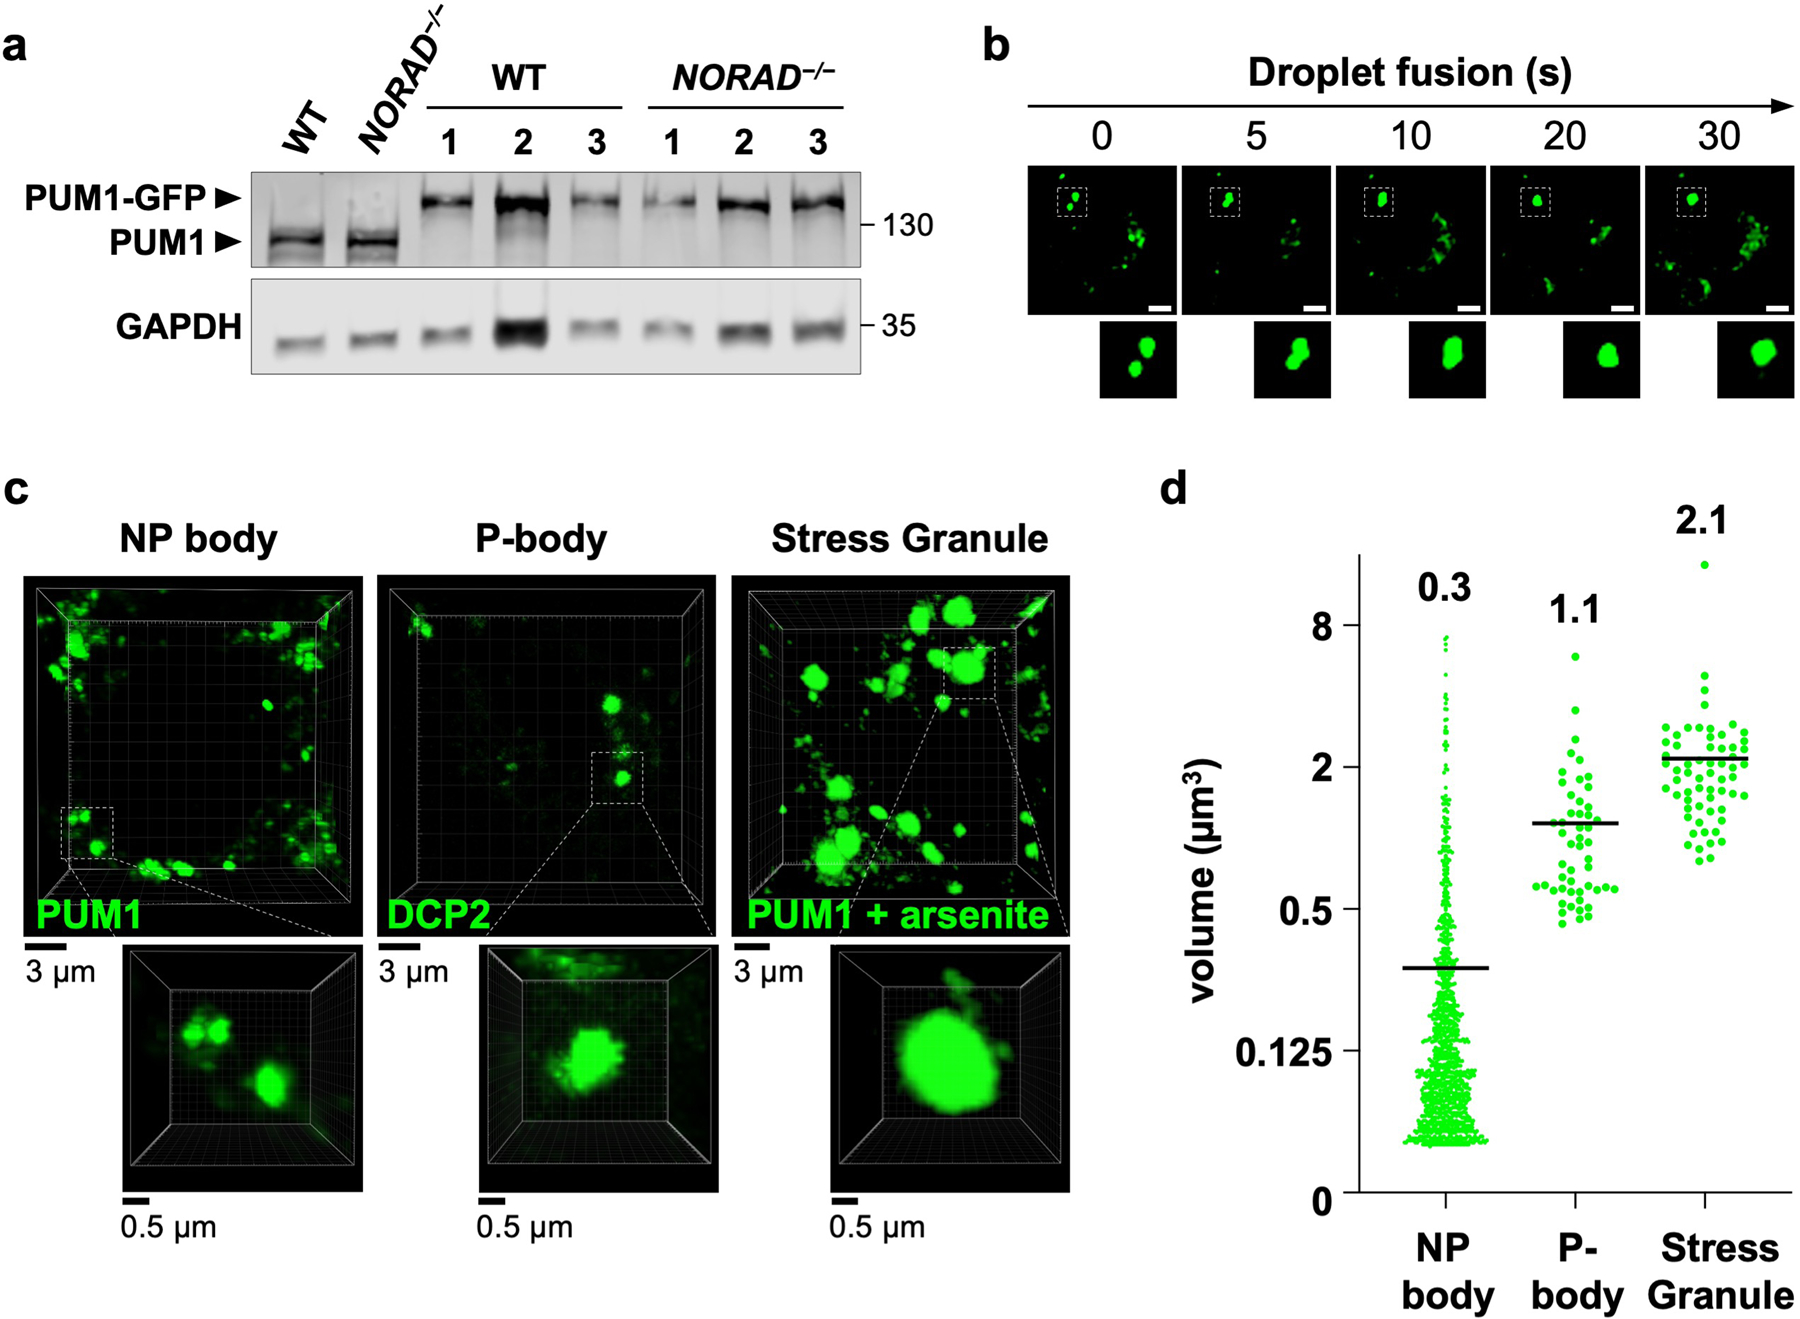
a, PUM1 western blot in HCT116 clones with GFP knock-in at the endogenous PUM1 locus. Three genotype-confirmed wild-type and _NORAD_−/− clones shown alongside parental wild-type and _NORAD_−/− cells. Molecular weight in kDa shown on right of blots. For gel source data, see Supplementary Figure 1. b, Time-lapse images showing fusion of endogenous PUM1-GFP condensates in HCT116 cells. Scale bar, 5 μm. c, Representative 3D-reconstructed live cell confocal images used to estimate the volume of NP bodies, P-bodies, and stress granules. Endogenously-tagged PUM1-GFP HCT116 cells were used for NP body or stress granule measurements (the latter after treatment with 0.5 mM sodium arsenite for 1 hour). P-body marker DCP2-GFP was used to estimate the volume of P-bodies in HCT116 cells. d, Quantification of condensate volumes (n = 1072 NP bodies from 20 cells, 51 P-bodies from 11 cells, and 62 stress granules from 10 cells). Average volume of each granule shown above plots.
Extended Data Fig. 3 |. Liquid-like properties of PUM droplets in vitro.

a, Predicted disordered regions of PUM1 and PUM2, scored by PONDR VSL2. HD, homology domain. b, Schematic (top) and coomassie stain (bottom) of purified MBP-SNAP-PUM-His proteins used for in vitro experiments. For gel source data, see Supplementary Figure 1. c, PUM liquid droplet formation at 5 μM upon TEV-mediated cleavage of the solubilizing MBP tag. Proteins were fluorescently labeled with SNAP488 and visualized by DIC or fluorescence microscopy. Scale bar, 10 μm. d, PUM1 liquid droplet formation at 5 μM in the presence or absence of 10% PEG3350 after 1 hour incubation. e, Confocal images (left) and quantification (right) of PUM1 droplet FRAP (5 μM PUM1). Fluorescence intensities plotted relative to pre-bleach time point (t = −5 s). Data shown as mean ± SD (n = 3 droplets). f, Time-lapse confocal images showing fusion of PUM1 droplets (5 μM PUM1). g, DIC and fluorescence microscopy images of Cy3-labeled NORAD RNA (2.7 nM, red) after addition to preformed PUM1 or PUM2 droplets (5 μM, green). h, Fluorescence microscopy images of PUM1 droplets (5 μM, green) formed in the presence or absence of NORAD or PREmut RNA (2.7 nM, red). PREmut contains UGU to ACA mutations in all 18 NORAD PREs, which abolish PUM binding5. i, Images and analysis of PUM1-NORAD droplet FRAP. Droplets were formed with Cy3-labeled NORAD RNA (2 nM) and SNAP488-labeled PUM1 (5 μM). Data shown as mean ± SD (n = 3 droplets).
Extended Data Fig. 4 |. _NORAD_-induced PUM phase separation at physiologic concentrations in vitro.

a, Representative 3D-reconstructed confocal image of a PUM1-stained _NORAD_−/− HCT116 cell used to estimate cytoplasmic volume. The length (l), width (w), and depth (d) of the entire cell and its nucleus were measured and used to calculate the total cellular and nuclear volumes using the ellipsoid volume formula. Cytoplasmic volume for each cell was determined by subtracting nuclear volume from total volume. b, Box-and-whisker plot of measured cytoplasmic volumes (n = 20 cells). Mean cytoplasmic volume shown on the right. Boxes extend from 25th to 75th percentiles; middle line represents median; whiskers extend from minima to maxima. c, Schematic of wild-type and mutant NORAD transcripts. Location of repeated NORAD domains (ND1-ND5) indicated with gray boxes and mammalian sequence conservation shown in green (UCSC Genome Browser hg38 PhastCons track). Location of PREs indicated with red and yellow arrowheads. PREmut transcript contains 18 UGU to ACA mutations in PREs (gray arrowheads). ND4 represents the most conserved segment of NORAD and contains 4 PREs. Figure modified from Elguindy et al.5. d, DIC and fluorescence microscopy images of PUM1 (150 nM, green) droplets in the presence or absence of NORAD (2 nM) or PEG3350.
Extended Data Fig. 5 |. PUM target transcripts do not induce PUM1 droplet formation in vitro at physiologic concentrations.
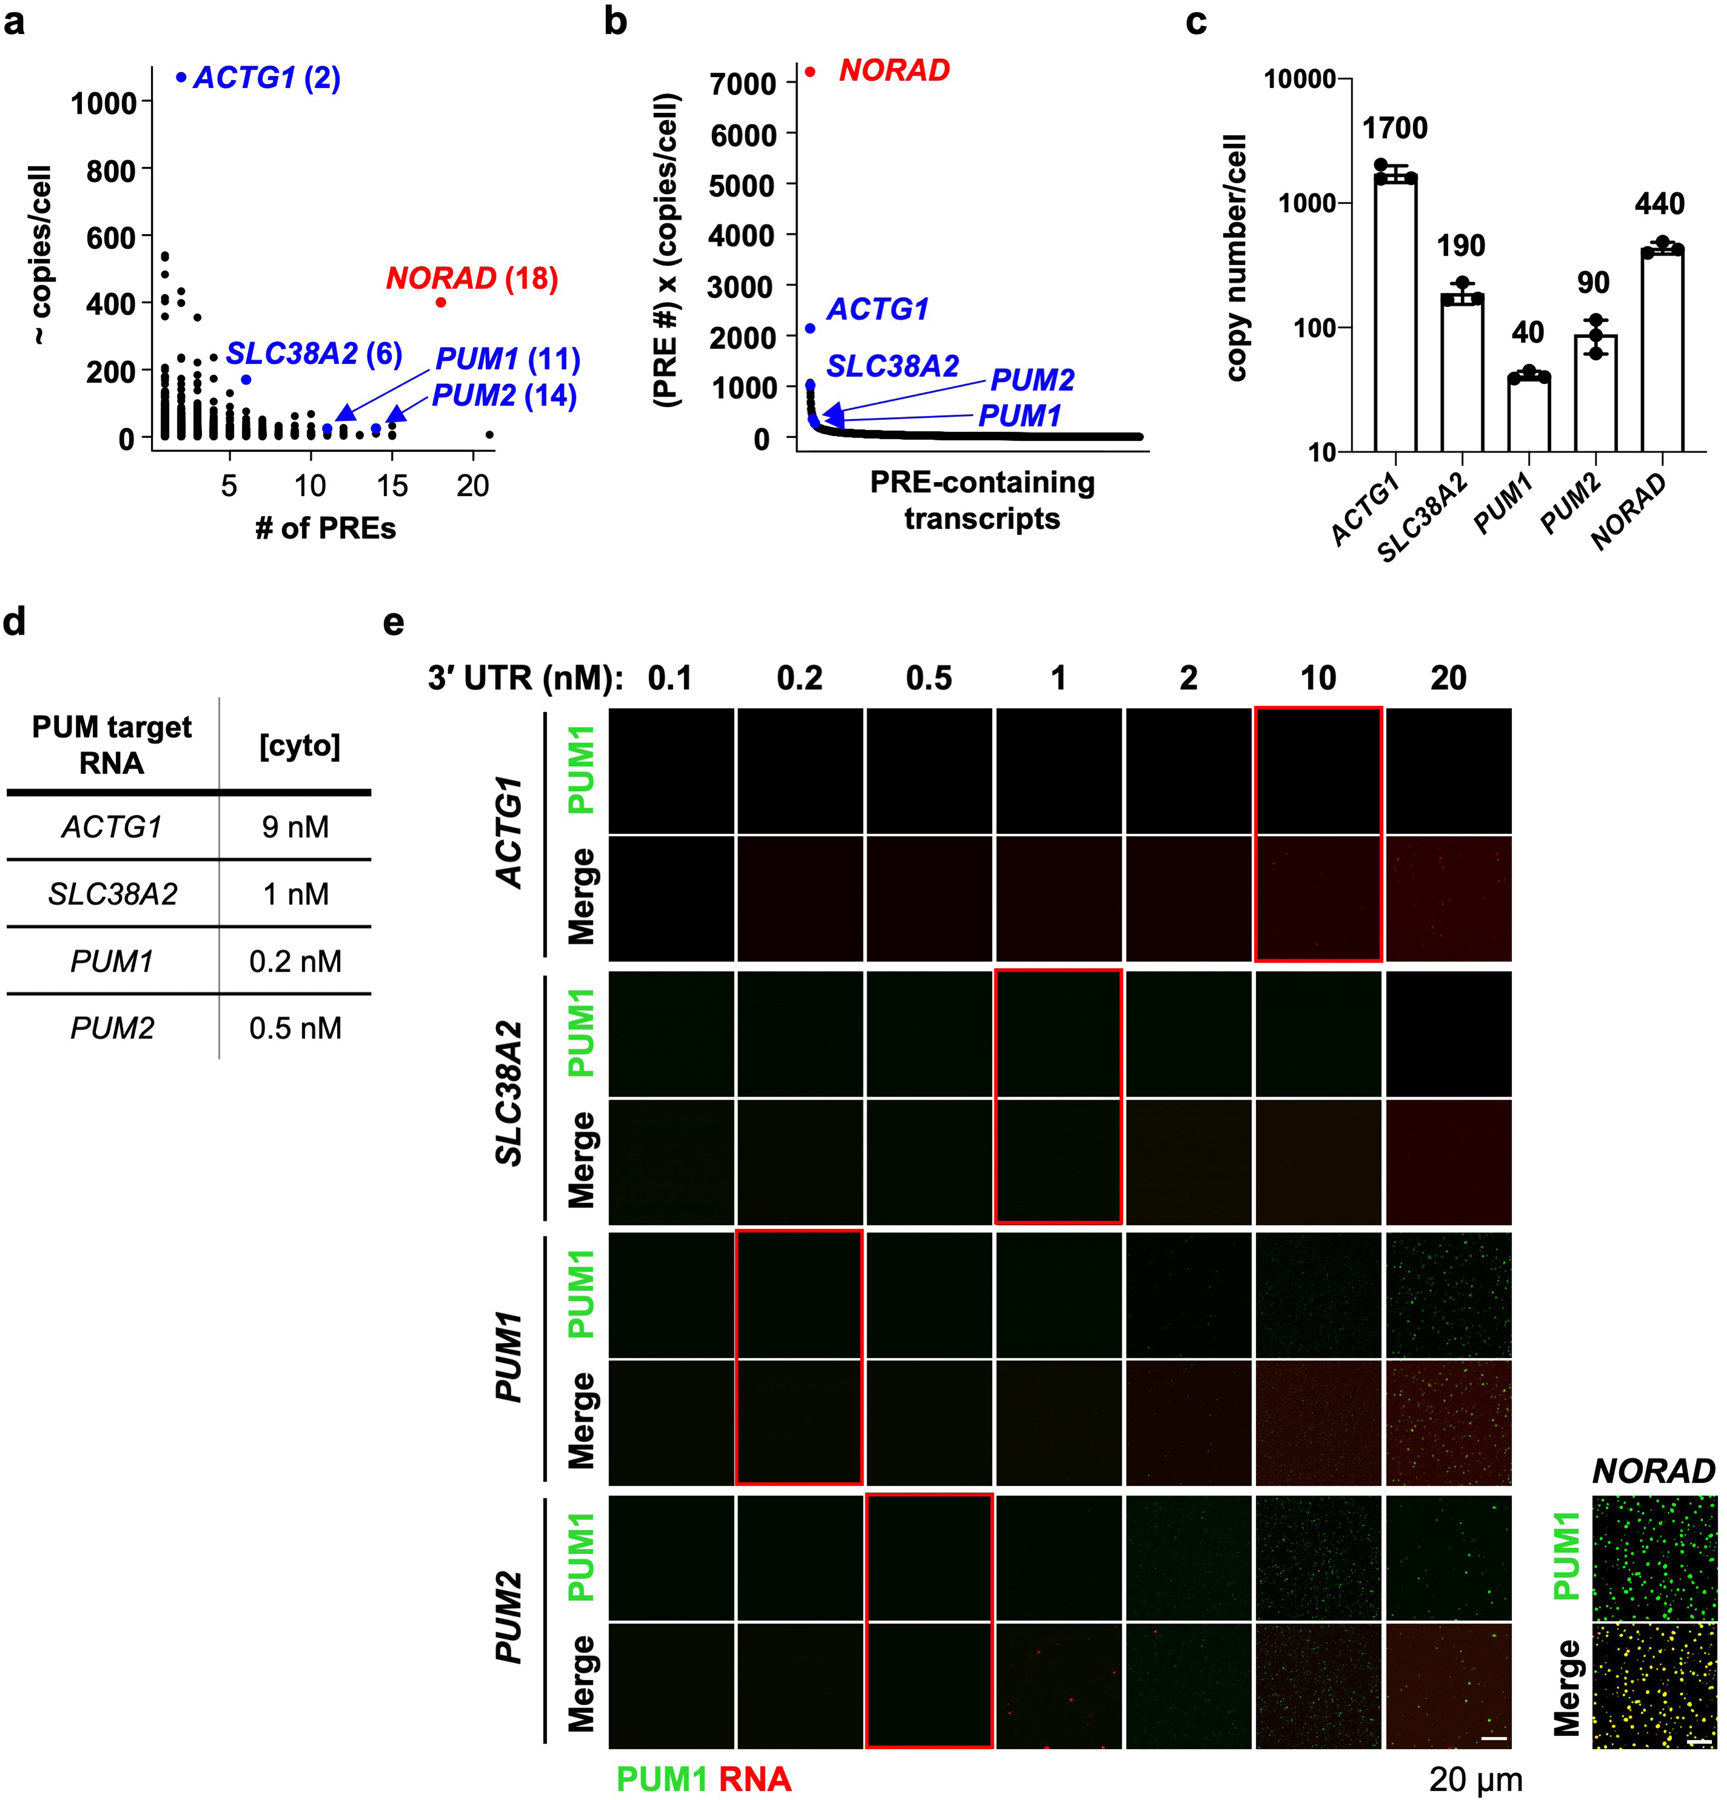
a, Dot plot of PRE-containing mRNA copy numbers in HCT116 cells (estimated by RNA-seq; see Methods) versus the number of PREs in their 3´ UTRs. Transcripts selected for in vitro assays labeled in blue with the number of PREs in their 3´ UTRs in parentheses. Note that the selected mRNAs were also identified as PUM CLIP targets that were downregulated upon PUM overexpression7,39. b, Plot of transcript PRE number multiplied by estimated copy number, highlighting the unique combination of NORAD abundance and PRE valency compared to other PRE-containing RNAs. c, qRT-PCR validation of copy numbers of the indicated transcripts in HCT116 cells. Mean copy number is shown above each bar. Data shown as mean ± SD. n = 3 biological replicates. d, Approximate cytoplasmic concentration of each PUM target transcript in HCT116 cells. e, Confocal images of PUM1 droplets, formed with 150 nM PUM1 plus 2 nM NORAD or increasing concentrations of the indicated in vitro transcribed 3´ UTR of each PUM target. Red boxes highlight assays performed at the estimated physiologic concentration of each transcript in HCT116 cells. The same PUM1 protein preparation was used for droplet formation assays with NORAD and 3´ UTRs.
Extended Data Fig. 6 |. PUM target mRNAs weakly co-localize with PUM1 foci.
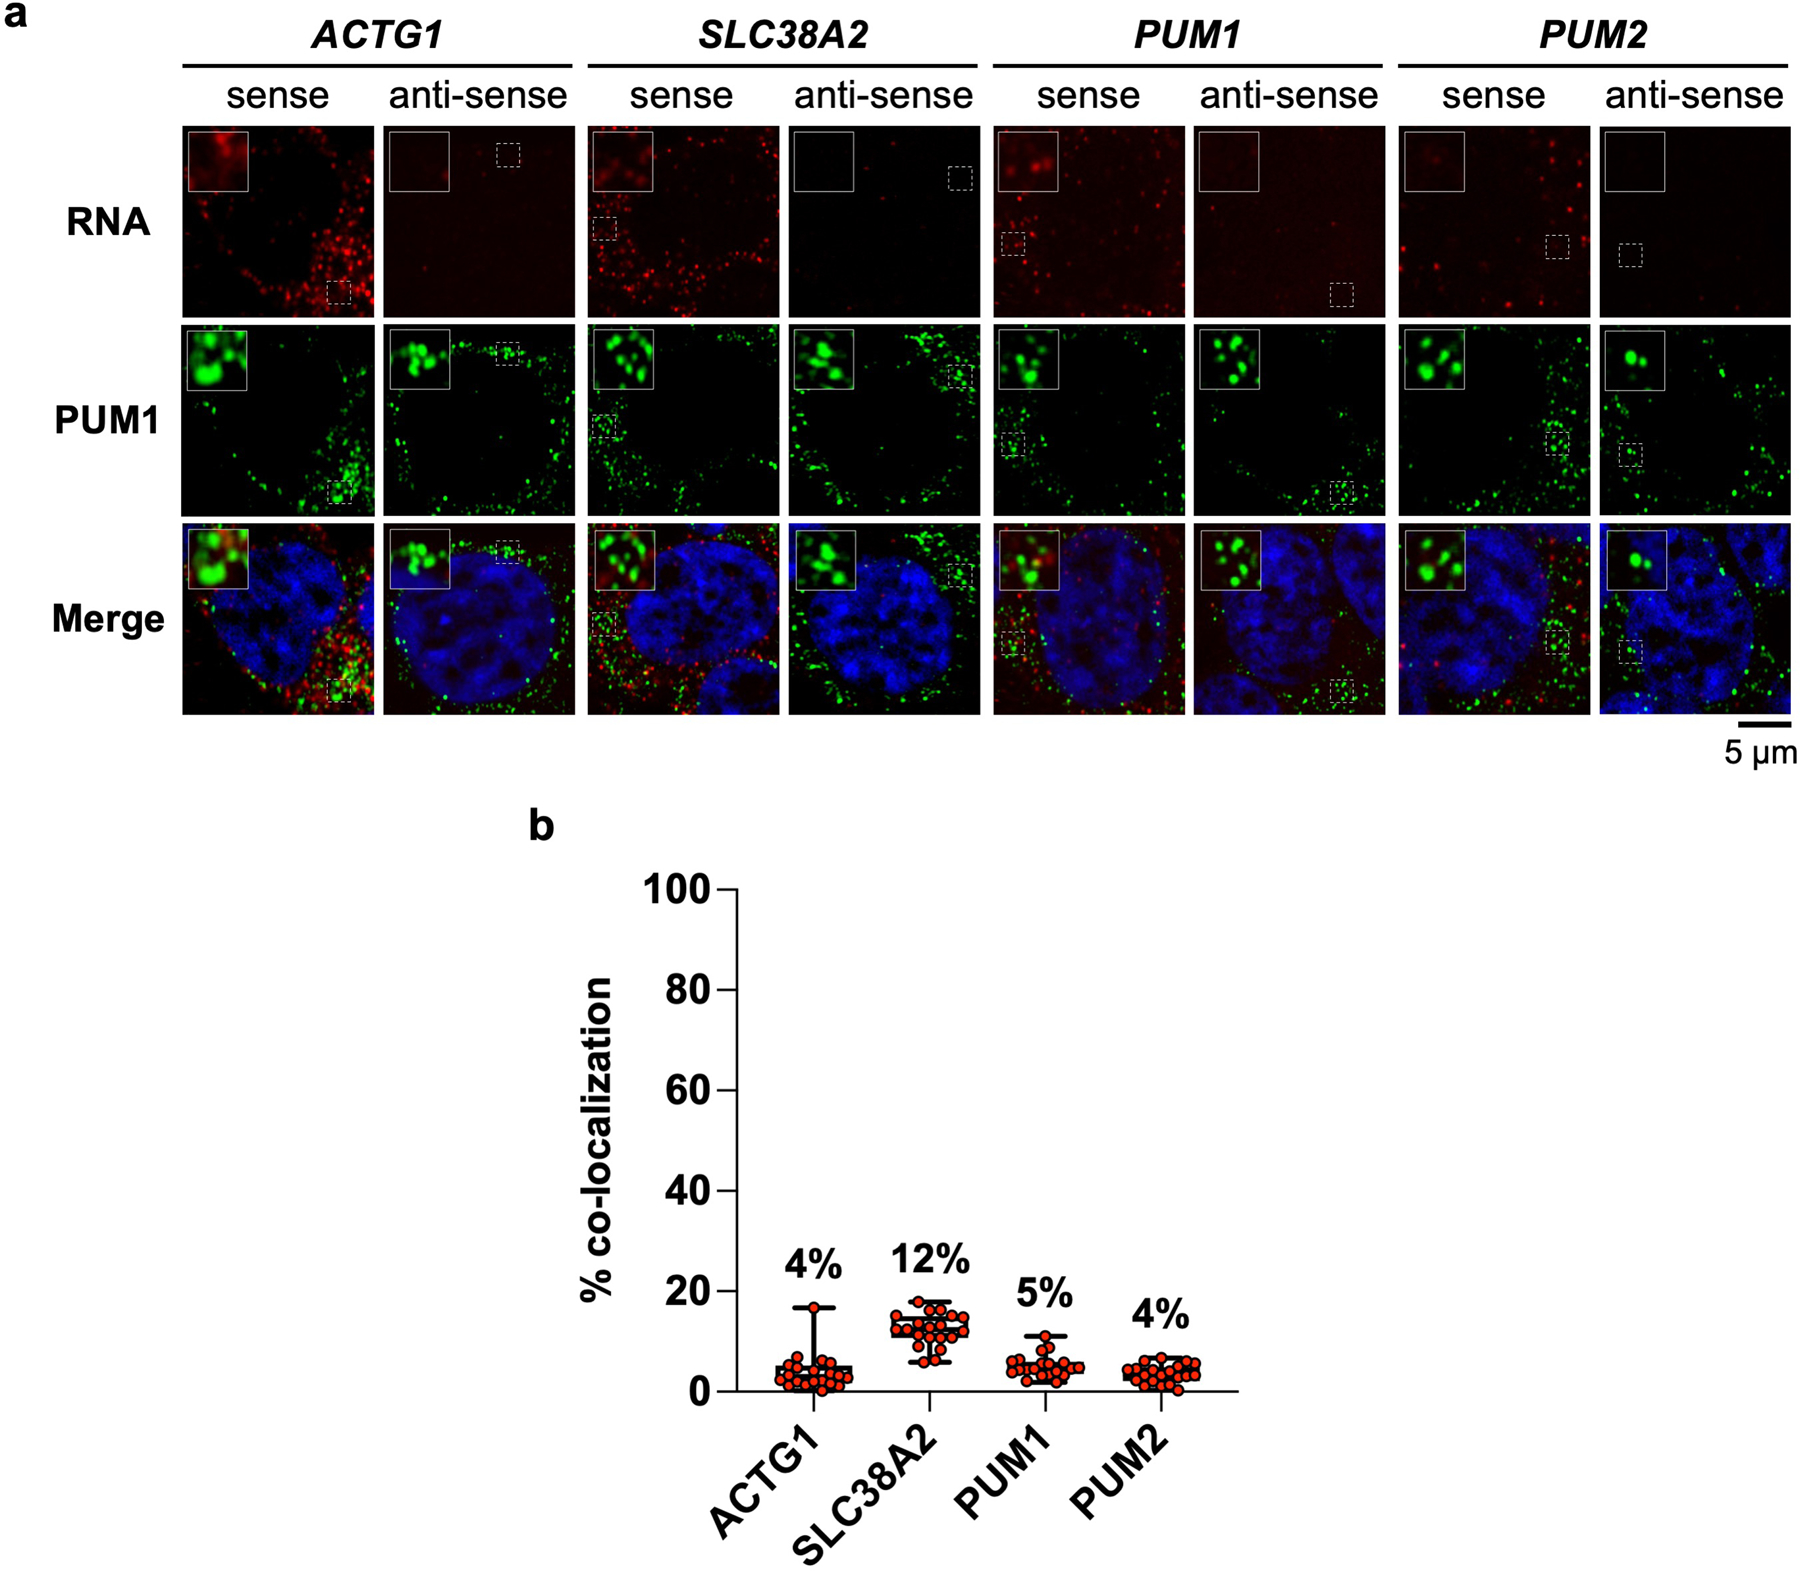
a, Confocal images of HCT116 cells co-stained for the indicated RNA and PUM1 by RNA FISH and immunofluorescence, respectively**. b**, Quantification of the indicated PUM target mRNA and PUM1 co-localization (n = 20 cells for each RNA). Mean co-localization shown above box plots. Boxes extend from 25th to 75th percentiles; middle line represents median. Whiskers extend from minimum to maximum co-localization for each target mRNA.
Extended Data Fig. 7 |. Competitive, super-stoichiometric recruitment of PUM into RNA-induced droplets.
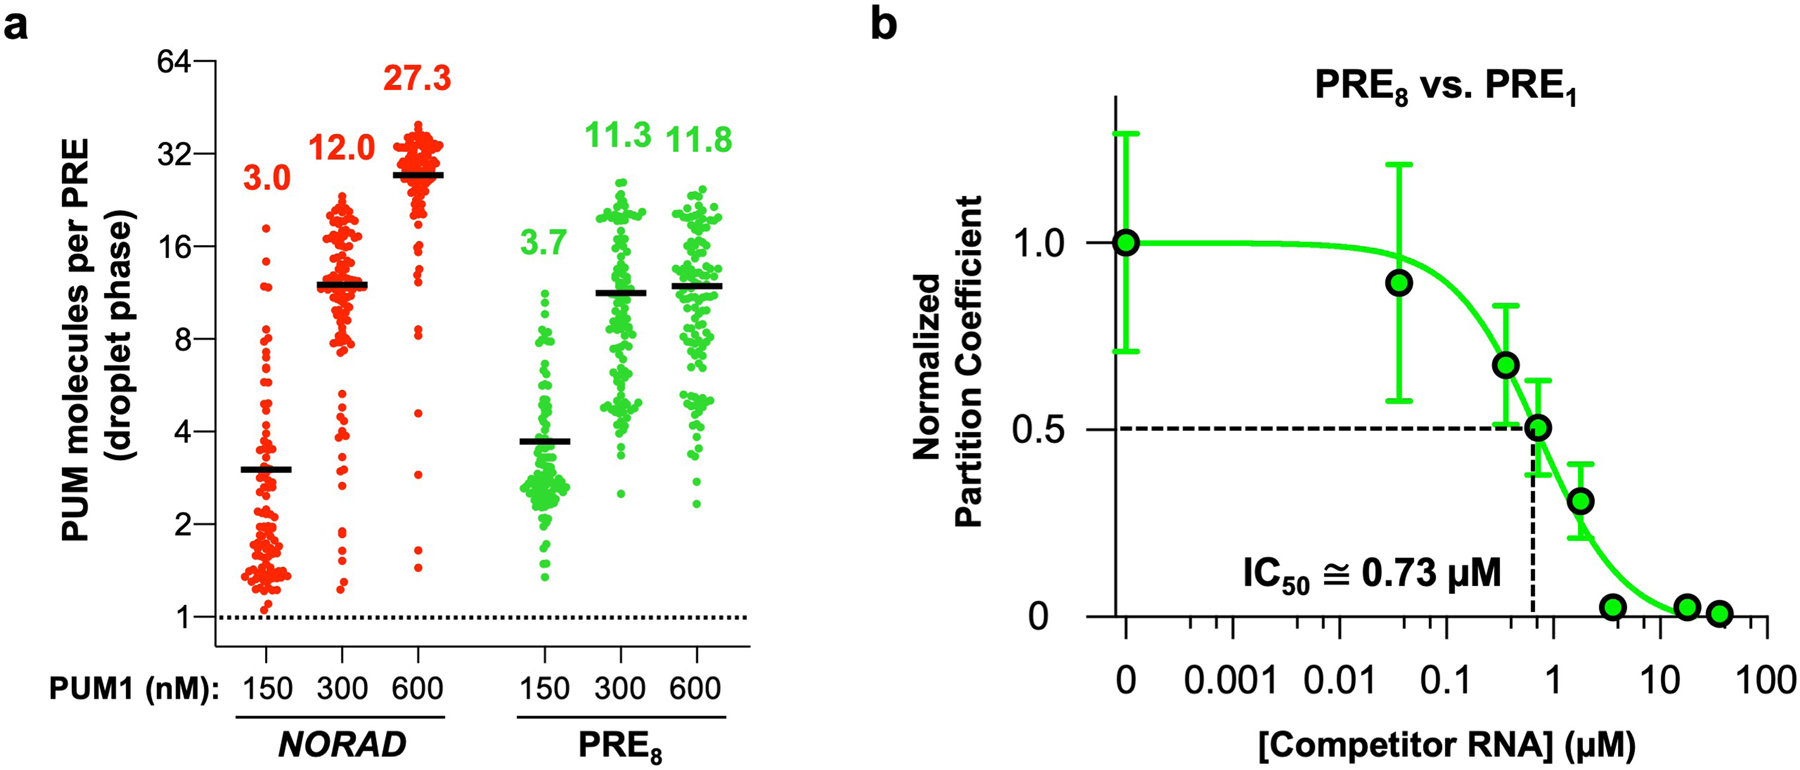
a, Quantification of the number of PUM1 molecules per PRE in droplets nucleated by NORAD (2 nM) or PRE8 oligonucleotide (10 nM) and the indicated concentration of PUM1 in vitro. Black line represents the mean (n = 101, 115, 113, 107, 114, or 115 droplets for each condition from left to right). b, Quantification of PUM1 partition coefficients formed with 150 nM PUM1 and 10 nM PRE8 RNA normalized to partition coefficient at 0 μM competitor RNA (PRE1 RNA). IC50 represents concentration of PRE1 RNA needed to reduce PUM1 partitioning by 50%. Data shown as mean ± SD. n = 44 or more droplets analyzed for each data point. Each PRE in the PRE8 RNA is ~9 times more efficient at PUM1 recruitment than a monovalent PRE.
Extended Data Fig. 8 |. Purification and characterization of PUM1HDmut and IDR-deletion proteins.
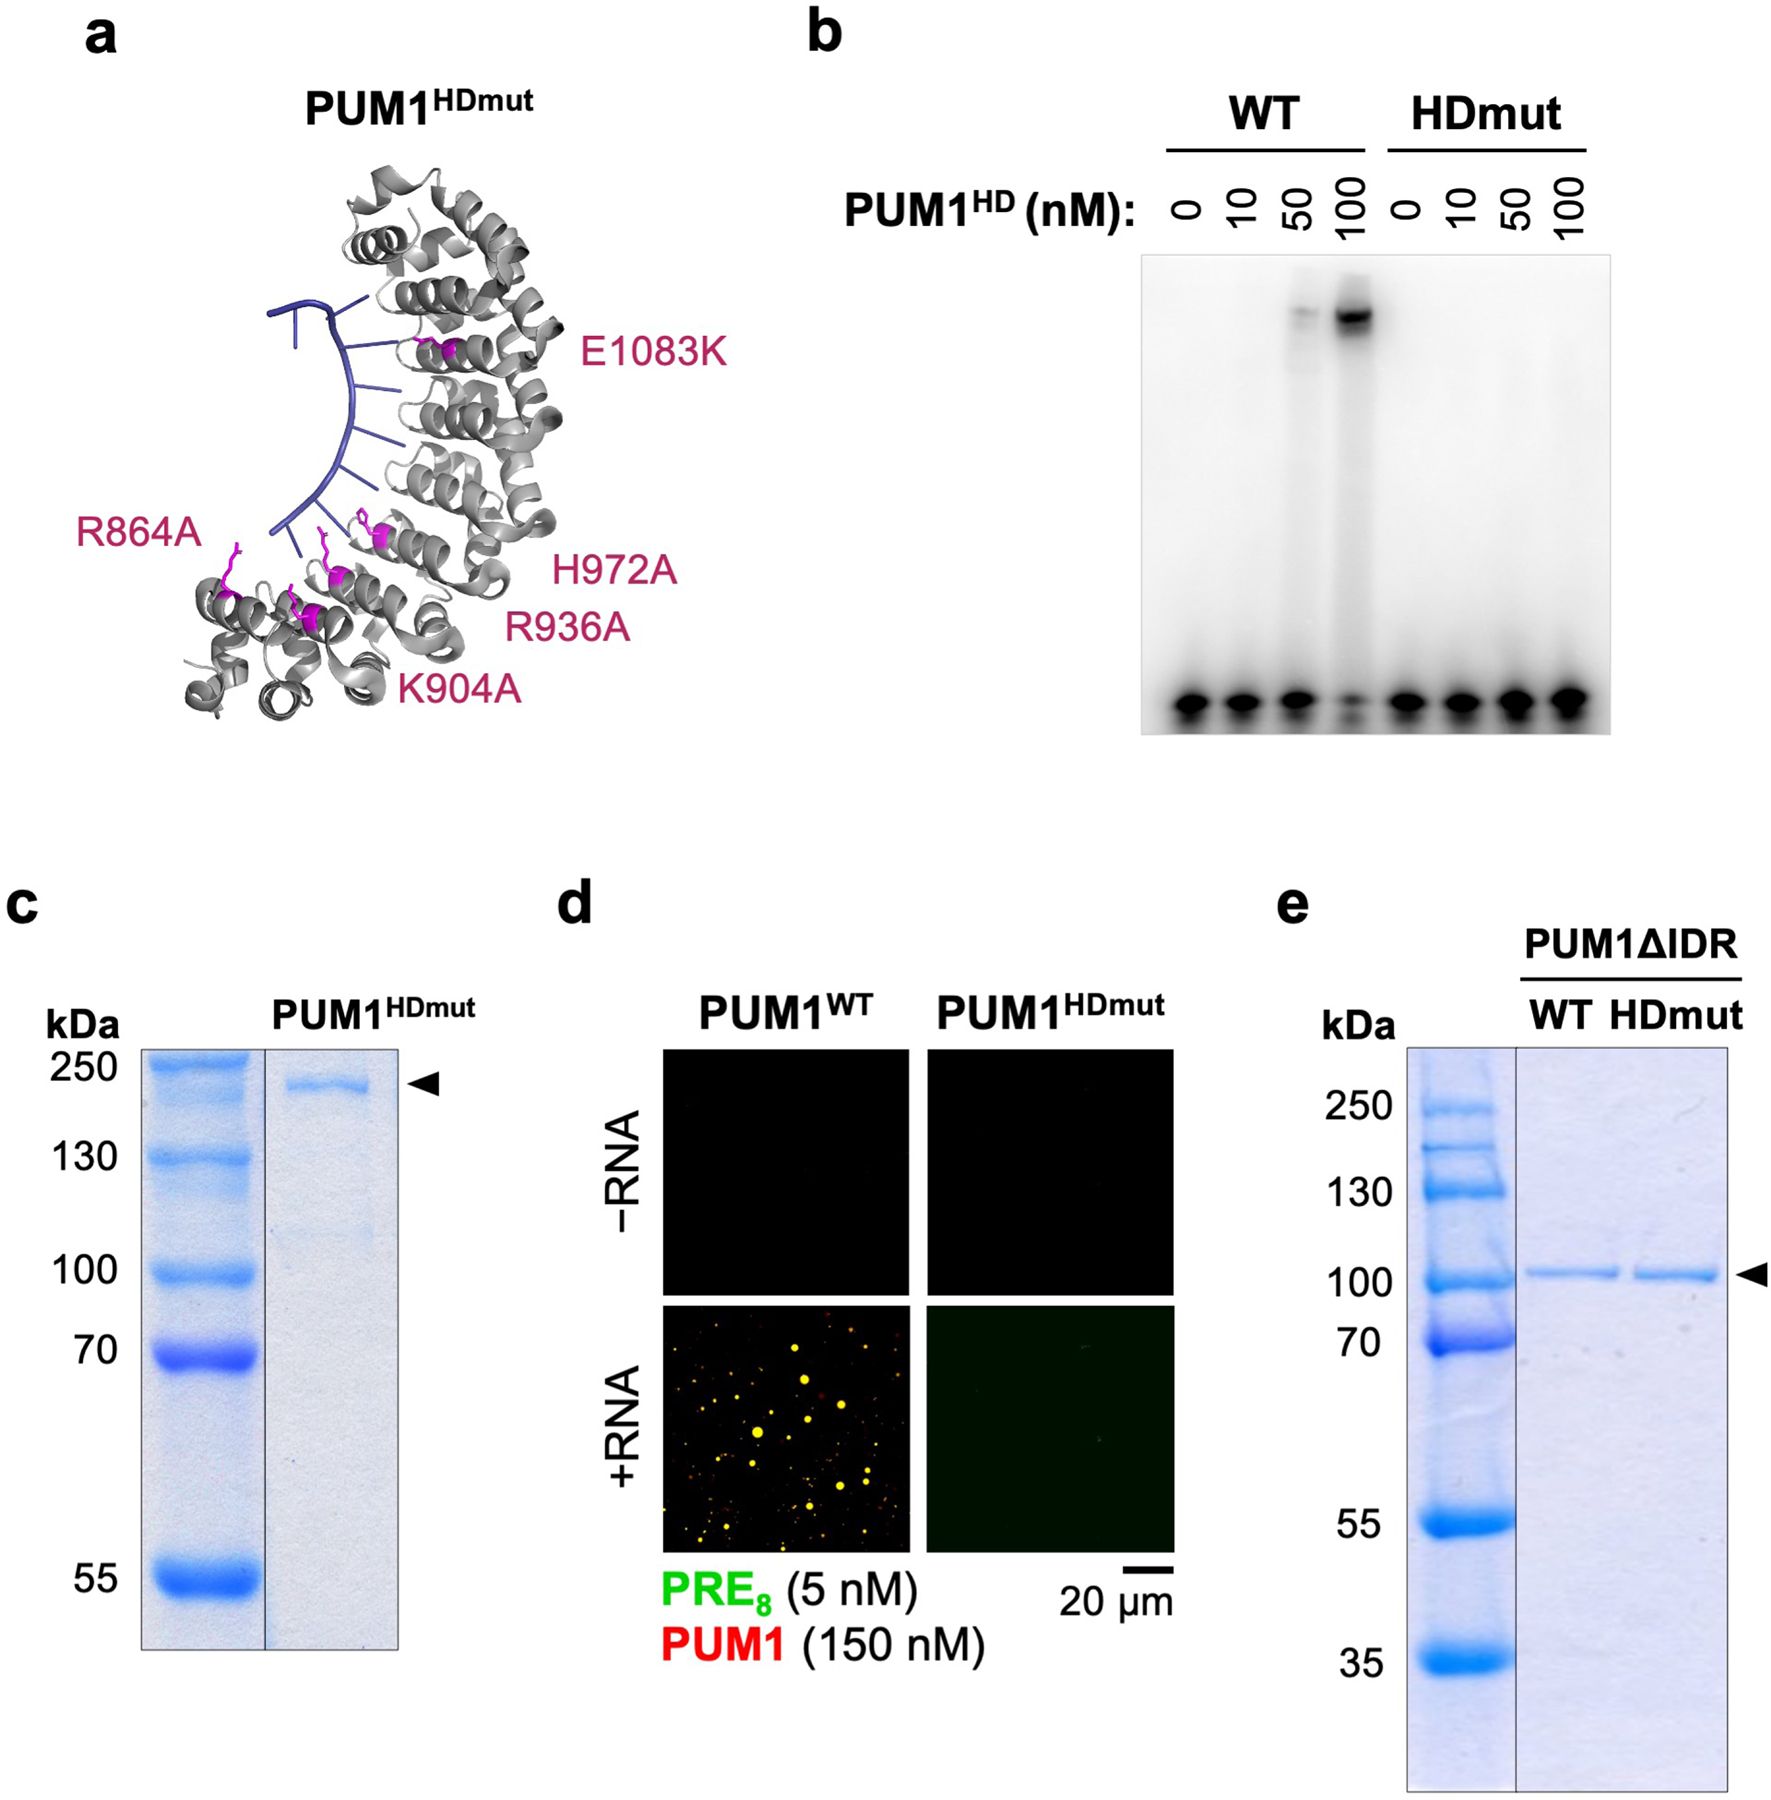
a, Structure of the human PUM1-HD domain (PDB: 1M8X) in complex with PRE-RNA, showing mutated residues in PUM1HDmut (pink). b, Electrophoretic mobility shift assay (EMSA) demonstrating loss of PUM1HDmut RNA binding. c, Coomassie stain of purified MBP-SNAP-PUM1HDmut-His protein used for in vitro experiments. d, Droplet formation by the indicated PUM proteins in the presence or absence of PRE8 RNA oligonucleotide. e, Coomassie stain of purified MBP-SNAP-PUM1HD-WTΔIDR-His and MBP-SNAP-PUM1HDmutΔIDR-His proteins used for in vitro experiments. Gels were cropped to remove irrelevant lanes where indicated with vertical lines. For gel source data, see Supplementary Figure 1.
Extended Data Fig. 9 |. Recruitment of PUM proteins into pre-formed _NORAD_-PUM condensates independently of RNA binding.
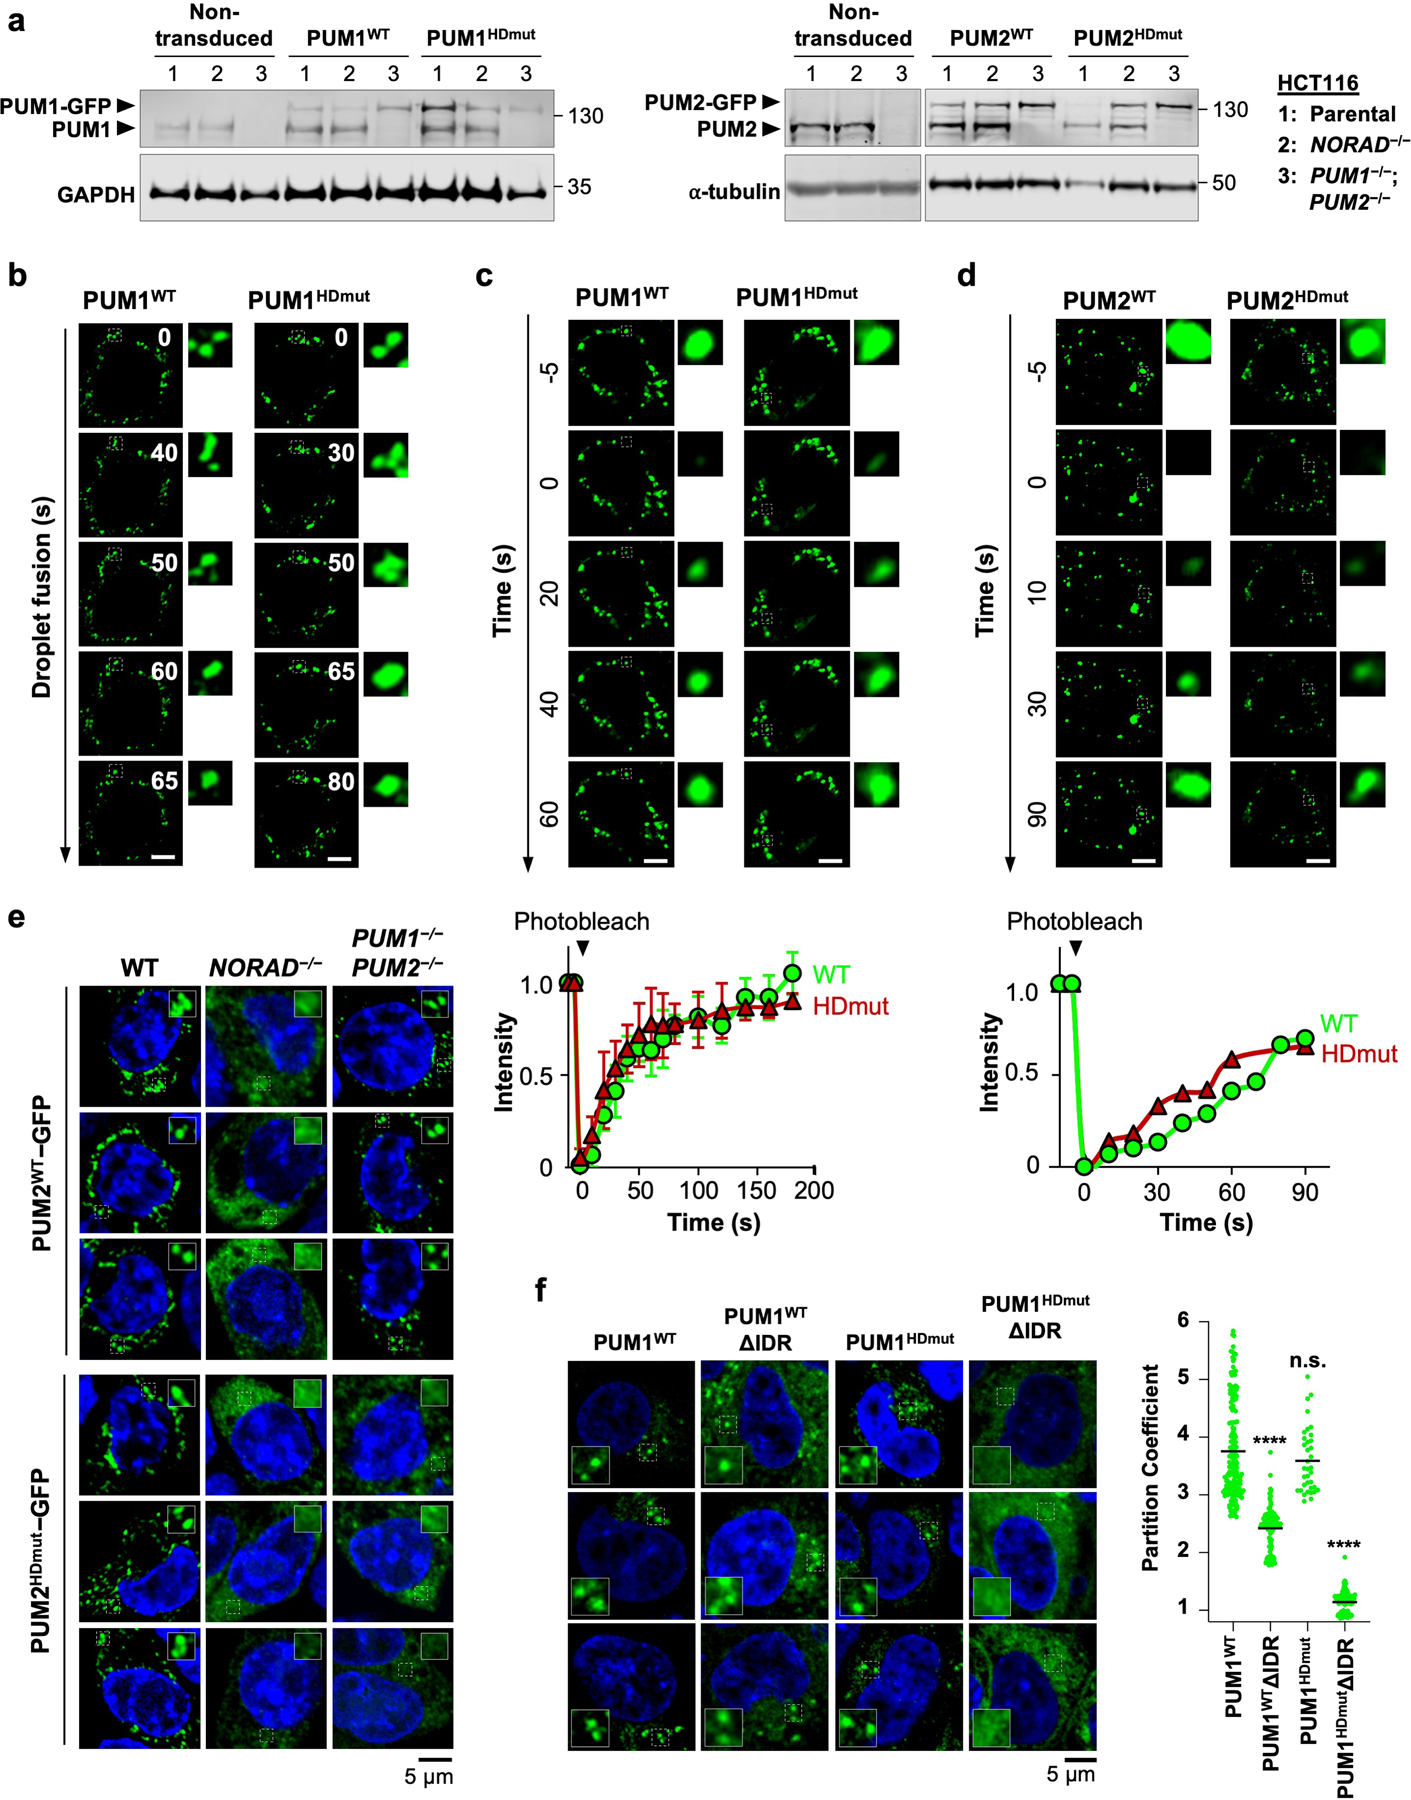
a, Western blot analysis of PUM1 (left) or PUM2 (right) in HCT116 cells of the indicated genotypes transduced with PUMWT-GFP or PUMHDmut-GFP expressing lentiviruses. Molecular weight in kDa shown on right of blots. For gel source data, see Supplementary Figure 1. b, Time-lapse live-cell confocal images showing fusion of PUM1WT-GFP or PUM1HDmut-GFP condensates in wild-type HCT116 cells. Scale bar, 5 μm. c, d, (Top) Images of PUM1WT-GFP and PUM1HDmut-GFP FRAP (c) or PUM2WT-GFP and PUM2HDmut-GFP FRAP (d) in wild-type HCT116 cells. Puncta undergoing photobleaching shown in dashed boxes. (Bottom) FRAP quantification with fluorescence intensities plotted relative to pre-bleach time point (t = −5 s). Data shown as mean ± SD (panel c; n = 3 puncta) or mean (panel d; n = 2 puncta). Scale bar, 5 μm. e, Confocal images of PUM2WT-GFP (top) and PUM2HDmut-GFP (bottom) in HCT116 cells of the indicated genotypes. f, (Left) Confocal images of GFP-tagged full-length or IDR-deleted PUM1WT or PUM1HDmut expressed in wild-type HCT116 cells. (Right) Quantification of PUM1 partition coefficients, defined as the intensity of PUM1-GFP inside condensates relative to the surrounding cytoplasm. Partition coefficients were calculated for n = 175, 116, 36, or 121 condensates from 5 different cells for each protein from left to right. Black bar depicts the mean partition coefficient. P values calculated using two-tailed t-test comparing each PUM1 mutant to PUM1WT. ****, p < 1 × 10⁻¹⁵; n.s., not significant.
Extended Data Fig. 10 |. NORAD expression and PUM localization in circPRE-expressing cell lines.
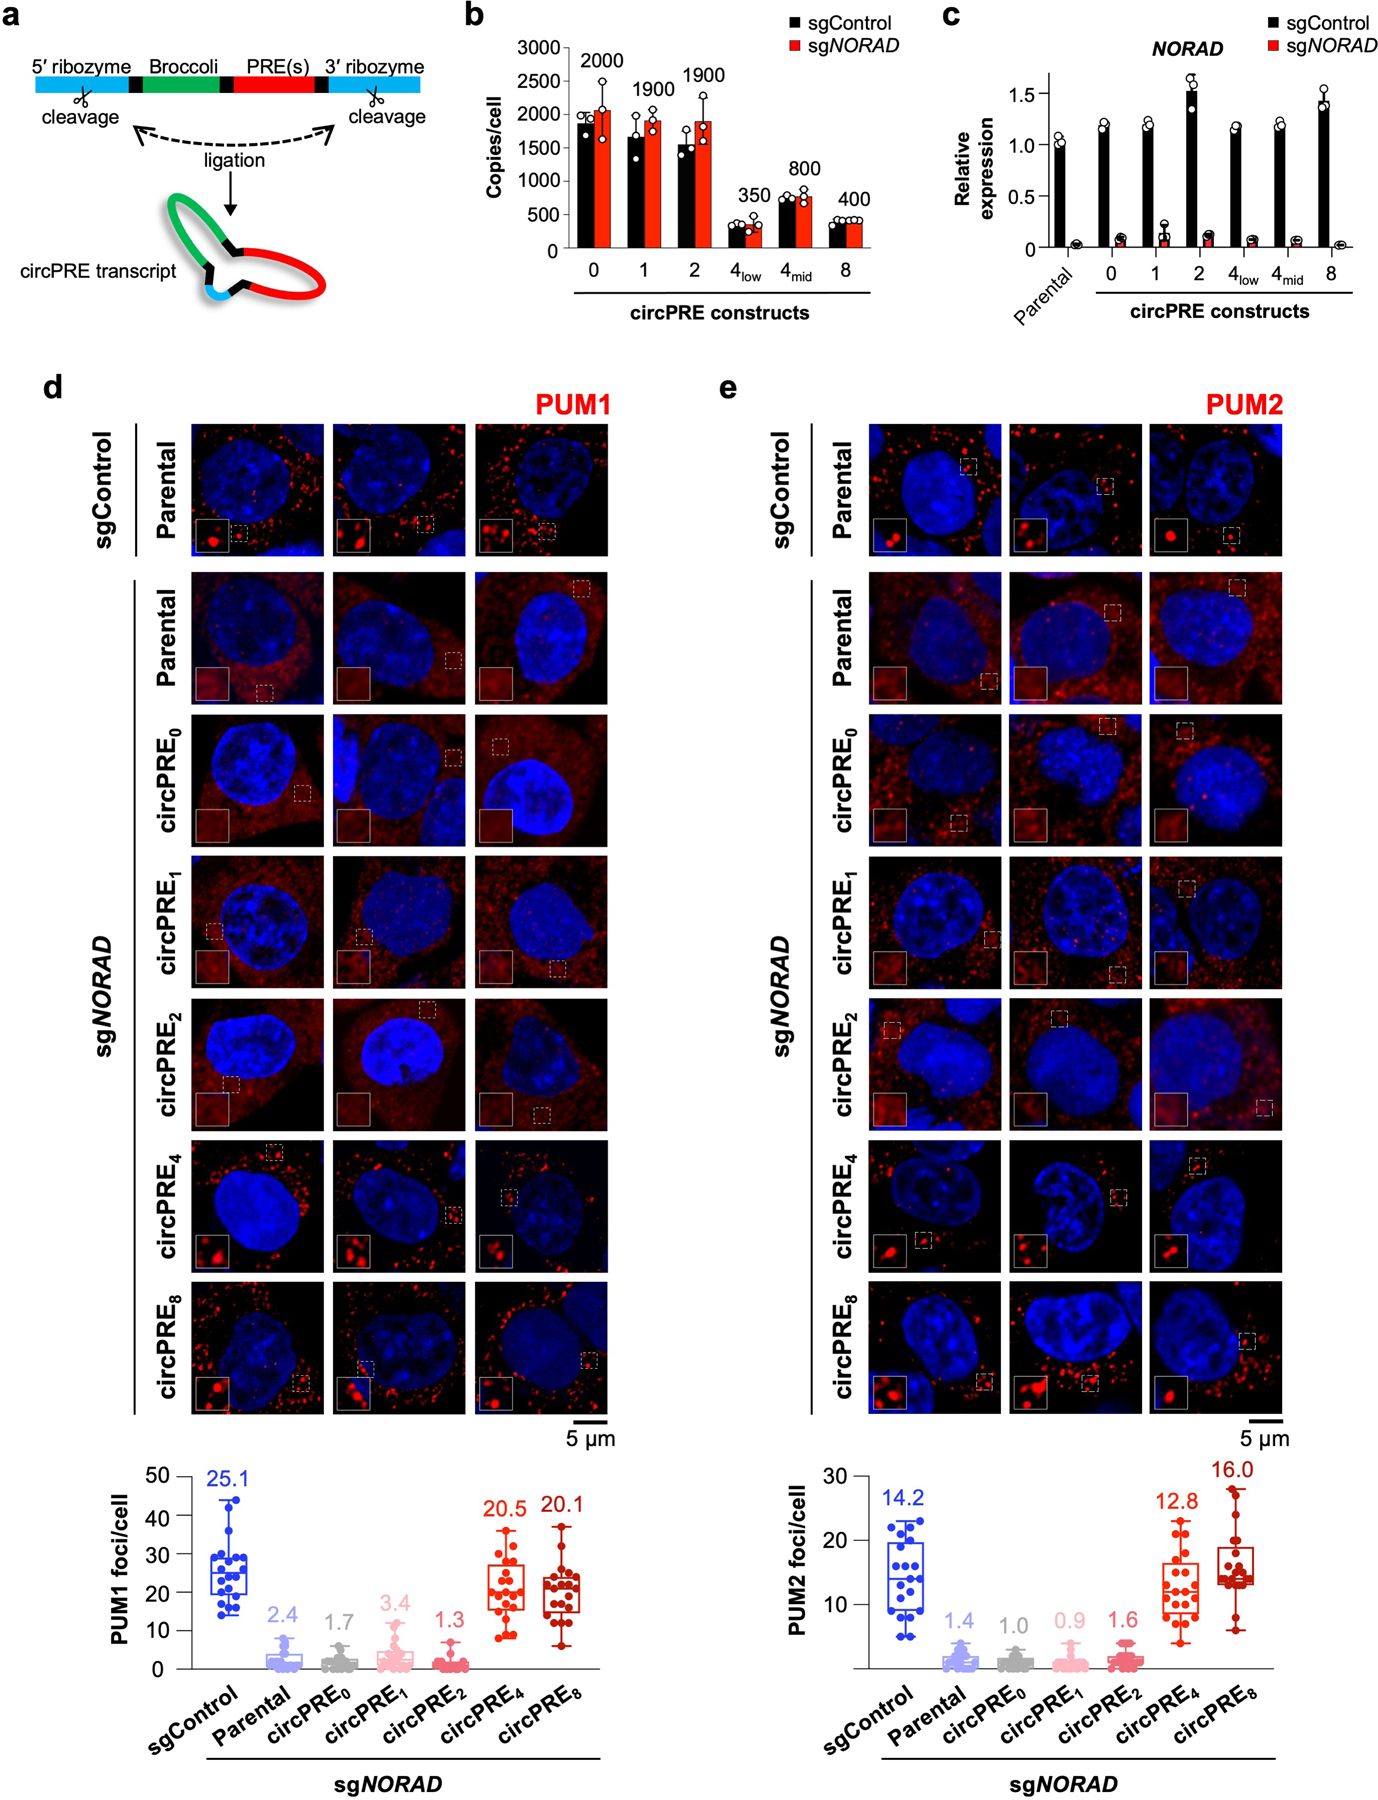
a, Schematic of circPRE-producing constructs21, which encode the Broccoli aptamer and 0–8 PREs. b, Copy number analysis of circPRE-transcripts in HCT116 CRISPRi cells expressing control or NORAD_-targeting sgRNAs. Mean copy number in sg_NORAD cell lines is shown above each bar. circPRE4-low and circPRE4-mid represent distinct cell populations sorted for different circPRE copy numbers. Data shown as mean ± SD. n = 3 biological replicates. c, qRT-PCR analysis of NORAD expression in the indicated circPRE HCT116 CRISPRi cell lines expressing control or _NORAD_-targeting sgRNAs. Data shown as mean ± SD. n = 3 technical replicates. d, e, (Top) Confocal images of PUM1 (d) or PUM2 (e) immunofluorescence in the indicated cell lines. (Bottom) Quantification of the number of PUM1 (d) or PUM2 (e) foci per cell in the indicated sgControl or sg_NORAD_-infected cell lines. (n = 20 cells for each cell line). Mean number of foci shown above each box plot. Boxes extend from 25th to 75th percentiles; middle line represents median; whiskers extend from minima to maxima.
Supplementary Material
1709047_Supp_Tab
1709047_Supp_fig
1709047_SD_Fig1
1709047_SD_Fig2
1709047_SD_Fig3
1709047_SD_Fig4
1709047_SD_ED_1
1709047_SD_ED_2
1709047_SD_ED_3
1709047_SD_ED_4
1709047_SD_ED_5
1709047_SD_ED_6
1709047_SD_ED_7
1709047_SD_ED_9
1709047_SD_ED_10
Acknowledgments:
We thank Michael Rosen, Didier Trono, Stanley Qi, Jonathan Weissman, Feng Zhang, Xiaojun Lian, and Samie Jaffrey for plasmids; He Zhang for bioinformatics support; Shinichi Nakagawa for technical assistance with RNA FISH; Michael Rosen, William Peeples, Jaeil Han, and Benjamin Sabari for helpful discussions; Klaudia Jancynzka for experimental assistance; Angela Mobley and UTSW Flow Cytometry Core for assistance with FACS; and Kathryn O’Donnell, Yasmin Meleis, and members of the Mendell laboratory for helpful comments on the manuscript. This work was supported by grants from NIH (R35CA197311 to J.T.M.; P30CA142543 to J.T.M.; and P50CA196516 to J.T.M.) and the Welch Foundation (I-1961-20180324 to J.T.M.). J.T.M. is an Investigator of the Howard Hughes Medical Institute.
Footnotes
Competing interests: The authors declare no competing interests.
Supplementary Information is available for this paper.
References:
- 1.Banani SF, Lee HO, Hyman AA & Rosen MK Biomolecular condensates: organizers of cellular biochemistry. Nat Rev Mol Cell Biol 18, 285–298, doi: 10.1038/nrm.2017.7 (2017). [DOI] [PMC free article] [PubMed] [Google Scholar]
- 2.Hyman AA, Weber CA & Julicher F Liquid-liquid phase separation in biology. Annu Rev Cell Dev Biol 30, 39–58, doi: 10.1146/annurev-cellbio-100913-013325 (2014). [DOI] [PubMed] [Google Scholar]
- 3.Corbet GA & Parker R RNP Granule Formation: Lessons from P-Bodies and Stress Granules. Cold Spring Harb Symp Quant Biol, doi: 10.1101/sqb.2019.84.040329 (2020). [DOI] [PubMed] [Google Scholar]
- 4.Roden C & Gladfelter AS RNA contributions to the form and function of biomolecular condensates. Nat Rev Mol Cell Biol, doi: 10.1038/s41580-020-0264-6 (2020). [DOI] [PMC free article] [PubMed] [Google Scholar]
- 5.Elguindy MM et al. PUMILIO, but not RBMX, binding is required for regulation of genomic stability by noncoding RNA NORAD. Elife 8, doi: 10.7554/eLife.48625 (2019). [DOI] [PMC free article] [PubMed] [Google Scholar]
- 6.Kopp F et al. PUMILIO hyperactivity drives premature aging of Norad-deficient mice. Elife 8, doi: 10.7554/eLife.42650 (2019). [DOI] [PMC free article] [PubMed] [Google Scholar]
- 7.Lee S et al. Noncoding RNA NORAD Regulates Genomic Stability by Sequestering PUMILIO Proteins. Cell 164, 69–80, doi: 10.1016/j.cell.2015.12.017 (2016). [DOI] [PMC free article] [PubMed] [Google Scholar]
- 8.Tichon A et al. A conserved abundant cytoplasmic long noncoding RNA modulates repression by Pumilio proteins in human cells. Nat Commun 7, 12209, doi: 10.1038/ncomms12209 (2016). [DOI] [PMC free article] [PubMed] [Google Scholar]
- 9.Pandya-Jones A et al. A protein assembly mediates Xist localization and gene silencing. Nature 587, 145–151, doi: 10.1038/s41586-020-2703-0 (2020). [DOI] [PMC free article] [PubMed] [Google Scholar]
- 10.Hacisuleyman E, Shukla CJ, Weiner CL & Rinn JL Function and evolution of local repeats in the Firre locus. Nat Commun 7, 11021, doi: 10.1038/ncomms11021 (2016). [DOI] [PMC free article] [PubMed] [Google Scholar]
- 11.Yamazaki T et al. Functional Domains of NEAT1 Architectural lncRNA Induce Paraspeckle Assembly through Phase Separation. Mol Cell 70, 1038–1053 e1037, doi: 10.1016/j.molcel.2018.05.019 (2018). [DOI] [PubMed] [Google Scholar]
- 12.Lin Y, Protter DS, Rosen MK & Parker R Formation and Maturation of Phase-Separated Liquid Droplets by RNA-Binding Proteins. Mol Cell 60, 208–219, doi: 10.1016/j.molcel.2015.08.018 (2015). [DOI] [PMC free article] [PubMed] [Google Scholar]
- 13.Quinn JJ & Chang HY Unique features of long non-coding RNA biogenesis and function. Nat Rev Genet 17, 47–62, doi: 10.1038/nrg.2015.10 (2016). [DOI] [PubMed] [Google Scholar]
- 14.Kopp F & Mendell JT Functional Classification and Experimental Dissection of Long Noncoding RNAs. Cell 172, 393–407, doi: 10.1016/j.cell.2018.01.011 (2018). [DOI] [PMC free article] [PubMed] [Google Scholar]
- 15.Yao RW, Wang Y & Chen LL Cellular functions of long noncoding RNAs. Nat Cell Biol 21, 542–551, doi: 10.1038/s41556-019-0311-8 (2019). [DOI] [PubMed] [Google Scholar]
- 16.Goldstrohm AC, Hall TMT & McKenney KM Post-transcriptional Regulatory Functions of Mammalian Pumilio Proteins. Trends Genet 34, 972–990, doi: 10.1016/j.tig.2018.09.006 (2018). [DOI] [PMC free article] [PubMed] [Google Scholar]
- 17.Khong A et al. The Stress Granule Transcriptome Reveals Principles of mRNA Accumulation in Stress Granules. Mol Cell 68, 808–820 e805, doi: 10.1016/j.molcel.2017.10.015 (2017). [DOI] [PMC free article] [PubMed] [Google Scholar]
- 18.Namkoong S, Ho A, Woo YM, Kwak H & Lee JH Systematic Characterization of Stress-Induced RNA Granulation. Mol Cell 70, 175–187 e178, doi: 10.1016/j.molcel.2018.02.025 (2018). [DOI] [PMC free article] [PubMed] [Google Scholar]
- 19.Zhang H et al. RNA Controls PolyQ Protein Phase Transitions. Mol Cell 60, 220–230, doi: 10.1016/j.molcel.2015.09.017 (2015). [DOI] [PMC free article] [PubMed] [Google Scholar]
- 20.Edwards TA, Pyle SE, Wharton RP & Aggarwal AK Structure of Pumilio reveals similarity between RNA and peptide binding motifs. Cell 105, 281–289, doi: 10.1016/s0092-8674(01)00318-x (2001). [DOI] [PubMed] [Google Scholar]
- 21.Litke JL & Jaffrey SR Highly efficient expression of circular RNA aptamers in cells using autocatalytic transcripts. Nat Biotechnol 37, 667–675, doi: 10.1038/s41587-019-0090-6 (2019). [DOI] [PMC free article] [PubMed] [Google Scholar]
- 22.Gennarino VA et al. A Mild PUM1 Mutation Is Associated with Adult-Onset Ataxia, whereas Haploinsufficiency Causes Developmental Delay and Seizures. Cell 172, 924–936 e911, doi: 10.1016/j.cell.2018.02.006 (2018). [DOI] [PMC free article] [PubMed] [Google Scholar]
- 23.Gennarino VA et al. Pumilio1 haploinsufficiency leads to SCA1-like neurodegeneration by increasing wild-type Ataxin1 levels. Cell 160, 1087–1098, doi: 10.1016/j.cell.2015.02.012 (2015). [DOI] [PMC free article] [PubMed] [Google Scholar]
- 24.D’Amico D et al. The RNA-Binding Protein PUM2 Impairs Mitochondrial Dynamics and Mitophagy During Aging. Mol Cell 73, 775–787 e710, doi: 10.1016/j.molcel.2018.11.034 (2019). [DOI] [PMC free article] [PubMed] [Google Scholar]
- 25.Klosin A et al. Phase separation provides a mechanism to reduce noise in cells. Science 367, 464–468, doi: 10.1126/science.aav6691 (2020). [DOI] [PubMed] [Google Scholar]
- 26.Islam S et al. Characterization of the single-cell transcriptional landscape by highly multiplex RNA-seq. Genome Res 21, 1160–1167, doi: 10.1101/gr.110882.110 (2011). [DOI] [PMC free article] [PubMed] [Google Scholar]
- 27.Marinov GK et al. From single-cell to cell-pool transcriptomes: stochasticity in gene expression and RNA splicing. Genome Res 24, 496–510, doi: 10.1101/gr.161034.113 (2014). [DOI] [PMC free article] [PubMed] [Google Scholar]
- 28.Shapiro E, Biezuner T & Linnarsson S Single-cell sequencing-based technologies will revolutionize whole-organism science. Nat Rev Genet 14, 618–630, doi: 10.1038/nrg3542 (2013). [DOI] [PubMed] [Google Scholar]
- 29.Golden RJ et al. An Argonaute phosphorylation cycle promotes microRNA-mediated silencing. Nature 542, 197–202, doi: 10.1038/nature21025 (2017). [DOI] [PMC free article] [PubMed] [Google Scholar]
- 30.Randolph LN, Bao X, Zhou C & Lian X An all-in-one, Tet-On 3G inducible PiggyBac system for human pluripotent stem cells and derivatives. Sci Rep 7, 1549, doi: 10.1038/s41598-017-01684-6 (2017). [DOI] [PMC free article] [PubMed] [Google Scholar]
- 31.Mito M, Kawaguchi T, Hirose T & Nakagawa S Simultaneous multicolor detection of RNA and proteins using super-resolution microscopy. Methods 98, 158–165, doi: 10.1016/j.ymeth.2015.11.007 (2016). [DOI] [PubMed] [Google Scholar]
- 32.Bolte S & Cordelieres FP A guided tour into subcellular colocalization analysis in light microscopy. J Microsc 224, 213–232, doi: 10.1111/j.1365-2818.2006.01706.x (2006). [DOI] [PubMed] [Google Scholar]
- 33.Costes SV et al. Automatic and quantitative measurement of protein-protein colocalization in live cells. Biophys J 86, 3993–4003, doi: 10.1529/biophysj.103.038422 (2004). [DOI] [PMC free article] [PubMed] [Google Scholar]
- 34.Wheeler JR, Matheny T, Jain S, Abrisch R & Parker R Distinct stages in stress granule assembly and disassembly. Elife 5, doi: 10.7554/eLife.18413 (2016). [DOI] [PMC free article] [PubMed] [Google Scholar]
- 35.Frankish A et al. GENCODE reference annotation for the human and mouse genomes. Nucleic Acids Res 47, D766–D773, doi: 10.1093/nar/gky955 (2019). [DOI] [PMC free article] [PubMed] [Google Scholar]
- 36.Dobin A et al. STAR: ultrafast universal RNA-seq aligner. Bioinformatics 29, 15–21, doi: 10.1093/bioinformatics/bts635 (2013). [DOI] [PMC free article] [PubMed] [Google Scholar]
- 37.Liao Y, Smyth GK & Shi W featureCounts: an efficient general purpose program for assigning sequence reads to genomic features. Bioinformatics 30, 923–930, doi: 10.1093/bioinformatics/btt656 (2014). [DOI] [PubMed] [Google Scholar]
- 38.McCarthy DJ, Chen Y & Smyth GK Differential expression analysis of multifactor RNA-Seq experiments with respect to biological variation. Nucleic Acids Res 40, 4288–4297, doi: 10.1093/nar/gks042 (2012). [DOI] [PMC free article] [PubMed] [Google Scholar]
- 39.Hafner M et al. Transcriptome-wide identification of RNA-binding protein and microRNA target sites by PAR-CLIP. Cell 141, 129–141, doi: 10.1016/j.cell.2010.03.009 (2010). [DOI] [PMC free article] [PubMed] [Google Scholar]
Associated Data
This section collects any data citations, data availability statements, or supplementary materials included in this article.
Supplementary Materials
1709047_Supp_Tab
1709047_Supp_fig
1709047_SD_Fig1
1709047_SD_Fig2
1709047_SD_Fig3
1709047_SD_Fig4
1709047_SD_ED_1
1709047_SD_ED_2
1709047_SD_ED_3
1709047_SD_ED_4
1709047_SD_ED_5
1709047_SD_ED_6
1709047_SD_ED_7
1709047_SD_ED_9
1709047_SD_ED_10