Impaired Immune Responses and B-Cell Proliferation in Mice Lacking the Id3 Gene (original) (raw)
Abstract
B-lymphocyte activation and proliferation induced by the B-cell receptor (BCR) signals are important steps in the initiation of humoral immune responses. How the BCR signals are translated by nuclear transcription factors into cell cycle progression is poorly understood. Id3 is an immediate-early gene responding to growth and mitogenic signals in many cell types including B cells. The primary function of the Id3 protein has been defined as that of inhibitor of basic-helix-loop-helix (bHLH) transcription factors. The interaction between Id3 and bHLH proteins, many of which are essential for cellular differentiation, has been proposed as a key regulatory event leading to cellular proliferation instead of differentiation. To further investigate the role of Id3 in tissue and embryo development and the mechanism of Id3-mediated growth regulation, we generated and analyzed _Id3_-deficient mice. While these mice display no overt abnormality in tissue and embryo development, their humoral immunity is compromised. The amounts of immunoglobulins produced in _Id3_-deficient mice immunized with a T-cell-dependent antigen and a type 2 T-cell-independent antigen are attenuated and severely impaired, respectively. Further analysis of lymphocytes isolated from _Id3_-deficient mice reveals a B-cell defect in their proliferation response to BCR cross-linking but not to lipopolysaccharide or a combination of BCR cross-linking and interleukin-4. Analyses of cultured lymphocytes also suggest involvement of Id3 in cytokine production in T cells and isotype switching in B cells. Finally, the proliferation defect in _Id3_-deficient B cells can be rescued by ectopic expression of Id1, a homologue of Id3. Taken together, these results define a necessary and specific role for Id3 in mediating signals from BCR to cell cycle progression during humoral immune responses.
The basic-helix-loop-helix (bHLH) family proteins play pivotal roles in cell growth and differentiation (31). Most of the bHLH proteins can bind to DNA via the basic region located N-terminal to the HLH domain. Dimerization between two bHLH proteins, which is a prerequisite for DNA binding, is mediated by their HLH domains (45, 46, 63). Most bHLH proteins have been classified into three groups: the E-proteins, the tissue-specific bHLH proteins, and the dominant negative Id proteins. The E proteins, including E12/E47 (E2A gene products), E2-2, and HEB, are characterized by their non-tissue-specific expression patterns and their ability to form homodimers and heterodimers with members of the other two groups. Most bHLH proteins, such as members of the MyoD family in muscle cells (20), MASH-1 in neuronal cells (33), and LYL-1 in lymphopoietic cells (39), are tissue specific. These tissue-specific bHLH proteins preferentially form heterodimers with E proteins and control specific differentiation events in the resident cell types (31, 64).
The Id proteins are characterized by lacking the basic DNA-binding domain while retaining the HLH dimerization domain (6). Id proteins preferentially dimerize with the E proteins and consequently prevent the heterodimers from binding to DNA and activating transcription of target genes (32). A role for Id proteins in cell differentiation and development is best demonstrated by the Drosophila Extramacrochaetae (emc) protein (21, 26), which negatively regulates sensory-organ development, presumably by antagonizing the activity of bHLH proteins encoded by the achaete-scute genes (21). Mammals have four Id genes, namely, Id1 (6), Id2 (7, 60), Id3 (11, 18), and Id4 (48). All four Id genes are broadly but non-uniformly expressed (48). In general, the expression level of Id genes is high in proliferating cells and low in differentiating cells and quiescent cells. Intensive studies in the past have led to the notion that Id proteins act as differentiation inhibitors by directly antagonizing the function of bHLH proteins (1, 19, 32, 40, 55, 60).
The Id3 gene, also known as HLH462 and HLHIR21, was cloned from mouse fibroblasts (and independently from human B cells) based on its immediate-early response to mitogenic signals (11, 17, 44). Like other Id genes, Id3 expression is high in proliferating cells, down regulated in cells undergoing differentiation, and low in quiescent cells (1, 17, 40, 42). A potential role for Id3 in tumorogenesis has been raised by the observed chromosomal translocations at the Id3 locus (termed Heir-1) in human neuroblastoma (22, 65). The function of Id3 proteins as differentiation inhibitors was proposed and supported by the studies of ectopic expression of Id3 in various cell types including myoblast and preadipocyte (1, 40, 42). Id3 was also shown to promote NK-cell differentiation at the expense of T-lineage cells in a fetal thymus organ culture test (30). Recent evidence shows that phosphorylation of Id3 and Id2 by cyclin-dependent kinase 2 (CDK-2) affects their abilities to inhibit the formation of different bHLH complexes (18, 28). Therefore, the differentiation-inhibitory activity of Id3 may be regulated at both the transcriptional and posttranslational levels.
Compelling evidence indicates that B-cell development is tightly regulated by E proteins and Id proteins. Forced expression of E47, a product of E2A, can initiate the immunoglobulin (Ig) heavy-chain rearrangement in a pre-T-cell line (52) and several nonlymphoid cell lines (32). In contrast, ectopic expression of Id1 represses the activity of Ig heavy-chain enhancer through antagonizing the DNA-binding activity of E2A proteins (66). These results were later confirmed by the studies of E2A-deficient mice and Id1 transgenic mice, both of which display severe defects in pro-B-cell development (3, 59, 72). It has been proposed that E47, in collaborating with E12, supports the B-lineage commitment and subsequent differentiation events (2, 70) while Id proteins may negatively regulate these processes through antagonizing the E proteins. However, how and when each individual Id gene is involved in B-cell development is not clear.
E2A and Id proteins have also been implicated in B-cell maturation. E2A proteins were detected in all stages of B-cell development (67). Immunostaining also revealed an upregulation of E2A in the dark zone of the germinal center, where hypermutation and isotype switching occur (27, 49). Ectopic expression of Id1 in a mature B-cell line inhibited the ability of cells to undergo spontaneous isotype switching, suggesting a functional interaction between Id and E2A proteins (27). However, a role for Id1 or Id2 in mature B cells is questioned by their reduced levels of expression in mature B cells (60, 66). A recent study on _Id1_-deficient mice showed a normal B-cell development in the absence of Id1 (68). Because Id3 is expressed throughout B-cell development except the plasma cell stage (41), an investigation of Id3 may help to understand how bHLH proteins control B-cell differentiation and maturation.
We report here the generation and analysis of _Id3_-deficient (_Id3_−/−) mice. _Id3_−/− mice displayed no obvious developmental abnormalities and contained a normal number of B and T lymphocytes. However, these mice had reduced levels of IgG1 and IgG2a in serum prior to immunization, a severely impaired immune response to DNP-Ficoll (a type 2 T-independent antigen, TI-2), and an attenuated ability to switch to IgG2a and IgG3 isotypes when challenged with keyhole limpet hemocyanin (KLH) coupled to DNP (a T-dependent antigen [TD]). B cells isolated from _Id3_−/− mice further showed a proliferation defect in response to surface IgM engagement but not to stimulation with lipopolysaccharide (LPS), CD38, CD40, IgM plus interleukin-4 (IL-4), and phorbol myristate acetate (PMA) plus ionomycin. This proliferation defect can be rescued by introduction of an Id1 transgene into the B-lymphoid lineage. These studies reveal a specific role for Id3 in B-cell proliferation and humoral immunity and indicate the existence and importance of other bHLH proteins in B-cell immunity.
MATERIALS AND METHODS
Targeting vector.
The Id3 gene was isolated after probing a 129/SV genomic library with a mouse Id3 cDNA. The _Pst_I-_Xho_I fragment covering the first two exons and part of the third exon was replaced by a PGKneo expression cassette. The PGKtk gene was placed at the 5′ end of the targeting vector to provide a selection against nonhomologous recombination.
ES cell culture and generation of mutant mice.
Linearized targeting construct (25 μg) was electroporated into AK7 embryonic stem (ES) cells (a gift from A. Imamoto and P. Soriano, Fred Hutchinson Cancer Research Center, Seattle, Wash.). The cells were grown under double selection with G418 and ganciclovir. Correct targeting events were found in 8 of 60 clones screened by PCR. Id3+/− ES cells were injected into C57BL/6 blastocysts, which were then transferred into pseudopregnant mothers. Germ line transmission was obtained from one of three clones injected. Mice carrying the mutant Id3 allele were intercrossed, and all immune system assays were performed with 6 to 12-week-old mice derived from the 129/SV-C57BL/6 mixed background.
Southern and Northern blot analysis.
Southern blot analysis was performed by separating genomic DNA on a 1% agarose gel after _Sac_I restriction enzyme digestion. Blotting and hybridization were performed with a Nytran membrane (Schleicher & Schuell, Keene, N.H.) under the conditions recommended by the manufacturer. The Southern probe was a 0.7-kb _Xho_I-_Hin_dIII fragment isolated from the Id3 gene (see Fig. 1A). Northern blot analysis was performed by separating RNA on 1.2% agarose gels in the presence of formaldehyde followed by blotting to a Nytran membrane. RNA was isolated from splenocytes by an RNAzol (Tel-Test Inc., Friendswood, Tex.) extraction as specified by the manufacturer. Erythrocytes were depleted from the splenocyte preparation by ammonium chloride (0.017 M Tris · HCl [pH 7.65], 0.16M NH4Cl) treatment prior to RNA extraction. Id3, Id2, and glyceraldehyde-3-phosphate dehydrogenase (GAPDH) mouse cDNAs were used as probes in hybridization under the conditions recommended by the manufacturer (Schleicher & Schuell). Radiation signals were detected with a STORM 840 PhosphorImager (Molecular Dynamics, Sunnyvale, Calif.) and analyzed with the ImageQuant program provided by the manufacturer.
FIG. 1.
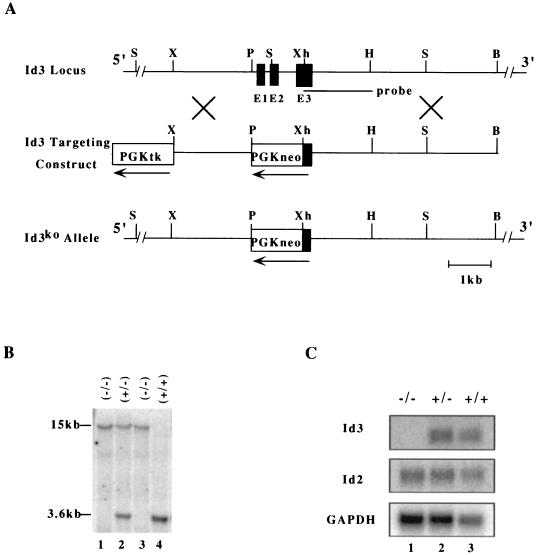
(A) Diagrams of the mouse Id3 genomic locus (top), the gene-targeting construct (middle), and the Id3 knockout allele (bottom). Exons and selection markers are indicated by solid and open boxes, respectively. The probe used for Southern analysis is shown. Restriction enzymes and selection markers are abbreviated as follows: B, _Bam_HI; H, _Hin_dIII; P, _Pst_I; S, _Sac_I; X, _Xba_I; Xh, _Xho_I; PGK, phosphoglycerate kinase gene promoter; tk, thymidine kinase gene; neo, neomycin resistance gene. (B) Southern blot analysis of genomic DNA from Id3+/+, Id3+/−, and _Id3_−/− mice. DNA was digested with _Sac_I and hybridized with the probe shown in panel A. The sizes of _Sac_I fragments for wild-type and mutant alleles are 3.6 and 15 kb, respectively. (C) Northern blot analysis of RNA isolated from Id3+/+, Id3+/−, and _Id3_−/− mouse splenocytes. Probes used in hybridization are indicated on the left, with GAPDH as a loading control.
Flow cytometry analysis.
Single-cell suspensions of lymphocytes from the thymus, spleen, bone marrow, peripheral lymph nodes, and peritoneal cavity were prepared in ice-cold phosphate-buffered saline supplemented with 5% bovine calf serum. Splenocytes were depleted of erythrocytes by ammonium chloride lysis before use. All the suspensions were counted with a hemocytometer, and 106 cells were stained immediately with a combination of a fluorescein isothiocyanate (FITC)-conjugated antibody, a phycoerythrin (PE)-conjugated antibody, and 7-amino-actinomycin D (7AAD) (Molecular Probes, Eugene, Oreg.). The cells were washed once with phosphate-buffered saline–bovine calf serum and analyzed on a FACScan flow cytometer (Becton Dickinson, San Jose, Calif.). Data from 104 cells were collected and analyzed with the CellQuest program (Becton Dickinson, San Jose, Calif.). Antibodies used in this study included biotinylated or FITC-conjugated anti-B220 (RA3-6B2; Caltag, Burlingame, Calif.), FITC-conjugated anti-CD43 (S7; PharMingen, San Diego, Calif.), biotinylated or FITC-conjugated goat anti-mouse IgM isotype-specific antibodies (Southern Biotechnology Associates, Inc., Birmingham, Ala.), biotinylated goat anti-mouse IgD isotype-specific antibodies (Southern Biotechnology Associates, Inc.), PE-conjugated anti-mouse I-Ab (AF6-120.1; PharMingen), anti-CD21/35 (7E9; provided by T. Tedder, Duke University, Durham, N.C.), PE-conjugated anti-CD23 (B3B4; PharMingen), PE-conjugated anti-CD4 (CT-CD4; Caltag), anti-CD8β (CT-CD8b; Caltag), PE-conjugated anti-CD5 (53-7.3; PharMingen), and PE-conjugated anti-MAC-1 (F4/80; Caltag). PE-conjugated streptavidin (Jackson ImmunoResearch Laboratories, Inc., West Grove, Pa.) was used to reveal biotin-coupled antibody staining. Dead and damaged cells stained positive for 7AAD and were eliminated from the analysis.
Serum Ig isotype-specific ELISAs.
Ig levels in serum were determined by an isotype-specific enzyme-linked immunosorbent assay (ELISA) as described previously (21). Briefly, ELISA plates were coated with antibodies against mouse Igs (Southern Biotechnology Associates, Inc). A standard curve was generated by using affinity-purified monoclonal antibodies against mouse IgM, IgG1, IgG2a, IgG2b, IgG3, and IgA (Southern Biotechnology Associates, Inc.). The Ig concentration for each individual sample was determined by comparing the mean optical density values from duplicate wells to the standard curve. DNP-specific antibody titers were measured by coating ELISA plates with DNP-bovine serum albumin (Calbiotech-Novabiochem Corp., La Jolla, Calif.). Sera were diluted and assessed for relative Igs as above. The statistical analysis was performed by Student’s t test.
Immunization.
Mice (2 to 3 months old) were immunized intraperitoneally (i.p.) with 25 μg of DNP-Ficoll (Biosearch Technologies, San Rafael, Calif.) in saline and were bled from the retroorbital venous plexus on days 0, 7, and 14 after immunization. For thymus-dependent immunization, mice (2 to 3 months old) were immunized i.p. with 100 μg of DNP-KLH (Calbiotech-Novabiochem Corp.) in complete Freund’s adjuvant on day 0 and boosted without adjuvant 21 days later. Blood samples were collected on days 0, 7, 21, and 28.
Calcium influx assay.
Erythrocyte-depleted splenocytes were prepared at 107/ml in RPMI 1640 medium (containing 5% bovine calf serum and 10 mM HEPES) and incubated with 1 mM Indo-1 AM (Molecular Probes, Eugene, Oreg.) for 40 min at 37°C as previously described (14). Calcium influx was triggered by adding MB19-1 (51) at 70 μg/ml or affinity-purified goat F(ab′)2 antibody fragments to mouse IgM (Cappel, Durham, N.C.) at 10 or 40 μg/ml to 2 × 10⁶/ml Indo-1-loaded cells. The intracellular Ca2+ concentration ([Ca2+]i) was determined by calculating the ratio of Indo-1 fluorescence emission at 405 nm and at 525 nm with a FACStar flow cytometer and LYSYS II software (Becton Dickinson). Fluorescence ratios were recorded for 60 s before and 400 s after antibody addition.
B-cell activation in culture.
Purified B cells were incubated with 10 μg of F(ab′)2 fragment of goat anti-mouse IgM antibody (Cappel) per ml, 10 μg of LPS (Escherichia coli serotype O111:B4; Sigma, St. Louis, Mo.) per ml, or medium alone for 24 h. B-cell activation was assessed by fluorescence-activated cell sorter (FACS) analysis with PE-conjugated anti-mouse I-Ab (AF6-120.1; PharMingen), FITC-conjugated anti-CD69 (H1.2F3; PharMingen), and PE-conjugated anti-CD44 (IM7; PharMingen).
B- and T-cell purification.
B cells were purified from splenocyte suspension by removing erythrocytes with ammonium chloride and T cells with Thy1.2-coated magnetic beads (Dynal, Lake Success, N.Y.). T cells were purified from inguinal and axillary lymph nodes or spleen by using a T-cell enrichment column (R&D Systems, Minneapolis, Minn.). The purity of B or T cells was greater than 92% in most cases as determined by flow cytometry analysis of aliquots of purified cells with PE-conjugated anti-T-cell receptor α/β (H57-597; Sigma) and FITC-conjugated anti-B220 (RA3-6B2; Caltag).
B- and T-cell proliferation.
Purified B and T cells were cultured in triplicate in 96-well flat-bottom tissue culture plates (2 × 10⁵ cells in 0.2 ml per well) under one of the following conditions: 10 or 20 μg of F(ab′)2 fragment of goat anti-mouse IgM antibody per ml, 50 or 100 U of recombinant mouse IL-4 (PharMingen) per ml plus 5 μg of F(ab′)2 fragment of goat anti-mouse IgM antibody per ml, 20 μg of LPS (E. coli serotype O111:B4), 10 μg of anti-CD40 monoclonal antibody (HM40-3; PharMingen) per ml, 2 μg of concanavalin A (ConA) (Sigma) per ml, or 20 ng of PMA (Sigma) per ml plus 1 μg of ionomycin (Sigma) per ml. T-cell receptor stimulation was carried out by coating plates with 10 μg of anti-CD3 monoclonal antibody clone 2C11 (PharMingen) per ml for 4 h at 4°C. Proliferation was measured by [3H]thymidine incorporation (1 μCi per well) during the last 16 h of a 64-h incubation.
In vitro isotype-switching assay.
Purified splenic B cells were cultured in triplicate in 96-well flat-bottom tissue culture plates (5 × 10⁴ cells in 0.2 ml per well) for 6 days in the presence of various stimuli. LPS (20 μg/ml) was added to the culture on day 0. IL-4 (200 or 1,000 U/ml) was added 24 h after the culture started. The concentrations of Ig isotypes in the culture supernatants were determined by ELISA.
RNase protection analysis of cytokine expression.
Erythrocyte-depleted splenocytes (107) were prepared at 5 × 10⁶/ml in medium and stimulated with 2.5 μg of anti-CD3 per ml for 48 h as previously described (16). Total RNA was isolated from cultured cells by using RNAzol. Cytokine RNA levels were assessed by RNase protection assays with a RiboQuant multiprobe kit (45024k/mCK-1; PharMingen). Radiation signals were analyzed with the ImageQuant program.
RT-PCR assay.
Purified splenic B cells were incubated with 10 μg of F(ab′)2 fragment of goat anti-mouse IgM antibody per ml for various periods. Total cellular RNA was isolated from incubated cells by using RNAzol and used for cDNAs synthesis as previously described (50). Briefly, 100 to 200 ng of isolated RNA was incubated with Moloney murine leukemia virus reverse transcriptase (RT) (GIBCO BRL) for 5 min at room temperature and 30 min at 55°C in a buffer containing 20 mM Tris-HCl (pH 8.4), 50 mM KCl, 3 mM MgCl2, 0.1 mg of bovine serum albumin per ml, 10 mM dithiothreitol, 0.5 mM each deoxynucleoside triphosphate, 10 U of RNasin (Roche Molecular Systems, Inc., Branchburg, N.J.), and 100 pmol of random hexamer primers. A fraction of the reverse transcription product was used in each of the following PCRs. Elongation factor 1 alpha (EF1α) is detected as a 228-bp PCR product with primers YZ95 (5′-AGTTTGAGAAGGAGGCTGCT-3′) and YZ95 (5′-CAACAATCAGGACAGCACAGTC-3′). Id3 is 192 bp with primers YZ132 (5′-GGGATCCGGGTCAGTGGCAAAAGCTCCT-3′) and YZ155 (5′-CGAGGCACTCAGCTTAGCAG-3′). E2A is 185 bp with primers E7 (5′-CTAGCCCCTCAACGCCTGTG-3′) and E15 (5′-CGGTGCCAACAGCGTGGCT-3′). c-Myc is 548 bp with primers c-myc1 (5′-AGTCCATTGATCCCTCAGTGGTCTTTCCCTA-3′) and c-myc2 (5′-CAGCTCGTTCCTCCTCTGACGTTCCAAGACG-3′) (58). PCR was carried out in 15 μl of buffer containing 10 mM Tris-HCl (pH 8.4), 50 mM KCl, 1.5 mM MgCl2, 0.5 mM each deoxynucleoside triphosphate, 1 μCi of [α-32P]dCTP (3,000 Ci/mmol; ICN), 0.5 μM each primer, and 1 U of Taq polymerase (GIBCO BRL). The samples were denatured at 95°C for 5 min and cycled through 94°C for 45 s, 57°C for 45 s, and 72°C for 1 min for a total of 21 to 33 times. Half of the PCR sample was electrophoresed on 5% polyacrylamide gels, and the PCR fragments were visualized by autoradiography. Quantitation was performed with a STORM 840 PhosphorImager. EF1α was used as an internal control for RNA input. Linear amplification was determined by running PCR reaction with at least three incremental cycle conditions for each primer pairs. The optimal number of cycles for each primer pair is 23 cycles for EF1α, 32 cycles for Id3, 30 cycles for E2A, and 32 cycles for c-Myc.
RESULTS
Generation of _Id3_-deficient mice.
The mouse Id3 gene was disrupted in ES cells by replacing the first two exons, which encode the entire translated sequence, and a portion of the third exon with a neomycin resistance gene cassette (Fig. 1A). Successful targeting of the Id3 gene was confirmed by Southern blot analysis of genomic DNA with _Sac_I, which produces 3.6- and 15-kb fragments for wild-type and Id3 mutant alleles, respectively (Fig. 1B). Northern blot analysis of total RNA from spleen showed the absence of Id3 expression in homozygous _Id3_−/− mice while Id2 expression was unchanged (Fig. 1C). Id1 expression in the spleen is undetectable by Northern analysis for both wild type and _Id3_−/− mice (data not shown). _Id3_−/− mice were recovered with a Mendelian ratio from the heterozygous breeding (25% Id3+/+, 52% Id3+/−, 23% _Id3_−/−; n = 124), indicating that embryonic development is not affected by Id3 disruption. Further, _Id3_−/− mice are superficially indistinguishable from their Id3+/+ and Id3+/− littermates with respects to appearance, general behavior, body and organ size, fertility, and mortality rate.
Normal lymphoid development.
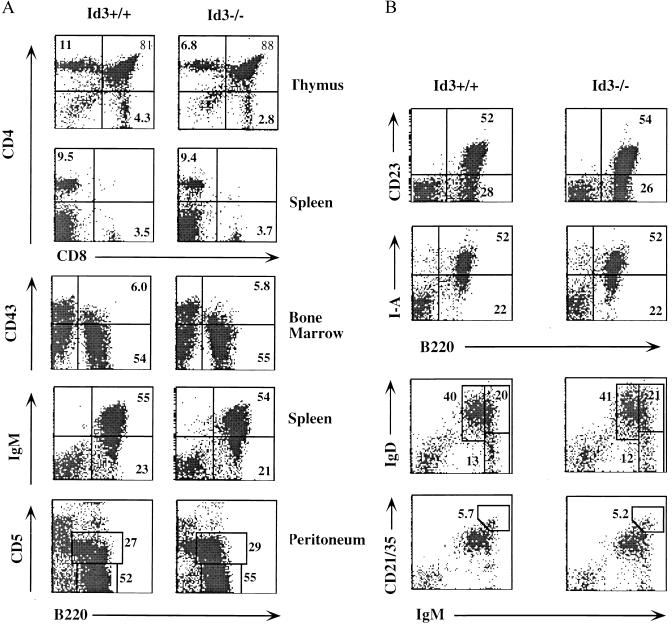
To explore the function of Id3 in lymphopoiesis, we first compared the total number of splenocytes and thymocytes in 4- to 10-week-old _Id3_−/− mice and their wild-type littermates. _Id3_−/− mice contained normal numbers of splenocytes (Id3+/+, 7.5 × 10⁷ ± 1.6 × 10⁷; Id3+/−, 6.4 × 10⁷ ± 2.3 × 10⁷; and _Id3_−/−, 6.9 × 10⁷ ± 2.0 × 10⁷; n = 5) and thymocytes (Id3+/+, 24.3 × 10⁷ ± 2.2 × 10⁷; Id3+/−, 25.8 × 10⁷ ± 2.0 × 10⁷; and _Id3_−/−, 23.0 × 10⁷ ± 2.0 × 10⁷; n = 5). The B and T cells from spleen, lymph nodes, thymus, and bone marrow were further analyzed by flow cytometry with a panel of lineage- and stage-specific markers (Fig. 2 and data not shown). Thymopoiesis in _Id3_−/− mice was largely normal except for a slight but consistent reduction in the proportion of CD4+ mature thymocytes (Id3+/+, 10.7% ± 1.2%; _Id3_−/−, 6.5% ± 0.6%; n = 5; P < 0.005) and CD8+ mature thymocytes (Id3+/+, 4.7% ± 0.4%; _Id3_−/−, 2.7% ± 0.5%; n = 5; P < 0.005). However, the numbers and ratios of CD4+ and CD8+ mature T cells in the spleens of _Id3_−/− mice were normal. The numbers and percentages of pro-B cells (B220+/CD43+) and pre-B cells and immature B cells (B220+/CD43−) in the bone marrow and mature B cells (B220+/IgM+) in the spleen were normal for _Id3_−/− mice (Fig. 2A). B cells from _Id3_−/− mice expressed normal levels of major histocompatibility complex (MHC) class II antigens (I-A) and CD23 surface molecules (Fig. 2B). Flow cytometry also detected the expected numbers of B220+/CD5+ B1 cells in the peritoneal cavity (Fig. 2A) and of myeloid cells in the bone marrow and the spleen (data not shown). _Id3_−/− mice also contained the normal frequency of follicular B cells (IgMlo IgDhi) and marginal-zone B cells (IgMhi CD21hi) (Fig. 2B). Hence, although Id3 is expressed in most hematopoietic cell types, its function is either dispensable or can be compensated by other Id genes during myelopoiesis and lymphopoiesis.
FIG. 2.
(A) T- and B-cell development in lymphoid tissues of _Id3_−/− mice. A three-color FACS analysis of lymphocytes from the thymus, spleen, bone marrow, and peritoneal cavity of Id3+/+ (left) and _Id3_−/− (right) mice is shown. Results are representative of multiple tests and are shown as two-color dot plots after eliminating the dead cells by 7AAD staining. The percentages of relevant lymphocyte population are indicated in the quadrants. (B) Surface marker expression and subpopulation of B cells in the spleens of _Id3_−/− mice. Splenocytes were isolated from Id3+/+ (left) and _Id3_−/− (right) mice and examined by flow cytometry analysis as described for panel A.
Aberrant Ig levels in serum in Id3 deficient mice.
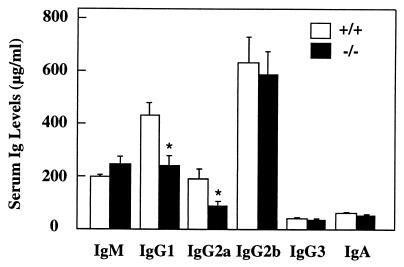
Since Id3 but not Id1 and Id2 has been reported to be highly expressed in mature B cells (43), we set out to investigate whether a lack of Id3 has an impact on humoral immunity. Ig levels in serum in naive _Id3_−/− mice was determined by ELISA. While basal levels of IgM, IgG2a, IgG2b, IgG3, and IgA in serum in _Id3_−/− mice were comparable to those in wild-type mice, the levels of IgG1 and IgG2a were reduced to 45% ± 8% and 57% ± 11% of wild-type levels, respectively (Fig. 3). This data suggests that although the B and T cells in _Id3_−/− mice are phenotypically normal, their function might be altered.
FIG. 3.
ELISA of Ig levels in serum of unimmunized Id3+/+ (n = 16) and _Id3_−/− (n = 16) mice. Results are presented as mean ± standard error for 16 mice for each genotype. Asterisks denote values that are significantly different from the wild-type controls (t test; P < 0.005).
Impaired humoral immune responses.
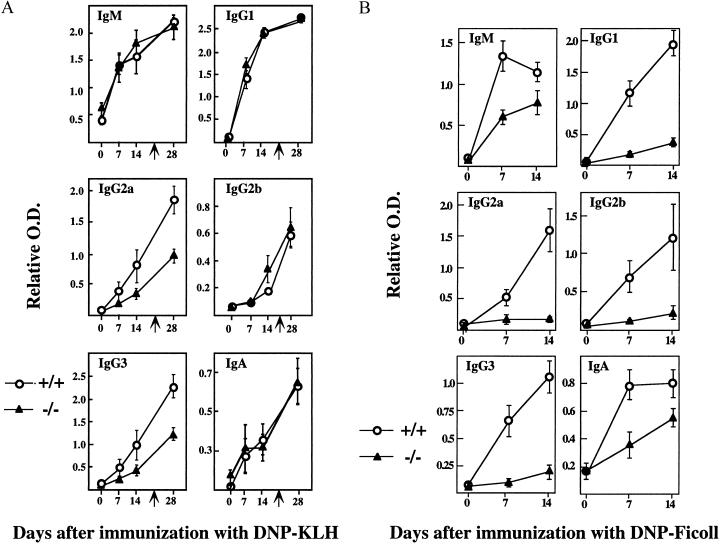
A role for Id3 in Ig production has been indicated by its ability to repress class switching in plasma cell lines (41). To further investigate the role of Id3 in humoral immunity, we assessed the immune responses of Id3 mice to several model antigens. When challenged i.p. with DNP-KLH, _Id3_−/− mice were found to be capable of producing normal levels of DNP-specific IgM, IgG1, IgG2b, and IgA in both primary and secondary responses (Fig. 4). However, the ability of these mice to produce DNP-specific IgG2a and IgG3 was 10-fold lower in the primary response and 15-fold lower in the secondary response than for the wild-type controls (Fig. 4A). When challenged with DNP-Ficoll, _Id3_−/− mice displayed a 10-fold decrease of DNP-specific IgM and IgA production in comparison to Id3+/+ mice and no or near-basal levels of DNP-specific IgG1, IgG2a, IgG2b, and IgG3 (Fig. 4B). _Id3_−/− mice mounted a normal humoral response to TNP-LPS, a TI-1 antigen (data not shown). These results define a role for Id3 in some but not all classes of Ig isotype production. Histological analysis of frozen tissue sections stained with peanut agglutinin and IgM revealed normal germinal-center formation in mice immunized with DNP-KLH and a normal distribution of antibody-forming foci in mice immunized with DNP-Ficoll (data not shown). Therefore, the defects described above may not be explained by any malformation of the splenic microenvironment.
FIG. 4.
(A) Humoral immune response to DNP-KLH. Id3+/+ (n = 5) and _Id3_−/− mice (n = 5) mice were injected i.p. with 100 μg of DNP-KLH in complete Freund’s adjuvant on day zero and were boosted without adjuvant 21 days later. The mice were bled at the indicated times for ELISA of DNP-specific antibodies. The relative concentrations of anti-DNP-specific antibody isotype are shown as mean optical density (O.D.) and standard error. Serum dilution factors are as follows: 1:1,000 for IgM and IgG1; 1:500 for IgG2a and IgG3; 1:100 for IgG2b and IgA. _Id3_−/− mice show significantly reduced IgG2a and IgG3 production on days 14 and 28 (t test against wild-type controls; P < 0.005). (B) Humoral immune response to DNP-Ficoll. Mice were injected i.p. with 25 μg of DNP-Ficoll on day zero and bled at the indicated times. DNP-specific antibodies for six different isotypes were analyzed by ELISA. Serum dilution factors are as follows: 1:1,000 for IgM and IgG3; 1:100 for the other four isotypes. A significant difference between the two genotypes was found in all cases following immunization (t test against wild type controls, n = 5 for each genotype; P < 0.005).
Normal activation response to the BCR signal.
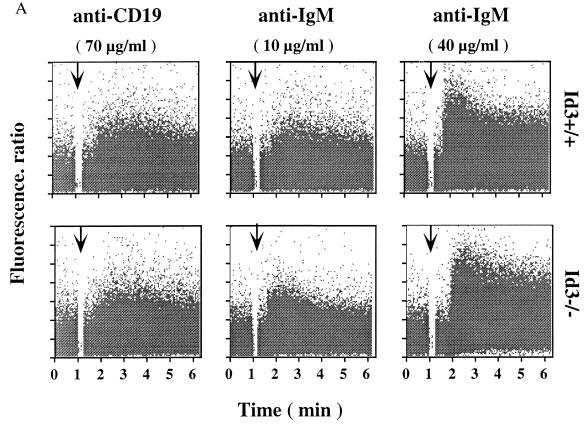
A normal B-cell response to a foreign antigen entails two major steps: first, B-cell activation by signals from the B-cell receptor (BCR), and second, cell proliferation and/or differentiation. The abnormal humoral immune responses observed in _Id3_−/− mice could therefore result from a defect in either the first step or the second step. To distinguish between these two possibilities, we first tested the ability of _Id3_−/− mouse B cells to elicit a calcium response to either anti-CD19 or F(ab′)2 fragment of anti-IgM antibodies. No differences in [Ca2+]i between wild-type and _Id3_−/− mouse B cells were observed when the splenic B cells were stimulated by suboptimal (10 μg/ml) or optimal (40 μg/ml) concentrations of anti-IgM antibodies (Fig. 5A). A similar conclusion was reached when optimal concentrations (70 μg/ml) of anti-CD19 antibodies were used (Fig. 5A). This analysis confirms that the BCR complex on _Id3_−/− B cells is capable of receiving and delivering signals.
FIG. 5.
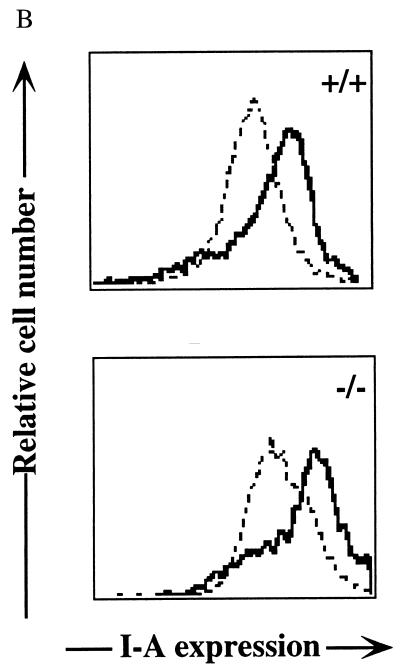
(A) Splenocytes were stained with FITC-labeled anti-B220 monoclonal antibody after being loaded with Indo-1AM. B220+ B cells were examined for [Ca2+]i following stimulation (indicated by arrows) with rabbit anti-mouse CD19 or F(ab′)2 goat anti-mouse IgM. [Ca2+]i was determined as the ratio of Indo-1 fluorescence at 405 nm to 525 nm. The results are representative of three pairs of Id3+/+ and _Id3_−/− mice. (B) Expression levels of MHC class II antigen (Ia) in splenic B cells purified from Id3+/+ (top) and _Id3_−/− (bottom) mice after a 24-h culture in the absence (dashed lines) or presence (solid lines) of 10 μg of F(ab′)2 goat anti-mouse IgM per ml.
In addition to the calcium influx, full activation of a B cell is characterized by up regulation of specific surface markers including MHC class II, CD19 (9), CD44 (62), and CD69 (61). These markers were expressed at normal levels in _Id3_−/− mouse B cells and further up regulated upon 24-h stimulation with anti-IgM antibodies or LPS (Fig. 5B and data not shown). The level of increase for each marker was comparable to that in the wild-type controls. Therefore, we tentatively concluded that the impaired humoral immune responses in _Id3_−/− mice are not due to a general defect in the BCR pathway leading to B-cell activation.
Defective proliferation of _Id3_−/− mouse B cells upon surface BCR cross-linking.
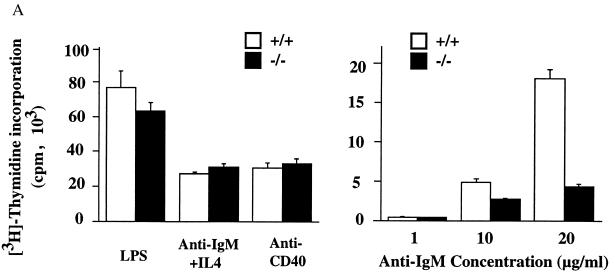
We next investigated the proliferation status of _Id3_−/− mouse B cells in tissue culture. It has been well documented that B-cell proliferation can be triggered by BCR and other divergent signaling cascades. To evaluate the effect of Id3 disruption on various signaling events, purified splenic B cells from _Id3_−/− and wild-type mice were stimulated with a number of reagents. _Id3_−/− and Id3+/+ mouse B cells gave similar proliferative responses when treated with various concentrations of LPS, anti-CD38, and anti-CD40 (Fig. 6A and data not shown). PMA and ionomycin, which activate B cells through a protein kinase C signaling pathway, also triggered a vigorous proliferation response in both _Id3_−/− and Id3+/+ mouse B cells (data not shown). In contrast, the proliferation response of _Id3_−/− mouse B cells to the soluble F(ab′)2 fragments of anti-IgM was significantly lower than that of wild-type mouse B cells (34% ± 10% at 10 μg/ml [P < 0.005]; 23% ± 8% at 20 μg/ml [P < 0.005]) (Fig. 6A). No significant difference was found in proliferation kinetics (assayed at 12-h intervals over a 72-h period) between _Id3_−/− and Id3+/+ mouse B cells, ruling out the possibility that the reduced 3H incorporation is due to changes in the kinetics of the maximal proliferation response (data not shown). The apoptotic rates determined by propidium iodide staining were also similar for _Id3_−/− mouse B cells and Id3+/+ mouse B cells treated with various stimuli (data not shown). Finally, this defect could be corrected when both IL-4 and anti-IgM were included in the B-cell culture (Fig. 6A). Carboxyfluorescein diacetate succinimidyl ester (CFSE) treatment also exerted a similar effect on _Id3_−/− mouse B cells to that of IL-4 (data not shown). Because CFSE covalently binds to many cellular proteins, we cannot distinguish if IL-4 or other signaling pathways are altered by CFSE modification. Taken together, these assays define a restricted role for Id3 downstream of the BCR signal and necessary for B-cell proliferation. This function of Id3 may be partially responsible for the impaired immune response of _Id3_−/− mice to the TI-2 antigen.
FIG. 6.
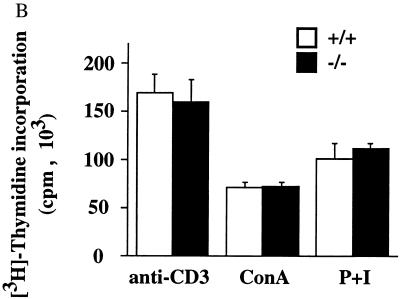
(A) B-cell proliferation induced by the F(ab′)2 fragment of goat anti-mouse IgM at three different concentrations (right) and by LPS (50 μg/ml), anti-CD40 monoclonal antibody (10 μg/ml), and 100 U of IL-4 per ml plus 5 μg of F(ab′)2 fragment of goat anti-mouse IgM per ml (left). Purified splenic B cells were cultured in the presence of the indicated stimuli for 64 h, with [3H]thymidine being added during the last 16 h. [3H]thymidine incorporation is shown as the mean and standard error of triplicate cultures. Results are representative of four independent experiments. (B) T-cell proliferation induced by anti-CD3 (10 μg/ml), ConA (2 μg/ml), and PMA (20 ng/ml) plus ionomycin (1 μg/ml) (P+I). Purified splenic T cells were cultured for 54 h, with [3H]thymidine being added during the last 16 h. Results are shown as in panel A and are representative of four independent experiments.
BCR cross-linking leads to rapid up regulation of Id3.
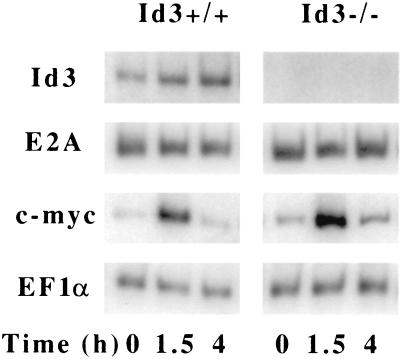
Id3 has been identified as an immediate-early gene induced by serum stimulation in fibroblasts (11, 35) and PMA stimulation in human B cells (18). The defect in BCR-induced B-cell proliferation in _Id3_-deficient B cells suggests that Id3 may also be directly regulated by the BCR signal. To test this hypothesis, we set out to determine the expression pattern of Id3 in the early phase of B-cell proliferation upon surface IgM stimulation. Purified splenic B cells were treated with the soluble F(ab′)2 fragments of anti-IgM, and total cellular RNA was isolated after various times. An RT-PCR assay revealed that there was a rapid induction of the level of Id3 by twofold in the first 1.5 h of anti-IgM stimulation (Fig. 7). However, its expression pattern is distinct from that of c-myc, a well-demonstrated BCR-inducible early gene (34). While c-myc was found to be induced fivefold in the first 1.5 h but sharply down regulated to the basal level in 4 h, the level of Id3 went up threefold in 4 h. The expression level of the E2A gene remained constant, which is consistent with the previous observation that the levels of E proteins stayed unchanged during the transition from the G0 to S phase of the cell cycle (28, 36). The expression kinetics for the c-myc and E2A genes in _Id3_-deficient mouse B cells were identical to those in wild-type mouse B cells, indicating that these two genes are not directly affected by Id3 disruption. Finally, we found that Id3 was also induced by LPS treatment of purified B cells (data not shown).
FIG. 7.
Induction of Id3 expression in purified splenic B cells stimulated with anti-IgM. RNA was isolated from the wild-type and _Id3_−/− mouse B cells stimulated with anti-IgM for the indicated times (0, 1.5, and 4 h). The expression of Id3, E2A, c-myc, and EF1α was determined by the RT-PCR assay with gene-specific primers. Each primer pair was tested for linear PCR amplification by running incremental PCR cycles. Results shown are the optimal cycle conditions for the given genes. Quantitation was further confirmed by repeating the entire proliferation and RNA analysis by using B-cells purified from a separate batch of animals.
Enhanced in vitro differentiation abilities of _Id3_−/− mouse B cells.
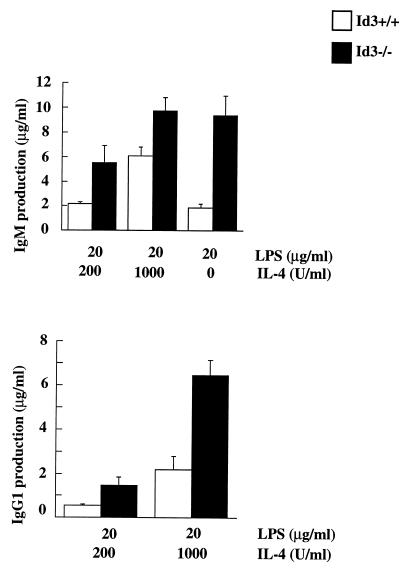
The differentiation ability of _Id3_−/− mouse B cells was assessed by culturing purified B cells under isotype-switching conditions. _Id3_−/− mouse B cells secreted five times more IgM than did wild-type mouse B cells when stimulated with LPS and a significantly larger amount of IgG1 (2.5 times larger with 200 U of IL-4 per ml and 1.6 times higher with 1,000 U of IL-4 per ml) when stimulated with LPS and IL-4 (Fig. 8). This result indicates a negative role for Id3 in regulating differentiation and isotype switching. Because the antibody production in _Id3_−/− mice is reduced rather than enhanced, one must consider that Id3 disruption may also affect other cell types important for humoral immunity.
FIG. 8.
Ig secretion in stimulated splenic B cells. B cells from Id3+/+ and _Id3_−/− mice were purified from spleens and cultured for 6 days in the presence of various stimuli as indicated in the figure. The concentrations of Ig isotypes in the culture supernatants were determined by ELISA. Similar results were obtained from four independent experiments.
Reduced expression of gamma interferon in anti-CD3-stimulated _Id3_−/− mouse T cells.
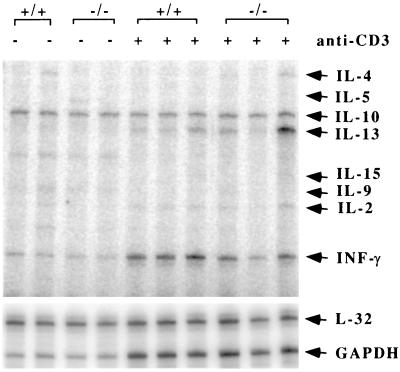
Given the important role of T-cells in isotype switching and overall humoral immunity, we asked if T-cell function is compromised by Id3 disruption. Proliferation assays were carried out with purified T cells from spleen and lymph nodes. No noticeable difference between _Id3_−/− and wild-type mouse T cells was observed when cells were stimulated with anti-CD3, anti-CD3 plus anti-CD28, ConA, or PMA plus ionomycin over a range of concentrations (Fig. 6C and data not shown). In addition, _Id3_−/− mouse T cells displayed normal levels of surface CD25, CD44, and CD69 before and after stimulation compared with Id3+/+ mouse T cells. These assays demonstrate that Id3 is not required for T-cell activation and proliferation under these defined conditions. However, RNA analysis of cytokine gene expression in anti-CD3-stimulated primary splenocyte culture revealed a 33% ± 6% reduction of gamma interferon (INF-γ) mRNA in the _Id3_−/− mouse T-cell samples (Fig. 9). The expression of other cytokine genes shown in the figure was relatively normal (longer exposure [data not shown]). This result suggests that _Id3_−/− mouse T cells might also contribute to the impaired humoral immune responses seen in vivo.
FIG. 9.
Cytokine gene expression in anti-CD3-stimulated _Id3_−/− mouse splenocytes. Erythrocyte-depleted splenocytes from Id3+/+ and _Id3_−/− mice were cultured with anti-CD3 for 48 h. Total RNAs were prepared, and cytokine gene expression was determined by an RNase protection assay. The identity of each band is indicated on the right. L32 and GAPDH are controls for mRNA quantity and quality.
Rescue of the proliferation defect of _Id3_−/− mouse B cells by overexpression of the Id1 gene.
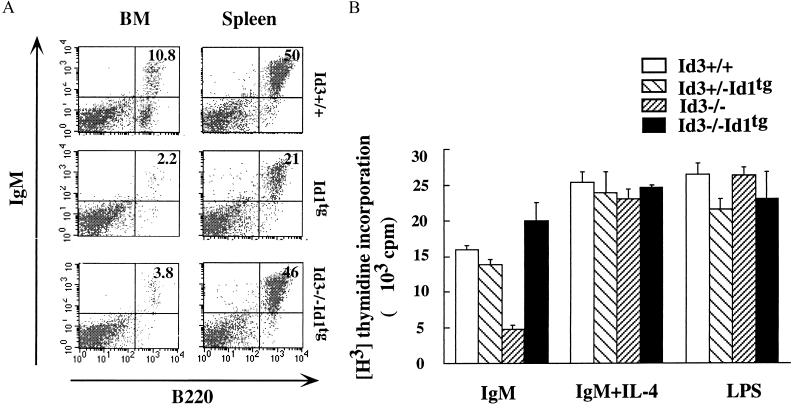
Given the presumed functional relationship between Id3 and E2A proteins, we propose that the proliferation defect of _Id3_−/− mouse B cells may be due to dysregulation of E2A function. E2A can inhibit cell cycle progression by several hypothetical mechanisms including a direct transcriptional activation of p21, a CDK inhibitor (47). Deletion of Id3 may leave the E2A protein level unchecked and thus cause cell cycle arrest at G1 phase. To experimentally address this functional link between E2A and Id3, we attempted to rescue Id3 deficiency with a B-cell-specific Id1 transgene. Id1 and Id3 proteins have 69% sequence homology in their HLH domains (11). Both of these proteins are capable of antagonizing the DNA-binding activity of E2A proteins (11, 32). It has been shown that mice carrying an Id1 transgene under the mb-1 promoter (_Id1_tg) display a severe block in early B-cell development and a reduced number of mature B cells (59). Nonetheless, these _Id1_tg mature B cells are phenotypically indistinguishable from the wild-type B cells judged by expression patterns of B-cell markers including B220, CD19, mIgM, mIgD, CD44, CD69, CD23, and Ia in the resting and activated states (data not shown). Introduction of this Id1 transgene into the _Id3_−/− background results in a severe reduction of B-cell numbers in the bone marrow, a phenotype identical to that of the _Id1_tg mice, but close to normal numbers of B220+ IgM+ mature B cells in the spleen (Fig. 10A and data not shown). Although the exact functional relationship between the Id1 transgene and the Id3 gene requires further investigation, the result of this simple cross indicates a functional compensation between the Id1 transgene and the endogenous Id3 gene in maintaining the splenic B-cell numbers.
FIG. 10.
(A) FACS analysis of bone marrow and splenic B cells from Id3+/+ (top) _Id1_tg (middle), and _Id3_−/− _Id1_tg (bottom) mice. The percentage of B220+/IgM+ cells is shown in the top right quadrant of each dot plot. (B) Comparison of Id3+/−, Id3+/− _Id1_tg, _Id3_−/−, and _Id3_−/− _Id1_tg mouse splenic B cells for their proliferative response to the F(ab′)2 fragment of anti-IgM (20 μg/ml), IgM (5 μg/ml) plus IL-4 (100 U), or LPS (100 μg/ml). [3H]thymidine incorporation is shown as mean and standard error of a triplicate culture. Results are representative of three independent experiments.
B cells purified from spleens of Id3+/+, _Id3_−/−, Id3+/− _Id1_tg, and _Id3_−/− _Id1_tg mice were analyzed for their proliferation responses to LPS, IgM, or IgM plus IL-4. As shown in Fig. 10B, Id3+/− _Id1_tg mouse B cells, which resemble _Id1_tg mouse B cells (data not shown), proliferate in a similar manner to that of Id3+/+ mouse B cells. The proliferation rate of _Id3_−/− _Id1_tg mouse B cells in response to anti-IgM stimulation was much higher than that of _Id3_−/− mouse B cells and even slightly (but reproducibly) higher than that of wild-type mouse B cells. Thus, the function of Id3 in supporting B-cell proliferation can be replaced by the ectopically expressed Id1 gene. This result supports the notion that a minimal level of Id proteins is needed to antagonize a bHLH protein dimer (most probably involving E2A proteins) which negatively regulates cell cycle progression.
DISCUSSION
In this study we generated _Id3_-deficient mice and identified a novel role of Id3 in humoral immunity. Despite the ubiquitous expression pattern and presumed function of Id3 in multiple cell types, mice lacking the Id3 gene appear viable and fertile and exhibit normal activity. Although no abnormality is observed in lymphoid development, _Id3_−/− mice show selective defects in humoral immunity. This phenotype is partially explained by the study of purified B cells, which shows that Id3 is required for BCR-mediated B-cell proliferation, and by the study of _Id3_−/− mouse T cells, which shows that Id3 is required for optimal expression of IFN-γ. Finally, the rescue of the _Id3_-deficient phenotype by an Id1 transgene suggests one possible mechanism: the role of Id3 is to relieve the cell cycle-inhibitory effect imposed by E2A or E2A-like bHLH molecules.
Id3 is required for an optimal humoral immune response.
_Id3_−/− mice fail to mount a proper immune response to DNP-Ficoll, a TI-2 antigen. Ti-2 antigens are classified as antigens that stimulate antibody production in the absence of MHC class II-restricted T-cell help (43). Although the molecular basis of TI-2 immunity is not clear, our present study supports the notion that Id3 may respond to the BCR signal and allow B cells to proliferate. It is also possible, however, that the development of DNP-Ficoll-specific B cells is impaired in naive _Id3_−/− mice, which then leads to a weaken response. Further tests of other TI-2 antigens and a detailed characterization of the Id3 expression pattern in the marginal zone, where the TI-2 immune response is thought to occur (43), may help resolve this issue.
The immune response to TD antigens is also partially impaired in _Id3_−/− mice. It has been established that a full TD response requires a proper interaction between the antigen-specific B cells and T cells. The reduction of IgG2a and IgG3 levels observed in the TD response of _Id3_−/− mice may be attributed to a specific rather than general defect in T cells, since other Ig isotypes are produced at normal levels and cultured _Id3_−/− mouse T cells respond properly to various stimuli including anti-CD3, anti-CD3 plus anti-CD28, PMA plus ionomycin, and ConA. This defect may reflect an impaired ability of _Id3_−/− mouse helper T cells to produce certain cytokines required for class switching or a defect in _Id3_−/− mouse B cells in responding to the switch signals. The underlying mechanism, involving either the T cell or the B cell, must represent a very restricted function of Id3, since only IgG2a and IgG3 but not other Ig isotypes are affected by the gene deficiency. Indeed, we observed a small but consistent reduction in the expression level of IFN-γ in anti-CD3 treated T cells. IFN-γ, a Th1 cytokine, induces germ line γ2a transcripts and subsequent switching to IgG2a in mouse B cells (15, 53, 56). IFN-γ also induces germ line γ3 transcripts and switching to IgG3 in B cells activated with dextran-conjugated anti-IgD antibodies plus IL-5 (69). This small reduction of IFN-γ revealed in the culture assay could be amplified in the time course of immunization. However, this result and explanation do not preclude other possible mechanisms. The analysis carried out in this study only provides an assessment of certain aspects of Id3 function. It is highly possible that other defects associated with _Id3_−/− mouse T cells or other cell types also contribute to the impaired immune responses in _Id3_−/− mice.
Id3 and isotype switching.
B cells can change their CH portion of the expressed heavy chain through heavy-chain class switch recombination (12, 24). This process occurs during immunization with either TI or TD antigens (25, 43). Several lines of evidence have suggested that bHLH and Id proteins regulate class switching. Id3 has been suggested to regulate Ig heavy-chain 3′ enhancer activity via the E5 site, a functionally important E12/E47 binding site (41). The Ig heavy-chain 3′ enhancer is activated in the late stage of B-cell development and is possibly involved in class switch recombination (13). Overexpression of Id3 repressed the Ig heavy-chain 3′ enhancer in plasma cells by abrogating the DNA-binding ability of E12/E47 (41). In addition, the involvement of bHLH proteins in isotype switching is supported by the finding that E47 or a highly related bHLH protein is part of the SNAP complex, which binds to an E2-box-like site in the Sγ switch regions (37). Our isotype-switching assay with isolated B-cells indicates a negative role for Id3 in isotype switching and suggests that an interaction between E2A and Id3 proteins may be critical in regulating class switching. However, this result from purified B cells is opposite of the impaired humoral immunity observed in _Id3_−/− mice. The apparent discrepancy between the in vitro and in vivo results may be explained by the following possibilities: (i) Id3 may be required for clonal expansion of certain activated B cells, and therefore deletion of Id3 may lead to a reduced Ig production; and (ii) Id3 may be involved in regulating cytokine gene expression, which ultimately controls Ig class switching and production. In the course of an immune response to antigens, both events may contribute to isotype switching and the final outcome of humoral immunity.
Id3 is exclusively required for BCR-mediated B-cell proliferation.
B cells can be activated through different signaling pathways. To ensure proper humoral immunity, B cells must be able to differentiate and integrate different signaling events and give rise to the appropriate biological responses. While the signaling events occurring at and immediately downstream of the BCR level have been heavily investigated, little is known about how the signals are interpreted by nuclear factors which directly control differentiation and/or proliferation. Id3, as an immediate-early response gene, has a transient peak expression in human B cells after mitogen treatment (18). It has been suggested, but not proved, that the transient expression of Id3 in many cells including B cells promotes cell proliferation. We show in this study that _Id3_−/− is dispensable in B-cell proliferation responses to LPS, CD40, or IgM plus IL-4, which represent several signaling pathways. In addition, no overt abnormalities are observed in the development of _Id3_−/− B cells, during which extensive cell proliferation must occur. These results indicate that Id3 may not be a common factor linked to cell cycle progression or that its function may be compensated by other coexpressed Id genes.
On the other hand, Id3 is clearly required for B-cell proliferation when B cells are stimulated by BCR cross-linking. This result indicates that the function of Id3 must be within the BCR signaling pathway and before the multipathway converging point leading to the cell cycle progression. A possible target of Id3 is E2A, which has been shown in NIH 3T3 cells to cause a growth arrest by activating p21 expression (47). It has been reported that during the early G1 phase of the cell cycle, the E-box-binding activities of E2A proteins are transiently depressed at a time coincident with the peak induction of Id proteins (28, 36). Therefore, up regulation of Id3 may directly exert a negative effect on the E2A activity and consequently on p21 activity. The activity of E2A can be further regulated by other Id molecules, by ABF-1 (a recently identified bHLH factor exclusively expressed in activated B cells [38]), or by its own transcription and posttranslational modification (5, 54, 70). We propose that either E2A or the downstream target of E2A could function as one converging point that leads several signaling pathways to the cell cycle machinery. Among many cell cycle regulators, p27 has been indicated as an important CDK inhibitor in regulating B-cell proliferation induced by BCR and IL-4 costimulation (8, 57). We have attempted to determine which cell cycle component is altered in _Id3_-deficient B cells upon BCR cross-linking. Thus far, no prominent candidate has been identified by Western analysis of CDK inhibitors including p15, p16, p18, p19, p21, and p27 (unpublished data). Clearly, additional tests including genetic approaches, may be needed before one can firmly establish a causative link between Id3 and cell cycle regulation.
Id1 is capable of replacing Id3 function.
A functional rescue of Id3 by Id1 supports the notion that E2A is the common target of all Id proteins and that its presence controls cell cycle progression. However, the mechanism underlying the functional rescue is obscured by the following facts: First, the Id1 transgene is expressed from the mb-1 promoter, which may not be regulated in the same way as the endogenous Id3 gene during the BCR signaling event. Second, the Id1 protein lacks the CDK consensus site (28) present on Id2 and Id3, and thus its activity may be differentially regulated during the cell cycle (4, 29). Therefore, how the Id1 transgene senses the BCR signal is not clear. One plausible explanation is that a constitutive high-level expression of Id1 may reduce the level of functional E2A proteins. Consequently, the signal threshold required for overcoming the G1 block imposed by E2A proteins is lowered. In other words, the Id1 transgene makes B cells more sensitive to proliferation signals. Another possibility is that both Id3 and Id1 are regulated by the BCR signal at the posttranslational level through a mechanism yet to be identified. Therefore, a bigger issue raised by the Id1 rescue experiment is that perhaps Id3 is regulated by BCR signal at multiple levels including transcription and posttranslational modification.
Id3 and early B-cell development.
E2A is a key regulatory gene in B-cell development (3, 72). The numbers of pro- and pre-B cells produced in the bone marrow are tightly correlated with the dosage of E2A proteins (2, 72), which in turn can be modulated by several other E proteins and Id proteins (18, 70). It has been generally accepted that the role of Id genes is to negatively regulate E2A activity during B-cell differentiation. We anticipated that deletion of Id3 could conceivably perturb E2A activity by changing the balance of the protein dimers. However, no abnormality in B-cell development is observed in _Id3_−/− mice. To further evaluate the activity of Id3 in B-cell development, we generated E2A Id3 double-mutant mice by combining the Id3 mutation with various E2A mutant alleles including E12ko and E47bm, two hypomorph E2A alleles (70). Although E2A-deficient mice do not make any B cells, E12ko and E47bm mice are capable of producing a limited number of B cells in the neonatal stage (70). If Id3 can modulate the activity of E12 or E47, we expect to see an increase of B-cell numbers in the E12ko or E47bm mice after disruption of Id3. Again, analysis of Id3 and E12 or E47 double-mutant mice failed to show any effect of Id3 deficiency on B-cell development. In conclusion, the defect imposed by the E2A mutations cannot be relieved by deletion of Id3 (data not shown). This result raises the possibility that Id3 does not play a major role in early B-cell development owing to either its expression level being insufficient or its protein being inactive. This view is supported by the fact that Id3 knockout also fails to rescue the bone marrow B-cell development imposed by the Id1 transgene. Alternatively, function of Id3 in B-cell development may be compensated by other Id genes expressed in the B-cell lineage. A similar argument has been made in the study of Id1 gene-deficient mice. Disruption of Id1 also failed to show any detectable contribution to B-cell development when tested either alone or in combination with E2A deficiency (68). With both _Id3_- and _Id1_-deficient mice available now, generation and analysis of Id1 and Id3 doubly deficient mice will help to resolve the compensatory roles of Id proteins in the development of B cells and many other cell types.
ACKNOWLEDGMENTS
We thank Peifeng Cheng for assistance in isolating Id3 cDNA and genomic DNA, Thomas Tedder and Makoto Inoaki for providing reagents and technical advice on immune system assays, Mike Cook for assistance in the calcium influx assay, Meifang Dai for assistance in mouse work, Dawn Phelp and Yue Xiong for assistance in coimmunoprecipitation Western analysis of cell cycle proteins, and Douglas Steeber for critical reading of the manuscript.
This work has been supported by the Leukemia Society of America, the Whitehead Scholarship, and NCI grant (R01 CA72433-01) to Y.Z.
REFERENCES
- 1.Atherton G T, Travers H, Deed R, Norton J D. Regulation of cell differentiation in C2C12 myoblasts by the Id3 helix-loop-helix protein. Cell Growth Differ. 1996;7:1059–1066. [PubMed] [Google Scholar]
- 2.Bain G, Robanus Maandag E C, te Riele H P, Feeney A J, Sheehy A, Schlissel M, Shinton S A, Hardy R R, Murre C. Both E12 and E47 allow commitment to the B cell lineage. Immunity. 1997;6:145–154. doi: 10.1016/s1074-7613(00)80421-5. [DOI] [PubMed] [Google Scholar]
- 3.Bain G, Maandag E C, Izon D J, Amsen D, Kruisbeek A M, Weintraub B C, Krop I, Schlissel M S, Feeney A J, van Roon M, van der Valk M, te Riele H P J, Berns A, Murre C. E2A proteins are required for proper B cell development and initiation of immunoglobulin gene rearrangements. Cell. 1994;79:885–892. doi: 10.1016/0092-8674(94)90077-9. [DOI] [PubMed] [Google Scholar]
- 4.Barone M V, Pepperkok R, Peverali F A, Philipson L. Id proteins control growth induction in mammalian cells. Proc Natl Acad Sci USA. 1994;91:4985–4988. doi: 10.1073/pnas.91.11.4985. [DOI] [PMC free article] [PubMed] [Google Scholar]
- 5.Benezra R. An intermolecular disulfide bond stabilizes E2A homodimers and is required for DNA binding at physiological temperatures. Cell. 1994;79:1057–1067. doi: 10.1016/0092-8674(94)90036-1. [DOI] [PubMed] [Google Scholar]
- 6.Benezra R, Davis R L, Lockshon D, Turner D L, Weintraub H. The protein Id: a negative regulator of helix-loop-helix DNA binding proteins. Cell. 1990;61:49–59. doi: 10.1016/0092-8674(90)90214-y. [DOI] [PubMed] [Google Scholar]
- 7.Biggs J, Murphy E V, Israel M A. A human Id-like helix-loop-helix protein expressed during early development. Proc Natl Acad Sci USA. 1992;89:1512–1516. doi: 10.1073/pnas.89.4.1512. [DOI] [PMC free article] [PubMed] [Google Scholar]
- 8.Blanchard D A, Affredou M T, Vazquez A. Modulation of the p27kip1 cyclin-dependent kinase inhibitor expression during IL-4 mediated human B cell activation. J Immunol. 1997;158:3054–3061. [PubMed] [Google Scholar]
- 9.Carter R H, Fearon D T. CD19: lowering the threshold for antigen receptor stimulation of B lymphocytes. Science. 1992;256:105–107. [PubMed] [Google Scholar]
- 10.Choi J K, Shen C P, Radomska H S, Eckhardt L A, Kadesch T. E47 activates the Ig-heavy chain and TdT loci in non-B cells. EMBO J. 1997;15:5014–5021. [PMC free article] [PubMed] [Google Scholar]
- 11.Christy B A, Sanders L K, Lau L F, Copeland N G, Jenkins N A, Nathans D. An Id-related helix-loop-helix protein encoded by a growth factor-inducible gene. Proc Natl Acad Sci USA. 1991;88:1815–1819. doi: 10.1073/pnas.88.5.1815. [DOI] [PMC free article] [PubMed] [Google Scholar]
- 12.Coffman R L, Lebman D A, Rothman P. Mechanism and regulation of immunoglobulin isotype switching. Adv Immunol. 1993;54:229–270. doi: 10.1016/s0065-2776(08)60536-2. [DOI] [PubMed] [Google Scholar]
- 13.Cogne M, Lansford R, Bottaro A, Zhang J, Gorman J, Young F, Cheng H L, Alt F W. A class switch control region at the 3′ end of the immunoglobulin heavy chain locus. Cell. 1994;77:737–747. doi: 10.1016/0092-8674(94)90057-4. [DOI] [PubMed] [Google Scholar]
- 14.Coligan J E, Kruisbeek A M, Margulies D H, Shevach E M, Strober W, editors. Current protocols in immunology. New York, N.Y: Wiley Interscience; 1990. pp. 5.51–5.53. [Google Scholar]
- 15.Collins J T, Dunnick W A. Germline transcripts of the murine immunoglobulin gamma 2a gene: structure and induction by IFN-gamma. Int Immunol. 1993;5:885–891. doi: 10.1093/intimm/5.8.885. [DOI] [PubMed] [Google Scholar]
- 16.Datto M B, Frederick J P, Pan L, Borton A J, Zhuang Y, Wang X F. Targeted disruption of Smad3 reveals an essential role in transforming growth factor beta-mediated signal transduction. Mol Cell Biol. 1999;19:2495–2504. doi: 10.1128/mcb.19.4.2495. [DOI] [PMC free article] [PubMed] [Google Scholar]
- 17.Deed R W, Bianchi S M, Atherton G T, Johnston D, Santibanez-Koref M, Murphy J J, Norton J D. An immediate early human gene encodes an Id-like helix-loop-helix protein and is regulated by protein kinase C activation in diverse cell types. Oncogene. 1993;8:599–607. [PubMed] [Google Scholar]
- 18.Deed R W, Hara E, Atherton G T, Peters G, Norton J D. Regulation of Id3 cell cycle function by Cdk-2-dependent phosphorylation. Mol Cell Biol. 1997;17:6815–6821. doi: 10.1128/mcb.17.12.6815. [DOI] [PMC free article] [PubMed] [Google Scholar]
- 19.Desprez P Y, Hara E, Bissell M J, Campisi J. Suppression of mammary epithelial cell differentiation by the helix-loop-helix protein Id-1. Mol Cell Biol. 1995;15:3398–3404. doi: 10.1128/mcb.15.6.3398. [DOI] [PMC free article] [PubMed] [Google Scholar]
- 20.Edmondson D G, Olson E N. Helix-loop-helix proteins as regulators of muscle-specific transcription. J Biol Chem. 1993;268:755–758. [PubMed] [Google Scholar]
- 21.Ellis H M, Spann D R, Posakony J W. Extramacrochaetae, a negative regulator of sensory organ development in Drosophila, defines a new class of helix-loop-helix proteins. Cell. 1990;61:27–38. doi: 10.1016/0092-8674(90)90212-w. [DOI] [PubMed] [Google Scholar]
- 22.Ellmeier W, Aguzzi A, Kleiner E, Kurzbauer R, Weith A. Mutually exclusive expression of a helix-loop-helix gene and N-myc in human neuroblastomas and in normal development. EMBO J. 1992;11:2563–2571. doi: 10.1002/j.1460-2075.1992.tb05321.x. [DOI] [PMC free article] [PubMed] [Google Scholar]
- 23.Engel P, Zhou L-J, Ord D C, Sato S, Koller B, Tedder T F. Abnormal B lymphocyte development, activation and differentiation in mice that lack or overexpress the CD19 signal transduction molecule. Immunity. 1995;3:39–50. doi: 10.1016/1074-7613(95)90157-4. [DOI] [PubMed] [Google Scholar]
- 24.Esser C, Radbruch A. Immunoglobulin class switching: molecular and cellular analysis. Annu Rev Immunol. 1990;8:717–735. doi: 10.1146/annurev.iy.08.040190.003441. [DOI] [PubMed] [Google Scholar]
- 25.Finkelman F D, Holmes J, Katona I M, Urban J F Jr, Beckmann M P, Park L S, Schooley K A, Coffman R L, Mosmann T R, Paul W E. Lymphokine control of in vivo immunoglobulin isotype selection. Annu Rev Immunol. 1990;8:303–333. doi: 10.1146/annurev.iy.08.040190.001511. [DOI] [PubMed] [Google Scholar]
- 26.Garrell J, Modolell J. The Drosophila extramacrochaetae locus, an antagonist of proneural genes that, like these genes, encodes a helix-loop-helix protein. Cell. 1990;61:39–48. doi: 10.1016/0092-8674(90)90213-x. [DOI] [PubMed] [Google Scholar]
- 27.Goldfarb A N, Flores J P, Lewandowska K. Involvement of the E2A basic helix-loop-helix protein in immunoglobulin heavy chain class switching. Mol Immunol. 1997;33:947–956. doi: 10.1016/s0161-5890(96)00047-8. [DOI] [PubMed] [Google Scholar]
- 28.Hara E, Hall M, Peters G. Cdk2-dependent phosphorylation of Id2 modulates activity of E2A-related transcription factors. EMBO J. 1997;16:332–342. doi: 10.1093/emboj/16.2.332. [DOI] [PMC free article] [PubMed] [Google Scholar]
- 29.Hara E, Yamaguchi T, Nojima H, Ide T, Campisi J, Okayama H, Oda K. Id-related genes encoding helix-loop-helix proteins are required for G1 progression and are repressed in senescent human fibroblasts. J Biol Chem. 1994;269:2139–2145. [PubMed] [Google Scholar]
- 30.Heemskerk M H, Blom B, Nolan G, Stegmann A P, Bakker A Q, Weijer K, Res P C, Spits H. Inhibition of T cell and promotion of natural killer cell development by the dominant negative helix loop helix factor Id3. J Exp Med. 1998;186:1597–1602. doi: 10.1084/jem.186.9.1597. [DOI] [PMC free article] [PubMed] [Google Scholar]
- 31.Jan Y N, Jan L Y. HLH proteins, fly neurogenesis, and vertebrate myogenesis. Cell. 1993;75:827–830. doi: 10.1016/0092-8674(93)90525-u. [DOI] [PubMed] [Google Scholar]
- 32.Jen Y, Weintraub H, Benezra R. Overexpression of Id protein inhibits the muscle differentiation program: in vivo association of Id with E2A proteins. Genes Dev. 1992;6:1466–1479. doi: 10.1101/gad.6.8.1466. [DOI] [PubMed] [Google Scholar]
- 33.Johnson J E, Birren S J, Anderson D J. Two rat homologues of Drosophila achaete-scute specifically expressed in neuronal precursors. Nature. 1990;346:858–861. doi: 10.1038/346858a0. [DOI] [PubMed] [Google Scholar]
- 34.Kelly K, Cochran B H, Stiles C D, Leder P. Cell-specific regulation of the c-myc gene by lymphocyte mitogens and platelet-derived growth factor. Cell. 1983;35:603–610. doi: 10.1016/0092-8674(83)90092-2. [DOI] [PubMed] [Google Scholar]
- 35.Lau L F, Nathans D. Expression of a set of growth-related immediate early genes in BALB/c 3T3 cells: coordinate regulation with c-fos or c-myc. Proc Natl Acad Sci USA. 1987;84:1182–1186. doi: 10.1073/pnas.84.5.1182. [DOI] [PMC free article] [PubMed] [Google Scholar]
- 36.Loveys D A, Streiff M B, Kato G I. E2A basic-helix-loop-Helix transcription factors are negatively regulated by serum growth factors and by the Id3 proteins. Nucleic Acids Res. 1996;24:2813–2820. doi: 10.1093/nar/24.14.2813. [DOI] [PMC free article] [PubMed] [Google Scholar]
- 37.Ma L, Hu B, Kenter A L. Ig S gamma-specific DNA binding protein SNAP is related to the helix-loop-helix transcription factor E47. Int Immunol. 1997;9:1021–1029. doi: 10.1093/intimm/9.7.1021. [DOI] [PubMed] [Google Scholar]
- 38.Massari M E, Rivera R R, Voland J R, Quong M W, Breit T M, van Dongen J J M, de Smit O D, Murre C. Characterization of ABF-1, a novel basic helix-loop-helix transcription factor expressed in activated B lymphocytes. Mol Cell Biol. 1998;18:3130–3139. doi: 10.1128/mcb.18.6.3130. [DOI] [PMC free article] [PubMed] [Google Scholar]
- 39.Mellentin J D, Smith S D, Cleary M L. Lyl-1, a novel gene altered by chromosomal translocation in T cell leukemia, codes for a protein with a helix-loop-helix DNA binding motif. Cell. 1989;58:77–83. doi: 10.1016/0092-8674(89)90404-2. [DOI] [PubMed] [Google Scholar]
- 40.Melnikova I N, Christy B A. Muscle cell differentiation is inhibited by the helix-loop-helix protein Id3. Cell Growth Differ. 1996;7:1067–1079. [PubMed] [Google Scholar]
- 41.Meyer K B, Skogberg M, Margenfeld C, Ireland J, Pettersson S. Repression of the immunoglobulin heavy chain 3′ enhancer by helix-loop-helix protein Id3 via a functionally important E47/E12 binding site: implications for developmental control of enhancer function. Eur J Immunol. 1995;25:1770–1777. doi: 10.1002/eji.1830250643. [DOI] [PubMed] [Google Scholar]
- 42.Moldes M, Lasnier F, Feve B, Pairault J, Djian P. Id3 prevents differentiation of preadipose cells. Mol Cell Biol. 1997;17:1796–1804. doi: 10.1128/mcb.17.4.1796. [DOI] [PMC free article] [PubMed] [Google Scholar]
- 43.Mond J J, Lees A, Snapper C M. T cell-independent antigens type 2. Annu Rev Immunol. 1995;13:655–692. doi: 10.1146/annurev.iy.13.040195.003255. [DOI] [PubMed] [Google Scholar]
- 44.Murphy J J, Norton J D. Cell-type-specific early response gene expression during plasmacytoid differentiation of human B lymphocytic leukemia cells. Biochim Biophys Acta. 1990;1049:261–271. doi: 10.1016/0167-4781(90)90096-k. [DOI] [PubMed] [Google Scholar]
- 45.Murre C, McCaw P S, Baltimore D. A new DNA binding and dimerization motif in immunoglobulin enhancer binding, daughterless, MyoD, and myc proteins. Cell. 1989;56:777–783. doi: 10.1016/0092-8674(89)90682-x. [DOI] [PubMed] [Google Scholar]
- 46.Murre C, McCaw P S, Vaessin H, Caudy M, Jan L Y, Jan Y N, Cabrera C V, Buskin J N, Hauschka S D, Lassar A B, Weintraub H, Baltimore D. Interactions between heterodimeric helix-loop-helix proteins generate complexes that bind specifically to a common DNA sequence. Cell. 1989;58:537–544. doi: 10.1016/0092-8674(89)90434-0. [DOI] [PubMed] [Google Scholar]
- 47.Prabhu S, Ignatova A, Park S T, Sun X H. Regulation of the expression of cyclin-dependent kinase inhibitor p21 by E2A and Id proteins. Mol Cell Biol. 1997;17:5888–5896. doi: 10.1128/mcb.17.10.5888. [DOI] [PMC free article] [PubMed] [Google Scholar]
- 48.Riechmann V, van Cruchten I, Sablitzky F. The expression pattern of Id4, a novel dominant negative helix-loop-helix protein, is distinct from Id1, Id2 and Id3. Nucleic Acids Res. 1994;22:749–755. doi: 10.1093/nar/22.5.749. [DOI] [PMC free article] [PubMed] [Google Scholar]
- 49.Roberts V J, Steenbergen R, Murre C. Localization of E2A mRNA expression in developing and adult rat tissues. Proc Natl Acad Sci USA. 1993;90:7583–7587. doi: 10.1073/pnas.90.16.7583. [DOI] [PMC free article] [PubMed] [Google Scholar]
- 50.Rupp R A, Weintraub H. Ubiquitous MyoD transcription at the midblastula transition precedes induction-dependent MyoD expression in presumptive mesoderm of X. laevis. Cell. 1991;65:927–937. doi: 10.1016/0092-8674(91)90545-a. [DOI] [PubMed] [Google Scholar]
- 51.Sato S, Ono N, Steeber D, Pisetsky D, Tedder T F. CD19 regulates B lymphocyte signaling thresholds critical for the development of B-1 lineage cells and autoimmunity. J Immunol. 1996;157:4371–4378. [PubMed] [Google Scholar]
- 52.Schlissel M, Voronova A, Baltimore D. Helix-loop-helix transcription factor E47 activates germ-line immunoglobulin heavy-chain gene transcription and rearrangement in a pre-T-cell line. Genes Dev. 1991;5:1367–1376. doi: 10.1101/gad.5.8.1367. [DOI] [PubMed] [Google Scholar]
- 53.Severinson E, Fernandez C, Stavnezer J. Induction of germ-line immunoglobulin heavy chain transcripts by mitogens and interleukins prior to switch recombination. Eur J Immunol. 1990;20:1079–1084. doi: 10.1002/eji.1830200520. [DOI] [PubMed] [Google Scholar]
- 54.Shen C-P, Kadesch T. B-cell-specific DNA binding by an E47 homodimer. Mol Cell Biol. 1995;15:4518–4524. doi: 10.1128/mcb.15.8.4518. [DOI] [PMC free article] [PubMed] [Google Scholar]
- 55.Shoji W, Yamamoto T, Obinata M. The helix-loop-helix protein Id inhibits differentiation of murine erythroleukemia cells. J Biol Chem. 1994;269:5078–5084. [PubMed] [Google Scholar]
- 56.Snapper C M, Paul W E. Interferon-gamma and B cell stimulatory factor-1 reciprocally regulate Ig isotype production. Science. 1987;236:944–947. doi: 10.1126/science.3107127. [DOI] [PubMed] [Google Scholar]
- 57.Solvason N, Wu W W, Kabra N, Wu X, Lees E, Howard M C. Induction of cell cycle regulatory proteins in anti-immunoglobulin-stimutated mature B lymphocytes. J Exp Med. 1997;184:407–417. doi: 10.1084/jem.184.2.407. [DOI] [PMC free article] [PubMed] [Google Scholar]
- 58.Stanton L W, Fahrlander P D, Tesser P M, Marcu K B. Nucleotide sequence comparison of normal and translocated murine c-myc genes. Nature. 1984;310:423–425. doi: 10.1038/310423a0. [DOI] [PubMed] [Google Scholar]
- 59.Sun X H. Constitutive expression of the Id1 gene impairs mouse B cell development. Cell. 1994;79:893–900. doi: 10.1016/0092-8674(94)90078-7. [DOI] [PubMed] [Google Scholar]
- 60.Sun X H, Copeland N G, Jenkins N A, Baltimore D. Id proteins Id1 and Id2 selectively inhibit DNA binding by one class of helix-loop-helix proteins. Mol Cell Biol. 1991;11:5603–5611. doi: 10.1128/mcb.11.11.5603. [DOI] [PMC free article] [PubMed] [Google Scholar]
- 61.Swat W, Dessing M, von Boehmer H, Kisielow P. CD69 expression during selection and maturation of CD4+8+ thymocytes. Eur J Immunol. 1993;23:739–746. doi: 10.1002/eji.1830230326. [DOI] [PubMed] [Google Scholar]
- 62.Testi R, Phillips J H, Lanier L L. Leu 23 induction as an early marker of functional CD3/T cell antigen receptor triggering. Requirement for receptor cross-linking, prolonged elevation of intracellular [Ca++] and stimulation of protein kinase C. J Immunol. 1989;142:1854–1860. [PubMed] [Google Scholar]
- 63.Voronova A, Baltimore D. Mutations that disrupt DNA binding and dimer formation in the E47 helix-loop-helix protein map to distinct domains. Proc Natl Acad Sci USA. 1990;87:4722–4726. doi: 10.1073/pnas.87.12.4722. [DOI] [PMC free article] [PubMed] [Google Scholar]
- 64.Weintraub H. The MyoD family and myogenesis: redundancy, networks, and thresholds. Cell. 1993;75:1241–1244. doi: 10.1016/0092-8674(93)90610-3. [DOI] [PubMed] [Google Scholar]
- 65.White P S, Maris J M, Beltinger C, Sulman E, Marshall H N, Fujimori M, Kaufman B A, Biegel J A, Allen C, Hilliard C, Valentine M B, look A T, Enomoto H, Sakiyama S, Brodeur G M. A region of consistent deletion in neuroblastoma maps within human chromosome 1p36.2-36.3. Proc Natl Acad Sci USA. 1995;92:5520–5524. doi: 10.1073/pnas.92.12.5520. [DOI] [PMC free article] [PubMed] [Google Scholar]
- 66.Wilson R B, Kiledjian M, Shen C P, Benezra R, Zwollo P, Dymecki S M, Desiderio S V, Kadesch T. Repression of immunoglobulin enhancers by the helix-loop-helix protein Id: implications for B-lymphoid-cell development. Mol Cell Biol. 1991;11:6185–6191. doi: 10.1128/mcb.11.12.6185. [DOI] [PMC free article] [PubMed] [Google Scholar]
- 67.Xin X Q, Nelson C, Collins L, Dorshkind K. Kinetics of E2A basic helix-loop-helix-protein expression during myelopoiesis and primary B cell differentiation. J Immunol. 1994;151:5398–5407. [PubMed] [Google Scholar]
- 68.Yan W, Young A Z, Soares V C, Kelley R, Benezra R, Zhuang Y. High incidence of acute T-cell tumors in E2A-null mice and E2A/Id1 double knockout mice. Mol Cell Biol. 1997;17:7317–7327. doi: 10.1128/mcb.17.12.7317. [DOI] [PMC free article] [PubMed] [Google Scholar]
- 69.Zelazowski P, Collins J T, Dunnick W, Snapper C M. Antigen receptor cross-linking differentially regulates germ-line CH ribonucleic acid expression in murine B cells. J Immunol. 1995;154:1223–1231. [PubMed] [Google Scholar]
- 70.Zhuang Y, Bardnt R J, Pan L, Kelley R, Dai M. Functional replacement of the mouse E2A gene with a human HEB cDNA. Mol Cell Biol. 1998;18:3340–3349. doi: 10.1128/mcb.18.6.3340. [DOI] [PMC free article] [PubMed] [Google Scholar]
- 71.Zhuang Y, Cheng P, Weintraub H. B-lymphocyte development is regulated by the combined dosage of three basic helix-loop-helix genes, E2A, E2-2, and HEB. Mol Cell Biol. 1996;16:2898–2905. doi: 10.1128/mcb.16.6.2898. [DOI] [PMC free article] [PubMed] [Google Scholar]
- 72.Zhuang Y, Soriano P, Weintraub H. The helix-loop-helix gene E2A is required for B cell formation. Cell. 1994;79:875–884. doi: 10.1016/0092-8674(94)90076-0. [DOI] [PubMed] [Google Scholar]
