A Bromodomain Protein, MCAP, Associates with Mitotic Chromosomes and Affects G2-to-M Transition (original) (raw)
Abstract
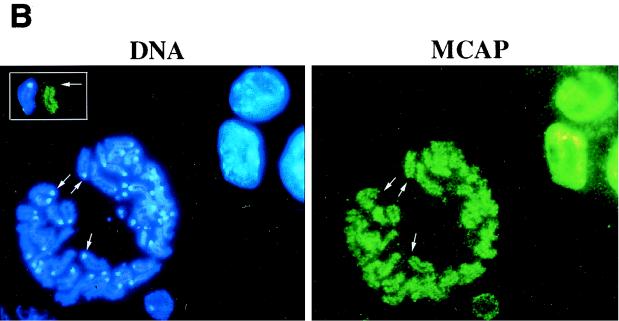
We describe a novel nuclear factor called mitotic chromosome-associated protein (MCAP), which belongs to the poorly understood BET subgroup of the bromodomain superfamily. Expression of the 200-kDa MCAP was linked to cell division, as it was induced by growth stimulation and repressed by growth inhibition. The most notable feature of MCAP was its association with chromosomes during mitosis, observed at a time when the majority of nuclear regulatory factors were released into the cytoplasm, coinciding with global cessation of transcription. Indicative of its predominant interaction with euchromatin, MCAP localized on mitotic chromosomes with exquisite specificity: (i) MCAP-chromosome association became evident subsequent to the initiation of histone H3 phosphorylation and early chromosomal condensation; and (ii) MCAP was absent from centromeres, the sites of heterochromatin. Supporting a role for MCAP in G2/M transition, microinjection of anti-MCAP antibody into HeLa cell nuclei completely inhibited the entry into mitosis, without abrogating the ongoing DNA replication. These results suggest that MCAP plays a role in a process governing chromosomal dynamics during mitosis.
The bromodomain is a conserved sequence motif present in a diverse array of proteins (14, 21). Although its function is not fully understood, a recent nuclear magnetic resonance study indicates that a bromodomain forms a bundle of four α helices (8), which may serve as a chromatin-targeting module (57). Proteins containing bromodomains have been classified into several distinct subgroups, which include the SWI/SNF subgroup, the coactivator subgroup such as CREB-binding protein (CBP) and p300, as well as the histone acetylase subgroup (21). Mammalian RING3 (2, 6, 43, 49), Drosophila FSH (9), and yeast BDF1 (3, 26) and BDF2 (Sacch database [YDL070W]) belong to another, less understood subgroup, BET. Proteins of the BET subgroup have two bromodomains that are more similar within the subgroup than other subgroups. In addition, they carry an ET domain, whose function is also obscure (21, 50). RING3, mapped to the major histocompatibility complex (2), is a component of transcription factor mediators (23) and is reported to be a nuclear kinase (6), although kinase activity is not confirmed with the murine homologue, Fsrg1 (43). The yeast homologue, BDF1, interacts with general transcription factors (30) and regulates transcription (26). It also localizes to meiotic and mitotic chromosomes and is implicated in control of cell growth (3).
A series of dramatic events follow when cells transit from G2 to M (11). During this period, chromosomal architecture undergoes immense changes. Sister chromatids, joined together by cohesion, condense in a spatially and temporally ordered manner, and line up on the metaphase plate. They are then pulled apart to opposite poles through spindle contraction. Recent studies have identified a number of proteins involved in chromosomal cohesion and condensation, many of which belong to the SMC family and are conserved throughout eukaryotes (13, 18, 22, 35, 58). Histone H3 phosphorylation and topoisomerase II are also critical for chromosomal condensation and segregation (16, 20, 55).
Accompanying these structural alterations, immense functional changes occur during mitosis. Transcription by all three RNA polymerases shuts down, with the exception of few genes still transcribed during mitosis (12, 41). Coinciding with chromosomal condensation, many general and specific transcription factors are dispersed into the cytoplasm and/or inactivated by phosphorylation (29, 45). Some promoters become devoid of transcription factor occupancy as well as transcription elongation complexes (17, 29, 38). Chromatin-remodeling factors of the SWI/SNF family are also released into the cytoplasm and become inactive during mitosis (33, 46). Transcription resumes in the newly divided cells when chromosomes decondense. Transcriptional repression during mitosis is apparently more prominent in cells of higher eukaryotes than in yeast cells, where transcription continues throughout the cell cycle (35). Although the mechanism controlling mitotic transcriptional repression has not been completely elucidated, it is thought to be relevant to reprogramming of gene expression patterns in newly formed daughter cells (32).
The present work describes a novel member of the BET subgroup of the bromodomain superfamily, called MCAP, whose expression is induced by growth stimulation and down-regulated by growth inhibition. Interestingly, MCAP localizes to the condensed chromosomes during mitosis when many other nuclear regulatory factors are dispersed into the cytoplasm. Analysis of MCAP localization during mitosis reveals an interesting spatial specificity supporting its predominant interaction with the euchromatic regions of chromosomes. Antibody microinjection experiments indicate that MCAP has a role in cell cycle progression to mitosis. The possible significance of MCAP behavior during mitosis is discussed in terms of regulation of various mitotic events such as transcription factor dynamics.
MATERIALS AND METHODS
Cloning of murine MCAP cDNA.
A 150-bp bromodomain fragment was isolated from a murine F9 λZAP cDNA library by PCR using degenerate primers and was used as a probe to rescreen the same library. A 2,520-bp fragment obtained was used for a third screening of F9 λZAP and adult murine thymus UniZAP libraries (Stratagene; a gift from P. Love). Inserts of several clones were appropriately excised and recloned into pBluescript to construct a full-length cDNA. Green fluorescent protein (GFP) fusion vectors were constructed by inserting MCAP cDNA into pGFP-C1 or histone H2B cDNA into pGFP-N1 (Clontech).
MCAP antibodies.
Rabbit polyclonal antibody was raised against a recombinant MCAP peptide corresponding to amino acid positions 156 to 285, expressed in pET15b (Novagen) (N-MCAP). Another rabbit antibody was produced against a 14-amino-acid-long synthetic peptide corresponding to the C terminus of MCAP (C-MCAP). Sera were purified on protein G-Sepharose beads (Amersham). Antibody specificity was confirmed by absorption of the reactivity by excess immunogens.
Fluorescence in situ hybridization (FISH) analysis.
A procedure described in reference 42 was used. Briefly, a 18-kb mouse genomic fragment containing a 5′ flanking sequence and first five exons of MCAP in the EMBL-4 vector was labeled with biotin-16-dUTP (Boehringer Mannheim) by nick translation. Samples placed on slides were digested by RNase (20 mg/ml), treated with pepsin, and fixed with 1% formaldehyde. Samples were further denatured in 70% formamide–2× SSC (1× SSC is 0.15 M NaCl plus 0.015 M sodium citrate), ethanol dehydrated, and allowed to hybridize for 3 days at 37°C. Detection was performed by tyramide signal amplification (NEN Life Science). Images were captured using a Zeiss fluorescent microscope equipped with a cooled charge-coupled device camera, controlled by IP-Lab software (Scanalysis, Inc.). Images were acquired with a 63× objective using specific filter cubes (Chroma).
Lymphocytes and cell lines.
Spleen cells (106 cells/ml) from 5- to 8-week-old C57BL/6 mice were cultured in RPMI 1640 containing 10% fetal bovine serum (FBS) supplemented with 5 × 10⁻⁵ M 2-mercaptoethanol and stimulated with concanavalin A (ConA; 1 μg/ml) or bacterial lipopolysaccharide (LPS; 1 μg/ml) (both from Sigma). To measure proliferation, cells were incubated with [3H]thymidine (1 μCi/ml; Amersham) for 2 h prior to harvest (4). Myeloid progenitor 32D cells (47) were maintained in the same medium as above supplemented with 10% WEHI3 supernatants as a source of interleukin-3 (IL-3). To induce growth arrest, cells were incubated in the absence of WEHI3 supernatants or 6 h. P19 embryonal carcinoma cells were maintained in alpha minimal essential medium with 10% FBS and treated with 1 μM all-trans retinoic acid (RA) (Sigma) (19). HeLa, NIH 3T3, and NRK cells were maintained in Dulbecco's modified Eagle medium with 10% FBS.
Semiquantitative RT-PCR and immunoblot analysis.
MCAP transcripts were detected from total RNA by semiquantitative reverse transcription-PCR (RT-PCR) (54), using primers 5′-TGAAGAGCCAGTTGTTAC-3′ and 5′-CTTCATCTTGGAAGAACC-3′, which generated a 705-bp fragment in PCRs. A 1:5 dilution of reverse transcription mixture was used for PCR. PCR (30 cycles for MCAP; 28 cycles for hypoxanthine phosphoribosyltransferase [HPRT], run as a control) was run at 94°C for 1 min, 54°C for 1 min, and 72°C for 1 min. For immunoblot analysis, nuclear extracts (2 to 10 μg of protein) prepared as described elsewhere (7) were separated by sodium dodecyl sulfate-polyacrylamide gel electrophoresis (SDS-PAGE) on a 6% gel and blotted onto ImmobilonP (Millipore). Filters were incubated with a 1:10,000 dilution of anti-MCAP antibody. Bound antibodies were detected by the Amersham ECL kit.
Immunofluorescent staining.
Approximately 105 HeLa cells or P19 cells grown on coverslips were fixed in 4% paraformaldehyde for 20 min at room temperature. Cells were incubated first in blocking buffer for 20 min and then with rabbit antibody to MCAP (N-MCAP, diluted at 1:500 in blocking buffer), Sp1 or CBP (both diluted at 1:50; Santa Cruz), phosphorylated histone (phospho-histone) H3 (diluted at 1/100; Upstate Biotechnology), or mouse monoclonal anti-β-tubulin antibody (1:250; Sigma) for 60 min. Cells were washed and further incubated with biotinylated anti-rabbit immunoglobulin G (IgG; 1:200) for 1 h and with Cy2-conjugated streptavidin (1:100) (both from Amersham) or rhodamine-conjugated anti-mouse IgG (Cappel) for 30 min. Cells were counterstained with Hoechst 33342 (1 μg/ml) for 5 min. To prepare spread chromosomes, P19 cells were incubated with a hypotonic buffer (10 mM HEPES [pH 7.0], 30 mM glycerol, 1 mM CaCl2, 0.8 mM MgCl2) for 10 min at 4°C (27) and cytospun on a slide prior to incubation with antibody. Details of immunostaining are described elsewhere (29). Stained cells were viewed with a Zeiss Axiophot microscope using a 63× planachromat or a 100× planneofluar oil immersion objective.
Three-dimensional reconstruction of z sections and photobleaching.
The procedure followed is described in reference 10. Briefly, HeLa or NRK cells (105) grown on a coverslip were transfected with 0.1 to 1 μg of GFP-MCAP cDNA using the Lipofectamine-Plus reagent (Bethesda Research Laboratory). Live GFP-MCAP-expressing cells were analyzed by optical sectioning on a Zeiss LSM 410 confocal microscope using a Zeiss 100× NA 1.4 planachromat oil immersion objective. A stack of 24 x-y sections was reconstructed for a three-dimensional image.
Twelve hours after transfection with GFP-MCAP or histone H2B-GFP, cDNA was subjected to fluorescence recovery after photobleaching (FRAP) experiments. Briefly, the prebleach intensity was recorded with attenuated 488-nm Ar laser excitation (20% power, 1% transmission) of a Zeiss LSM 410 confocal microscope. Subsequently, a 4-μm-wide strip across the entire nucleus was photobleached with full laser intensity (100% power, 100% transmission), and immediately afterward recovery of fluorescence was recorded with attenuated light until the intensity reached a stable plateau.
Biochemical solubility of MCAP.
HeLa cells were treated with nocodazole (0.04 μg/ml; Sigma) for 6 h, and mitotic cells were harvested by mechanical shaking, which yielded mitotic cells of >95% purity. Asynchronous and mitotic cells were incubated in 5 volumes of ice-cold hypotonic buffer (10 mM HEPES [pH 7.4], 10 mM NaCl, 3 mM MgCl2, 1 mM dithiothreitol) containing a proteinase inhibitor cocktail (Boehringer), AEBSF (1 mM), phosphatase inhibitors Na3 VO4 (1 mM), Na2MoO4 (100 μM), and NaF (10 mM) and then lysed using a 25-gauge needle. The lysates were divided into three parts, each incubated with the same buffer containing 100, 200, or 300 mM NaCl for 20 min at 4°C. The soluble and insoluble fractions were separated by centrifugation at 5,000 rpm for 5 min at 4°C. Pellets were incubated with the same buffer containing 20 mM MgCl2 and 0.2 U of DNase I (Boehringer) per ml for 30 min at 37°C. Samples were fractionated by SDS-PAGE on a 4 to 20% gel and immunoblotted with antibodies for MCAP, TFIIB, or histone H3.
Antibody microinjection.
HeLa cells plated on Cellocate coverslips (Eppendorf) were synchronized by a double-thymidine block (48). Briefly, cells were incubated in 2.5 mM thymidine for 14 h, then without thymidine for 8.5 h, and finally with thymidine again for 14 h. Cells were washed and allowed to stand in complete medium for indicated periods of time. Synchronization of cells used for injections was monitored by fluorescence-activated cell sorting (FACS) analysis, bromodeoxyuridine (BrdU) incorporation, and mitotic indices. Purified anti-MCAP IgG (N-MCAP; 1 μg/μl) or preimmune IgG (1 μg/μl) was injected directly into the nuclei using a Femtotip (Eppendorf) in the presence of complete medium supplemented with 25 mM HEPES (pH 7.5). Cells in early S or G2 phase were injected with antibody 1 or 6 h after removal of thymidine. In some experiments, cells were incubated with 10 μM BrdU (Amersham) immediately after injection. Cells were then incubated in the complete medium for indicated periods of time. Soon after cells reached M stage, they were fixed and stained with biotinylated anti-rabbit antibody and streptavidin-Cy3 and counterstained with Hoechst 33342. In BrdU-treated samples, cells were treated with 2 M HCl followed by 0.25% Triton X-100, and incorporated BrdU was detected with monoclonal anti-BrdU antibody (PharMingen), reacted with biotinylated anti-mouse antibody and streptavidin-conjugated Cy2.
RESULTS
MCAP is a conserved bromodomain protein.
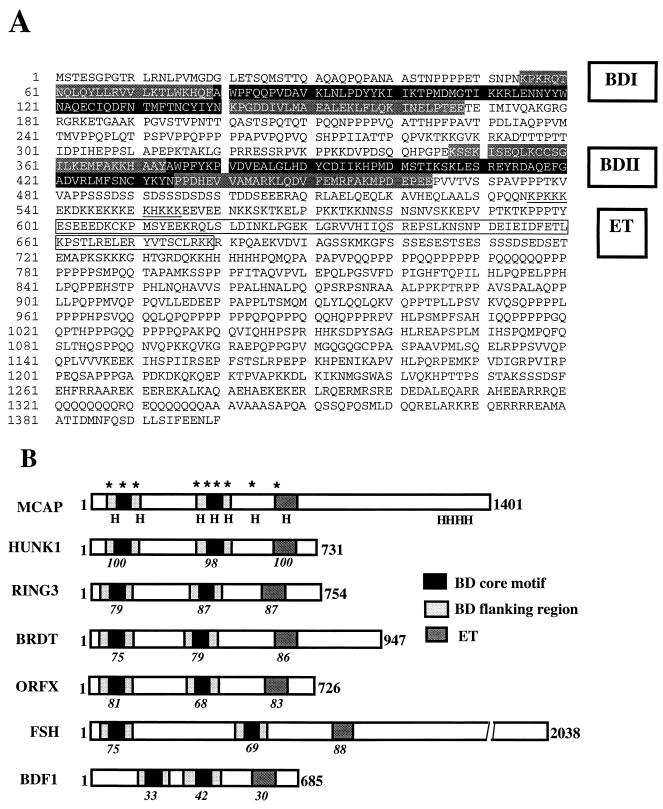
A bromodomain is found in a growing number of proteins involved in the regulation of nuclear activities (15, 21). Recent information on lower eukaryote genomes indicates the presence of additional bromodomain-containing proteins in higher eukaryotes. To identify novel mammalian proteins carrying a bromodomain, we screened mouse cDNA libraries with a 150-bp PCR fragment containing a part of bromodomain sequence. By assembling five overlapping cDNAs obtained by several cycles of screening, we generated a full-length clone of 5,281 bp. The predicted first methionine was identified at nucleotide position +35 preceded by stop codons in all three reading frames. The assembled MCAP cDNA encodes a protein of 1,400 amino acids, which we designated MCAP (mitotic chromosome-associated protein). It has two bromodomains in the N-terminal region and an ET domain in the more C-terminal region, a characteristic feature of the BET subgroup of the bromodomain superfamily (Fig. 1A) (21, 50). This subgroup includes the human RING3, Drosophila FSH, and yeast BDF1/BDF2. Similar to other members of the BET subgroup, the MCAP bromodomains contain a core motif and flanking motifs (14, 21), which likely form a helical bundle (8). MCAP carries a stretch of amino acids homologous to the “kinase like motifs” described for RING3 (6). As shown in Fig. 1B, four mammalian cDNAs show homology with MCAP: HUNK1, RING3 (Fsrg1), BRDT, and ORFX (24, 43, 49, 51). MCAP shows highest homology to the uncharacterized human cDNA HUNK1 (y12059) and to cosmids (R28194 and R31546 [GenBank accession no. AC003111 and AC004798]). The HUNK1 cDNA, however, encodes a protein of 722 amino acids, much smaller than MCAP.
FIG. 1.
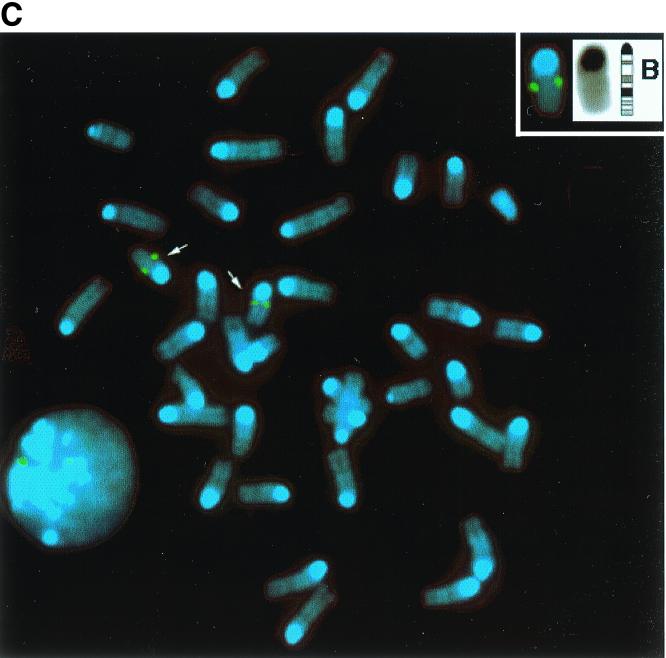
Amino acid sequence and chromosomal mapping of murine MCAP. (A) Predicted amino acid sequence of MCAP. A single open reading frame containing 1,400 amino acids was derived from a 5,281-bp cDNA. Two bromodomains (BDI and BDII) are shaded (black; core motif; light gray; flanking motif). The dark gray box represents the ET domain. (B) Comparison with other BET subgroup members. The number in italics below each motif represents the percent amino acid homology with MCAP; an asterisk indicates a kinase-like motif; H indicates a predicted helix. (C) FISH mapping of MCAP to murine chromosome 17. Normal male mouse metaphase chromosomes showing two signals (arrows) were visualized with fluorescein isothiocyanate (green dots) and counterstained with 4′, 6-diamidino-2-phenylindole (DAPI) (blue). The inset reveals chromosome 17 in the inverted DAPI image and ideogram for chromosome 17. The position of the hybridization signal was determined by alignment of band B. Note that two signals can also be seen in the interphase nucleus.
In vitro translation of full-length MCAP cDNA produced a protein of approximately 200 kDa, larger than the deduced molecular mass of 155 kDa. A posttranslational modification or a protein secondary structure may account for the difference (see below). Northern blot analysis revealed a single RNA species of ∼6.5 kb, ubiquitously expressed in mouse adult and embryonic tissues and in human cells (not shown).
The murine MCAP gene is mapped to chromosome 17.
Genetic mapping of the murine MCAP gene was done by FISH analysis. A biotinylated 18-kb genomic fragment of MCAP was hybridized to normal, mitogen-stimulated male spleen cells. A clear single hybridization signal was detected on the distal region of band B, chromosome 17, in the vicinity of the complement component 3 (C3) locus (Fig. 1C). This region is syntenic to human chromosome 19, in which the human homologue HUNK1 has been mapped. It is of note that mouse RING3 (Fsrg1) is also localized on chromosome 17, but within the major histocompatibility complex (2, 50), located proximal to the C3 locus.
MCAP is a nuclear protein broadly expressed in mouse tissues.
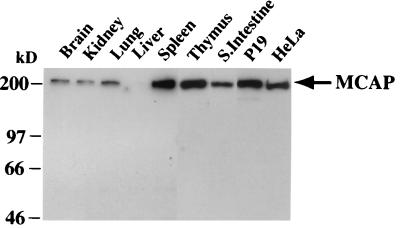
Immunoblot analysis was performed using two antibodies raised against a N-terminal or C-terminal region of MCAP. As shown in Fig. 2, both antibodies revealed a 200-kDa protein expressed in the nuclear fraction of all mouse tissues tested. MCAP was expressed at the highest levels in spleen and thymus; expression was lower in liver and brain. The antibodies also reacted with a 200-kDa nuclear protein in cultured cells, e.g., mouse P19 and human HeLa cells (Fig. 2). In all cases no other bands were detected, in agreement with a single RNA species. The cytoplasmic fractions were devoid of antibody reactivity (not shown; see Fig. 4). The antibodies also immunoprecipitated a 200-kDa protein from in vitro-translated MCAP as well as from nuclear extracts of various cells (not shown).
FIG. 2.
MCAP protein expression detected by immunoblot analysis using anti-MCAP antibody with 10 μg of nuclear extracts from adult mouse tissues, HeLa cells, or P19 cells. S. Intestine, small intestine.
FIG. 4.
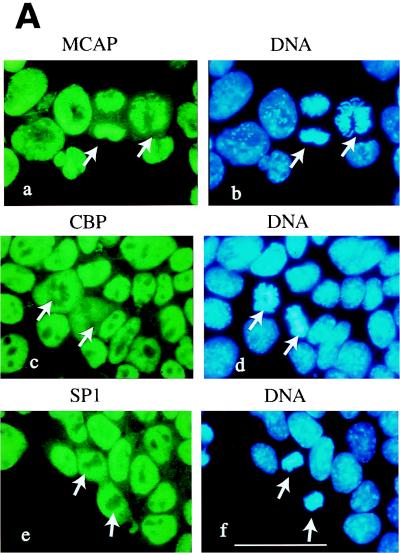
Localization of MCAP on mitotic chromosomes. (A) Indirect immunofluorescent staining of P19 cells. P19 cells were fixed with paraformaldehyde and stained with antibodies against MCAP (N-MCAP) (a), CBP (c), or Sp1 (e) and counterstained with Hoechst 33342 (b, d, and f). In image a, MCAP is present on mitotic chromosomes in two mitotic cells (arrows); in images c and e, CBP and Sp1 are dispersed into the cytoplasm and are absent from mitotic chromosomes. All three factors are present in the interphase nuclei. The bar in image F corresponds to 10 μm. (B) Absence of MCAP from centromeres. P19 cells treated with hypotonic buffer were stained with anti-MCAP antibody and counterstained with Hoechst 33342 as above. Note that the entire axis of chromosomes is stained with MCAP except for the centromeres (arrows). The inset is an example of a chromosome showing the absence of MCAP from the centromeres at the end of chromosomes that are intensely stained with Hoechst (arrows).
MCAP expression is enhanced by growth-stimulatory signals and repressed by growth-inhibitory signals.
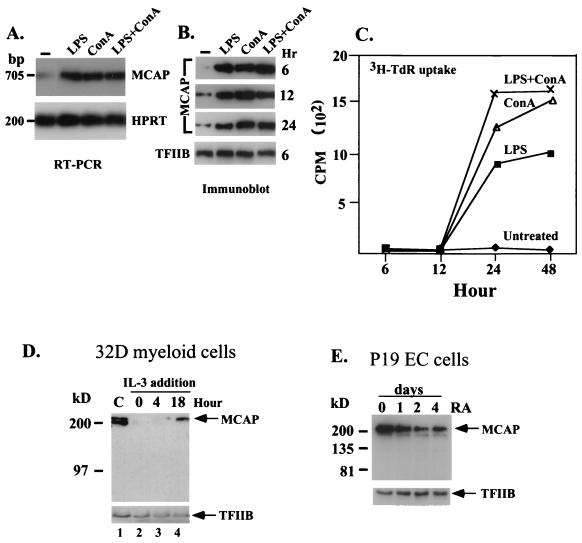
Data in Fig. 2 suggested that MCAP expression correlated with the presence of proliferating cells in tissues. To examine whether MCAP expression is linked to cell proliferation, we first tested mitogen-stimulated lymphocytes. Mouse spleen cells were stimulated by bacterial LPS or ConA, a B-cell- or T-cell-specific mitogen, respectively, and MCAP expression was tested by RT-PCR and immunoblot assays. As shown in Fig. 3A and B, untreated lymphocytes expressed very low levels of MCAP, as the majority of cells were quiescent. However, within 6 h of treatment with either mitogen, MCAP expression was markedly increased at both RNA and protein levels (Fig. 3A and B). The protein levels reached maximum at 6 h and persisted until 24 h. A slight increase in untreated cells at 12 and 24 h was presumably due to activation of some cells by serum factors. Expression of TFIIB, tested as a control, remained at a constant level in these cells (Fig. 3B). To assess a relationship between MCAP expression and DNA synthesis, we examined the kinetics of [3H]thymidine ([3H]TdR) incorporation. As seen in Fig. 3C, [3H]TdR incorporation was at a background level 6 and 12 h after stimulation when MCAP protein expression was already at maximum. An increase in [3H]TdR uptake was detected only at 24 h, after which levels remained high for an additional 24 h. Thus, the onset of DNA synthesis lagged behind that of MCAP expression. These results indicate that MCAP is induced by mitogen stimulation during the G0/G1 transition in lymphocytes, prior to the entry into S phase.
FIG. 3.
MCAP expression is linked to cell growth. (A) Induction of MCAP RNA in mitogen-stimulated lymphocytes. Spleen cells were stimulated by indicated mitogens for 6 h, and MCAP transcripts were detected by semiquantitative RT-PCR. HPRT transcripts were tested as a control for RNA loading. (B) Induction of MCAP protein in mitogen-stimulated lymphocytes. Nuclear extracts (2.5 μg) from spleen cells stimulated by indicated mitogens were analyzed for MCAP expression by immunoblot assay. TFIIB was tested as a control for protein loading. (C) [3H]TdR uptake. Spleen cells stimulated by mitogens were labeled with 1 μCi of [3H]TdR at indicated times for 2 h. Values represent averages of triplicate determinations. (D) Inhibition of MCAP protein expression following IL-3 withdrawal. 32D cells were grown in the presence (lane 1) or absence (lane 2) of IL-3 for 6 h, or IL-3 was added back for 4 or 18 h (lanes 3 and 4). Nuclear extracts (5 μg) were analyzed by immunoblot assay. (E) Down-regulation of MCAP protein expression in P19 cells after RA treatment. Nuclear extracts (10 μg) from P19 cells treated with 1 μM of all-trans RA for indicated days were analyzed by immunoblot assay.
Next, we evaluated MCAP expression in an opposite situation, where cell growth was arrested by growth factor deprivation. Immunoblot analysis was performed with 32D myeloid progenitor cells that underwent growth arrest upon IL-3 withdrawal (47) (Fig. 3D). In the presence of IL-3, MCAP was expressed at high levels in 32D cells (lane 1); within 6 h after IL-3 withdrawal, expression was completely extinguished (lane 2). MCAP expression resumed when IL-3 was added back to the medium (lanes 3 and 4).
We also tested MCAP expression in RA-treated P19 embryonal carcinoma cells, which underwent growth inhibition concurrent with the induction of differentiation (19). As seen in Fig. 3E, MCAP levels were high in rapidly proliferating, untreated P19 cells, but steadily decreased during 4 days of RA treatment. These results indicate that MCAP expression is regulated by growth-stimulatory and growth-inhibitory signals in opposite ways.
MCAP localizes on noncentromeric regions of mitotic chromosomes.
Consistent with the Western blot data above, indirect immunofluorescent staining of P19 cells detected MCAP in the nucleus but not in the cytoplasm (Fig. 4A). During interphase MCAP was uniformly distributed in the nucleus with the exception of nucleoli. However, in mitotic cells, MCAP was detected almost exclusively on condensed chromosomes (Fig. 4A, a and b). Chromosomal localization of MCAP was likewise detected on mitotic HeLa cells and 32D cells (not shown). In well-spread metaphase preparations (Fig. 4B), almost the entire length of chromosomes was intensely stained with anti-MCAP antibody. However, MCAP staining was distinctly absent from the centromeres, which showed brighter DNA staining than the rest of chromosomes (Fig. 4B, inset).
In mammalian cells, a number of transcription factors and regulatory proteins are displaced from chromosomes during mitosis, which coincides with global transcriptional repression (29, 33, 38, 45). In accordance, we found that both Sp1 and CBP, a DNA-binding transcription factor and general coactivator, respectively, were dispersed into the cytoplasm during mitosis, while they were localized in the nucleus during interphase (Fig. 4A, c to f). We noted that several other transcription factors are also dispersed into the cytoplasm during mitosis in P19 cells (not shown). These results indicate that MCAP is held onto mitotic chromosomes during when many regulatory factors are released into the cytoplasm.
MCAP staining during mitosis.
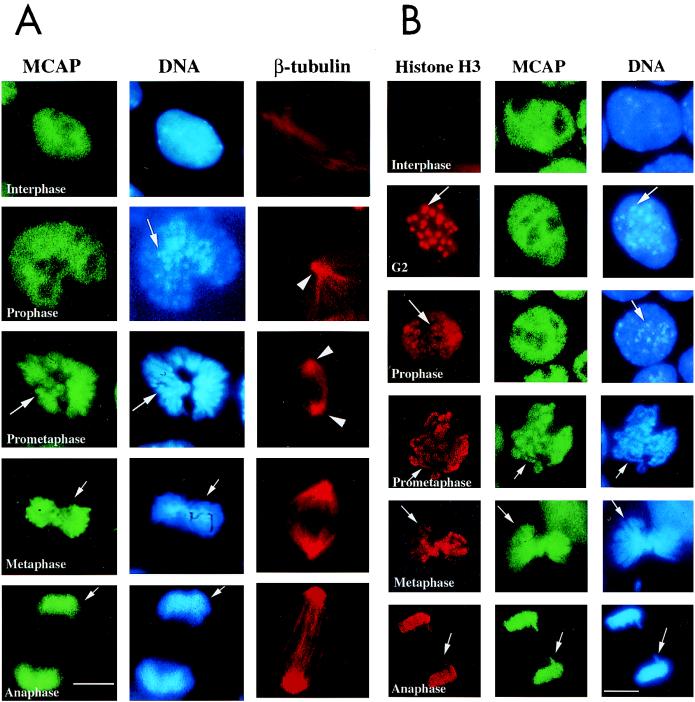
Figure 5A shows immunostaining of MCAP at different stages of mitosis. In prophase when heterochromatic regions of chromosomes began to condense, MCAP was evenly distributed in the nucleus. In the subsequent prometaphase, MCAP localization to the chromosomes became evident as chromosomal condensation intensified. At this point, MCAP showed little residual staining elsewhere in the cell. In metaphase, MCAP staining remained on fully condensed chromosomes that were assembled on the equatorial plate and attached to the spindles. In anaphase and telophase when sister chromatids separated, MCAP was still detected on the segregating chromosomes. Thus, MCAP-chromosome association becomes visible following the onset of early chromosomal condensation and persists until the end of mitosis.
FIG. 5.
Fine timing of MCAP chromosome staining. (A) P19 cells were stained with anti-MCAP antibody, Hoechst 33342, and anti-β-tubulin antibody. Arrows in prophase indicate condensing chromosomes. At this stage, MCAP distribution is uniform over the entire nucleus. In prometaphase, centrioles move toward the opposite poles (arrowheads), the nuclear membrane breaks down, and chromosome condensation increases (arrow). At this stage, chromosomes begins to be stained with MCAP antibody (arrow). During metaphase, MCAP is found entirely on fully condensed chromosomes that were assemble on the metaphase plate. MCAP remains on chromosomes in anaphase, when they are pulled apart in two daughter cells. The bar corresponds to 3.5 μm. (B) Colocalization analysis with phospho-histone H3. P19 cells were stained with antibody to phospho-histone H3, MCAP, or Hoechst 33342. In G2 and prophase, phospho-histone H3 localizes on the pericentric heterochromatin regions, which condense early and are seen as large dots (arrows in G2 and prophase). MCAP is uniformly distributed over the nucleus at these stages. When cells reach prometaphase and move from metaphase to anaphase, phospho-histone H3 staining spreads over the entire, fully condensed chromosomes, overlapping MCAP staining (arrows).
The above results raised the possibility that MCAP selectively localizes to the region of chromosomes that condense relatively late. Chromosomal condensation proceeds in a nonrandom, spatiotemporal order which can be monitored by the timing of histone H3 phosphorylation (16, 53). Histone H3 phosphorylation starts first at the pericentromeric heterochromatin and then extends to other parts of the chromosomes. We compared the timing of histone H3 phosphorylation with that of MCAP-chromosome association. As shown in Fig. 5B, a prominent dot-like staining of phospho-histone H3 was seen in G2 and prophase nuclei, corresponding to the sites of early chromosomal condensation. Staining of MCAP at those stages remained diffuse throughout the nuclei, without specifically colocalizing with phospho-histone H3. MCAP staining matched that of phospho-histone H3 only after the latter spread to the rest of the chromosomes, which began in prometaphase. These results, together with the absence of MCAP on the centromeres (Fig. 4B), suggest that MCAP predominantly associates with the late-condensing regions of the chromosomes rather than the early-condensing heterochromatic regions.
Localization of GFP-MCAP on mitotic chromosomes.
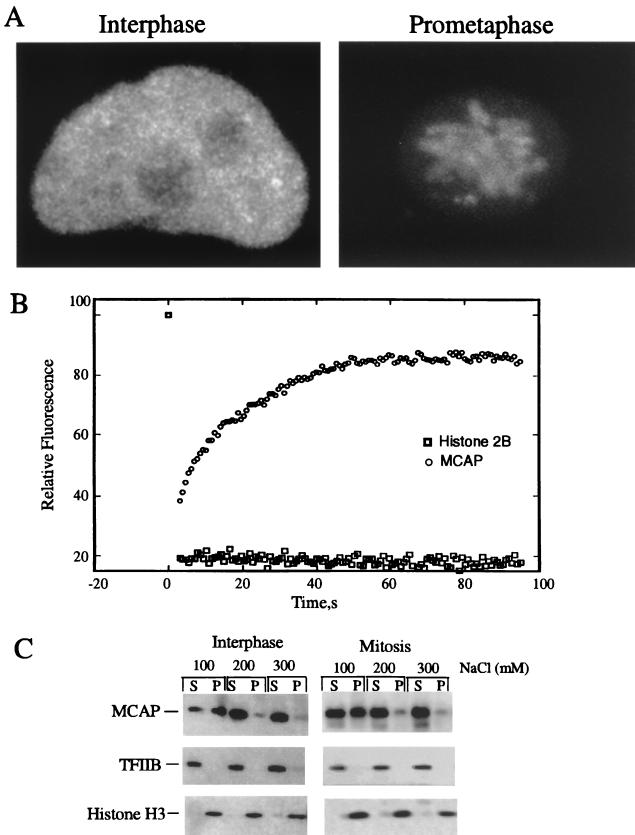
Chromosomal association of the endogenous MCAP observed above prompted us to investigate localization of an exogenously expressed MCAP. HeLa or NRK cells were transfected with a construct containing GFP-MCAP, and GFP distributions were analyzed in a series of z sections, which were reconstructed to three-dimensional images (Fig. 6A). Similar to the endogenous MCAP, GFP-MCAP was detected in the interphase nucleus as fine grains distributed evenly from the periphery to the center, except for nucleoli (Fig. 6A, left). On the other hand, during mitosis, GFP-MCAP signals smoothly outlined the condensed chromosomes (Fig. 6A, right). These observations confirm that MCAP is uniformly distributed in the nucleus during interphase and associates with chromosomes during mitosis.
FIG. 6.
(A) Three-dimensional reconstruction of GFP-MCAP localization in living cells. Three-dimensional images were reconstructed with serial z sections of HeLa or NRK cells to visualize the distribution of MCAP-GFP in the interphase (left) and in mitosis (right). (B) Mobility of MCAP by FRAP analysis. HeLa cells were transfected with GFP-MCAP or histone H2B-GFP, and recovery of fluorescence in interphase was analyzed. (C) Biochemical solubility of MCAP. Homogenates from asynchronous or mitotic HeLa cells were extracted with indicated concentrations of NaCl. Supernatants and pellets were analyzed by immunoblot analysis. Each lane was loaded with extract proteins equivalent to 105 cells.
FRAP and biochemical analysis.
To test whether MCAP is a stable component of chromatin, we used FRAP (10). This method has been used to measure mobility of intracellular molecules by the recovery of fluorescent signals after brief laser irradiation. Several previous papers on studies using this method reported that chromatin in interphase nuclei is relatively immobile and may be anchored as a defined structure (1, 28). On the other hand, recent reports on photobleaching of the high-mobility-group proteins and glucocorticoid hormone receptor (31, 39) indicate that chromatin-bound proteins can recover relatively rapidly after bleach. Thus, if MCAP is very strongly immobilized on chromatin, its exchange might be slow. FRAP analysis was performed with GFP-MCAP transfected in HeLa cells (used for Fig. 6). To compare the mobility of MCAP with that of a known chromatin component, histone H2B-GFP was analyzed in parallel. A 4-μm2 strip through the nucleus was photobleached, and recovery of fluorescence into this area was recorded until the intensity reached a stable plateau. As shown in Fig. 6B, GFP-MCAP fluorescence was reduced to background levels immediately after photobleaching but recovered ∼86% of its intensity within 1 min. By contrast, histone H2B-GFP did not recover any fluorescence over this period. These results indicate that while histone H2B, a stable component of chromatin is immobile, the majority of GFP-MCAP is capable of exchanging with a half-life of ∼4 s within the interphase nucleus. The relatively small but significant immobile fraction (∼14%) of GFP-MCAP may represent a more tightly chromatin-bound pool of the protein.
To further investigate MCAP-chromatin association, we examined the solubility of endogenous MCAP by differential salt extractions. Asynchronously growing HeLa cells or those synchronized to M phase were extracted by buffer containing increasing NaCl concentrations. The presence of MCAP in the soluble and insoluble fractions was tested by immunoblot analysis (Fig. 6C). With the lowest salt concentration (100 mM NaCl), approximately half of MCAP was present in the soluble fraction, with the rest in the insoluble fraction. But with higher NaCl concentrations (200 and 300 mM), most of MCAP was in the soluble fraction. The profile of salt solubility was essentially the same for asynchronous and mitotic cells. As expected, the general transcription factor TFIIB was found in the soluble fraction, while histone H3 was in the insoluble fraction at all NaCl concentrations tested. These results are in agreement with FRAP data above, and indicate that MCAP loosely interacts with chromatin during interphase as well as mitosis. Consistent with these findings, MCAP did not exhibit a strong binding affinity for double-stranded or single-stranded DNA in vitro.
Microinjection of anti-MCAP antibody inhibits cell cycle progression to mitosis.
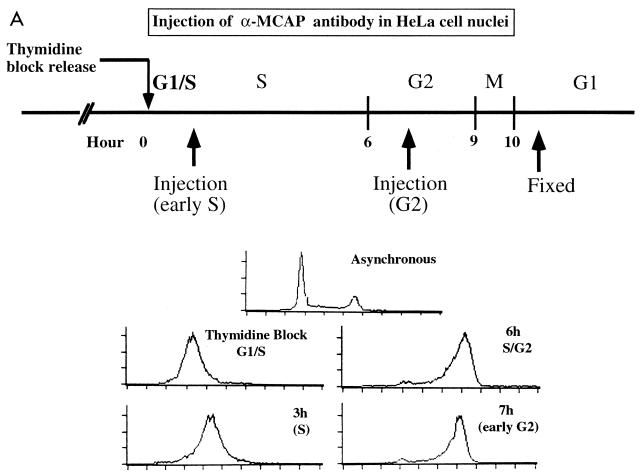
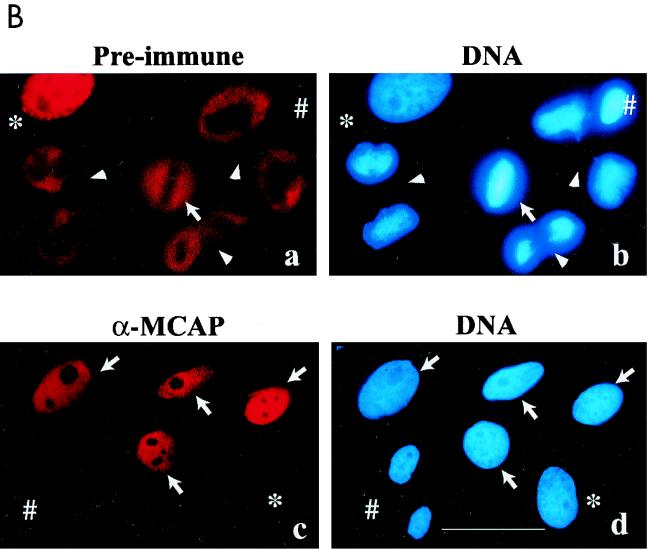
As an initial step to delineate the function of MCAP, we studied the effect of anti-MCAP antibody microinjection on cell cycle progression in HeLa cells. Cells synchronized by double-thymidine block were released and allowed to proceed through cell cycle. The diagram in Fig. 7A shows the timing of microinjection and an example of cell cycle profiles monitored during the experiments by FACS analysis. Anti-MCAP IgG was injected into the nuclei when cells were at S or in G2. Normal IgG from preimmune sera was injected as a control. In each experiment, IgG was injected into 25 to 40 nuclei. Cells were then allowed to proceed in culture until they reached mitosis. After being fixed, the cells were stained with anti-rabbit antibody coupled to biotin-streptavidin-Cy3 to distinguish injected cells from uninjected ones and with Hoechst 33342 to detect mitotic cells. Although some cells died soon after injection due to physical shock or injury, about 70% survived until the end of experiments. Table 1 shows the number of cells that successfully reached mitosis in four separate experiments. In the control groups where cells were injected with preimmune IgG, approximately 40% of cells were in mitosis as judged by Hoechst staining, irrespective of whether IgG was injected in S or G2 phase. In contrast, almost no mitotic cells were observed in the groups injected with anti-MCAP IgG regardless of growth phase (S or G2), indicating that anti-MCAP antibody inhibited entry into mitosis. Figure 7B shows injected IgG and DNA in the cells. In the preimmune IgG-injected group (Fig. 7B, a and b), three cells were in anaphase/telophase and one was in metaphase. An uninjected cell which was in metaphase was used as a control. In the group injected with anti-MCAP IgG (Fig. 7B, c and d), four injected cells had a large interphase nucleus, indicative of cells in G2, but none in mitosis. These cells did not even exhibit an early sign of mitosis, as evidenced by the lack of condensing chromosomes, consistent with the idea that MCAP antibody inhibited the entry into mitosis. Although some cells escaped synchronization, ∼40% of uninjected cells were in mitosis, similar to the control groups. The paucity of mitotic cells in the anti-MCAP IgG-injected groups was unlikely to be due to a delay in mitosis, because no mitotic cells with anti-MCAP antibody stain were detected when cells were cultured for additional 4 h and mitotic cells were monitored every hour (not shown). It was not due to the acceleration of G2/M phase either, since no newly divided cells with antibody stain were detected in the MCAP antibody-injected groups.
FIG. 7.
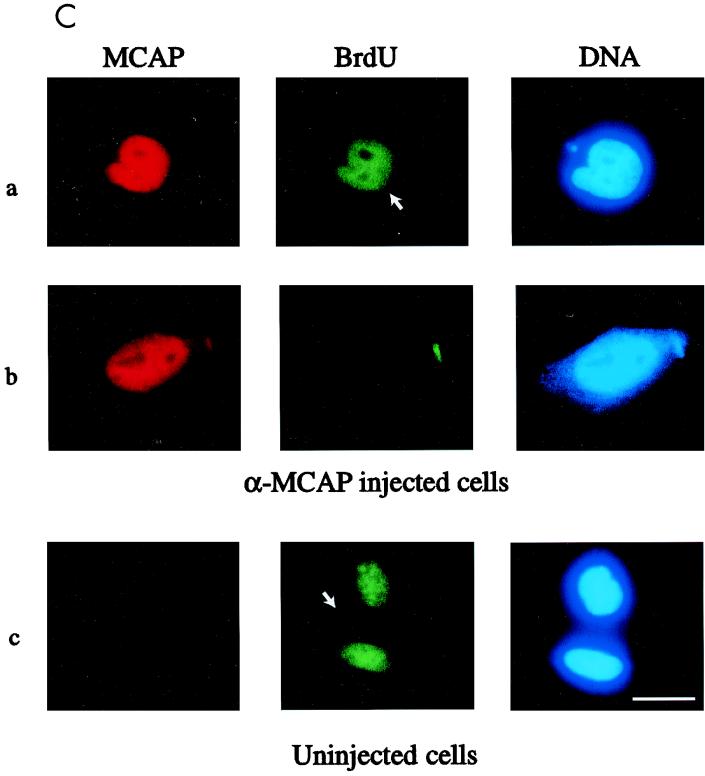
Anti-MCAP antibody injection inhibits the entry into mitosis. (A) Diagram of microinjection experiments. HeLa cells were synchronized by double-thymidine block and released. The lower panel represents a typical cell cycle profile monitored by FACS analysis. Anti-MCAP IgG (N-MCAP) or preimmune IgG was injected into the nuclei at S or G2 phase, and cells were allowed to proceed through mitosis. Cells were fixed, stained with the second antibody, and counterstained with Hoechst 33342. (B) Morphology of injected cells. (a and b) Cells injected with preimmune IgG. Arrowheads, mitotic cells stained with second antibody; *, interphase cell stained with antibody (escaping synchronization); #, uninjected cell in mitosis. (c and d) Cells injected with anti-MCAP antibody. Arrows, cells injected with anti-MCAP IgG which failed to enter into mitosis; ∗, uninjected cell in interphase; #, uninjected cells which proceeded to mitosis. The bar indicates 8 μM. (C) Anti-MCAP IgG injection does not abrogate ongoing DNA synthesis. Cells in S phase were injected with anti-MCAP IgG and then incubated with 10 μM BrdU for 1 h and allowed to proceed as for panel A. Cells were stained for injected IgG, BrdU, and DNA. (a) Cell injected with anti-MCAP antibody that incorporated BrdU; (b) cell injected with anti-MCAP antibody that was out of synchrony and failed to incorporate BrdU (a control for BrdU staining). (c) Uninjected cells which incorporated BrdU and proceeded through mitosis, tested as a control for the intensity and pattern of BrdU staining. The bar corresponds to 6 μm.
TABLE 1.
Injection of anti-MCAP IgG inhibits G2-M transitiona
| Expt | Antibody (IgG) | Time of injection | Total no. of cells injected | No. (%) of cells in mitosis |
|---|---|---|---|---|
| 1 | Preimmune | Early S | 20 | 8 (40) |
| Anti-MCAP | Early S | 28 | 1 (5) | |
| 2 | Preimmune | Early S | 20 | 8 (40) |
| Anti-MCAP | Early S | 28 | 0 (0) | |
| 3 | Preimmune | G2 | 25 | 11 (45) |
| Anti-MCAP | G2 | 21 | 1 (5) | |
| 4 | Preimmune | G2 | 21 | 7 (35) |
| Anti-MCAP | G2 | 35 | 0 (0) |
It was of importance to assess whether injection of anti-MCAP IgG into S-phase cells abolished ongoing DNA synthesis. To address this question, cells injected with anti-MCAP IgG were pulse-labeled with BrdU for 1 h. Cells were allowed to continue growth as described above. BrdU uptake was monitored by anti-BrdU monoclonal antibody. Shown in Fig. 7C (row a) is an example of a cell injected with anti-MCAP IgG. This cell, while arrested prior to mitosis, incorporated BrdU. BrdU staining was absent in the nucleoli, similar to that of normal, uninjected cells (Fig. 7C, row c). These results show that anti-MCAP IgG, when injected into S-phase cells, inhibited mitosis without completely abrogating ongoing DNA synthesis. Results with G2 cells indicate that anti-MCAP antibody interfered with mitotic entry; however, an additional possibility that anti-MCAP antibody interferes with the completion of DNA replication cannot be excluded.
DISCUSSION
We describe a novel mammalian protein MCAP that associates with mitotic chromosomes and regulates cell cycle progression from G2 to M. MCAP belongs to the poorly understood BET subgroup of the bromodomain superfamily. It carries two bromodomains and an ET domain, both of which are conserved from yeasts to humans (14, 21).
Both the endogenous MCAP and transfected GFP-MCAP localized on chromosomes during mitosis. Association of MCAP with mitotic chromosomes became visible in prometaphase and persisted until chromosomes were decondensed in two daughter cells. The specific chromosomal localization was noteworthy, since it occurred when many chromatin-associated regulatory proteins were released into the cytoplasm.
Interestingly, FRAP analysis and biochemical experiments (Fig. 6) suggested that MCAP is not a rigid structural component of chromatin but rather is associated with chromatin in a more flexible way during both interphase and mitosis. It is likely that MCAP is held onto chromatin not through a tight binding to DNA but through a protein-protein interaction. In view of a recent structural study and the proposed chromatin-targeting role of the bromodomain (8, 57), association of MCAP with chromatin may be mediated by one or both of the bromodomains in MCAP. However, it is important to note that not all bromodomain proteins are capable of associating with mitotic chromosomes, since proteins of the SWI/SNF subgroup as well as CBP, both carrying a bromodomain, are released into the cytoplasm during mitosis (33) (Fig. 4A). Interaction with mitotic chromosomes may be a property shared among proteins of the BET subgroup, because (i) the yeast BDF1 is shown to localize to chromosomes (3) and (ii) we have obtained evidence that the murine RING3 also localizes to mitotic chromosomes (F. Chitsaz and K. Ozato, unpublished data).
A role in cell cycle regulation.
Our observations that antibody injection causes a strong G2 arrest indicate that MCAP plays a critical role in entry into mitosis (Fig. 7; Table 1). The cyclin B-cdc2 complex is a key regulator of the onset and completion of mitosis. This complex controls many mitotic events, including chromosomal architecture, spindle formation, and nuclear membrane breakdown (25, 36, 37). The cyclin B-cdc2 complex is activated during G2/M as it translocates from cytoplasm to nucleus (52). In this period, some cyclin B-cdc2 complexes are reported to localize to mitotic chromosomes (40). It is possible that MCAP plays a role in regulating the activity of cyclin B-cdc2 during mitosis. However, at present it is not clear whether MCAP has a direct role in activation of the cyclin B-cdc2 complex.
In view of the finding that MCAP-antibody injected cells were arrested prior to mitosis, MCAP is likely to affect an event(s) occurring prior to chromosomal condensation. In addition, since chromosomal localization becomes visible during condensation, MCAP may contribute in some way to the condensation process itself. On the other hand, in view of the antibody-induced cell cycle arrest and the prometaphase onset of chromosomal association, it seems less likely that MCAP regulates post condensation events such as spindle attachment, cohesin breakdown, or chromosomal segregation. A number of proteins that regulate chromosomal dynamics during mitosis have been identified, including SMC family proteins, phospho-histone H3, and topoisomerase II (13, 18, 20, 22, 55, 58). At present, whether MCAP regulates activities of any of these proteins is uncertain.
We found that MCAP expression is linked to cell proliferation; it was induced by growth stimulation and repressed by growth arrest signals (Fig. 3). In lymphocytes, expression was induced during G0/G1 transition, prior to the entry into S phase, although MCAP was seen in all stages of cell cycle in continuously growing cells. This expression pattern suggests that the activity of MCAP may not be limited to the G2/M stage. Our recent observations are consistent with the view that MCAP has a more integral role in coordinating the overall cell growth program (T. Maruyama and K. Ozato, unpublished data).
Spatial specificity of MCAP localization: a role in mitotic regulation of transcription?
MCAP-chromosome association became visible at a time when transcription factors are displaced from chromatin, an event characteristic of mitosis in higher eukaryotes. These changes are shown to coincide with the abrupt and general cessation of transcription (12, 29, 33, 38, 41, 45). We noted that MCAP-chromosome association has a distinct spatial specificity in that (i) MCAP did not specifically colocalize with the pericentric heterochromatin, the sites of early histone H3 phosphorylation and early chromosomal condensation, and (ii) MCAP was absent from the centromeres (Fig. 4B and 5B). Centromeres are rich in repetitive DNA sequences e.g., α-satellite, which constitute heterochromatin (34), where transcription is generally repressed in an epigenetically inherited manner (56). These regions replicate late during S phase but condense early during mitosis (5). Our results suggest that MCAP associates predominantly with the regions of chromosomes containing euchromatin and less with heterochromatin.
The liberation of factors from chromosomes during mitosis is thought to provide a ground for reprogramming a new pattern of transcription. Along this line of thinking, mitosis is thought to be associated with a mechanism to mark actively transcribed regions of the genome, ensuring the resumption of properly controlled gene expression in newly divided cells (32). Molecular processes leading to gene marking, however, have yet to be elucidated. Relevant to this issue, mammalian polycomb proteins, involved in transcriptional repression of heterochromatin, also localize to mitotic chromosomes, and this process is thought to have a role in epigenetic inheritance of repressed chromatin (44). In light of the spatial specificity of MCAP localization, it may be tempting to envisage that MCAP has a role in a gene marking process. At present, however, we do not have sufficient evidence to assign MCAP such a role.
In conclusion, we describe a novel cell cycle regulator that possesses conserved bromodomain motifs. Further studies of this and related factors may elucidate the mechanisms regulating cell division and gene expression.
ACKNOWLEDGMENTS
We thank M. Lonergan and K. Cheng for assistance in library screening, K. J. M. Zaal for microinjection, K. Mahon and P. Love for gifts of libraries, and N. Bhatia-Dey for useful suggestions, as well as B. Howard and M. DePamphilis for critical reading of the manuscript.
REFERENCES
- 1.Abney J R, Cutler B, Fillbach M L, Axelrod D, Scalettar B A. Chromatin dynamics in interphase nuclei and its implications for nuclear structure. J Cell Biol. 1997;137:1459–1468. doi: 10.1083/jcb.137.7.1459. [DOI] [PMC free article] [PubMed] [Google Scholar]
- 2.Beck S, Hanson I, Kelly A, Pappin D J, Trowsdale J. A homologue of the Drosophila female sterile homeotic (fsh) gene in the class II region of the human MHC. DNA Seq. 1992;2:203–210. doi: 10.3109/10425179209020804. [DOI] [PubMed] [Google Scholar]
- 3.Chua P, Roeder G S. Bdf1, a yeast chromosomal protein required for sporulation. Mol Cell Biol. 1995;15:3685–3696. doi: 10.1128/mcb.15.7.3685. [DOI] [PMC free article] [PubMed] [Google Scholar]
- 4.Coligan J, Kruisbeek A, Shevach E, Margulies D, editors. Current protocols in immunology. New York, N.Y: John Wiley & Sons; 1997. [Google Scholar]
- 5.Coverley D, Laskey R A. Regulation of eukaryotic DNA replication. Annu Rev Biochem. 1994;63:745–776. doi: 10.1146/annurev.bi.63.070194.003525. [DOI] [PubMed] [Google Scholar]
- 6.Denis G V, Green M R. A novel, mitogen-activated nuclear kinase is related to a Drosophila developmental regulator. Genes Dev. 1996;10:261–271. doi: 10.1101/gad.10.3.261. [DOI] [PubMed] [Google Scholar]
- 7.Dey A, Minucci S, Ozato K. Ligand-dependent occupancy of the retinoic acid receptor beta 2 promoter in vivo. Mol Cell Biol. 1994;14:8191–8201. doi: 10.1128/mcb.14.12.8191. [DOI] [PMC free article] [PubMed] [Google Scholar]
- 8.Dhalluin C, Carlson J E, Zeng L, He C, Aggarwal A K, Zhou M M. Structure and ligand of a histone acetyltransferase bromodomain. Nature. 1999;399:491–496. doi: 10.1038/20974. [DOI] [PubMed] [Google Scholar]
- 9.Digan M E, Haynes S R, Mozer B A, Dawid I B, Forquignon F, Gans M. Genetic and molecular analysis of fs(1)h, a maternal effect homeotic gene in Drosophila. Dev Biol. 1986;114:161–169. doi: 10.1016/0012-1606(86)90392-1. [DOI] [PubMed] [Google Scholar]
- 10.Ellenberg J, Siggia E D, Moreira J E, Smith C L, Presley J F, Worman H J, Lippincott-Schwartz J. Nuclear membrane dynamics and reassembly in living cells: targeting of an inner nuclear membrane protein in interphase and mitosis. J Cell Biol. 1997;138:1193–1206. doi: 10.1083/jcb.138.6.1193. [DOI] [PMC free article] [PubMed] [Google Scholar]
- 11.Field C, Li R, Oegema K. Cytokinesis in eukaryotes: a mechanistic comparison. Curr Opin Cell Biol. 1999;11:68–80. doi: 10.1016/s0955-0674(99)80009-x. [DOI] [PubMed] [Google Scholar]
- 12.Gottesfeld J M, Wolf V J, Dang T, Forbes D J, Hartl P. Mitotic repression of RNA polymerase III transcription in vitro mediated by phosphorylation of a TFIIIB component. Science. 1994;263:81–84. doi: 10.1126/science.8272869. [DOI] [PubMed] [Google Scholar]
- 13.Guacci V, Koshland D, Strunnikov A. A direct link between sister chromatid cohesion and chromosome condensation revealed through the analysis of MCD1 in S. cerevisiae. Cell. 1997;91:47–57. doi: 10.1016/s0092-8674(01)80008-8. [DOI] [PMC free article] [PubMed] [Google Scholar]
- 14.Haynes S R, Dollard C, Winston F, Beck S, Trowsdale J, Dawid I B. The bromodomain: a conserved sequence found in human, Drosophila and yeast proteins. Nucleic Acids Res. 1992;20:2603. doi: 10.1093/nar/20.10.2603. [DOI] [PMC free article] [PubMed] [Google Scholar]
- 15.Haynes S R, Mozer B A, Bhatia-Dey N, Dawid I B. The Drosophila fsh locus, a maternal effect homeotic gene, encodes apparent membrane proteins. Dev Biol. 1989;134:246–257. doi: 10.1016/0012-1606(89)90094-8. [DOI] [PubMed] [Google Scholar]
- 16.Hendzel M J, Wei Y, Mancini M A, Van Hooser A, Ranalli T, Brinkley B R, Bazett-Jones D P, Allis C D. Mitosis-specific phosphorylation of histone H3 initiates primarily within pericentromeric heterochromatin during G2 and spreads in an ordered fashion coincident with mitotic chromosome condensation. Chromosoma. 1997;106:348–360. doi: 10.1007/s004120050256. [DOI] [PubMed] [Google Scholar]
- 17.Hershkovitz M, Riggs A D. Metaphase chromosome analysis by ligation-mediated PCR: heritable chromatin structure and a comparison of active and inactive X chromosomes. Proc Natl Acad Sci USA. 1995;92:2379–2383. doi: 10.1073/pnas.92.6.2379. [DOI] [PMC free article] [PubMed] [Google Scholar]
- 18.Hirano T. SMC-mediated chromosome mechanics: a conserved scheme from bacteria to vertebrates? Genes Dev. 1999;13:11–19. doi: 10.1101/gad.13.1.11. [DOI] [PubMed] [Google Scholar]
- 19.Horn V, Minucci S, Ogryzko V V, Adamson E D, Howard B H, Levin A A, Ozato K. RAR and RXR selective ligands cooperatively induce apoptosis and neuronal differentiation in P19 embryonal carcinoma cells. FASEB J. 1996;10:1071–1077. doi: 10.1096/fasebj.10.9.8801169. [DOI] [PubMed] [Google Scholar]
- 20.Isaacs R J, Davies S L, Sandri M I, Redwood C, Wells N J, Hickson I D. Physiological regulation of eukaryotic topoisomerase II. Biochim Biophys Acta. 1998;1400:121–137. doi: 10.1016/s0167-4781(98)00131-6. [DOI] [PubMed] [Google Scholar]
- 21.Jeanmougin F, Wurtz J M, Le Douarin B, Chambon P, Losson R. The bromodomain revisited. Trends Biochem Sci. 1997;22:151–153. doi: 10.1016/s0968-0004(97)01042-6. [DOI] [PubMed] [Google Scholar]
- 22.Jessberger R, Frei C, Gasser S M. Chromosome dynamics: the SMC protein family. Curr Opin Genet Dev. 1998;8:254–259. doi: 10.1016/s0959-437x(98)80149-4. [DOI] [PubMed] [Google Scholar]
- 23.Jiang Y W, Veschambre P, Erdjument-Bromage H, Tempst P, Conaway J W, Conaway R C, Kornberg R D. Mammalian mediator of transcriptional regulation and its possible role as an end-point of signal transduction pathways. Proc Natl Acad Sci USA. 1998;95:8538–8543. doi: 10.1073/pnas.95.15.8538. [DOI] [PMC free article] [PubMed] [Google Scholar]
- 24.Jones M H, Numata M, Shimane M. Identification and characterization of BRDT: a testis-specific gene related to the bromodomain genes RING3 and Drosophila fsh. Genomics. 1997;45:529–534. doi: 10.1006/geno.1997.5000. [DOI] [PubMed] [Google Scholar]
- 25.Koepp D, Harper J, Elledge S J. how the cyclin became a cyclin: regulated proleolysis in the cell cycle. Cell. 1999;97:431–434. doi: 10.1016/s0092-8674(00)80753-9. [DOI] [PubMed] [Google Scholar]
- 26.Lygerou Z, Conesa C, Lesage P, Swanson R N, Ruet A, Carlson M, Sentenac A, Seraphin B. The yeast BDF1 gene encodes a transcription factor involved in the expression of a broad class of genes including snRNAs. Nucleic Acids Res. 1994;22:5332–5340. doi: 10.1093/nar/22.24.5332. [DOI] [PMC free article] [PubMed] [Google Scholar]
- 27.MacGregor H, Varley J. Chromosome banding. New York, N.Y: John Wiley & Sons; 1988. [Google Scholar]
- 28.Marshall W F, Straight A, Marko J F, Swedlow J, Dernburg A, Belmont A, Murray A W, Agard D A, Sedat J W. Interphase chromosomes undergo constrained diffusional motion in living cells. Curr Biol. 1997;7:930–939. doi: 10.1016/s0960-9822(06)00412-x. [DOI] [PubMed] [Google Scholar]
- 29.Martinez-Balbas M A, Dey A, Rabindran S K, Ozato K, Wu C. Displacement of sequence-specific transcription factors from mitotic chromatin. Cell. 1995;83:29–38. doi: 10.1016/0092-8674(95)90231-7. [DOI] [PubMed] [Google Scholar]
- 30.Matangkasombut O, Buratowski R M, Swilling N W, Buratowski S. Bromodomain factor 1 corresponds to a missing piece of yeast TFIID. Genes Dev. 2000;14:951–962. [PMC free article] [PubMed] [Google Scholar]
- 31.McNally J G, Muller W G, Walker D, Wolford R, Hager G L. The glucocorticoid receptor: rapid exchange with regulatory sites in living cells. Science. 2000;287:1262–1265. doi: 10.1126/science.287.5456.1262. [DOI] [PubMed] [Google Scholar]
- 32.Michelotti E F, Sanford S, Levens D. Marking of active genes on mitotic chromosomes. Nature. 1997;388:895–899. doi: 10.1038/42282. [DOI] [PubMed] [Google Scholar]
- 33.Muchardt C, Reyes J C, Bourachot B, Leguoy E, Yaniv M. The hbrm and BRG-1 proteins, components of the human SNF/SWI complex, are phosphorylated and excluded from the condensed chromosomes during mitosis. EMBO J. 1996;15:3394–3402. [PMC free article] [PubMed] [Google Scholar]
- 34.Murphy T D, Karpen G H. Centromeres take flight: alpha satellite and the quest for the human centromere. Cell. 1998;93:317–320. doi: 10.1016/s0092-8674(00)81158-7. [DOI] [PubMed] [Google Scholar]
- 35.Nasmyth K. Separating sister chromatids. Trends Biochem Sci. 1999;24:98–104. [Google Scholar]
- 36.Nurse P, Masui Y, Hartwell L. Understanding the cell cycle. Nat Med. 1998;4:1103–1106. doi: 10.1038/2594. [DOI] [PubMed] [Google Scholar]
- 37.Ohi R, Gould K L. Regulating the onset of mitosis. Curr Opin Cell Biol. 1999;11:267–273. doi: 10.1016/s0955-0674(99)80036-2. [DOI] [PubMed] [Google Scholar]
- 38.Parsons G G, Spencer C A. Mitotic repression of RNA polymerase II transcription is accompanied by release of transcription elongation complexes. Mol Cell Biol. 1997;17:5791–5802. doi: 10.1128/mcb.17.10.5791. [DOI] [PMC free article] [PubMed] [Google Scholar]
- 39.Phair R D, Misteli T. High mobility of proteins in the mammalian cell nucleus. Nature. 2000;404:604–609. doi: 10.1038/35007077. [DOI] [PubMed] [Google Scholar]
- 40.Pines J, Hunter T. Human cyclins A and B1 are differentially located in the cell and undergo cell cycle-dependent nuclear transport. J Cell Biol. 1991;115:1–17. doi: 10.1083/jcb.115.1.1. [DOI] [PMC free article] [PubMed] [Google Scholar]
- 41.Prescott D, Bender M. Synthesis of RNA and protein during mitosis of mammalian tissue culture cells. Exp Cell Res. 1962;26:260–268. doi: 10.1016/0014-4827(62)90176-3. [DOI] [PubMed] [Google Scholar]
- 42.Qi, C. F., A. E. Coleman, T. A. Torrey, L. Taddesse-Heath, B. H. Ye, Y. Ohta, S. K. Chattopadhyay, J. W. Hatrley, and I. H. C. Morse. Genomic organization and expression of BCL6 in murine B cell lymphomas. Cancer Res., in press. [DOI] [PubMed]
- 43.Rhee K, Brunori M, Besset V, Trousdale R, Wolgemuth D J. Expression and potential role of Fsrg1, a murine bromodomain-containing homologue of the Drosophila gene female sterile homeotic. J Cell Sci. 1998;111:3541–3550. doi: 10.1242/jcs.111.23.3541. [DOI] [PubMed] [Google Scholar]
- 44.Saurin A J, Shiels C, Williamson J, Satijn D P, Otte A P, Sheer D, Freemont P S. The human polycomb group complex associates with pericentromeric heterochromatin to form a novel nuclear domain. J Cell Biol. 1998;142:887–898. doi: 10.1083/jcb.142.4.887. [DOI] [PMC free article] [PubMed] [Google Scholar]
- 45.Segil N, Guermah M, Hoffmann A, Roeder R G, Heintz N. Mitotic regulation of TFIID: inhibition of activator-dependent transcription and changes in subcellular localization. Genes Dev. 1996;10:2389–2400. doi: 10.1101/gad.10.19.2389. [DOI] [PubMed] [Google Scholar]
- 46.Sif S, Stukenberg P T, Kirschner M W, Kingston R E. Mitotic inactivation of a human SWI/SNF chromatin remodeling complex. Genes Dev. 1998;12:2842–2851. doi: 10.1101/gad.12.18.2842. [DOI] [PMC free article] [PubMed] [Google Scholar]
- 47.Soddu S, Blandino G, Scardigli R, Martinelli R, Rizzo M G, Crescenzi M, Sacchi A. Wild-type p53 induces diverse effects in 32D cells expressing different oncogenes. Mol Cell Biol. 1996;16:487–495. doi: 10.1128/mcb.16.2.487. [DOI] [PMC free article] [PubMed] [Google Scholar]
- 48.Stein G, Stein J L. Cell synchronization. New York, N.Y: IRL Press; 1989. [Google Scholar]
- 49.Taniguchi Y, Matsuzaka Y, Fujimoto H, Miyado K, Kohda A, Okumura K, Kimura M, Inoko H. Nucleotide sequence of the ring3 gene in the class II region of the mouse MHC and its abundant expression in testicular germ cells. Genomics. 1998;51:114–123. doi: 10.1006/geno.1998.5262. [DOI] [PubMed] [Google Scholar]
- 50.Thorpe K L, Abdulla S, Kaufman J, Trowsdale J, Beck S. Phylogeny and structure of the RING3 gene. Immunogenetics. 1996;44:391–396. doi: 10.1007/BF02602785. [DOI] [PubMed] [Google Scholar]
- 51.Thorpe K L, Gorman P, Thomas C, Sheer D, Trowsdale J, Beck S. Chromosomal localization, gene structure and transcription pattern of the ORFX gene, a homologue of the MHC-linked RING3 gene. Gene. 1997;200:177–183. doi: 10.1016/s0378-1119(97)00415-0. [DOI] [PubMed] [Google Scholar]
- 52.Toyoshima F, Moriguchi T, Wada A, Fukuda M, Nishida E. Nuclear export of cyclin B1 and its possible role in the DNA damage-induced G2 checkpoint. EMBO J. 1998;17:2728–2735. doi: 10.1093/emboj/17.10.2728. [DOI] [PMC free article] [PubMed] [Google Scholar]
- 53.Van Hooser A, Goodrich D W, Allis C D, Brinkley B R, Mancini M A. Histone H3 phosphorylation is required for the initiation, but not maintenance, of mammalian chromosome condensation. J Cell Sci. 1998;111:3497–3506. doi: 10.1242/jcs.111.23.3497. [DOI] [PubMed] [Google Scholar]
- 54.Wang A, Mark D. PCR protocols. New York, N.Y: Academic Press; 1990. [Google Scholar]
- 55.Wei Y, Yu L, Bowen J, Gorovsky M A, Allis C D. Phosphorylation of histone H3 is required for proper chromosome condensation and segregation. Cell. 1999;97:99–109. doi: 10.1016/s0092-8674(00)80718-7. [DOI] [PubMed] [Google Scholar]
- 56.Wiens G R, Sorger P K. Centromeric chromatin and epigenetic effects in kinetochore assembly. Cell. 1998;93:313–316. doi: 10.1016/s0092-8674(00)81157-5. [DOI] [PubMed] [Google Scholar]
- 57.Winston F, Allis C D. The bromodomain: a chromatin-targeting module? Nat Struct Biol. 1999;6:601–604. doi: 10.1038/10640. [DOI] [PubMed] [Google Scholar]
- 58.Zachariae W, Nasmyth K. Whose end is destruction: cell division and the anaphase-promoting complex. Genes Dev. 1999;13:2039–2058. doi: 10.1101/gad.13.16.2039. [DOI] [PubMed] [Google Scholar]
