Tumor Dormancy Induced by Downregulation of Urokinase Receptor in Human Carcinoma Involves Integrin and MAPK Signaling (original) (raw)
Abstract
Mechanisms that regulate the transition of metastases from clinically undetectable and dormant to progressively growing are the least understood aspects of cancer biology. Here, we show that a large (∼70%) reduction in the urokinase plasminogen activator receptor (uPAR) level in human carcinoma HEp3 cells, while not affecting their in vitro growth, induced a protracted state of tumor dormancy in vivo, with G0/G1 arrest. We have now identified the mechanism responsible for the induction of dormancy. We found that uPA/uPAR proteins were physically associated with α5β1, and that in cells with low uPAR the frequency of this association was significantly reduced, leading to a reduced avidity of α5β1 and a lower adhesion of cells to the fibronectin (FN). Adhesion to FN resulted in a robust and persistent ERK1/2 activation and serum-independent growth stimulation of only uPAR-rich cells. Compared with uPAR-rich tumorigenic cells, the basal level of active extracellular regulated kinase (ERK) was four to sixfold reduced in uPAR-poor dormant cells and its stimulation by single chain uPA (scuPA) was weak and showed slow kinetics. The high basal level of active ERK in uPAR-rich cells could be strongly and rapidly stimulated by scuPA. Disruption of uPAR–α5β1 complexes in uPAR-rich cells with antibodies or a peptide that disrupts uPAR–β1 interactions, reduced the FN-dependent ERK1/2 activation. These results indicate that dormancy of low uPAR cells may be the consequence of insufficient uPA/uPAR/α5β1 complexes, which cannot induce ERK1/2 activity above a threshold needed to sustain tumor growth in vivo. In support of this conclusion we found that treatment of uPAR-rich cells, which maintain high ERK activity in vivo, with reagents interfering with the uPAR/β1 signal to ERK activation, mimic the in vivo dormancy induced by downregulation of uPAR.
Keywords: tumor dormancy, uPAR, mitogen-activated protein kinase, integrin activation, fibronectin
Clinical experience in cancer patients indicates that some primary cancers and most metastatic lesions undergo a period of dormancy before entering a stage of progressive growth. Although this may be the most crucial step in cancer progression, the mechanisms underlying the conversion from a dormant to an actively growing state have not been elucidated. A prevalent hypothesis envisions that to grow, cancer cells must acquire the ability to induce angiogenesis (Folkman 1995), and that the proangiogenic phenotype must be dominant. In some experimental cancer models, cancer cells within a progressively growing primary cancer, and possibly cancer infiltrating cells such as macrophages (Dong et al. 1997), cleave plasminogen to generate a fragment that appears to tip the balance toward angiogenic suppression resulting in dormancy of existing micrometastases (O'Reilly et al. 1994). Another model of tumor dormancy involves experimental B cell lymphoma in which antibodies directed to surface immunoglobulins act as agonists of signal transduction pathways leading to a block in cancer cell growth (Marches et al. 1998). Although interesting, this model may be unique to this particular type of cancer.
In studying the role of the cell surface receptor for urokinase type plasminogen activator (uPAR)1 in malignancy, we discovered that uPAR downregulation renders a human epidermoid carcinoma, HEp3, dormant (Kook et al. 1994; Yu et al. 1997). These cancer cells expressing <50% of the normal level of uPAR, grew indistinguishably from parental cells in culture but, when inoculated onto the chorioallantoic membrane (CAM) of chick embryos and maintained by serial in vivo passages, entered a period of protracted (∼4 mo) dormancy. Using bromodeoxyuridine incorporation assays and apoptosis measurements in vivo, we determined that dormancy was the result of a reduced proliferation rate rather than an increased apoptotic rate (Yu et al. 1997). These and other published results allow us to propose that uPA/uPAR may have two complementary functions: a well established one as an activator of the proteolytic cascade on the surface of cancer cells (Mignatti and Rifkin 1993), and another as a component of a signal transducing assembly (Busso et al. 1994; Fazioli et al. 1997; Chapman 1997). While as an activator of the proteolytic cascade, uPA/uPAR enhances local invasion, intravasation, and metastasis formation (Ossowski et al. 1991; Mignatti and Rifkin 1993; Andreasen et al. 1997; Kim et al. 1998), we postulate that in its signal transducing capacity uPAR is responsible for facilitating cancer cell proliferation in vivo.
Several signal transduction complexes and pathways have been shown to be activated by uPA binding to uPAR. uPA has been shown to be a mitogen for some cells (Kirchheimer et al. 1987; Rabbani et al. 1992). However, uPA is not directly mitogenic for HEp3 cells since uPAR-rich, malignant HEp3 cells, in which the receptor is saturated by endogenously produced uPA (Ossowski 1992), proliferate in culture at a rate similar to that of cells with low uPAR. Other examples involve interactions with multiple, nonreceptor tyrosine kinases of the Src family that have been coimmunoprecipitated by anti–uPAR antibodies (Bohuslav et al. 1995; Konakova et al. 1998). In some cases these appeared to have been activated (Konakova et al. 1998). Recent reports have shown that binding of uPA to uPAR in tumor or endothelial cells activates the mitogen-activated protein kinases (MAPK), extracellular regulated kinase (ERK) 1 and 2 (Konakova et al. 1998; Nguyen et al. 1998; Tang et al. 1998). However, these reports neither addressed the mechanism of signaling through uPAR nor considered the implication of these events during in vivo cellular processes such as tumor progression. Since uPAR lacks a transmembrane domain and is anchored through a glycosyl phosphatidyl inositol (GPI) anchor (Ploug et al. 1991), it is most likely that it forms cis-interactions with other membrane proteins. In fact, several reports involving immunocolocalization, resonance energy transfer, and functional studies (Xue et al. 1994, Xue et al. 1997; Wei et al. 1996) have shown that β1, β2, and β3 integrin receptor families may be candidates for such interactions. The relevance of these interactions is underscored by the fact that many of these receptors (α1β1, α5/β1, α6β4, and others) activate intracellular signals coupled to the pathways used by receptor tyrosine kinases (RTKs) and non-RTKs, namely the Ras-Raf-ERK and/or the Cdc42-Rac-JNK pathways (Wary et al. 1996, Wary et al. 1998; Mainiero et al. 1997). Integrin and RTK-mediated signals may, in a complementary fashion, lead to a full activation of cell survival and proliferation (Miyamoto et al. 1996; Yamada and Geiger 1997). For example, α5β1 may cooperate with EGF receptor–dependent signals to promote cell division (Yamada and Geiger 1997). Also, other integrin–ECM interactions that activate Shc-ERK and Rac-Rho-JNK–dependent pathways, promote cell division in vitro and in vivo (Mainiero et al. 1997; Murgia et al. 1998). Recent evidence shows that integrin activation can be strongly modulated by a number of membrane proteins (Porter and Hogg 1998), including uPAR, and that an increase in the state of activation of integrins and modulation of avidity, may enhance the adhesive and growth properties of cells on appropriate matrix proteins (Damsky and Werb 1992; Mortarini et al. 1992; Bazzoni et al. 1998; May et al. 1998). Work by Wei et al. 1996 has shown that transfection of uPAR into human kidney 293 cells, through a specific interaction with the β1 integrin blocked their adhesion to FN. This block could be ameliorated by transfection of caveolin into the uPAR-transfected 293 cells (Wei et al. 1999).
We have investigated the mechanism through which a reduction in surface uPAR expression in HEp3 carcinoma cells impairs their in vivo proliferation, resulting in a state of protracted dormancy (Yu et al. 1997). We postulated that reduced uPAR expression may diminish the frequency at which this receptor interacts with integrins or other transmembrane proteins, reducing the abundance of active complexes and causing a deactivation of mitogenic pathways. Our results demonstrate for the first time that uPAR downregulation leads to abatement of uPA/uPAR/α5β1–dependent signal transduction, reducing the MEK/ERK pathway activation and resulting in cancer cell dormancy. In addition, our data underscore the relevance of the signaling partnership between uPAR and integrins by elucidating its possible role in tumor progression.
Materials and Methods
Reagents and Antibodies
DMSO, Triton X-100, NP-40, sodium orthovanadate, NaFl, Trizma, Hepes, leupeptin, pepstatin, PMSF, BSA, collagenase type 1A, human fibronectin (FN), collagen I, and vitronectin (VN) were purchased from Sigma Chemical Co. Aprotinin and trypsin were from ICN Biomedicals Inc. DME, OPTI-MEM medium, glutamine, antibiotics, and Lipofectin™ were from Gibco Laboratories. FBS was from JRH Biosciences, COFAL-negative embryonated eggs were from SPAFAS, Inc.; protein G–agarose beads were from Boehringer Mannheim Corp. Polyvinylidene difluoride membranes and enhanced chemiluminescence (ECL) detection reagents were from Amersham Life Sciences. Mek1 inhibitor PD98059 was from New England Biolabs Inc.; purified human single chain urokinase type plasminogen activator (scuPA) was provided by Abbott Laboratories. Purified soluble human uPA receptor (uPAR) was provided by Dr. Francesco Blasi (Milan, Italy). mAbs: anti-phospho ERK 1/2 (anti-phospho-Tyr 204; clone E4), anti-NH2-Jun Kinase (JNK) (clone G7, phospho-Thr 183, and phospho-Tyr 185), anti-Shc (clone PG-797) were from Santa Cruz Biotechnology Inc. Anti-ERK1/2 (clone MK12) and anti-HCK (C18) mAbs were from Transduction Laboratories. Antiphosphotyrosine was from Upstate Biotechnology Inc. Anti-Grb2/sem5/ASH, anti-CD29 _(_β1 integrin), and anti–CD55/DAF mAbs were from NeoMarkers. Anti-β1 activating mAb TS2/16 was from Endogen, and anti–α5 antibodies, clone P1D6, was from Chemicon International Inc. Mouse IgG1 (MOPC1) was from Sigma Chemical Co. Anti-human uPAR 3996 mAb was from American Diagnostica. Anti-human uPAR mAb R2 was provided by Dr. Francesco Blasi (Universita Vita-Salute S. Raffaele, Milan, Italy), rat anti-β1 and α5β1 integrin blocking mAbs AIIB2 and BIIG2 (Werb et al. 1989), respectively, were provided by Dr. Caroline H. Damsky (University of California San Francisco, San Francisco, CA), currently available from the Developmental Study Hybridoma Bank, at the University of Iowa. Anti–mouse IgG mAb conjugated with HRP was from Vector Laboratories. Anti-rabbit IgG antibody and anti–HA mAb (clone 12CA5) were from Boehringer Mannheim.
Cell Lines and Cell Culture Conditions
Human epidermoid carcinoma HEp3 (T-HEp3) (Toolan 1954) that were tumorigenic and metastatic in the chick embryo and in nude mice were serially passaged on CAMs and used as a source of tumorigenic cells. The source of spontaneous dormant tumor cells (D-HEp3) were HEp3 cells passaged in vitro 120–170 times (Ossowski and Reich 1983). HEp3 cells transfected with the expression vector LK444 (control clones, designated LK5 and LK25) or HEp3 cells transfected with LK444 vector expressing antisense uPAR mRNA (clones AS24, AS33, and AS48) in which surface uPAR and uPAR mRNA were reduced by up to 70 and 80%, respectively, was described previously (Yu et al. 1997). T-HEp3 or D-HEp3 cells were cultured in DME with 10% heat inactivated FBS (HI-FBS), penicillin (500 U/ml), and streptomycin (200 μg/ml). G418 (400 μg/ml) was added to LK25 and AS24 culture medium. Unless otherwise indicated, all cells were routinely passaged using 0.05% trypsin/EDTA. LK5, LK25, AS24, AS33, or AS48 cells were used between passage 1 and 10 in culture.
Growth of Tumor Cells on CAMs
For in vivo experiments, T-Hep3, LK25, D-HEp3, or AS24 cells growing in culture were detached with 2 mM EDTA in PBS, washed, and inoculated on the CAMs of 9–10-d-old chick embryos. In some experiments, before inoculation, the cells were incubated for 40 min at 37°C with appropriate antibodies. To determine growth in vivo at different times postinoculation, the thickened CAMs indicating tumor cell presence were excised, weighed, and after mincing, dissociated into single cell suspensions by incubation with type 1A collagenase for 30 min at 37°C. Tumor cells, recognized by their very large diameter, were counted with a hemocytometer. Cell viability was determined by trypan-blue exclusion. All antibodies used in vivo or in culture were free of azide. The antibodies used in vivo were tested for endotoxin content, using the Pyrogen-Plus test from Biowhittaker, and found to have <24 pg/ml. For serial passage of T-Hep3 cells, 7-d-old CAM tumors were minced, and small amounts of the mince were reapplied to fresh CAMs of 10-d-old chick embryos.
Detection of Integrins Expression by FACS® Analysis
For surface expression of integrins, cells were detached with 2 mM EDTA in PBS, resuspended in cold PBS with Ca2+, Mg2+, and 1% FBS at 107 cells/ml. Antibodies (P1D6, anti-α5; AIIB2, anti-β1) were added to 4 × 10⁵ cells at 25 μg/ml and incubated at 4°C for 30 min. Controls were incubated with isotype-matched rat or mouse IgG. After two washes, FITC-conjugated goat anti–mouse or goat anti–rat (1:100) IgG were added and the cells incubated for 30 min at 4°C, washed two times, fixed in 5% formaldehyde in PBS, and analyzed in FACS® scan equipped with a laser (488; Becton Dickinson).
Analysis of Cell Cycle Distribution in Culture and In Vivo
For cells in culture, exponentially growing cells were detached with 2 mM EDTA as described above. For cells in vivo, CAMs were inoculated with 1–2 × 10⁶ cells, and at indicated times, tumor cells were isolated as described above, except that cells suspensions were obtained by incubation with collagenase for 20 min. To remove red blood cells, cell suspensions were layered on a 50% cushion of Percoll in 0.15 M NaCl, centrifuged for 15 min at 3,000 rpm, and the cells were collected from the top of the Percoll cushion, washed once by centrifugation, fixed in suspension with 70% ice-cold methanol, incubated with 10 mg/ml RNAse for 30 min at 37°C, washed, and incubated with 50 μg/ml propidium iodide in 0.1% Triton X-100 and 0.1% sodium citrate. The cells were kept in the dark before being analyzed by FACS® scan, Profile II from Coulter Corp.
Transient Transfection of HA-ERK2 Expression Vector, Immunoprecipitation (IP), and Detection by Western Blotting
Dormant and tumorigenic cells were plated in 100-mm dishes and transfected with 5–10 μg vector DNA expressing HA-tagged ERK2 (Mainiero et al. 1997) using Lipofectin according to the manufacturer's instructions. After 24 and 48 h, cells were lysed using a buffer with 300 mM NaCl, 10% glycerol, 20 mM Hepes, pH 7.6, 5 mM MgCl2, 1 mM EGTA, 1 mM DTT, 1 mM sodium orthovanadate, 10 mM NaFl, and a cocktail of protease inhibitors. For in vivo experiments, 24 h posttransfection with the HA-ERK–expressing vector, the cells were inoculated (2.5 × 10⁶ cell/CAM) into 8-mm-diam Teflon rings placed on CAMs. After 24 h of growth in vivo, the CAMs delineated by the rings were excised, slipped into tubes containing lysis buffer, and snap-frozen in liquid N2. The tissues were homogenized, centrifuged for 14 min at 14,000 rpm at 4°C, and the supernatants were analyzed for HA-ERK and phospho-HA-ERK as follows: 250 μg of cell protein was incubated with 1 μg of anti–HA antibody (12CA5) for 1 h at 4°C and for 1 h with protein G–agarose beads. The G beads were washed three times, resuspended in 2× sample buffer, heated for 10 min at 95°C, electrophoresed on SDS-PAGE, transferred to PVDF membranes (see below), and blotted with antibodies to HA or to phospho-ERK. The signal was developed using the ECL method.
Adhesion Assays
Matrix protein or polylysine plates, (96-, 24-, or 6-well) were coated with matrix proteins at 0.5 to 10 μg/ml or as stated in individual experiments, or with 4–8 μg/ml of polylysine (PL), incubated overnight at 4°C in PBS, and blocked for 1 h at 37°C with 1 mg/ml BSA (BSA or PL was used as a negative control). Cells were detached with 2 mM EDTA, resuspended in DME at 5 × 10⁵/ml, and added (50 μl per 96-well tray) to wells coated with FN and preincubated at 37°C with 50 μl of DME. After 30 min incubation at 37°C, the wells were washed gently, fixed with methanol, stained with 0.5% of crystal violet in water for 10 min, and washed extensively with water. After microscopic inspection, 60 μl of 10% methanol and 5% acetic acid solution was added to each well and, after 10 min, the OD at 570 nm was measured in a microplate reader (Dynatech Laboratory Inc.). Adhesion to other extracellular matrix proteins was done in a similar way except that VN, laminin (LN), or type I collagen were used instead of FN. Cells used in testing the effect of AIIB2 (20 μg/ml), BIIG2 (20 μg/ml), or TS2/16 (10 μg/ml) antibodies, and MnCl2 (1.5 mM) were prepared as above, but the DME contained 0.2 mg/ml BSA and 10 mM Hepes. The cells were resuspended at 106 cells/ml with or without antibodies and incubated on a rocking platform for 30 min at room temperature. The medium was diluted to yield 2 × 10⁴ cells/100 μl and 100-μl aliquots were inoculated into wells of a 96-well plate, four wells per sample. The effect of MnCl2 on cell adhesion was examined without preincubation. All cells were allowed to adhere to FN for 20 min at 37°C and processed as above.
In Vitro Cell Proliferation Assays
LK25 or AS24 cells (0.8 × 10⁵) were plated into wells of 24-well plates and cultured overnight with 10% serum. The medium was replaced in DME with 10 mM Hepes and 1 mg/ml BSA with or without 10 μM PD98059 (stock prepared in 100% DMSO); and the control medium contained 0.05% DMSO. Cells in three wells per sample were counted every 24 h in a Coulter counter, (Particle Counter, Model Z1; Coulter Corp.). To study the effect of immobilized FN on the growth of T-Hep3, LK25, D-Hep3, or AS24 cells in culture, cells detached from monolayers with EDTA were seeded in 24-well plates coated with FN or BSA in DME with 10 mM Hepes and 1 mg/ml BSA. Every 24 h the cells (three wells per sample) were detached and counted using a Coulter counter.
ERK and JNK Activation Assays, Basal Level, and Effect of Treatments
To determine the basal level of ERK and JNK activation, subconfluent monolayers of cells were either kept overnight in DME with serum or in DME with 10 mM Hepes and 1 mg/ml BSA, scraped in PBS, centrifuged, and the pellets were lysed with RIPA buffer (1% Triton X-100, 140 mM NaCl, 10 mM Tris, 0.02% sodium azide, 0.1% SDS, 0.5% deoxycholate, 1 mM orthovanadate, 1 mM NaFl, 200 KIU/ml aprotinin, 1 μg/ml leupeptin, 1 μg/ml pepstatin, 1 mM PMSF) and extracted on ice for 20 min. The lysates were centrifuged for 14 min at 14,000 rpm and the supernatants were saved. Equal amounts of proteins of each cell lysate were electrophoresed on an SDS-PAGE and Western blotted using either anti–phospho-ERK (p42/p44) or anti–phospho-JNK (p46/p54) antibodies. The p42/p44 ERK protein levels were determined using an anti–ERK1 antibody.
To test the effect of scuPA on ERK activation, subconfluent cell monolayers were starved overnight in DME with Hepes and BSA, washed and acid-stripped for 3 min using cold 0.05 M glycine-HCl in 0.1 M NaCl buffer, pH 3, to remove uPAR bound uPA, and neutralized using 0.5 M Tris-HCl, pH 7.8. The cells were incubated for 1–60 min with 1–80 nM scuPA in the presence of 200 KIU/ml aprotinin to avoid protease-dependent effects of uPA. In some experiments, acid-stripped cells without or with added scuPA (10 nM) were incubated in presence of 10 μM PD98059 for 10 min. In another set of experiments, serum-starved but nonacid-stripped cells were incubated for the indicated time points with 0.1–10 ng/ml (<0.2 nM) of soluble uPAR in the presence of 200 KIU/ml aprotinin.
To study the effect of integrin ligation on ERK and JNK activation, 24 h serum-starved cells were plated at 106 on PL- (4 μg/ml), FN- (0.4–4 μg/ml) or CL-I– (4 μg/ml) coated dishes (cells plated on PL attached, but did not spread even after 90 min). At the indicated times, the cells were processed as above. To test whether the antibody would interfere with FN activation of ERK, 106 cells were preincubated for 35 min at 37°C with 7 μg/ml of R2 anti–uPAR antibody (recognizes domain 3 of uPAR), or 5 μg/ml of anti–uPAR 3996 antibody (recognizes domain 1, and blocks uPA binding), or 7 μg/ml of isotype matched IgG, or 10 μg/ml of β1-integrin blocking antibodies (AIIB2), or with isotype-matched IgG, plated on surfaces coated with a mixture of PL and FN and, after 20 min incubation at 37°C, were analyzed for ERK activation. To test the effect of uPAR interaction with β1 integrin on ERK activation, T-HEp3, LK25, or AS24 cells were incubated for 5–10 min with increasing doses (0.1–50 μM) of peptide 25 (P25; AESTYHHLSLGYMYTLN-NH2) dissolved in DMSO, that was shown to inhibit such interactions, but not to interfere with uPA or VN binding to uPAR (Wei et al. 1996). Controls were treated either with 0.05% DMSO alone or with a scrambled version of peptide 25 (NYHYLESSMTALYTLGH-NH2). Regardless of treatment, to test for ERK activation, the cells were placed on ice, lysed, and the lysates were analyzed by Western blots as described above for scuPA treatment.
Surface Labeling with Sulfo-NHS-Biotin
Subconfluent monolayers were washed three times with cold PBS, and the cells were incubated on ice for 20 min with 5 ml of 0.5 mg/ml sulfo-NHS-biotin (Pierce Chemical Co.). The reaction was stopped by aspirating and washing the cells twice with 10 ml of ice-cold PBS. The cells were scraped in 1 ml of PBS-containing protease inhibitors, spun at 4°C, and the pellets were lysed with a lysis buffer containing 1% Triton X-100, 50 mM Hepes, pH 7.5, 150 mM NaCl, 1 mM CaCl2, 1 mM MgCl2, and protease inhibitors as described for RIPA buffer. Immunoprecipitation and biotinylated proteins' detection were performed as indicated below.
Immunoprecipitation and Western Blot of Integrins and uPAR
Cells were extracted for 1 h with a lysis buffer containing 1% Triton X-100, 50 mM Hepes, pH 7.5, 150 mM NaCl, 1 mM CaCl2, 1 mM MgCl2, 1 mM orthovanadate, 1 mM NaFl, and protease inhibitors as described for RIPA buffer. Triton X-100 soluble and insoluble fractions of biotinylated or nonbiotinylated surface proteins (400 μg protein) were incubated with 4 μg of TS2/16 anti–β1, anti–α5β1 (BIIG2), anti–α5 (P1D6), anti–uPAR (R2) antibodies, matched isotype IgG or no IgG overnight at 4°C, precipitated with protein G–agarose beads, and washed three times. The beads were resuspended in 2× Laemmli sample buffer, heated to 95°C for 10 min, and analyzed by Western blotting using anti–β1 integrin (anti–CD29) antibody or anti–uPAR R2 antibody. For Western blotting analyses, after SDS-PAGE, the proteins were electrotransferred to PVDF membranes, the membranes probed with the primary and secondary antibodies, and the signal was detected using enhanced chemiluminescence with ECL (Amersham Life Sciences) and X-OMAT films (Eastman Kodak). When indicated, the bands were quantitated by laser densitometry using GelScan XL (Pharmacia Biotech Sverige). To detect surface biotinylated proteins, after immunoprecipitation with appropriate antibodies, the immunoprecipitates were separated in SDS-PAGE (nonreducing) and transferred to PVDF membranes. After blocking 1 h at room temperature with 5% skim milk, the membranes were washed with Tris buffered saline Tween 20 and incubated 1 h at room temperature with 1:2,000 dilution of streptavidin conjugated with HRP (Boehringer Mannheim) in TBS 0.3% BSA. The membranes were washed three times with TBS and the signal was developed using the ECL method.
Results
Divergent In Vivo Behavior of HEp3 Cells Differing in Their Level of uPAR Expression
To study the mechanism responsible for dormancy induced by downregulation of uPAR, we used T-HEp3 (a mass culture prepared weekly from CAM tumors and maintained in culture for up to 1 wk), LK5, and LK25 (two clones of HEp3 cells transfected with a LK444 vector; Yu et al. 1997) as cell lines with a full complement of uPAR (uPAR-rich), and compared them to dormant cell lines with low uPAR levels, which included D-HEp3 obtained by prolonged passage of T-HEp3 cells in culture, (Ossowski and Reich 1983), AS24, AS33, and AS48 clones of T-HEp3 transfected with a vector expressing uPAR antisense (Yu et al. 1997). Compared with T-HEp3, LK5, and LK25 cells, the level of uPAR protein in D-HEp3 and AS24, AS33, and AS48 cell lysates was reduced by ∼80% (Fig. 1 A). A similar reduction in uPAR mRNA and surface uPAR number was found previously (Yu et al. 1997). We also showed (Yu et al. 1997) that while all cell types with high uPAR (a total of five) grew rapidly on CAMs, all cells in the group with low uPAR (five total) remained dormant for months, suggesting that these differences were not due to clonal selection. The dormancy was linked to a ∼70% reduction in bromodeoxyuridine incorporation into the DNA of tumor cells maintained in vivo, and not to enhanced cell death (Yu et al. 1997), indicating reduced proliferation.
Figure 1.
In vivo growth and cell cycle analysis of uPAR-rich (tumorigenic) and uPAR-deficient (dormant) cell lines. (A) Western blot of uPAR (R2 antibody, top) and ERK (loading control) (MK12 antibody, bottom) protein in lysates (50 μg protein each) of T-HEp3 (lane 1), D-HEp3 (lane 2), LK25 (lane 3), AS24 (lane 4), LK5 (lane 5), AS33 (lane 6), and AS48 (lane 7) cells. Lanes 8–10, purified soluble uPAR (suPAR) at 12, 60, and 120 ng, respectively (experiment was repeated three times). (B) Growth of HEp3 cells on CAMs. T-HEp3 (empty squares) or D-HEp3 cells (filled squares) were inoculated on CAMs and at the indicated times live tumor cells were counted (see Materials and Methods). Mean and SD (n = 4) of the number of cell divisions shown (experiment done twice). (C and D) Cell cycle analysis. T-HEp3 (C) and D-HEp3 (D) were inoculated on CAMs at 1–2 × 10⁶/CAM, and at the indicated times single tumor cell suspensions were prepared and processed for FACS® analysis based on DNA content (see Materials and Methods). The percentage of cells in each stage of the cell cycle is indicated: G0/G1 (empty bars), S phase (filled bars) and G2/M (striped bars). Each result represents the mean and SEM for at least three CAMs. Similar results were obtained in three additional experiments. *P < 0.005, # P < 0.015, as determined by Kruskal-Wallis statistics. A comparison of G0/G1 and S phases of T-HEp3 and D-HEp3 cells after 3 d of growth on CAMs showed statistically significant differences, P = 0.000 and P = 0.001, respectively.


To further analyze the proliferative failure in vivo, we inoculated D-HEp3 and T-HEp3 cells on CAMs, excised, and dissociated the CAMs, and either counted tumor cells daily (Fig. 1 B) or subjected them to cell cycle analysis (Fig. 1C and Fig. D). The T-HEp3 cells, which formed exponentially growing tumors, divided rapidly (six divisions in 6 d) on CAMs, whereas the number of D-HEp3, low uPAR cells, which formed very small nodules, did not increase (Fig. 1 B). Cell cycle analysis revealed that in comparison to T-HEp3 cells in culture (day 0), T-HEp3 cells in vivo had a statistically significant larger percentage of cells in S phase, a matching decline in the percentage of cells in G0/G1 and a matching fraction of cells in G2/M (Fig. 1 C). This change was noticeable as early as 24 h postinoculation and was maintained throughout the 6 d of observation. In contrast, D-HEp3 uPAR-deficient cells in vivo underwent a rapid increase in the percentage of G0/G1 cells, a rapid decline in the proportion of cells in G2/M, and a slower decline in the percentage of S phase cells (Fig. 1 D). There was no significant difference in the proportion of cells in the different cell cycle phases between T and D-HEp3 cells in culture, whereas already after 1 d on the CAMs, the percentage of dormant cells in G0/G1 was significantly larger than that of uPAR-rich cells, (P = 0.005), and on day 3, the percentage of cells in both G0/G1 and S phases was significantly different (P = 0.000 and 0.001, respectively).
Exit from G0/G1 and entry into S phase is promoted by growth factors that signal predominantly through the ERK pathway. Thus, we examined whether this pathway is altered in uPAR-deficient cells by comparing the basal state of activation of the ERK1/2 in uPAR-rich and low uPAR cells. Cells incubated in serum-free medium for 24 h were tested for levels of ERK and active phosphorylated ERK (ERK1-p44/ERK2-p42) proteins by Western blots. Compared with the level of phospho-ERK in T-HEp3, LK5, or LK25 cells, the level in D-HEp3, AS24, AS33, or AS48 cells was very low (approximately four to sixfold reduction) (Fig. 2 A), suggesting that the signal leading to ERK activation is impaired in uPAR-deficient cells. However, it should be noted, that despite the low level of active ERK, D-HEp3, AS24, AS33, or AS48 cells are capable of rapid proliferation in culture, possibly because a lesser level of activated ERK may be sufficient to initiate cell cycle progression in culture, or because parallel mitogenic pathways may be active. To distinguish between these possibilities, we interrupted the ERK pathway by blocking the activation of its immediate upstream activator MEK-1 with a specific inhibitor (PD98059). After 1 h of treatment with 10 μM PD98059, basal ERK phosphorylation was strongly reduced in LK25 cells and almost completely blocked in AS24 cells (Fig. 2 B, inset). Increasing concentrations of the compound induced a dose-dependent inhibition of cell proliferation in both cell types (Fig. 2 B), indicating that even at this low basal level, activation of ERK contributed to a mitogenic signal in uPAR-deficient AS24 cells in culture. Together, these results suggest that uPAR may be involved in triggering or coordinating a signaling mechanism that produces a powerful activation of the MEK-ERK pathway that may be crucial for mitogenic stimulus in vivo.
Figure 2.
Phosphorylation of ERK1/2 in uPAR-rich and uPAR-deficient cells and its role in cell growth in culture. (A). Activation of ERK. Confluent cultures were serum-starved for 24 h, incubated with fresh serum-free medium for 5 min, scraped, lysed, and analyzed by Western blotting (50 μg protein/lane) and tested for phospho-ERK (top), and after stripping of the membrane, for ERK1/2 (bottom) (experiment repeated six times). (B) Inhibition of growth by MEK-1 inhibitor. LK25 (empty squares) or AS24 (filled squares) were seeded in 24-well plates (1.5 × 10⁵ cell/well), grown in 10% FBS overnight, washed, and incubated with daily medium changes for 72 h, with or without the indicated doses of MEK-1 inhibitor-PD98059. The cells were detached and counted in a Coulter counter. Shown are mean and SD of triplicate determinations. Inset: LK25 and AS24 cell monolayers, grown as in B, treated for 1 h without (control) or with 10 μM of PD98059. Phospho-ERK levels shown: lanes 1 and 3, controls for LK25 and AS24 cells, respectively; lanes 2 and 4, PD98059 treatment of LK25 and AS24 cells, respectively (both experiments were repeated three times).


Is the Low Level of ERK Activation the Result of a Reduced uPA/uPAR Signaling Pathway?
Since in tumorigenic HEp3 cells 80–90% of uPAR is occupied by endogenously produced uPA (Ossowski 1992), and since binding of uPA, scuPA, or amino terminal fragment of uPA to uPAR is known to initiate signal transduction (Busso et al. 1994; Nguyen et al. 1998), we wished to test whether removal of the endogenous ligand interrupts the signal leading to ERK activation and whether its addition restores it. LK25 and AS24 cells stripped of endogenous uPA were incubated for 5 min with increasing concentrations of scuPA and tested for ERK phosphorylation. To avoid scuPA activation and protease-dependent effects, the reaction was carried out in the presence of 200 KIU/ml aprotinin. In LK25 cells, scuPA binding induced a strong, dose-dependent increase in phospho-ERK levels, with a maximal effect at ∼10 nM (Fig. 3 A, left). Neither the basal nor the stimulated levels of phospho-ERK were detectable in AS24 cells at the same time of exposure (data not shown). However, after a 10 times longer exposure of the blot (10 s versus 1 s used in Fig. 3 A, left) both basal and scuPA-induced active ERK became detectable. Densitometric analysis revealed that 1 nM concentration of scuPA (approximately its K d value) caused a maximal (approximately fourfold) stimulation of active ERK in LK25 cells, whereas causing no modulation in AS24 cells. The highest concentration of scuPA (80 nM) added to AS24 cells produced a large stimulation over the basal level (Fig. 3 A, right), but it still represented only <4% of active ERK in LK25 cells (Fig. 3 A, left). This result suggests that it is not the fold increase, but the absolute level of active ERK that needs to be high enough to surpass the required threshold for proliferation in vivo. Similar results were observed when T-HEp3 was compared with D-HEp3 cells (data not shown). Cells stripped of endogenous uPA had a very low level of active ERK that could be restored by incubation with exogenous scuPA, but not in the presence of the MEK-1 inhibitor PD98059 (Fig. 3 B), indicating that as shown before (Nguyen et al. 1998) the uPA-induced signal was propagated through the MEK1-ERK pathway. Also, time dependence of ERK activation by scuPA was different: whereas 10 nM scuPA induced a large increase in the level of phospho-ERK in LK25 cells, which at 10 min reached a plateau sustainable for at least 60 min, AS24 cells showed a less pronounced and much delayed activation of ERK by scuPA, peaking at 30 min and decreasing at 60 min (Fig. 3 C), suggesting that the ∼80% lower uPAR level in AS24 cells is incapable of evoking an optimal signal through this pathway.
Figure 3.
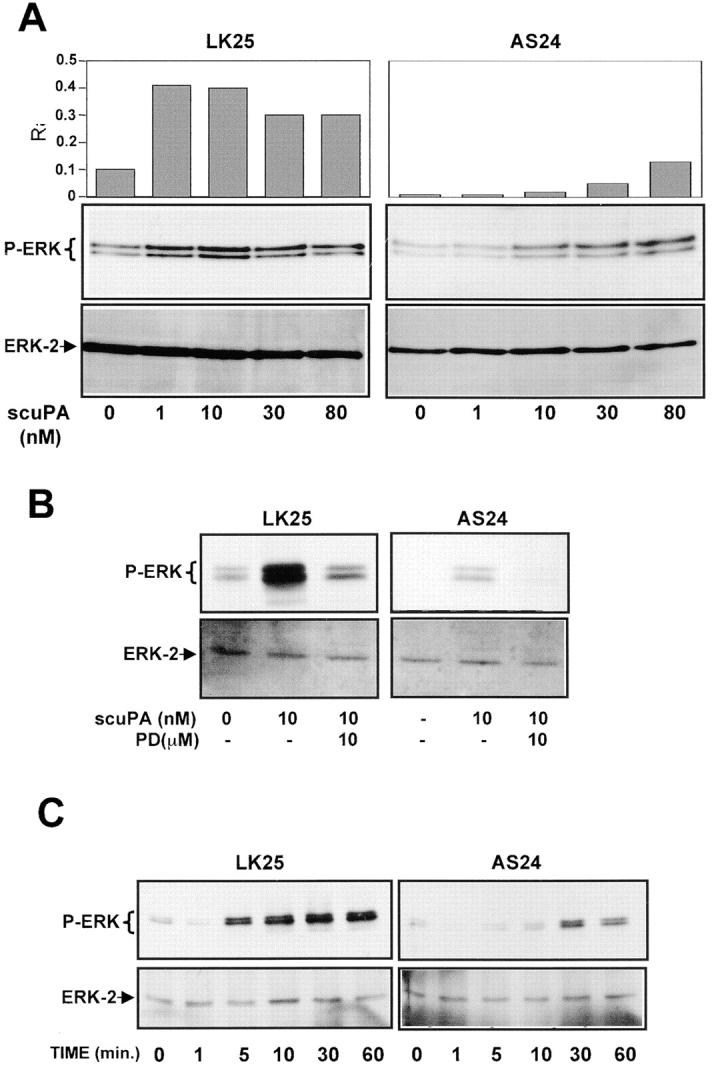
Analysis of uPA/uPAR–dependent signaling to ERK. (A) Effect of scuPA on phospho-ERK. Subconfluent cultures of LK25 or AS24 in 6-well plates were serum-starved for 24 h, acid-stripped (to remove uPAR-bound uPA), and incubated for 5 min with the indicated doses of scuPA and 200 KIU/ml of aprotinin (aprotinin was also used in B and C). The levels of phospho-ERK1/2 and ERK (lower panels) were determined by Western blot (see Materials and Methods); the exposure time in upper left panel is 1 s and in the upper right panel is 10 s (the experiment was repeated three times); the graphs show the Phospho-ERK/ERK ratio (R) obtained by densitometric scanning. (B) Effect of MEK-1 inhibitor on scuPA-induced ERK activation. LK25 or AS24 serum-starved cells were pretreated for 15 min with 10 μM of MEK-1 inhibitor PD98059, or medium alone. The monolayers were acid-stripped, incubated with 10 nM scuPA or medium alone, for 5 min, with or without 10 μM PD98059, lysed, and analyzed for phospho-ERK (upper panels) or ERK levels (lower panels) (experiment was repeated twice). (C) Time dependence of ERK activation by scuPA. LK25 or AS24 cell monolayers were acid-stripped and incubated for the indicated times with 10 nM scuPA. Phospho-ERK (upper panels) and ERK (lower panels) levels were determined (experiment was repeated twice).
α5β1 Integrin as a Potential Functional cis-Partner of the uPA/uPAR Complex
Interactions of uPAR with integrins are known to result in integrin activation in leukocytes during in vivo transendothelial migration (May et al. 1998) and in modulating integrin function as adhesion receptors (Wei et al. 1996). Therefore, we tested whether the approximately fivefold difference in uPAR expression between tumorigenic and dormant cells influences integrin activation and function. As a test of function, adhesion of cells was measured on immobilized extracellular matrix proteins, including FN, LN, collagen type I (CLI), and VN. Adhesion of uPAR-rich tumorigenic (T-HEp3 or LK25) cells to FN was always three to sevenfold greater than that of uPAR-deficient, dormant cells (D-HEp3, AS24, or AS33 cells), and this difference was maintained over a range of FN concentrations (Fig. 4 A, left and right panels). Adhesion to 0.5 μg/ml of FN revealed even greater differences (data not shown), but cells adhering to 0.5 μg were easily detached by washes, making the experiments more difficult. The differences (four to fivefold) in adhesion was maintained when tumorigenic and dormant cells were plated on 5 μg/ml of the 120-kD fragment of FN that lacks the α4β1 binding site (data not shown), confirming the involvement of the classical FN receptor. The uPAR-rich and low uPAR cells showed no difference in adhesion to other matrix proteins; both types of cells adhered well to CLI, but poorly to VN and LN (results not shown). The difference in adhesion to FN could not be explained by a difference in surface expression of FN-binding integrins, since their surface expression examined by FACS® analysis using antibodies to α5 and β1 (Fig. 4 B), α3 and αV (results not shown), and isotype-matched IgG as negative controls, showed that in every instance, the percentage of positive cells and the mean fluorescence intensity were similar or greater in the uPAR-deficient, dormant cells (Fig. 4 B and results not shown), suggesting that integrin function and not its surface level regulate adhesion to FN. Although, in addition to α5, the HEp3 cells express other FN-binding integrins, such as α3 and αV (data not shown), the fact that no difference in adhesion of tumorigenic and dormant cells to LN and VN was noted, suggests that these two integrins, although able to pair with β1, do not play a major role in the differential adhesion to FN, thus pointing to α5β1 as the likely candidate. To test this possibility directly, we examined the effect of β1-activating antibodies (TS2/16) and β1 (AIIB2) or α5β1 (BIIG2) function–blocking antibodies on adhesion to FN of dormant and tumorigenic cells. We found that adhesion to FN of D-HEp3 or AS24 cells was increased by 67 and 85%, respectively, by TS2/16 antibody, whereas the adhesion of T-HEp3 or LK25 cells was unaffected (Fig. 4 C). Treatment of cells with 1.5 mM MnCl2, which substantially increased the adhesion of dormant D-HEp3 or AS24 cells to FN, did not affect the adhesion of tumorigenic T-HEp3, or LK25 cells (Fig. 4 C) nor did it affect the adhesion of dormant cells to CLI (data not shown). Further support for a principal role for α5β1 integrin in mediating adhesion of HEp3 cells to FN is found in the observation that β1 and, more importantly, α5β1 function blocking antibodies (AIIB2 or BIIG2, respectively) reduced the adhesion to FN of all tested cells by ∼70–90%, indicating that regardless of the adhesion level (high in uPAR-rich and greatly reduced in low uPAR cells), the FN adhesion is predominantly mediated by α5β1 integrins and that the contribution to adhesion of other FN-binding integrins is marginal. Together, these results indicate that, a large proportion of α5β1 integrins in dormant uPAR-poor cells, although capable of being activated by Mn2+ or an activating antibody, are intrinsically inactive. In contrast, in malignant, uPAR-rich cells exposed to similar conditions, the α5β1 integrins are maintained in a state that allows for an optimal adhesion to FN.
Figure 4.
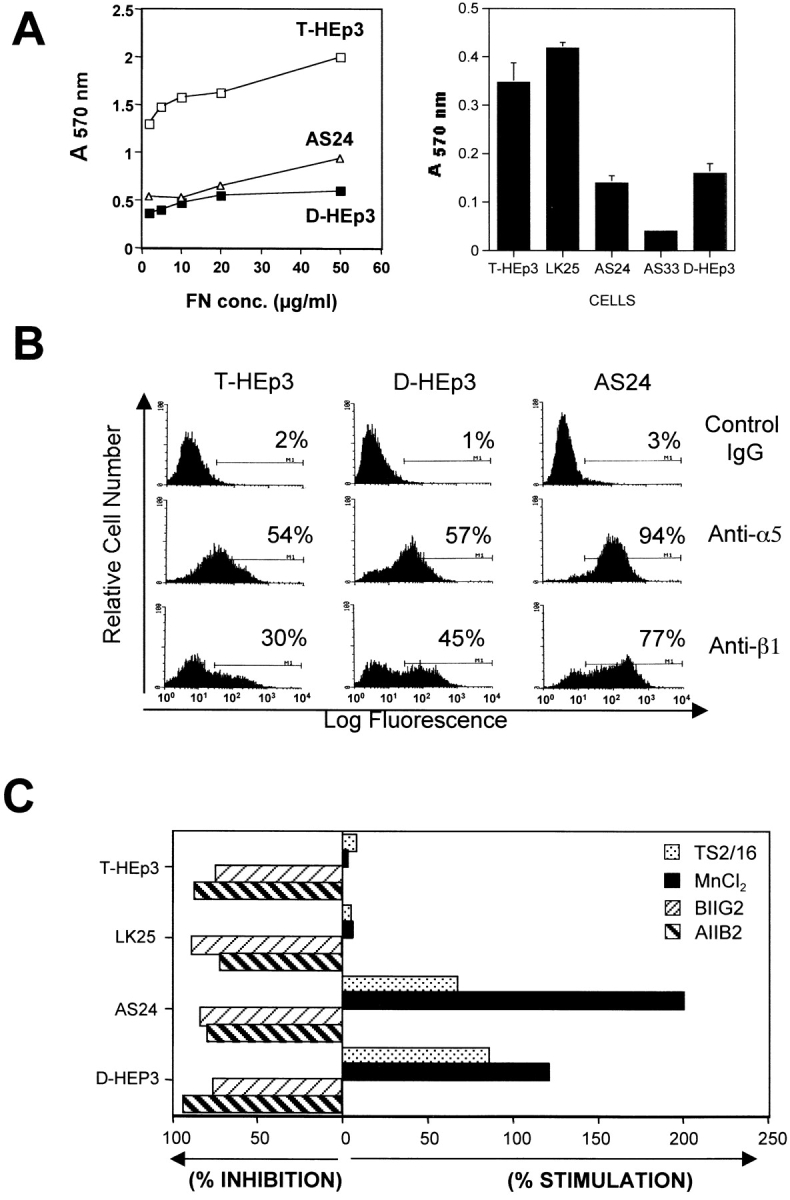
Adhesion to FN and analysis of integrin expression and activation in tumorigenic and dormant cells. (A, left) Adhesion to FN. Cells (2.5 × 10⁴ per well of 96-well plates, four wells per experimental point) were inoculated into wells coated with FN, incubated at 37°C for 30 min, fixed, and stained with crystal violet (see Materials and Methods), the dye was extracted, and the absorbance was measured at 570 nm. The inter-well absorbance differences were <15%. (A, right) Adhesion to FN of different tumorigenic (T-HEp3 and LK25) or dormant (AS24, AS33, and D-HEp3) cell lines (104 cells/well) into FN-coated (10 μg/ml) 96-well plates. Adhesion was measured after 20 min at 37°C as in A (left). (B) Surface expression of α5 and β1 integrins. Expression was measured using FACS® analysis as described in Materials and Methods. The antibodies used: isotype-matched mouse IgG-control for α5; anti-α5 (P1D6); anti-β1 (AIIB2). Cells treated with rat IgG similar to mouse IgG (not shown). (C). Stimulation and inhibition of cell adhesion to FN. Cells were incubated either with β1 or α5β1 blocking antibodies (AIIB2 or BIIG2, respectively) or with stimulating (TS2/16) anti-β1 integrin antibody, or without antibodies, and inoculated (104 cells/well) into FN-coated (10 μg/ml) 96-well plates. Adhesion was measured after 20 min at 37°C as in A. The effect of 1.5 mM MnCl2 was tested without preincubation. Adhesion in medium without antibodies or MnCl2 was considered 100% (experiment was repeated three times).
Is the state of α5β1 integrin activation reflected in its function as a signaling receptor? We found that T-HEp3 cells plated for 20 min on dishes coated with increasing concentrations of immobilized FN, showed a dose-dependent increase in the levels of active ERK as compared with cells on PL-coated dishes (PL facilitates cell attachment but avoids integrin engagement; Fig. 5 A, left). In contrast, D-HEp3 cells showed only marginal activation of ERK at 20 min on FN-coated dishes (Fig. 5 A, right). In LK25 or T-HEp3 cells, but not in dormant cells, FN activated ERK at similar concentrations at which it stimulated adhesion (data not shown and Fig. 5 A). ERK activation by FN in LK25 cells was maximal at 20 min, and remained at almost peak level for up to 90 min (Fig. 5 B, upper panel). In contrast, in AS24 cells, not only the magnitude of response was greatly reduced, but also the activation of ERK did not persist beyond 20 min (Fig. 5 B, lower panel). Some activation of ERK was observed in cells plated on PL for 45 and 90 min (Fig. 5 B). This was most likely caused by integrin-independent cell adhesion or because of deposition of endogenous FN matrix. It also has been reported that integrin engagement may activate the JNK pathway to promote cell cycle progression (Mainiero et al. 1997), but we found a similar basal level of active JNK in dormant and tumorigenic cells that was activated neither by FN (Fig. 5 C) nor by CLI (results not shown).
Figure 5.
Modulation by FN of ERK activation and cell growth in tumorigenic and dormant cells. (A) Activation of ERK by FN. 6-well plates were coated with PL (4 μg/ml) or with 0.4 and 4 μg/ml FN. HEp3 cells (left) or D-HEp3 cells (right) (1 × 10⁶ cells/well) were plated, allowed to attach for 20 min, lysed, and analyzed for phospho-ERK (upper panels) and ERK (lower panels) levels (experiment was repeated three times). (B) Time-course of FN-induced ERK activation. Cells plated into wells precoated with 4 μg/ml of PL or FN were incubated for 10, 20, 40, or 90 min, lysed, and examined for phospho-ERK and ERK levels (experiment was repeated three times). LK25 and AS24 cells plated on CLI and examined after 10 and 20 min showed no difference in ERK activation. The ratio of phosphoERK to ERK determined by densitometry was 0.34 and 0.43 for LK25, 10 and 20 min, and 0.37 and 0.39 for AS24 at 10 and 20 min, respectively. (C) Analysis of phospho-JNK. Cells (106) were plated in 6-well plates as follows: LK25 on PL (lane 1), on FN (lane 2), AS24 on PL (lane 3), on FN (lane 4), and analyzed after 20 min of incubation for phospho-JNK by Western blotting (the intensities of the bands remained constant for up to 90 min, not shown; experiment was repeated twice). (D and E) Effect of FN on cell growth. LK25 (D) or AS24 (E), serum-starved cells were plated at 0.8 × 10⁵ cells/well on 24-well plates coated with 0.04 (diamonds), 0.4 (circles), and 4 (triangles) μg/ml FN and at the indicated times, detached, and counted in a Coulter counter. Data shown as mean and SD of triplicate determinations (experiments were done three times). * P < 0.01 for all concentrations of FN versus uncoated (squares) surface, as determined by ANOVA test.


We next tested whether FN/α5β1–dependent ERK activation leads to increased cell proliferation. In serum-free medium, immobilized FN stimulated the growth of uPAR-rich LK25 cells in a dose-dependent fashion (Fig. 5 D), with doses even as low as 0.04 and 0.4 μg/ml producing significant stimulation of growth. In contrast, the growth of uPAR-deficient, dormant AS24 cells was only very marginally modulated, even by the highest FN concentration used (Fig. 5 E). This difference in response to FN was also observed with T-HEp3 and D-HEp3 cells (results not shown). These same doses of FN differentially stimulate ERK activation and adhesion in tumorigenic and dormant cells (data not shown and Fig. 5A and Fig. B). These results strongly suggest that uPAR-deficient cells may have an impairment in the activation pathway of MEK1/ERK by an FN/α5β1/uPAR signaling mechanism.
Does Interaction between uPAR and α5β1 Play a Role in ERK Activation?
To answer this question, we first examined whether uPAR and β1, α5, or α5β1 integrins were physically associated by testing the ability of anti-β1, α5, or α5β1 antibodies to coimmunoprecipitate (co-IP) uPAR and of uPAR antibodies to co-IP α5β1 integrins from cell lysates. Cell lysates were IP-ed and Western blotted. IP with anti–β1 antibody revealed a complex with uPAR, which was vastly reduced in the D-HEp3 and AS24 cells as compared with T-HEp3 cells, reflecting, most likely, the low level of uPAR in these cells (Fig. 6 A). All three cell type lysates contained similar amounts of β1 protein (Fig. 6 A, upper panel). In a second approach, lysates of surface biotinylated cells were IP-ed with anti–β1, α5, α5β1, and uPAR antibodies. Anti–α5β1 (BIIG2) or α5 (P1D6) antibodies coimmunoprecipitated 55-, 116-, and 150-kD bands, which correspond to uPAR, β1, and α5 integrins, respectively (Fig. 6 B, left) (two additional bands of ∼130 and 80 kD were also present, but not yet identified). As shown before for β1 association with uPAR, in spite of similar amounts of β1 (Fig. 6 C) and α5 integrins present on the surface of all cells tested, the amount of uPAR in complex with α5β1 was 3.3–7-fold less in AS24 cells than in LK25 or T-HEp3 cells (Fig. 6 B). The identity of uPAR and β1 integrin was verified by a parallel IP with anti–uPAR antibodies (Fig. 6 B, second lane) and anti–β1 antibodies (Fig. 6 B, right panel). The ability of the different antiintegrin antibodies to co-IP uPAR from biotinylated cells (Fig. 6 B, left and right) suggests a plasma membrane association for these proteins. It also shows that biotinylation does not prevent the antibodies from recognizing their specific antigens. Taken together these results, along with the results showing inhibition of adhesion to FN by anti–β1 or α5β1 antibodies, strongly support the presence of a functional surface adhesion and signaling complex formed by uPAR and α5β1 integrins, which is more prevalent on uPAR-rich cells. Thus, the severe deficiency of dormant cells in integrin α5β1 adhesive and signaling properties is most likely due to the reduced number of active α5β1–uPAR complexes on the surface of these cells.
Figure 6.

Physical and functional association between uPAR and α5β1 integrin. (A) Coimmunoprecipitation of β1-integrin and uPAR. T-HEp3, D-HEp3, or AS24 cells were lysed in Triton X-100 buffer (see Materials and Methods), centrifuged, and the pellets were extracted with RIPA buffer. Cell proteins (400 μg) were mixed with anti–β1 antibody (TS2/16) or G beads (G-control) or isotype-matched mouse IgG (IgG-control) and the resulting IPs were analyzed by Western blotting with anti–β1 integrin antibodies (upper panel) or anti–uPAR antibodies (lower panel) (experiment was repeated twice). (B, left) Cells were surface-biotinylated and the cell extracts were subjected to IP with anti-α5β1 (BIIG2), anti-uPAR (R2), anti-α5 (P1D6), or with isotype-matched IgG antibodies and analyzed by streptavidin-HRP binding to biotinylated proteins after SDS-PAGE and transfer to PVDF membranes. The arrows on the left indicate the positions of α5, β1, and uPAR. (B, right) Surface-biotinylated proteins were immunoprecipitated with anti–β1 antibodies (TS2/16) and the biotinylated coimmunoprecipitating proteins were detected as described above. The arrows indicate the position for α integrin, β1 integrin, and uPAR. (C) Western blot for β1 integrin from whole cell lysates from the two tumorigenic (T-HEp3 and LK25) or the two dormant (D-HEp3 and AS24) cell lines. The arrows indicate the position of β1 and pre-β1 integrin.
We next examined whether the low level of ERK activation in uPAR-deficient cells can be corrected by exogenously added, soluble uPAR (suPAR). Such an effect would suggest that β1 integrin or other extracellular domains of transmembrane proteins may serve as uPAR adapter molecules mediating its effect on ERK activation. LK25 or AS24 cells were incubated for 5 min with increasing concentrations of suPAR and tested for ERK phosphorylation. While not affecting ERK in LK25 cells, suPAR induced a dose-dependent phosphorylation of ERK in AS24 cells, with maximal stimulation occurring at 5 ng/ml (∼0.5 nM) (Fig. 7 A; T-HEp3 cells behaved like LK25 and D-HEp3 like AS24, results not shown). The addition of suPAR did not fully restore the level of ERK activation found in uPAR-rich cells, suggesting that GPI-anchored uPAR may be more effective in integrin activation. Taken together, these results strongly suggest that a full complement of uPA/uPAR, through an interaction with α5β1 integrin, may be responsible for the high level of ERK activation in LK25 and T-HEp3 cells.
Figure 7.

Effect of β1-integrin–uPAR complex disruption and suPAR treatment on ERK activation. (A) Effect of soluble uPAR on ERK activation. LK25 (top panels) or AS24 (bottom panels) monolayers were serum-starved for 24 h and incubated with suPAR for 5 min in the presence of 200 KIU/ml of aprotinin. The cells were lysed and the proteins were analyzed for phospho-ERK and ERK levels (experiment was repeated three times). (B) Effect of anti–uPAR antibodies on ERK activation. T-HEp3 cells were incubated in suspension with medium alone (lanes 1 and 2), 7 μg/ml of isotype-matched IgG (lane 3), or with 7 μg/ml of anti–uPAR antibody (R2, lane 4) at 37°C for 35 min and inoculated into plates coated with 4 μg/ml PL (lane 1) or FN (lanes 2–4), allowed to adhere for 10 min, lysed, and analyzed for phospho-ERK (upper panel) and ERK (lower panel) levels. The numbers on top of each lane show the ratio of phospho-ERK/ERK determined by densitometry. (Experiment repeated twice). (C) Effect of peptide 25 (P25) on ERK phosphorylation. Subconfluent monolayers of T-HEp3 cells were treated with peptide 25 or its scrambled version (SP25) for 10 min, the cells were lysed, and phospho-ERK and ERK levels were determined. (D) Effect of anti–β1 antibody and peptide 25 on adhesion-activated ERK. Suspensions of T-HEp3 cells were incubated with or without anti–β1 antibodies (AIIB2) or isotype-matched IgG for 30 min, the cells plated on plastic plates coated with 4 μg/ml of PL or a combination of PL + 4 μg/ml FN and after 15 min tested for phospho-ERK and ERK levels. In addition, T-HEp3 cells were plated on FN in the presence or absence of 5 μM peptide 25 and tested as above.
The observation (Fig. 3A and Fig. C) that binding of scuPA to uPAR increases the uPAR–integrin β1-mediated ERK activation signal suggests that a change in uPAR conformation may mediate this interaction. Therefore, we examined whether incubation of uPAR-rich cells with anti–uPAR antibodies affects ERK activation by FN. Preincubation of T-HEp3 or LK25 cells with mAbs (R2), which recognize domain 3 of uPAR, strongly inhibited FN-dependent activation of ERK, whereas irrelevant, isotype-matched IgG had little or no effect (Fig. 7 B). Antibody to domain 1 of uPAR also blocked ERK activation but to a somewhat lesser degree (results not shown).
To further examine the notion that uPAR–β1 interaction may be important for ERK activation, we treated T-HEp3 and LK25 cells with a peptide (peptide 25) that has been shown previously to interfere with the physical and functional interaction of uPAR and β1 integrins (Wei et al. 1996, Wei et al. 1999). Peptide 25, but not its scrambled version, when added to adherent cells, was capable of reducing ERK activation in a dose-dependent manner (Fig. 7 C; a lower concentration [0.1 μM] was ineffective and 1 μM was almost as effective as 5 μM [results not shown]). Preincubation of suspended T-HEp3 cells with peptide 25, followed by their plating on FN, produced a similar reduction in ERK activation (Fig. 7 D) without diminishing the ability of cells to adhere to FN. A recently published report (Wei et al. 1999) showed a similar lack of effect of peptide 25 on adhesion of uPAR and caveolin transfected 293 kidney cells or smooth muscle cells to FN. ERK activation could also be diminished by preincubation of T-HEp3 cells with a blocking anti–β1 antibody. In this experiment the cells remained adherent, as they were plated on a mixture of FN and PL (Fig. 7 D). Therefore, interfering with uPAR/β1/FN interaction or β1–FN interaction both lead to a similar block in ERK activation.
Collectively, our experiments show that binding of uPA to uPAR, by associating predominantly with α5β1 integrin, forms a complex that signals through MEK1-ERK1/2 activation, and that high density of uPAR increases this effect. In an effort to identify additional downstream members of this cascade, we tested whether Shc and Grb2, previously described to coimmunoprecipitate with β1 integrin (Wary et al. 1996, Wary et al. 1998), were in a complex with β1/uPAR immunoprecipitates. Although the 52- and 46-kD forms of Shc and Grb2 could be readily immunoprecipitated from tumorigenic or dormant cells (data not shown), we have been unable so far to find these proteins in complex with β1 integrins, either in the soluble or insoluble fractions of Triton X-100 lysates. Similarly, an Src-like tyrosine kinase, Hck, could be immunoprecipitated from both types of cells, but was not found to be differentially phosphorylated or in complex with β1 integrin (data not shown). We were also unable to show that, as described previously (Wary et al. 1996), binding of HEp3 cells to FN induced Shc phosphorylation (data not shown).
Comparison of ERK Activation In Vivo in Tumorigenic and Dormant Cells
In a recent report, active ERK level was shown to be higher in human renal carcinomas as compared with the surrounding normal tissue (Oka et al. 1995), suggesting that the findings in our model system may reflect the situation in human cancer. Thus, it was of major importance to test whether the high level of active ERK is present in the uPAR-rich, tumorigenic cells in vivo. Since the available anti–phospho-ERK antibodies recognize equally well chicken and human phospho-ERK (results not shown), to detect the ERK originating specifically in tumor cells, we transiently transfected the tumor cells with a construct expressing HA-tagged ERK2. By immunoprecipitating HA-ERK2 with anti–HA antibodies and analyzing the precipitate by Western blotting using either anti–HA antibodies (loading control) or anti–phospho-ERK antibodies, we showed that HA-ERK expression was maximal at 48 h after transfection and, as with the native ERK, the level of phosphorylation of HA-ERK was much greater in LK25 as compared with AS24 cells (Fig. 8 A and results not shown). To examine the state of ERK phosphorylation in vivo, 24 h after transfection with HA-ERK, the two tumorigenic and two dormant cell types were inoculated on CAMs and incubated in vivo for an additional 24 h. The areas of CAM containing tumor cells were excised, lysed, subjected to IP with anti–HA antibodies, and analyzed by Western blotting for HA-ERK2 and phospho-ERK content. Fig. 8 B shows that the level of phosphorylated ERK2 was three to sixfold greater in T-HEp3 and LK 25 cells than in D-HEp3 and AS24 dormant cells, respectively, indicating that the difference in the signal leading to ERK activation was maintained in vivo.
Figure 8.
Analysis of ERK activation and the role of β1-integrin/uPAR signaling in vivo. (A) HA-ERK expression and phosphorylation in culture. LK25 (lanes 1, 2, and 4) or AS24 (lane 3) cells were either transfected (lanes 2, 3, and 4) or mock-transfected (lane 1) with 10 μg of expression vector coding for hemagglutinin-tagged ERK2 (HA-ERK2). After 48 h in culture, cell lysates were subjected to IP with an anti–HA antibody (lanes 1–3) or isotype-matched IgG (lane 4). IPs were analyzed by Western blotting using either anti–HA antibodies (lower panel) or anti phospho-ERK antibodies (upper panel) (experiment was repeated three times). (B) HA-ERK expression and phosphorylation in vivo. T-HEp3 (lanes 1, 2, and 6), LK25 (lane 3), D-HEp3 (lane 4), or AS24 (lane 5) cells were transfected as in A but, after 24 h in culture, the cells were detached and inoculated on the CAMs (2.5 × 10⁶ cells/CAM, see Materials and Methods). After 24 h of growth in vivo, the CAMs containing tumor cells were analyzed by IP using anti–HA antibodies (lanes 1–5) or isotype-matched IgG (lane 6). HA-ERK2 was determined by Western blotting with anti–HA (lower panel) and its level of phosphorylation with anti–phospo-ERK antibody (upper panel). The numbers below lanes 2 and 3 in A and 2, 3, 4, and 5 in B indicate the ratio of phospho-HA-ERK2/HA-ERK2 determined by densitometry. (C) The effect of anti-β1 blocking antibody or anti-uPAR (domain 3) antibody on T-HEp3 proliferation in vivo. T-HEp3 cells were incubated for 40 min with medium alone (C), 15 μg/ml of isotype-matched IgG (IgG), 15 μg/ml of anti–CD55/DAF mAb (CD55), 7 μg/ml of monoclonal anti-uPAR (R2) antibody, 10 μg/ml of anti-β1 blocking mAb (AIIB2) or R2 + AIIB2 (same concentrations, R2/AIIB2). Cells (106 HEp3 cells/CAM) were inoculated on CAMs of 9-d-old chick embryos and, after 3 d, the number of cells per tumor was determined (see Materials and Methods). (R2, AIIB2, and antibody combination treatment was repeated twice.)


Does Interference with the Function of uPAR/β1/FN Signaling Complex Affect the Growth of Tumorigenic Cells In Vivo?
Our results indicate that a functional association between α5β1 integrins and uPAR in tumorigenic cells with a full complement of uPAR is necessary for their optimal adhesion to FN and for transducing the FN-dependent activation of ERK. Therefore, we asked whether inhibition of ERK-activation by β1 integrin function–blocking antibodies (AIIB2) (Fig. 7 D) and/or antibody to uPAR (R2) (Fig. 7 B), will reduce cell proliferation in vivo. Cells were pretreated with the appropriate antibodies, inoculated on the CAMs, and the number of tumor cells per CAM was determined on day 1, 3, and 7 postinoculation. Regardless of treatment, on day 1, only slightly more than a third of the inoculum was recoverable from the CAMs. On day 3, while the T-HEp3 cells, either untreated, or pretreated either with nonimmune IgG or irrelevant antibody (anti-CD55, CD55 is expressed in HEp3 cells, results not shown) underwent at least two divisions, cells pretreated either with anti–uPAR (R2), anti–β1 (AIIB2), or both antibodies, underwent only ∼0.5 divisions (Fig. 8 C). The combination of antibodies exerted a slightly stronger inhibitory effect than each antibody individually. The number of cells on day 7 of in vivo incubation was similar in all groups indicating that the effect was transient. These results show that by interfering with the uPAR/β1/FN signaling complex that activates ERK, we can mimic the effect of uPAR deficiency, and that disruption and reduced abundance of this signaling complex may be responsible for the dormancy of uPAR-deficient cells.
Discussion
We have previously shown that downregulation of surface uPAR expression in human carcinoma cells, brings about a state of tumor dormancy characterized by cancer cell survival unaccompanied by an increase in tumor mass. This outcome is the result of a reduced proliferation rate and not of increased apoptosis (Yu et al. 1997). We set out to explore the mechanism through which a reduction in uPAR can evoke such dramatic changes. The proposed hypothesis stated that only levels of uPAR above a given threshold will, when saturated by uPA and laterally interacting with a putative transmembrane partner(s), initiate an outside-in signaling cascade capable of maintaining cancer cells in a proliferative state in vivo. A reduction in the surface expression of uPAR should restrict the magnitude of this signal, leading to dormancy.
We were able to show that uPAR is physically associated with an FN-binding integrin, α5β1. Since low uPAR cells express similar or greater levels, of α5β1 than uPAR-rich cells, it could not be their mere physical presence on the cell surface that affects the behavior of uPAR-rich and low uPAR cells. Therefore, we concluded that in uPAR-rich cells α5β1 integrin, through its interaction with uPAR, must be held in an active state. The high level of uPAR leads to an in increase in the proportion of integrins sequestered into these interactions exceeding a threshold necessary for effective adhesion to FN, FN-dependent activation of ERK, and cell proliferation in vivo.
Cell cycle progression analysis of the uPAR-rich (T-HEp3 cells) and low uPAR (D-HEp3) cells in culture and in vivo indicated that a reduction in uPAR expression renders the cells either incapable to respond to, or unable to generate a sufficient signal to propel them through G0/G1 in vivo. This was underscored by the fact that in culture, the proportion of cells in the different cell cycle phases was similar, whereas only after 24–48 h of in vivo exposure, the proportion of cells in G0/G1 in D-HEp3 cells rapidly increased and the G2/M and S phases declined. In contrast, the S phase fraction of T-HEp3 cells significantly increased and the G0/G1 consistently declined (Fig. 1C and Fig. D). Our findings (Fig. 2 A and 8 B) strongly suggest that the in vivo growth arrest of the uPAR-deficient cells is due to an interruption of the pathway to ERK activation. However, as indicated by the inhibition of ERK activation and growth of uPAR-deficient cells by a specific MEK1 inhibitor (Fig. 2 B), the low level of active ERK in these cells is sufficient to promote their growth in culture. This is not unexpected as most normal cell lines proliferate rapidly in culture, but do not develop tumors in nude mice, syngeneic animals, or the CAM of chick embryos. These cells become tumorigenic when transformed by oncogenic viruses known to hyperactivate, among others, the ERK pathway. It is also possible that other MAP kinases, such as JNK, which we showed to be equally active in both cell types, may contribute to cell cycle progression in culture. The observed difference in ERK activation in vitro and in vivo correlates with the findings showing that primary lesions of human renal cell carcinoma display hyperactivated ERK1/2 (Oka et al. 1995).
uPAR, a GPI-linked protein has been previously shown to associate with, and modulate the function of integrins from three different families (β1, 2, and 3) (Xue et al. 1994, Xue et al. 1997; Wei et al. 1996). We confirmed the physical association of uPAR and α5β1 integrin in HEp3 cells by co-IP experiments with anti–α5, β1, or α5β1 antibodies (Fig. 6A and Fig. B). By comparing the effect of MnCl2 and anti-β1 activating antibodies (TS2/16), known inducers of integrin activation, we determined that, as measured by cell binding to FN, the α5β1 integrins in uPAR-rich cells were constitutively active and resistant to further stimulation. In low uPAR cells the integrins were inactive but responsive to stimulation. This difference in integrin avidity had an important consequence for intracellular signal transduction: the attachment of uPAR-rich cells to FN was accompanied by a persistent (up to 90 min) increase in the level of phospho-ERK, followed by increased cell proliferation in serum-free medium (Fig. 5A and Fig. D). In low uPAR cells, the amount of uPAR–α5β1 integrin complex was greatly reduced, the adhesion to FN was low, the maximal ERK stimulation by FN was greatly diminished in scope and duration (Fig. 5 A), and no effect on cell proliferation was noted (Fig. 5 E). We tentatively concluded that since both cell types have similar levels of α5β1 (Fig. 4 B), that it is the high density of uPAR in T-HEp3 and LK25 cells that, through lateral interactions with α5β1, is responsible for the initiation of signal transduction events leading to ERK activation and cell proliferation. This response appears to be specific for FN integrins, since no differential response with regard to effect of attachment on ERK activation was found between uPAR-rich and low uPAR cells adherent to CLI. (Fig. 5 B, see legend). Our findings are in agreement with published evidence showing a proximity by resonance energy transfer technique of uPAR and β1 integrin in HT1080 fibrosarcoma cells (Xue et al. 1997), which like T-HEp3 and LK25 cells form large, progressively growing tumors on CAMs (Kim et al. 1998). The growth of other cancer cells, such as primary and metastatic melanomas (Mortarini et al. 1992) and colon carcinoma HT29 (Varner et al. 1995), showed an α5β1-mediated stimulation of cell growth on FN but the level of uPAR in these cells was not tested. Also, growth inhibition in nude mice was observed in transformed bronchial epithelium treated with anti–α5β1 antibodies (Schiller and Bittner 1995).
If ERK activation is dependent on the abundance of uPAR, it should theoretically be possible, by adding suPAR to uPAR-deficient cells, to increase the frequency of lateral interactions between uPAR and α5β1 and, thus, ERK activation. Indeed, we found that incubation of uPAR-deficient cells with 5 ng/ml of suPAR-stimulated ERK activation (Fig. 6 B), indicating that even when not anchored in the plasma membrane, uPAR can affect signal transduction and, possibly, in vivo proliferation of cancer cells. This may have importance in cancer progression as high levels of circulating suPAR have been shown to be associated with some cancers (Sier et al. 1998) and may, by binding to cells in existing metastatic foci, stimulate their growth.
Previous reports from our and other laboratories have shown that binding of pro-uPA to its receptor results in a de novo association of various intracellular proteins, such as nonreceptor tyrosine kinases (Busso et al. 1994; Bohuslav et al. 1995; Konakova et al. 1998), with uPAR (as determined by their co-IP with anti–uPAR antibodies), and that uPA binding can initiate signal transducing events (Nguyen et al. 1998; Tang et al. 1998). Although, the mechanism responsible for these effects has not been elucidated, one possible explanation may be that binding of pro-uPA to uPAR may change its conformation and as a result, change the nature of its interactions with specific, signal transducing transmembrane proteins such as integrins. We used several reagents, including pro-uPA, antibodies to domain 3 of uPAR (Ronne et al. 1991), and a peptide that has been shown previously to disrupt interactions between β1 integrins and uPAR (Wei et al. 1996, Wei et al. 1999) to explore their potential effect on ERK activation. Treatment of uPAR-rich cells with low pro-uPA concentrations (1 nM, equivalent to the K d value for uPAR binding in these cells) produced a level of active ERK that was 33-fold greater than the maximal level of active ERK produced by 80 times higher scuPA concentration in low uPAR cells (Fig. 3A and Fig. C). This supports our hypothesis that only when uPAR–integrin interactions are frequent enough, can substantial ERK activation be achieved. In uPAR-rich cells, this is achieved even when only a fraction of the receptors is uPA-bound, whereas in low uPAR cells, only when most of the uPAR is uPA-bound, some degree of stimulation is observed, explaining the need for high uPA concentrations. In support of this conclusion, we showed that the antibody to domain 3 of uPAR reduced ERK activation upon cell adhesion to FN (Fig. 6 C). Also, a peptide shown previously to disrupt uPAR–β1 interaction (Wei et al. 1996) produced a dose-dependent reduction of ERK activation in tumorigenic cells, without affecting adhesion to FN. In contrast to our findings, the authors of this study concluded that uPAR–β1 interaction deactivates the integrin and blocks adhesion to FN. While our manuscript was in preparation, Wei et al. 1999 have published results similar to ours, in which uPAR–β1 interaction led to ERK activation on FN in smooth muscle cells and peptide 25 disrupted this function without affecting adhesion. The authors ascribed this controversy in their findings to the caveolin content of different cells, suggesting that other proteins may participate in the uPAR–integrin complex. However, we found caveolin not to be present in extracts of either tumorigenic or dormant cells tested by Western blotting (results not shown), suggesting that integrin activation may depend on specific cellular contexts. In our cells, the lateral interaction of uPAR with α5β1 in the presence of uPA, is capable of keeping the MEK-ERK pathways constitutively active and the uPAR-rich cells proliferating on FN.
We have only began our inquiry into the additional components of the signal transduction pathway that leads from α5β1 to ERK activation. Published reports (Wary et al. 1996, Wary et al. 1998) showed that phosphorylation of the adapter molecule Shc, and recruitment of Grb2 are in this pathway, and that Shc can be coimmunoprecipitated with β1 integrins. However, we did not yet find that adhesion of uPAR-rich cells to FN leads to Shc phosphorylation or that Shc coimmunoprecipitates with β1 integrins in uPAR-rich or -poor cells. The participation of Shc may depend on the cell type or on the experimental conditions, since other authors have also failed to detect Shc phosphorylation upon adhesion to FN (Zhao et al. 1998; Wei et al. 1999). It remains possible that only very potent cross-linking, such as that induced by antibodies immobilized on beads (Wary et al. 1996, Wary et al. 1998), is needed to detect Shc in anti-β1 immunoprecipitates. Similarly, we could not detect activation of Hck, the Src-like kinase, reported to occur upon DFP-uPA treatment of other tumor cells (Konakova et al. 1998), or its association with β1 integrin. Although JNK activation may be involved in promoting cell cycle progression on LN (Mainiero et al. 1997), we did not find that JNK was activated when cells were plated on FN for 20 min, pointing so far to ERK as the main participant. We cannot exclude a role for other kinases such as Src, Fyn, Yes, Lck, FAK (Lin et al. 1997; Zhao et al. 1998; Wary et al. 1998), or the integrin linked kinase (Radeva et al. 1997), which have been reported to influence cell cycle progression (Wu et al. 1998).
Finally, since we showed that a high level of uPAR, its association with uPA, and adhesion of cells to FN, converge to generate strong ERK activation, which is maintained in vivo, we tested and found that the interruption of this signal transiently inhibited in vivo proliferation. Therefore, a rapid, FN-induced ERK activation must take place for the cells to enter and progress through the cell cycle in vivo. Interruption of this signal mimics, at least transiently, the initial steps responsible for the state of dormancy.
In summary, we have found that, when present at a high level, uPAR interacts and holds the integrin α5β1 in an active state. Adhesion to FN organizes a signaling complex leading to a full activation of MEK1/ERK. It appears that only when a signal above a certain threshold is generated by the combined effect of uPA/uPAR/α5β1 and FN, the cells are capable of in vivo growth. As uPAR-rich and low uPAR cells produce similar amounts of uPA (Yu et al. 1997), and express similar levels of α5β1 (Fig. 4 B), the observed difference in signaling must be dependent on uPAR levels. When the cascade is interrupted or diminished, as with anti–uPAR or anti–β1 antibodies or by downregulation of uPAR, the signaling complex switches to the off state and the cells become unable to grow in vivo. A somewhat similar situation was described in breast cancer (Wang et al. 1998), where a cross-talk between the EGF receptor and β1 integrins kept the cells in a tumorigenic mode with high ERK activation. When the aberrant β1, EGF receptor, or ERK signaling was corrected, tumor cells underwent differentiation and stopped growing. However, to the best of our knowledge, ours is the first published report in which induction of tumor dormancy in vivo was shown to be dependent on blocking the function of FN-dependent uPA/uPAR/β1 signal leading to MEK/ERK activation.
Acknowledgments
We would like to thank Dr. Rafael Mira y Lopez (Mount Sinai School of Medicine, New York, NY) for critical reading of the manuscript, Dr. Samuel Waxman for continuous encouragement and support, Dr. Fillipo Giancotti (Memorial Sloan-Kettering Cancer Center, New York, NY) for the HA-ERK2 construct, Dr. Francesco Blasi for the gift of suPAR and R2 antibody, Dr. Steve Rosenberg (Chiron Corporation) for the gift of peptide 25, and Dr. Caroline H. Damsky (University of California San Francisco, San Francisco, CA) for AIIB2 and BIIG2 antibodies.
This work was supported by U.S. Public Health Service Research Grant CA-40758 (L.O.) and The Samuel Waxman Cancer Research Foundation.
Footnotes
1.used in this paper: CAM, chorioallantoic membrane; CLI, collagen type I; co-IP, coimmunoprecipitate; ERK, extracellular regulated kinase; FN, fibronectin; GPI, glycosyl phosphatidylinositol; IP, immunoprecipitate; LN, laminin; MAPK, mitogen-activated protein kinase; RTK, receptor tyrosine kinase; scuPA, single chain uPA; uPAR, urokinase plasminogen activator receptor; VN; vitronectin
References
- Andreasen P.A., Kjøller L., Christensen L., Duffy M.J. The urokinase-type plasminogen activator system in cancer metastasisa review. Int. J. Cancer. 1997;72:1–22. doi: 10.1002/(sici)1097-0215(19970703)72:1<1::aid-ijc1>3.0.co;2-z. [DOI] [PubMed] [Google Scholar]
- Bazzoni G., Ma L., Blue M.L., Hemler M.E. Divalent cations and ligands induce conformational changes that are highly divergent among β1 integrins. J. Biol. Chem. 1998;273:6670–6678. doi: 10.1074/jbc.273.12.6670. [DOI] [PubMed] [Google Scholar]
- Bohuslav J., Horejsi V., Hansmann C., Stockl J., Weidle U.H., Majdic O., Bartke I., Knapp W., Stockinger H. Urokinase plasminogen activator receptor, beta 2-integrins, and Src-kinases within a single receptor complex of human monocytes. J. Exp. Med. 1995;181:1381–1390. doi: 10.1084/jem.181.4.1381. [DOI] [PMC free article] [PubMed] [Google Scholar]
- Busso N., Masur S.K., Lazega D., Waxman S., Ossowski L. Induction of cell migration by pro-urokinase binding to its receptorpossible mechanism for signal transduction in human epithelial cells. J. Cell Biol. 1994;126:259–270. doi: 10.1083/jcb.126.1.259. [DOI] [PMC free article] [PubMed] [Google Scholar]
- Chapman H.A. Plasminogen activators, integrins, and the coordinated regulation of cell adhesion and migration. Curr. Opin. Cell Biol. 1997;9:714–724. doi: 10.1016/s0955-0674(97)80126-3. [DOI] [PubMed] [Google Scholar]
- Damsky C.H., Werb Z. Signal transduction by integrin receptors for extracellular matrixcooperative processing of extracellular information. Curr. Opin. Cell Biol. 1992;4:772–781. doi: 10.1016/0955-0674(92)90100-q. [DOI] [PubMed] [Google Scholar]
- Dong Z., Kumar R., Yang X., Fidler I.J. Macrophage-derived metalloelastase is responsible for the generation of angiostatin in Lewis lung carcinoma. Cell. 1997;88:801–810. doi: 10.1016/s0092-8674(00)81926-1. [DOI] [PubMed] [Google Scholar]
- Fazioli F., Resnati M., Sidenius N., Higashimoto Y., Appella E., Blasi F. A urokinase-sensitive region of the human urokinase receptor is responsible for its chemotactic activity. EMBO (Eur. Mol. Biol. Organ) J. 1997;16:7279–7286. doi: 10.1093/emboj/16.24.7279. [DOI] [PMC free article] [PubMed] [Google Scholar]
- Folkman J. Angiogenesis in cancer, vascular, rheumatoid and other diseases. Nat Med. 1995;1:27–31. doi: 10.1038/nm0195-27. [DOI] [PubMed] [Google Scholar]
- Kim J., Yu W., Kovalski K., Ossowski L. Requirement for specific proteases in cancer cell intravasation as revealed by a novel semiquantitative PCR-based assay. Cell. 1998;94:353–362. doi: 10.1016/s0092-8674(00)81478-6. [DOI] [PubMed] [Google Scholar]
- Kirchheimer J.C., Wojta J., Christ G., Binder B.R. Proliferation of a human epidermal tumor cell line stimulated by urokinase. FASEB (Fed. Am. Soc. Exp. Biol.) J. 1987;1:125–128. doi: 10.1096/fasebj.1.2.3038646. [DOI] [PubMed] [Google Scholar]
- Konakova M., Hucho F., Schleuning W.D. Downstream targets of urokinase-type plasminogen-activator-mediated signal transduction. Eur. J. Biochem. 1998;253:421–429. doi: 10.1046/j.1432-1327.1998.2530421.x. [DOI] [PubMed] [Google Scholar]
- Kook Y.H., Adamski J., Zelent A., Ossowski L. The effect of antisense inhibition of urokinase receptor in human squamous cell carcinoma on malignancy. EMBO (Eur. Mol. Biol. Organ) J. 1994;13:3983–3991. doi: 10.1002/j.1460-2075.1994.tb06714.x. [DOI] [PMC free article] [PubMed] [Google Scholar]
- Lin T.H., Aplin A.E., Shen Y., Chen Q., Schaller M., Romer L., Aukhil I., Juliano R.L. Integrin-mediated activation of MAP kinase is independent of FAKevidence for dual integrin signaling pathways in fibroblasts. J. Cell Biol. 1997;136:1385–1395. doi: 10.1083/jcb.136.6.1385. [DOI] [PMC free article] [PubMed] [Google Scholar]
- Mainiero F., Murgia C., Wary K.K., Curatola A.M., Pepe A., Blumemberg M., Westwick J.K., Der C.J., Giancotti F.G. The coupling of α6β4 integrin to Ras-MAP kinase pathways mediated by Shc controls keratinocyte proliferation. EMBO (Eur. Mol. Biol. Organ) J. 1997;16:2365–2375. doi: 10.1093/emboj/16.9.2365. [DOI] [PMC free article] [PubMed] [Google Scholar]
- Marches R., Scheuermann R.H., Uhr J.W. Cancer dormancyrole of cyclin-dependent kinase inhibitors in induction of cell cycle arrest mediated via membrane IgM. Cancer Res. 1998;58:691–697. [PubMed] [Google Scholar]
- May A.E., Kanse S.M., Lund L.R., Gisler R.H., Imhof B.A., Preissner K.T. Urokinase receptor (CD87) regulates leukocyte recruitment via β2 integrins in vivo. J. Exp. Med. 1998;188:1029–1037. doi: 10.1084/jem.188.6.1029. [DOI] [PMC free article] [PubMed] [Google Scholar]
- Mignatti P., Rifkin D.B. Biology and biochemistry of proteinases in tumor invasion. Physiol. Rev. 1993;73:161–195. doi: 10.1152/physrev.1993.73.1.161. [DOI] [PubMed] [Google Scholar]
- Miyamoto S., Teramoto H., Gutkind J.S., Yamada K.M. Integrins can collaborate with growth factors for phosphorylation of receptor tyrosine kinases and MAP kinase activationroles of integrin aggregation and occupancy of receptors. J. Cell Biol. 1996;135:1633–1642. doi: 10.1083/jcb.135.6.1633. [DOI] [PMC free article] [PubMed] [Google Scholar]
- Mortarini R., Gismondi A., Santoni A., Parmiani G., Anichini A. Role of the α5β1 integrin receptor in the proliferative response of quiescent human melanoma cells to fibronectin. Cancer Res. 1992;52:4499–4506. [PubMed] [Google Scholar]
- Murgia C., Blaikie P., Kim N., Dans M., Petrie H.T., Giancotti F.G. Cell cycle and adhesion defects in mice carrying a targeted deletion of the integrin β4 cytoplasmic domain. EMBO (Eur. Mol. Biol. Organ) J. 1998;17:3940–3951. doi: 10.1093/emboj/17.14.3940. [DOI] [PMC free article] [PubMed] [Google Scholar]
- Nguyen D.H., Hussaini I.M., Gonias S.L. Binding of urokinase-type plasminogen activator to its receptor in MCF-7 cells activates extracellular signal-regulated kinase 1 and 2 which is required for increased cellular motility. J. Biol. Chem. 1998;273:8502–8507. doi: 10.1074/jbc.273.14.8502. [DOI] [PubMed] [Google Scholar]
- Oka H., Chatani Y., Hoshino R., Ogawa O., Kakehi Y., Terachi T., Okada Y., Kawaichi M., Kohno M., Yoshida O. Constitutive activation of mitogen-activated protein (MAP) kinases in human renal cell carcinoma. Cancer Res. 1995;55:4182–4187. [PubMed] [Google Scholar]
- O'Reilly M.S., Holmgren L., Shing Y., Chen C., Rosenthal R.A., Moses M., Lane W.S., Cao Y., Sage E.H., Folkman J. Angiostatina novel angiogenesis inhibitor that mediates the suppression of metastases by a Lewis lung carcinoma. Cell. 1994;79:315–328. doi: 10.1016/0092-8674(94)90200-3. [DOI] [PubMed] [Google Scholar]
- Ossowski L. Invasion of connective tissue by human carcinoma cell linesrequirement for urokinase, urokinase receptor, and interstitial collagenase. Cancer Res. 1992;52:6754–6760. [PubMed] [Google Scholar]
- Ossowski L., Reich E. Changes in malignant phenotype of a human carcinoma conditioned by growth environment. Cell. 1983;33:323–333. doi: 10.1016/0092-8674(83)90414-2. [DOI] [PubMed] [Google Scholar]
- Ossowski L., Clunie G., Masucci M.T., Blasi F. In vivo paracrine interaction between urokinase and its receptoreffect on tumor cell invasion. J. Cell Biol. 1991;115:1107–1112. doi: 10.1083/jcb.115.4.1107. [DOI] [PMC free article] [PubMed] [Google Scholar]
- Ploug M., Ronne E., Behrendt N., Jensen A.L., Blasi F., Dano K. Cellular receptor for urokinase plasminogen activator. Carboxyl-terminal processing and membrane anchoring by glycosyl-phosphatidylinositol. J. Biol. Chem. 1991;266:1926–1933. [PubMed] [Google Scholar]
- Porter J.C., Hogg N. Integrins take partnerscross-talk between integrins and other membrane receptors. Trends Cell. Biol. 1998;8:390–396. doi: 10.1016/s0962-8924(98)01344-0. [DOI] [PubMed] [Google Scholar]
- Rabbani S.A., Mazar A.P., Bernier S.M., Haq M., Bolivar I., Henkin J., Goltzman D. Structural requirements for the growth factor activity of the amino-terminal domain of urokinase. J. Biol. Chem. 1992;267:14151–14156. [PubMed] [Google Scholar]
- Radeva G., Petrocelli T., Behrend E., Leung-Hagesteijn C., Filmus J., Slingerland J., Dedhar S. Overexpression of the integrin-linked kinase promotes anchorage-independent cell cycle progression. J. Biol. Chem. 1997;272:13937–13944. doi: 10.1074/jbc.272.21.13937. [DOI] [PubMed] [Google Scholar]
- Ronne E., Behrendt N., Ellis V., Ploug M., Dano K., Hoyer-Hansen G. Cell-induced potentiation of the plasminogen activation system is abolished by a monoclonal antibody that recognizes the NH2-terminal domain of the urokinase receptor. FEBS (Fed. Eur. Biochem. Soc.) Lett. 1991;288:233–236. doi: 10.1016/0014-5793(91)81042-7. [DOI] [PubMed] [Google Scholar]
- Schiller J.H., Bittner G. Loss of the tumorigenic phenotype with in vitro, but not in vito passaging of a novel series of human bronchial epithelial cell linespossible role of an alpha5/beta1-integrin-fibronectin interaction. Cancer Res. 1995;55:6215–6221. [PubMed] [Google Scholar]
- Sier C.F., Stephens R., Bizik J., Mariani A., Bassan M., Pedersen N., Frigerio L., Ferrari A., Dano K., Brunner N., Blasi F. The level of urokinase-type plasminogen activator receptor is increased in serum of ovarian cancer patients. Cancer Res. 1998;58:1843–1849. [PubMed] [Google Scholar]
- Tang H., Kerins D.M., Hao Q., Inagami T., Vaughan D.E. The urokinase-type plasminogen activator receptor mediates tyrosine phosphorylation of focal adhesion proteins and activation of mitogen-activated protein kinase in cultured endothelial cells. J. Biol. Chem. 1998;273:18268–18272. doi: 10.1074/jbc.273.29.18268. [DOI] [PubMed] [Google Scholar]
- Toolan H.W. Transplantable human neoplasms maintained in cortisone-treated laboratory animalsHS#1, H.Ep#1, H.Ep.#2, H.Ep.#3, and H.Emb.#1. Cancer Res. 1954;14:660–666. [PubMed] [Google Scholar]
- Varner J.A., Emerson D.A., Juliano R.L. Integrin α5β1 expression negatively regulates cell growthreversal by attachment to fibronectin. Mol. Biol. Cell. 1995;6:725–740. doi: 10.1091/mbc.6.6.725. [DOI] [PMC free article] [PubMed] [Google Scholar]
- Wang F., Weaver V.M., Petersen O.W., Larabell C.A., Dedhar S., Briand P., Lupu R., Bissell M.J. Reciprocal interactions between β1-integrin and epidermal growth factor receptor in three-dimensional basement membrane breast culturesa different perspective in epithelial biology. Proc. Natl. Acad. Sci. USA. 1998;95:14821–14826. doi: 10.1073/pnas.95.25.14821. [DOI] [PMC free article] [PubMed] [Google Scholar]
- Wary K.K., Mainiero F., Isakoff S.J., Marcantonio E.E., Giancotti F.G. The adapter protein Shc couples a class of integrins to the control of cell cycle progression. Cell. 1996;87:733–743. doi: 10.1016/s0092-8674(00)81392-6. [DOI] [PubMed] [Google Scholar]
- Wary K.K., Mariotti A., Zurzolo C., Giancotti F.G. A requirement for caveolin-1 and associated kinase Fyn in integrin signaling and anchorage-dependent cell growth. Cell. 1998;94:625–634. doi: 10.1016/s0092-8674(00)81604-9. [DOI] [PubMed] [Google Scholar]
- Wei Y., Lukashev M., Simon D.I., Bodary S.C., Rosenberg S., Doyle M.V., Chapman H.A. Regulation of integrin function by the urokinase receptor. Science. 1996;273:1551–1555. doi: 10.1126/science.273.5281.1551. [DOI] [PubMed] [Google Scholar]
- Wei Y., Yang X., Liu Q., Wilkins J.A., Chapman H.A. A role for caveolin and the urokinase receptor in integrin-mediated adhesion and signaling. J. Cell Biol. 1999;144:1285–1294. doi: 10.1083/jcb.144.6.1285. [DOI] [PMC free article] [PubMed] [Google Scholar]
- Werb Z., Tremble P.M., Behrendtsen O., Crowley E., Damsky C.H. Signal transduction through the fibronectin receptor induces collagenase and stromelysin gene expression. J. Cell Biol. 1989;109:877–889. doi: 10.1083/jcb.109.2.877. [DOI] [PMC free article] [PubMed] [Google Scholar]
- Wu C., Keightley S.Y., Leung-Hagesteijn C., Radeva G., Coppolino M., Goicoechea S., McDonald J.A., Dedhar S. Integrin-linked protein kinase regulates fibronectin matrix assembly, E-cadherin expression, and tumorigenicity. J. Biol. Chem. 1998;273:528–536. doi: 10.1074/jbc.273.1.528. [DOI] [PubMed] [Google Scholar]
- Xue W., Kindzelskii A.L., Todd R.F., III, Petty H.R. Physical association of complement receptor type 3 and urokinase-type plasminogen activator receptor in neutrophil membranes. J. Immunol. 1994;152:4630–4640. [PubMed] [Google Scholar]
- Xue W., Mizukami I., Todd R.F., III, Petty H.R. Urokinase-type plasminogen activator receptors associate with β1 and β3 integrins of fibrosarcoma cellsdependence on extracellular matrix components. Cancer Res. 1997;57:1682–1689. [PubMed] [Google Scholar]
- Yamada K.M., Geiger B. Molecular interactions in cell adhesion complexes. Curr. Opin. Cell Biol. 1997;9:76–85. doi: 10.1016/s0955-0674(97)80155-x. [DOI] [PubMed] [Google Scholar]
- Yu W., Kim J., Ossowski L. Reduction in surface urokinase receptor forces malignant cells into a protracted state of dormancy. J. Cell Biol. 1997;137:767–777. doi: 10.1083/jcb.137.3.767. [DOI] [PMC free article] [PubMed] [Google Scholar]
- Zhao J.H., Reiske H., Guan J.L. Regulation of the cell cycle by focal adhesion kinase. J. Cell Biol. 1998;143:1997–2008. doi: 10.1083/jcb.143.7.1997. [DOI] [PMC free article] [PubMed] [Google Scholar]