Moment-to-Moment Tracking of State Value in the Amygdala (original) (raw)
Abstract
As an organism interacts with the world, how good or bad things are at the moment, the value of the current state of the organism, is an important parameter that is likely to be encoded in the brain. As the environment changes and new stimuli appear, estimates of state value must be updated to support appropriate responses and learning. Indeed, many models of reinforcement learning posit representations of state value. We examined how the brain mediates this process by recording amygdala neural activity while monkeys performed a trace-conditioning task requiring fixation. The presentation of different stimuli induced state transitions; these stimuli included unconditioned stimuli (USs) (liquid rewards and aversive air puffs), newly learned reinforcement-predictive visual stimuli [conditioned stimuli (CSs)], and familiar stimuli long associated with reinforcement [fixation point (FP)]. The FP had a positive value to monkeys, because they chose to foveate it to initiate trials. Different populations of amygdala neurons tracked the positive or negative value of the current state, regardless of whether state transitions were caused by the FP, CSs, or USs. Positive value-coding neurons increased their firing during the fixation interval and fired more strongly after rewarded CSs and rewards than after punished CSs and air puffs. Negative value-coding neurons did the opposite, decreasing their firing during the fixation interval and firing more strongly after punished CSs and air puffs than after rewarded CSs and rewards. This representation of state value could underlie how the amygdala helps coordinate cognitive, emotional, and behavioral responses depending on the value of one's state.
Keywords: amygdala, monkey, state value, reinforcement learning, reward, punishment
Introduction
A common question in our daily lives is, “How are you?” This question assumes that we can evaluate our current situation, or “state.” Am I happy or sad? Thirsty or satiated? Is a reward coming, or is danger lurking? The concept of current state incorporates these features and more, and reinforcement learning theorists often define the concept of state broadly, as a combination of internal and external processes, stimuli, and events (Sutton and Barto, 1998; Dayan and Abbott, 2001).
When animals encounter stimuli in the environment, they often undergo changes in state. Some stimuli directly cause unpleasant or rewarding sensations; other stimuli predict future pleasant or aversive stimuli. Cognitive, behavioral, and physiological responses depend on how a state relates to current and future reinforcement, i.e., the state value. To promote survival, organisms should track state value to choose the best course of action and improve future assessments of state value to accurately predict reinforcement.
The value of states can be controlled through classical conditioning paradigms, in which subjects learn that rewarding or punishing unconditioned stimuli (USs) follow initially neutral conditioned stimuli (CSs) (Pavlov, 1927; Dickinson and Mackintosh, 1978). The amygdala receives inputs from multiple sensory systems carrying information about CSs and USs (Amaral et al., 1992; McDonald, 1998; Stefanacci and Amaral, 2002) and mediates learning about the relationship between environmental cues and reinforcement (LeDoux, 2000; Everitt et al., 2003; Balleine and Killcross, 2006; Paton et al., 2006; Belova et al., 2007). In primate amygdala, different populations of neurons are involved in learning the association between conditioned visual stimuli and rewards or punishments (Paton et al., 2006). We have shown previously that one population of neurons fires more to stimuli paired with liquid reward (positive “value-coding” cells), and another population of neurons fires more to images paired with air puff (negative “value-coding” cells) (Paton et al., 2006).
Here we determined whether amygdala neurons encode value in relation to sensory events that can induce transitions to different states. Monkeys performed a trace-conditioning task in which three novel CSs were paired with one of three USs: large liquid reward, small liquid reward, or aversive air puff. Three types of stimuli were presented: a fixation point (FP) that monkeys looked at to initiate trials; the three visual CSs; and three USs, which differed in sensory modality and valence. If a stimulus elicited approach or defensive behavior, we operationally defined it as causing a transition to a state with positive or negative value, respectively. We asked whether amygdala neurons reflect the value of states induced by such sensory events. For this to be true, amygdala neurons must (1) encode value in relation to each sensory event (FP, CS, and US), and (2) integrate information about value across sensory modalities. Evidence that neurons integrate value information across sensory modalities could be obtained by examining the response profile of neurons responding most strongly to a CS when it is associated with aversive air puff. If these neurons also respond differentially to CSs associated with different magnitudes of rewards, it would suggest that these neurons encode the association between a CS and the value of USs, in which USs can differ in valence and sensory modality. Overall, the ability to track value in time across sensory stimuli, even when these stimuli differ in valence and modality, could indicate that amygdala neural activity reflects the value of an organism's overall state.
Materials and Methods
Experimental paradigm and data collection
Our general methods for experimental control and electrophysiological recording in rhesus monkeys have been described previously (Paton et al., 2006). Monkeys sat in a Plexiglas primate chair (Crist Instruments) with their eyes 57 cm in front of a 21 inch Sony cathode ray tube monitor. Experimenters observed monkeys during experiments using a video camera feed. All animal procedures conformed to National Institutes of Health guidelines and were approved by the Institutional Animal Care and Use Committees at New York State Psychiatric Institute and Columbia University.
Trace-conditioning task.
Monkeys learned the reinforcement value of three novel abstract images (fractal patterns) in each experiment through a trace-conditioning procedure in which each CS was associated with a large reward, a small reward, or a punishment. In each trial, monkeys foveated a central fixation point, held fixation for 1 s (fixation window, 3.5° radius), and continued fixating while an image was presented for 300 ms. We measured eye position with an infrared eye tracker (240 Hz sampling rate ; Applied Science Laboratories). Images typically occupied an 8° square centered over the fovea. After image offset, fixation was no longer required, and a 1.5 s trace interval ensued, followed by reinforcement on 80% of trials, selected randomly. On reinforced trials, we delivered a large reward (two or three drops of water, 0.4–2.1 ml, depending on the monkey), a small reward (one drop of water, 0.2–0.7 ml), or an aversive air puff (50–100 ms, 40–60 psi) directed at the face, for strong positive, weak positive, or negative trials, respectively. All three trial types were presented in blockwise randomized order (two trials of each type per block, with trial types randomized within blocks) and separated by a 3.5 s intertrial interval. After monkeys learned the initial value of each image, we reversed image value assignments without warning, usually after 30–60 trials of each condition. During reversal, the initially strong positive image was followed by air puff, and the initially negative image was followed by a large reward. The weak positive image was never reversed.
Behavioral measures of learning.
We assessed monkeys' anticipatory licking and blinking to determine whether they had learned CS–US associations (Paton et al., 2006). For licking, we placed the reward delivery tube <1 cm away from the monkey's mouth and measured whether the monkey's tongue interrupted an infrared beam passing between the monkey's mouth and the reward delivery tube (1000 Hz sampling rate). We measured anticipatory blinking using an infrared eye tracker, which provided a characteristic voltage signal when the eye was closed. The presence of this signal corresponded to eye closures as visualized from a low-light camera.
Electrophysiological recordings.
We recorded neural activity from 145 neurons in the right amygdala of three rhesus monkeys (Macaca mulatta) weighing 5–10 kg (monkey V, 70 neurons; monkey P, 38 neurons; monkey L, 37 neurons). Based on magnetic resonance imaging (MRI), we positioned recording chambers directly over the amygdala. In each experiment, using a motorized multielectrode drive (NAN Instruments), we individually advanced four epoxylite-insulated tungsten microelectrodes (FHC Inc.) into the brain through dura-puncturing guide tubes positioned within a rigid grid of guide holes. Grids had holes spaced at 1.3 mm. Each guide tube had four inner guide tubes such that four electrodes could be advanced and independently controlled through the larger guide tube. We used the Plexon system for signal amplification, filtering, digitizing of spike waveforms, spike sorting using a principal component analysis platform (on-line with off-line verification), and data storage. Monkeys either performed a fixation task or no task during the search for well isolated neurons. We included all well isolated neurons in this study.
Reconstruction of recording sites.
The localization of the amygdala in each monkey was achieved using MRI. Each monkey was anesthetized with isoflurane, intubated, and imaged in a 1.5 Tesla research magnet in the Columbia University Department of Radiology. We imaged with an electrode inserted in a grid hole in the chamber and directed toward the amygdala. For reconstructing recording sites, we used a two-dimensional inversion recovery (IR) sequence, with 2-mm-thick slices and 0 intergap spacing and 0.234 × 0.468 mm within-slice resolution. These images were used to reconstruct the borders of the amygdala and recording sites. All recordings occurred primarily in the basolateral and central nuclei of the amygdala, in overlapping regions in all three monkeys.
Data analysis
Population analysis of monkeys' behavior (licking and blinking).
To construct population-average licking and blinking curves, we first assigned a 1 or 0 to each sampled time bin within each trial based on whether the monkey licked (blinked) or did not lick (did not blink) in that bin. We averaged the monkey's responses across trials within each experiment and then averaged across experiments. Each monkey demonstrated graded licking behavior and differential blinking behavior.
Population-level peristimulus time histograms of neural activity.
Peristimulus time histograms (PSTHs) were sampled in 10 ms nonoverlapping bins and convolved with a 50 ms at half-width Gaussian kernel for display purposes. Because on average monkeys learn CS–US associations within five or fewer trials, we removed the first four trials from initial and reversal learning sessions in each experiment for the PSTHs shown in Figures 2 and 4.
Figure 2.

Amygdala neurons encode the value of states initiated by FP presentation. A, B, PSTHs showing two example amygdala neurons, one encoding positive CS value and increasing firing rate during fixation point presentation (A), and the other encoding negative CS value and exhibiting a decrease in firing to the fixation point (B). C, Population average of responses to fixation point for neurons encoding positive or negative CS value and for neurons not encoding CS value. Shaded areas indicate SEM. D, Bar chart showing the percentage of cells with increases (blue), decreases (red), and no change (black) in response level during fixation point presentation, for positive, negative, and non-value-coding neurons. The number of cells of each type is indicated. The majority of positive value-coding cells increases firing to the FP, and the majority of negative value-coding cells decreases firing to the FP. Non-value-coding cells have no discernable pattern in firing to the FP, with increases, decreases, and no change in responses to the FP occurring with approximately equal frequency.
Figure 4.

Amygdala neurons encode the value of states initiated by CS presentation. A–D, PSTHs for four example amygdala neurons that respond in a graded manner during the visual stimulus (A, B) or trace (C, D) intervals. Example cells 3 and 5 (A, C) encode positive value, and cells 4 and 6 (B, D) encode negative value. In each case, responses to the CS are correlated with the value of the associated US, consistent with the encoding state value of the neurons. E, Scatter plot of positive and negative NDIs, computed using ROC analyses that compared activity on small reward trials with large reward trials (positive NDI) or punished trials (negative NDI). Each data point represents a single experiment. Blue data points, positive value-coding cells; red data points, negative value-coding cells.
Receiver operating characteristic analyses.
We used a receiver operating characteristic (ROC) analysis adapted from signal-detection theory (Green and Swets, 1966; Paton et al., 2006) for the following analyses.
Classification of cells as value coding.
To classify a cell as encoding the value of conditioned images, we first defined two intervals: the visual stimulus (CS) and trace intervals (90–390 ms after CS onset and from 390 ms after CS onset until US onset, respectively) (Paton et al., 2006). If neural responses to images that underwent reversal during either (or both) the visual stimulus or trace intervals changed significantly and in opposite directions, the cell was classified as encoding value. Statistical significance was established by using an ROC analysis comparing activity in the 20 trials before and after reversal for both images; ROC values significantly different from 0.5 for both images (p < 0.05, permutation test with 1000 permutations, after Bonferroni's correction) were used as our statistical criterion. Neurons were classified as encoding positive or negative value when both ROC values were greater or less than 0.5, indicating that cells responded more strongly to images associated with rewards (positive value) or air puffs (negative value), respectively. For subsequent analyses (described below), we used the interval (visual stimulus or trace) in which value coding was strongest (ROC values most different from 0.5).
Analysis of graded CS and US neural responses.
To assess whether a cell that passed the test described above (see Classification of cells as value coding) encoded value during the CS or trace interval in a graded manner, we used an ROC analysis to construct two neural discrimination indices (NDIs) for CSs; the two NDIs compare activity on weak positive trials with strong positive trials (positive NDI) and to negative trials (negative NDI) respectively. Analogous NDIs for US responses were constructed by comparing activity during the reinforcement epoch 50–600 ms after US offset on the same types of trials as for the CS NDIs.
Analysis of graded behavior.
Analogous to our analysis of neural data, we constructed behavioral discrimination indices (BDIs) using an ROC analysis of licking or blinking on weak positive trials compared with strong positive trials (positive BDI) or to negative trials (negative BDI). These comparisons used licking and blinking responses quantified as the amount of time spent licking or blinking during the last 500 ms of the trace interval. The positive BDI based on blinking is not shown because it was typically not different from 0.5, as blinking rarely occurred on rewarded trials.
Classification of responses during the fixation interval.
To classify neural responses during the fixation interval as increasing or decreasing, for every neuron we compared activity in the 500 ms before FP onset with activity in the 500 ms after FP onset and with activity 500–1000 ms after FP onset, using a Wilcoxon's test (p < 0.05 after correction for multiple comparisons). If a neuron passed either test or both tests with a similar direction of response, we classified it as either excitatory or inhibitory. We used these two tests because some neurons had gradual buildup responses, other neurons had sharp-onset phasic responses, and yet other neurons had sharp-onset sustained responses.
Results
During these experiments, monkeys performed a trace-conditioning task (Fig. 1 A) (see Materials and Methods). To assay learning during conditioning, we measured two behaviors during the trace interval of the conditioning procedure: anticipatory licking and blinking. Licking behavior indicated that monkeys discriminated among conditioned visual stimuli in a graded manner (Fig. 1 B): they licked most on large reward trials, less on small reward trials, and almost not at all on negative trials. Blinking behavior indicated that monkeys learned to predict air puff (Fig. 1 C).
Figure 1.

Experimental paradigm and monkey behavior. A, Trace-conditioning task. Sequence of events for the strong positive, weak positive, and negative trial types. After monkeys learn the initial CS–US relationships, positive and negative trial types are reversed, such that the strong positive image becomes negative and the negative image becomes strongly positive. Weak positive images do not undergo reversal. Reinforcement occurs with a 80% probability on all trial types. B, C, Mean probability of a response across experiments, for anticipatory licking (B) and blinking (C), before reinforcement delivery as a function of time within trials.
To test whether amygdala activity provides a neural correlate of state value, tracking value consistently across the sequential presentation of multiple stimuli, we recorded activity from 145 neurons in three monkeys during performance of the trace-conditioning task. We focus first on neural activity during the fixation interval, before CS onset. The FP was an overtrained, positively valued stimulus, because monkeys had learned that centering gaze on the FP can lead to reward from the beginning of their training. Indeed, the fact that monkeys looked at the FP to begin a trial (an approach behavior) indicated that the FP had a positive value to our monkeys. Within these experiments, the FP was associated with reward on two-thirds of all reinforced trials (large and small reward trials). In contrast to FP value, CS value varied within an experiment, which was attributable to the different CSs used and to the reversal of contingencies within the task (see Materials and Methods).
We examined responses during the fixation interval separately in two populations of neurons: those that responded most strongly to either CSs associated with large rewards or CSs associated with aversive air puffs (defined as positive and negative value-coding neurons, respectively). Neurons were classified as encoding positive or negative value by comparing the responses to CSs paired with large rewards with responses to the same CSs when they were paired with air puffs. We used a ROC analysis to evaluate activity from the 20 trials before and after CS–US contingency reversal and assessed statistical significance with a permutation test (Paton et al., 2006). If both CSs elicited significantly higher activity when they were associated with either reward or punishment (in either the CS or trace interval, p < 0.05 after Bonferroni's correction), we designated the cell as encoding positive or negative value, respectively. Seventy of 145 neurons (48%) met these criteria: 47 cells fired more strongly on large reward trials (positive value-coding cells), and 23 cells fired more strongly on air-puff trials (negative value-coding cells). The proportion of positive and negative value-coding cells did not vary significantly across monkeys (χ2 test, _p_ > 0.05) (Table 1).
Table 1.
Cells per category, as a function of monkey
| Monkey V | Monkey P | Monkey L | |
|---|---|---|---|
| Positive value-coding cells | 25 (36%) | 9 (24%) | 13 (35%) |
| Negative value-coding cells | 10 (14%) | 6 (16%) | 7 (19%) |
| Cells not encoding value | 35 (50%) | 23 (60%) | 17 (46%) |
| Value-coding cells discriminating among all 3 trial types | 22 (31%) | 7 (18%) | 14 (38%) |
| Value-coding cells discriminating among large and small reward trials only | 6 (9%) | 3 (8%) | 0 (0%) |
| Value-coding cells discriminating among small reward and air-puff trials only | 7 (10%) | 5 (13%) | 6 (16%) |
| Total number of cells | 70 | 38 | 37 |
Neural responses during the fixation interval differed in positive and negative value-coding neurons. Given that monkeys positively value the FP, if neurons encode state value, then positive value-coding cells should tend to increase their firing during the fixation interval, and negative value-coding cells should tend to decrease their firing. Individual amygdala neurons that exemplify these response profiles are shown in Figure 2, A (a positive value-coding cell) and B (a negative value-coding cell). Overall, 30 of 47 positive value-coding neurons significantly increased their firing rate during the fixation interval, eight cells decreased their firing rate, and nine cells did not change their level of activity (Fig. 2 D) (Wilcoxon's test, p < 0.05). Among the 23 negative value-coding cells, 14 significantly decreased their firing rate after FP presentation, three increased their firing rate, and the remaining six had no change in activity (Fig. 2 D) (Wilcoxon's test, p < 0.05). Thus, at a rate significantly greater than chance, positive value-coding neurons increase firing during the fixation interval and negative value-coding cells decrease firing (χ2 test, p < 10−5). This χ2 test was also highly significant if we only considered neurons with sharp increases or decreases in responses to the FP (positive value-coding neurons: 23 of 30 neurons with increased firing rate during the fixation interval had a sharp onset increase in firing, and 7 of 8 neurons with decreased firing had a sharp onset decrease; negative value-coding neurons, 9 of 14 neurons with a decrease in firing during the fixation interval had a sharp onset decrease and 3 of 3 neurons with increased firing had a sharp onset increase; χ2 test, p < 10−5). In contrast, in non-value-coding neurons, increases, decreases, and no change in activity after FP appearance occurred with statistically indistinguishable probabilities (χ2 test, p = 0.67) (Fig. 2 D). On average, across each population, positive value-coding neurons increased firing during the fixation interval, negative value-coding cells decreased their firing, and non-value-coding cells showed a very weak, transient increase in response (Fig. 2 C). These data suggest that amygdala neurons may track the value of states across multiple events during the trial, including FP and CS presentation.
The fact that positive, negative, and non-value-coding neurons respond differently to the fixation point was not attributable to a difference in firing on rewarded compared with punished trials, because responses did not differ across trial types. Indeed, the mean response during the fixation interval on rewarded compared with punished trials was highly correlated across cells (slope of linear fit, 1.0; r = 0.99; p < 10−10). This is consistent with the fact that monkeys did not know which CS to expect during the fixation interval before CS onset. In addition, fixation interval activity on trials before and after CS–US reversal were highly correlated (slope of linear fit, 0.94; r = 0.99; p < 10−10), ruling out the possibility that the differential responses during the fixation interval could be accounted for by different responses during initial and reversal learning.
Neural responses during the fixation interval also do not appear to be related to the uncertainty of reinforcement; unpredictability has been shown to modulate amygdala responses to stimuli (Belova et al., 2007; Herry et al., 2007; Whalen, 2007). Essentially, the fixation point appearance indicated the onset of a trial in which, on average, trials had a 0.53 probability of reward (half of which were large reward trials and half small reward trials), a 0.27 probability of punishment, and a 0.20 probability of no reinforcement. Uncertainty decreased after CS appearance, when a large reward, small reward, or punishment was specified, each occurring with a probability of 0.8. If neurons encode uncertainty in a monotonically increasing manner, responses should decrease during the CS interval compared with during the fixation interval. However, on average, positive value-coding neurons increase their firing compared with the fixation interval after a rewarded CS appears (mean increase, 5.12 spikes/s; p < 0.001, t test) and decrease their firing after a punished CS appears (mean decrease, 4.53 spikes/s; p < 0.01, t test) (Fig. 3 A). In contrast, negative value-coding neurons do the opposite, decreasing their firing after rewarded CSs compared with fixation interval responses (mean decrease, 2.95 spikes/s; p < 0.05, t test) and increasing their firing after punished CSs appear (mean increase, 3.61 spikes/s; p < 0.05, t test) (Fig. 3 B). Overall, therefore, neural activity does not appear to be correlated with reinforcement uncertainty.
Figure 3.

Neural responses during the fixation interval are not related to reinforcement uncertainty. A, B, Cumulative distributions showing the proportion of positive (A) and negative (B) value-coding neurons as a function of the difference in firing rate between the fixation interval and the CS or trace interval for rewarded (blue) and punished (red) trials (FP interval activity − CS/trace interval activity). For this comparison, for each cell, we used either the firing rate from 90–390 ms after CS onset (CS interval) or from 390–1800 ms after CS onset (trace interval), depending on which interval the cell encoded value for more strongly (see Materials and Methods). Distribution means were tested for significant difference from 0 using a one-tailed t test.
Within the context of the trace-conditioning task, the value of the state initiated by CS presentation may simply be determined by the value of the US associated with that CS, i.e., the predictive value of the CS. Can neural responses to CSs therefore be described as encoding the value of the associated USs? If this is the case, then responses to CSs associated with small rewards should consistently be intermediate to responses to those associated with large rewards or punishments. Figure 4 A–D displays PSTHs of single neurons that demonstrate this response property. In these and the following PSTHs, we combined only postlearning trials to remove the effect of trials when monkeys had not yet learned the CS–US associations. The neurons shown in Figure 4, A and C, fire at a high rate on large reward trials, a low rate on punished trials, and an intermediate rate on small reward trials. In contrast, the neurons displayed in Figure 4, B and D, show a graded response pattern in reverse order: they fire most strongly on punished trials, least strongly on large reward trials, and again intermediately on small reward trials.
We next sought to quantify the degree to which neural responses to weak positive CSs were consistently intermediate to the other two CSs. By definition, all 70 value-coding cells fired differentially on large reward and air-puff trials. To characterize the responses to small reward trials compared with the other two trial types, we used ROC analyses to compute two NDIs. One index quantified the difference in responses to CSs on large and small reward trials (positive NDI for CSs). The other index quantified the difference between responses to CSs on small reward and air-puff trials (negative NDI for CSs). Figure 4 E plots these two indices against each other. The vast majority of positive value-coding cells fall into the top right quadrant of the plot, whereas the majority of negative value-coding cells fall into the bottom left quadrant. The preferential distribution of neurons into these two quadrants, as opposed to being randomly distributed in all quadrants, was statistically significant (p < 0.005, χ2 test). Thus, neural responses on small reward trials tend to fall between responses on large reward trials and negative trials in both positive and negative value-coding neurons. Encoding of value in individual amygdala neurons, therefore, can be described as a graded representation that spans positive and negative valences.
Of particular importance, negative value-coding neurons, which responded most strongly when a CS predicted an air puff, often responded differentially to CSs associated with different amounts of liquid reward. These amygdala neurons therefore did not simply represent the association of the CS with the sensory properties of a preferred US (in this case, the air puff). Instead, the responses to the three CSs reflected an integration of information about multiple reinforcers with different sensory properties. This response profile, therefore, may be best described as representing the association between the CS and the value of the corresponding US, in which USs can differ in sensory modality, valence, and magnitude.
To gain insight into the anatomical location of these amygdala neurons, we reconstructed recording sites using MRI (Fig. 5). We used a permutation test to identify neurons with positive and/or negative NDIs that are significantly different from 0.5 (p < 0.05). In these neurons, responses to CSs associated with small rewards differ from the responses to CSs associated with either large rewards or punishments. We found that neurons with positive and negative NDIs that are different from 0.5 could be found in a range of locations within the amygdala, including some locations that were deep and some locations that were in the anterior portion of the amygdala. According to published atlases of rhesus monkey anatomy, the central nucleus is located approximately in the dorsal 30% and the posterior 60% of the amygdala, whereas the basal, accessory basal, and lateral nuclei comprise a large portion of the remaining amygdala, including areas ventral to the central nucleus (Paxinos et al., 2000). Although the MRI does not permit delineation of amygdala nuclei, the reconstruction shows that neurons with positive and negative NDIS significantly different from 0.5 are unlikely to be restricted to the central nucleus, which is located in the dorsal and posterior aspect of the amygdala. At least some of these neurons are likely to lie within the basolateral complex.
Figure 5.

A–C, Value encoding is widespread within the amygdala. MRI reconstruction (A–C, posterior to anterior) of recording locations with sites labeled according to whether positive and negative NDIs are significantly different from 0.5. Images were acquired with a two-dimensional inversion recovery sequence, with 2-mm-thick slices. Consequently, recording sites spanning 2 mm in the anteroposterior dimension were collapsed onto single images; therefore, in many cases, recording sites appear as if they overlapped in the figure. Black filled circles, Non-value-encoding; open colored circles, value-encoding, one NDI significantly different from 0.5; filled colored circles, both NDIs significantly different from 0.5; red symbols, negative value-encoding; green symbols, positive value-encoding. Value-coding neurons were recorded from areas that likely encompass both the central and the basolateral collection of nuclei. D, Dorsal; L, lateral; M, medial; V, ventral.
Within the context of a classical conditioning procedure, the value of a state induced by presenting a CS is dictated by the value of the associated US. Therefore, the data presented so far are consistent with the notion that amygdala neural responses to the FP and visual CSs encode state values. We next examined whether this conceptual framework can also describe responses to the USs. Here we show that amygdala activity during the US interval does in fact track three different values of primary reinforcement that can differ in sensory modality. Examination of Figure 6, A and B, reveals that the responses to CSs associated with different USs is correlated with response levels after US delivery. These plots show the relationship among four indices computed for each value-coding cell: positive and negative CS NDIs and corresponding US NDIs. The CS NDIs were identical to those in Figure 4 E, and the US NDIs were computed in the same manner, except calculated using activity during a reinforcement period 50–600 ms after US delivery. The positive NDIs are significantly correlated (r = 0.37; p < 0.005), as are the negative NDIs (r = 0.62; p < 0.005). These data indicate that amygdala neurons respond in a sustained and graded manner across both the CS and US intervals, although USs differ in sensory modality.
Figure 6.

Amygdala neurons appear to track state values across the CS and US intervals. A, B, Positive (A) and negative (B) US NDI plotted as a function of positive (A) and negative (B) CS NDI. Red lines, Linear regressions fit to the data.
Thus far, we have described neural responses that are correlated with state values induced by FPs, CSs, and USs. To what extent is this neural representation correlated with behavior? We examined the relationship between neural activity in the amygdala and behavior by asking whether the variability in value-related encoding by amygdala neurons was correlated with the variability in monkeys' behavior from day to day. Overall, monkeys' behavior indicates that they value trials in a graded manner (Fig. 1 B,C); however, in some sessions, the licking rate on small reward trials was closer to that on large reward trials, whereas in other sessions licking on small reward trials was more similar to licking on punished trials. Figure 7 A–F shows plots of CS response NDIs (positive and negative, as defined above) scattered against BDIs for both licking (A–D) and blinking (E, F). BDIs were constructed the same way as NDIs, except that they compare the amounts of time spent licking and blinking during the last 500 ms of the trace epoch. A positive licking BDI >0.5, for example, indicates that more time was spent licking before a large reward than a small reward; a negative licking BDI >0.5 indicates that there was more licking before a small reward than before an air puff. For positive value-coding cells, positive CS response NDIs were correlated with positive licking BDIs (Fig. 7 A, r = 0.55, p < 0.0001). This relationship did not hold for negative value-coding neurons (Fig. 7 _B_, _r_ = 0.08, _p_ > 0.05). Conversely, in negative value-coding cells, negative CS response NDIs were correlated with negative licking BDIs (Fig. 7 D, r = 0.78, p < 0.0001), and this relationship did not apply for positive value-coding neurons (Fig. 7 _C_, _r_ = 0.14, _p_ > 0.05). Negative blinking BDIs were correlated with negative CS response NDIs in both positive and negative value-coding neurons (Fig. 7 E, r = 0.37, p < 0.01; Fig. 7 F, r = 0.52, p < 0.05). Taken as a whole, the correlation between positive NDIs and positive BDIs was strongest in positive value-coding cells, and the correlation between negative NDIs and negative BDIs was strongest in negative value-coding cells. These observations raise the intriguing possibility that positive value-coding cells may preferentially contribute to discriminative ability toward the more positive end of the stimulus-value spectrum, whereas negative value-coding neurons may preferentially contribute to discriminative ability toward the more negative end of the stimulus-value spectrum.
Figure 7.
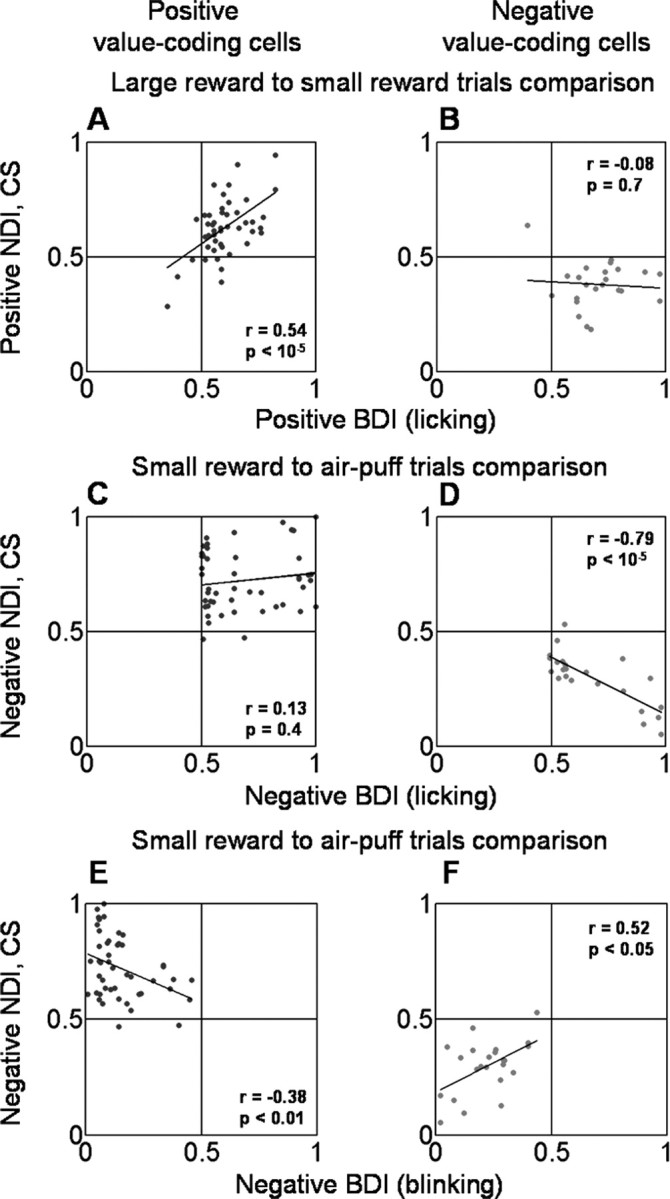
Monkeys' differential behavior is correlated with neuronal responses. A–D, Positive (A, B) and negative (C, D) BDIs based on licking responses plotted against positive (A, B) and negative (C, D) CS discrimination indices for neurons (NDIs). Separate plots shown for positive (A, C) and negative (B, D) value-coding neurons. E, F, Negative BDIs based on blinking data plotted against negative CS NDIs, with separate plots shown for positive (E) and negative (F) value-coding cells. Positive BDIs for blinking are not shown because blinking on rewarded trials was rare. Black lines, Linear regressions fit to the data.
Discussion
We have described neural activity suggesting that primate amygdala continuously represents the value of a monkey's current state. We used a classical (trace) conditioning procedure in which state transitions were induced by the presentation of an FP, CSs, and USs. The FP and CSs differed in that the FP was a familiar visual stimulus long associated with reward, whereas the CSs were novel abstract images having associations with rewards and punishments that were learned within experimental sessions. USs were primary rewards and punishments that activate a combination of somatosensory, gustatory, and auditory pathways. We found that the activity of amygdala neurons is correlated with the value of states established by each of these disparate stimuli. Neurons encoding positive value tend to increase their firing during the fixation interval and to fire more strongly in response to positive CSs and USs. Neurons encoding negative value tend to have the opposite response profile, decreasing their firing during the fixation interval and firing most strongly to negative CSs and USs. Because neurons often fire in a congruent manner during states initiated by FPs, CSs, and USs, we can describe these cells as encoding the value of states. State values play a prominent role in theories of reinforcement learning, because they are critical elements of learning algorithms and of posited decision-making and action control mechanisms (Sutton and Barto, 1998; Dayan and Abbott, 2001; Dayan and Balleine, 2002).
The representation of state value, evident across the population of neurons that we have studied in the amygdala, may arise from the convergence in the amygdala of sensory signals from multiple modalities and inputs from neuromodulatory systems and parts of the cerebral cortex involved in more complex, higher-order functions (Amaral et al., 1992; McDonald, 1998; Ghashghaei and Barbas, 2002; Stefanacci and Amaral, 2002; Höistad and Barbas, 2008). Consistent with this, we have shown previously that amygdala neurons, in addition to having signals correlated with value, can represent the sensory properties of visual stimuli and of reinforcing stimuli (Paton et al., 2006, their Fig. 3 a, Table 1). In principle, this representation of sensory stimuli may be transformed into a representation of value through computational steps implemented within the amygdala, and this may explain why some neurons, but not others, show value-related responses to CSs but not FPs or vice versa. In addition, of course, value-related signals could also reflect input to the amygdala that already carries value-related information.
Other investigators have proposed that the amygdala may support two functions in parallel: encoding CSs with respect to the sensory properties of the USs they predict (which, in rodents, is thought to involve the basolateral amygdala) and encoding the overall motivational value of events or stimuli (which is thought to involve the central nucleus) (Balleine and Killcross, 2006). Indeed, some theoretical frameworks developed to explain conditioning emphasize that, during learning, the brain can form several different associations; these include associations between the CS and the sensory properties of the US, the CS and the unconditioned response to the US (stimulus–response learning), or the CS and a more abstract quantity, such as the value of the US (Dickinson, 1980; Mackintosh, 1983; Everitt et al., 2003) (but see Gallistel and Gibbon, 2000). In the current study, the same substance, water, was used as a US in both large reward and small reward trials. Single amygdala neurons often discriminate between the value of CSs on these trials. Moreover, for negative value-coding neurons, the presumed preferred US is an air puff, but many neurons still respond differentially to CSs associated with different magnitudes of liquid rewards. Therefore, many amygdala neurons do not appear to simply report the sensory properties of an associated preferred US. In addition, we have shown previously that amygdala neurons do not fire in relation to the behavioral responses on this task, licking and blinking (Paton et al., 2006), so neural activity does not appear to represent the association between the CS and the measured behavioral responses. Consequently, we conclude that some amygdala neurons appear to encode the value of USs associated with CSs. In primates, at least, these neurons are located throughout the amygdala, including the basal and accessory basal nuclei. Many neurons in the basal and accessory basal nuclei project to sensory and prefrontal cortices (Amaral et al., 1992, 2003; Ghashghaei and Barbas, 2002; Ghashghaei et al., 2007; Höistad and Barbas, 2008). Thus, the extent to which parallel processing of different aspects of CS–US associations occurs in discrete amygdala nuclei in primates, rather than intermixed within nuclei, remains an important target for future investigation.
Most previous studies investigating the representation of value in the brain have used operant tasks, have typically investigated the value of only one type of stimulus or action and have investigated only one valence of reinforcement, i.e., reward (Kawagoe et al., 1998; Platt and Glimcher, 1998; Leon and Shadlen, 1999; Tremblay and Schultz, 1999; Cromwell and Schultz, 2003; McCoy et al., 2003; Dorris and Glimcher, 2004; Roesch and Olson, 2004; Sugrue et al., 2004; Samejima et al., 2005; Tobler et al., 2005; Padoa-Schioppa and Assad, 2006). Therefore, it remains unclear whether the brain areas studied, which include the parietal, cingulate, dorsolateral prefrontal, and orbitofrontal cortices, as well as the basal ganglia and dopamine neurons in the midbrain, encode the ongoing value of states. In many of these studies, specific behavioral responses were required to obtain reinforcements that differed in reward value. Notably, even during such operant tasks, pavlovian associations may be formed as subjects learn to make specific adaptive responses based on sensory stimuli. For example, in operant tasks, monkeys often make saccadic eye movements to a visual target to indicate their choice. Because the selection of different target stimuli may result in different types or amounts of reinforcement, the target stimuli themselves may be conditioned. Thus, the value of specific actions could be built in part from computations of the value of states arising after presentation of action targets. The current data indicate that this computation is likely to be reflected in amygdala activity representing state value.
One outstanding question concerns whether the amygdala represents state value across a wider range of conditions. As noted in Introduction, the value of one's state can be influenced by both internal and external factors. In the current paper, we investigated neural activity in relation to manipulations of external variables (the presentation of FPs, CSs, and USs), whereas internal variables presumably remained relatively constant during the brief recording sessions. Given the role of the amygdala in processes resulting from changes in internal state, such as satiation induced by reward devaluation procedures (Baxter and Murray, 2002), it will be important to determine whether and how amygdala neurons track state value when it is manipulated by factors such as more distant reward history.
A neural representation of state value in the amygdala could subserve multiple functions. First, decisions and subsequent actions, as well as a variety of physiological, cognitive, and behavioral responses that constitute what we call emotions, may in part be based on a representation of state value. Second, state values play a prominent role in learning algorithms, which posit that a computation of the difference in value of two successive states generates prediction error signals that drive learning (Schultz et al., 1997; Sutton and Barto, 1998; Dayan and Abbott, 2001). In principle, a representation of state value in the amygdala could play a role in all of these processes, albeit through different anatomical pathways (Amaral et al., 1992). Elucidating the specific manner by which neural circuits involving the amygdala perform these functions remains a critical goal for understanding how the brain implements learning, reasoning, and feeling.
Footnotes
This work was supported by the Keck foundation, National Institute on Drug Abuse Grant R01DA020656, the Klingenstein, Sloan, James S. McDonnell, Gatsby, and National Alliance for Research on Schizophrenia and Depression Foundations, and a Charles E. Culpeper Scholarship Award from Goldman Philanthropic Partnerships (C.D.S.). J.J.P. received support from National Institute of Child Health and Human Development and National Eye Institute institutional training grants. We thank members of the Salzman laboratory and the Mahoney Center at Columbia University for helpful comments and discussions, S. Dashnaw and J. Hirsch for MRI support, D. Schneider for help with data collection, and K. Marmon for invaluable technical assistance.
References
- Amaral D, Price J, Pitkanen A, Carmichael S. Anatomical organization of the primate amygdaloid complex. In: Aggleton J, editor. The amygdala: neurobiological aspects of emotion, memory, and mental dysfunction. New York: Wiley; 1992. pp. 1–66. [Google Scholar]
- Amaral DG, Behniea H, Kelly JL. Topographic organization of projections from the amygdala to the visual cortex in the macaque monkey. Neuroscience. 2003;118:1099–1120. doi: 10.1016/s0306-4522(02)01001-1. [DOI] [PubMed] [Google Scholar]
- Balleine BW, Killcross S. Parallel incentive processing: an integrated view of amygdala function. Trends Neurosci. 2006;29:272–279. doi: 10.1016/j.tins.2006.03.002. [DOI] [PubMed] [Google Scholar]
- Baxter MG, Murray EA. The amygdala and reward. Nat Rev Neurosci. 2002;3:563–573. doi: 10.1038/nrn875. [DOI] [PubMed] [Google Scholar]
- Belova MA, Paton JJ, Morrison SE, Salzman CD. Expectation modulates neural responses to pleasant and aversive stimuli in primate amygdala. Neuron. 2007;55:970–984. doi: 10.1016/j.neuron.2007.08.004. [DOI] [PMC free article] [PubMed] [Google Scholar]
- Cromwell HC, Schultz W. Effects of expectations for different reward magnitudes on neuronal activity in primate striatum. J Neurophysiol. 2003;89:2823–2838. doi: 10.1152/jn.01014.2002. [DOI] [PubMed] [Google Scholar]
- Dayan P, Abbott LF. Theoretical neuroscience. Cambridge, MA: MIT; 2001. [Google Scholar]
- Dayan P, Balleine BW. Reward, motivation, and reinforcement learning. Neuron. 2002;36:285–298. doi: 10.1016/s0896-6273(02)00963-7. [DOI] [PubMed] [Google Scholar]
- Dickinson A. Contemporary animal learning theory. Cambridge, UK: Cambridge UP; 1980. [Google Scholar]
- Dickinson A, Mackintosh NJ. Classical conditioning in animals. Annu Rev Psychol. 1978;29:587–612. doi: 10.1146/annurev.ps.29.020178.003103. [DOI] [PubMed] [Google Scholar]
- Dorris MC, Glimcher PW. Activity in posterior parietal cortex is correlated with the relative subjective desirability of action. Neuron. 2004;44:365–378. doi: 10.1016/j.neuron.2004.09.009. [DOI] [PubMed] [Google Scholar]
- Everitt BJ, Cardinal RN, Parkinson JA, Robbins TW. Appetitive behavior: impact of amygdala-dependent mechanisms of emotional learning. Ann N Y Acad Sci. 2003;985:233–250. [PubMed] [Google Scholar]
- Gallistel CR, Gibbon J. Time, rate, and conditioning. Psychol Rev. 2000;107:289–344. doi: 10.1037/0033-295x.107.2.289. [DOI] [PubMed] [Google Scholar]
- Ghashghaei HT, Barbas H. Pathways for emotion: interactions of prefrontal and anterior temporal pathways in the amygdala of the rhesus monkey. Neuroscience. 2002;115:1261–1279. doi: 10.1016/s0306-4522(02)00446-3. [DOI] [PubMed] [Google Scholar]
- Ghashghaei HT, Hilgetag CC, Barbas H. Sequence of information processing for emotions based on the anatomic dialogue between prefrontal cortex and amygdala. Neuroimage. 2007;34:905–923. doi: 10.1016/j.neuroimage.2006.09.046. [DOI] [PMC free article] [PubMed] [Google Scholar]
- Green DM, Swets JA. Signal detection theory and psychophysics. New York: Wiley; 1966. [Google Scholar]
- Herry C, Bach DR, Esposito F, Di Salle F, Perrig WJ, Scheffler K, Lüthi A, Seifritz E. Processing of temporal unpredictability in human and animal amygdala. J Neurosci. 2007;27:5958–5966. doi: 10.1523/JNEUROSCI.5218-06.2007. [DOI] [PMC free article] [PubMed] [Google Scholar]
- Höistad M, Barbas H. Sequence of information processing for emotions through pathways linking temporal and insular cortices with the amygdala. Neuroimage. 2008;40:1016–1033. doi: 10.1016/j.neuroimage.2007.12.043. [DOI] [PMC free article] [PubMed] [Google Scholar]
- Kawagoe R, Takikawa Y, Hikosaka O. Expectation of reward modulates cognitive signals in the basal ganglia. Nat Neurosci. 1998;1:411–416. doi: 10.1038/1625. [DOI] [PubMed] [Google Scholar]
- LeDoux JE. Emotion circuits in the brain. Annu Rev Neurosci. 2000;23:155–184. doi: 10.1146/annurev.neuro.23.1.155. [DOI] [PubMed] [Google Scholar]
- Leon MI, Shadlen MN. Effect of expected reward magnitude on the response of neurons in the dorsolateral prefrontal cortex of the macaque. Neuron. 1999;24:415–425. doi: 10.1016/s0896-6273(00)80854-5. [DOI] [PubMed] [Google Scholar]
- Mackintosh NJ. Conditioning and associative learning. Oxford: Oxford UP; 1983. [Google Scholar]
- McCoy AN, Crowley JC, Haghighian G, Dean HL, Platt ML. Saccade reward signals in posterior cingulate cortex. Neuron. 2003;40:1031–1040. doi: 10.1016/s0896-6273(03)00719-0. [DOI] [PubMed] [Google Scholar]
- McDonald AJ. Cortical pathways to the mammalian amygdala. Prog Neurobiol. 1998;55:257–332. doi: 10.1016/s0301-0082(98)00003-3. [DOI] [PubMed] [Google Scholar]
- Padoa-Schioppa C, Assad JA. Neurons in the orbitofrontal cortex encode economic value. Nature. 2006;441:223–226. doi: 10.1038/nature04676. [DOI] [PMC free article] [PubMed] [Google Scholar]
- Paton JJ, Belova MA, Morrison SE, Salzman CD. The primate amygdala represents the positive and negative value of visual stimuli during learning. Nature. 2006;439:865–870. doi: 10.1038/nature04490. [DOI] [PMC free article] [PubMed] [Google Scholar]
- Pavlov IP. Conditioned reflexes. London: Oxford UP; 1927. [Google Scholar]
- Paxinos G, Huang X, Toga AW. The rhesus monkey brain in stereotaxic coordinates. San Diego: Academic; 2000. [Google Scholar]
- Platt ML, Glimcher PW. Response fields of intraparietal neurons quantified with multiple saccadic targets. Exp Brain Res. 1998;121:65–75. doi: 10.1007/s002210050438. [DOI] [PubMed] [Google Scholar]
- Roesch MR, Olson CR. Neuronal activity related to reward value and motivation in primate frontal cortex. Science. 2004;304:307–310. doi: 10.1126/science.1093223. [DOI] [PubMed] [Google Scholar]
- Samejima K, Ueda Y, Doya K, Kimura M. Representation of action-specific reward values in the striatum. Science. 2005;310:1337–1340. doi: 10.1126/science.1115270. [DOI] [PubMed] [Google Scholar]
- Schultz W, Dayan P, Montague PR. A neural substrate of prediction and reward. Science. 1997;275:1593–1599. doi: 10.1126/science.275.5306.1593. [DOI] [PubMed] [Google Scholar]
- Stefanacci L, Amaral DG. Some observations on cortical inputs to the macaque monkey amygdala: an anterograde tracing study. J Comp Neurol. 2002;451:301–323. doi: 10.1002/cne.10339. [DOI] [PubMed] [Google Scholar]
- Sugrue LP, Corrado GS, Newsome WT. Matching behavior and the representation of value in the parietal cortex. Science. 2004;304:1782–1787. doi: 10.1126/science.1094765. [DOI] [PubMed] [Google Scholar]
- Sutton R, Barto A. Reinforcement learning. Cambridge, MA: MIT; 1998. [Google Scholar]
- Tobler PN, Fiorillo CD, Schultz W. Adaptive coding of reward value by dopamine neurons. Science. 2005;307:1642–1645. doi: 10.1126/science.1105370. [DOI] [PubMed] [Google Scholar]
- Tremblay L, Schultz W. Relative reward preference in primate orbitofrontal cortex. Nature. 1999;398:704–708. doi: 10.1038/19525. [DOI] [PubMed] [Google Scholar]
- Whalen PJ. The uncertainty of it all. Trends Cogn Sci. 2007;11:499–500. doi: 10.1016/j.tics.2007.08.016. [DOI] [PubMed] [Google Scholar]