ADH single nucleotide polymorphism associations with alcohol metabolism in vivo (original) (raw)
Abstract
We have previously found that variation in alcohol metabolism in Europeans is linked to the chromosome 4q region containing the ADH gene family. We have now typed 103 single nucleotide polymorphisms (SNPs) across this region to test for allelic associations with variation in blood and breath alcohol concentrations after an alcohol challenge. In vivo alcohol metabolism was modelled with three parameters that identified the absorption and rise of alcohol concentration following ingestion, and the rate of elimination. Alleles of ADH7 SNPs were associated with the early stages of alcohol metabolism, with additional effects in the ADH1A, ADH1B and ADH4 regions. Rate of elimination was associated with SNPs in the intragenic region between ADH7 and ADH1C, and across ADH1C and ADH1B. SNPs affecting alcohol metabolism did not correspond to those reported to affect alcohol dependence or alcohol-related disease. The combined SNP associations with early- and late-stage metabolism only account for approximately 20% of the total genetic variance linked to the ADH region, and most of the variance for in vivo alcohol metabolism linked to this region is yet to be explained.
INTRODUCTION
After consumption of an alcoholic drink or after an experimental oral alcohol challenge, the blood alcohol concentration rises during the absorption phase, reaches a peak, and then decreases at a near-linear rate. There is considerable between-individual variation in the blood alcohol concentrations achieved, even after a standard weight-adjusted dose of alcohol (1,2). Such variation affects both the peak concentration, which will depend on body composition and on pre-absorptive or first-pass metabolism, and the rate of elimination after the peak concentration is reached, which reflects hepatic alcohol metabolism. This pharmacokinetic variation affects both the degree and duration of intoxication. These differences between people are reproducible (2–5), heritable (2,3,6), and show linkage to the alcohol dehydrogenase (ADH) locus on chromosome 4 (7).
The conversion of alcohols to the corresponding aldehydes is catalysed by alcohol dehydrogenases, and this is the rate-limiting step in the elimination of ethanol in humans or experimental animals. Seven ADH genes are located as a cluster on chromosome 4q22-23 (8,9). The Class 1 enzymes (coded by ADH1A, ADH1B and ADH1C in humans) have high affinity for ethanol and contribute most to its conversion to acetaldehyde, particularly during the elimination phase. ADH7 acts early in the time course of alcohol metabolism in the stomach mucosa (10) which is exposed to high concentrations of alcohol. Several association studies for gene polymorphisms potentially affecting alcohol elimination have been reported, concentrating on Arg48His and Arg370Cys in ADH1B. They have substantial effects on the in vitro kinetic properties of the enzyme (11) but paradoxically small effects in vivo. We have recently shown that variation in ADH7 is associated with variation in early (pre-absorptive or first-pass) alcohol metabolism (12).
In addition to effects on blood alcohol concentrations and therefore on the extent and duration of intoxication, variation in alcohol metabolism is implicated in the genetics of alcohol dependence and other alcohol-related disease. ADH1B and ADH1C polymorphisms have been studied extensively in relation to alcohol dependence. The main focus has been candidate gene association studies based on ADH1B Arg48His (13–17) and ADH1B Arg370Cys (18,19). Apparent effects of ADH1C Ile350Val or the accompanying Arg272Gln have been attributed to linkage disequilibrium (LD) with the ADH1B Arg48His site (16). Five reports on associations between a wider range of ADH SNPs and alcohol dependence (20–24), and one on upper aerodigestive cancers (25), are now available.
The rate at which alcohol is oxidized to acetaldehyde is believed to be an important aetiological factor for the genetic risk of alcohol dependence, mainly because the alleles of non-synonymous ADH1B polymorphisms associated with high _V_max in vitro are the ones which confer protection against alcohol dependence. The hypothesis that high rates of in vivo ethanol metabolism (leading to higher acetaldehyde concentrations) are negatively associated with risk of alcohol dependence was generated from studies of East Asian populations where the ADH1B 48His allele is at intermediate frequency, and has been extended to Europeans in whom it is less common. These studies are summarized by Whitfield and Eng et al. (26,27). Moreover, the risk of alcohol dependence is higher, at least in Europeans, for those with a lower rate of in vivo alcohol metabolism (28). Three variants, ADH1B Arg48His, ADH1C Arg272Gln/Ile350Val and ADH1B Arg370Cys, are known to affect enzyme activity in vitro; but we previously found that the first two only accounted for approximately 1% of the genetic variance for in vivo metabolism because of linkage with the ADH region (7). This small contribution may be because the ADH1B Arg48His polymorphism has low minor allele frequency in Europeans, in contrast to East Asians; or because factors unrelated to the kinetic properties of this ADH enzyme determine the in vivo rate of alcohol metabolism. The in vivo studies in Asians also suggest that the contribution of ADH1B Arg48His to variation in alcohol metabolism is minor (29,30). ADH1B Arg370Cys is monomorphic in European populations, but it has been shown to have a small effect on the rate of alcohol elimination in African-Americans (31).
The current state of knowledge is that variation in the ADH gene region is thought to contribute substantially to variation in alcohol metabolism, but the relevant polymorphisms and the size of the allelic effects are still undefined. There is an expectation that ADH polymorphisms which affect alcohol dependence or alcohol intake should do so by affecting alcohol metabolism, but the available evidence tends to contradict this. More extensive SNP association studies may resolve these questions. We now present results for association testing between in vivo alcohol metabolism and SNPs across the entire ADH region. This represents an extension of earlier results for 25 SNPs in the ADH7 gene, to 103 SNPs covering all seven ADH genes, and includes some coverage of intergenic regions and the two nearest flanking genes, C4orf17 and METAP1. Our study had three main aims: to test (a) whether ADH SNPs show associations with alcohol metabolism, distinguishing between the early and late pharmacokinetic phases; (b) whether such associations can account for the linkage of alcohol metabolism to this chromosomal region; and (c) how far the SNPs associated with alcohol metabolism correspond to those associated with other alcohol-related phenotypes.
RESULTS
Single nucleotide polymorphism coverage
The 103 SNPs (Table 1) covered 497 kb on chromosome 4 in the ADH gene region. Totally, 75 SNPs had a minor allele frequency ≥0.2, and 88 ≥0.1. Most were within or immediately flanking the coding regions of the seven ADH genes. Of the 103 SNPs, 76 are included in HapMap, and these tag (at _r_2 ≥ 0.8) a further 215 of the 534 non-monomorphic CEU HapMap SNPs in this region. However, we did not impute genotypes for these additional SNPs. The coverage of HapMap SNPs was 54% overall (291/534), 48% for intergenic SNPs (177/366), 66% for intronic, 3′-UTR or 5′-UTR SNPs (104/157), and 91% for exonic SNPs (10/11). The number of SNPs per kilobase in coding regions was ADH1C 1.11; ADH7 0.56; ADH1B 0.55; ADH4 0.39; ADH1A 0.34; ADH6 0.18; ADH5 0.11. Intergenic regions averaged about 0.13 SNPs/kb. Non-synonymous coding SNPs included rs1229984 in exon 3 of ADH1B (Arg48His) and rs698 in exon 8 of ADH1C (Ile350Val). SNP rs1693482 in exon 6 of ADH1C also results in a non-synonymous substitution (Arg272Gln); it is in near-complete LD with rs698 (ADH1C Ile350Val).
Table 1.
Positions, polymorphisms and minor allele frequencies (MAF) of typed single nucleotide polymorphisms (SNPs) within and flanking the ADH gene family; and significant associations with early or late alcohol metabolism, tested on blood or breath alcohol concentrations
| SNP | Position (bp)a | Polymorphismb | Functionality/placement | MAF | P _A_0 and _k_1, Bloodc | P _A_0 and _k_1, Breathc | P _k_2, Bloodc | P _k_2, Breathc |
|---|---|---|---|---|---|---|---|---|
| METAP1 | 100135043 | |||||||
| 1 | rs1020624 | 100163877 | T→C | Intron 7 | 0.296 | |||
| 2 | rs1230210 | 100186714 | G→A | Intron 5 | 0.298 | |||
| METAP1 5′ | 100202983 | |||||||
| 3 | rs1230165 | 100205396 | A→G | Intergenic | 0.190 | |||
| 4 | rs1230155 | 100208282 | A→G | Intergenic | 0.334 | |||
| ADH5 mRNA | 100211152 | |||||||
| 5 | rs896992 | 100221395 | T→C | Intron 4 | 0.333 | |||
| 6 | rs1154409 | 100226893 | C→A | Intron 1 | 0.100 | |||
| ADH5 mRNA 5′ | 100228954 | |||||||
| 7 | rs1154400 | 100229033 | T→C | Intergenic | 0.321 | |||
| 8 | rs1377689 | 100240810 | G→A | Intergenic | 0.266 | |||
| 9 | rs2602859 | 100249606 | A→G | Intergenic | 0.270 | |||
| 10 | rs2602877 | 100258870 | A→T | Intergenic | 0.268 | |||
| 11 | rs2602878 | 100258976 | G→T | Intergenic | 0.266 | |||
| 12 | rs2602891 | 100262307 | T→C | Intergenic | 0.280 | |||
| ADH4 mRNA | 100263855 | |||||||
| 13 | rs1042364 | 100264597 | G→A | Exon 9 3′-UTR | 0.277 | |||
| 14 | rs1126673 | 100264639 | A→G | Exon 9 Non-syn (Ile→Val) Splice site | 0.298 | |||
| 15 | rs1573495 | 100265708 | G→A | Intron 8 | 0.017 | 0.013 | ||
| 16 | Hpy 1881 | 100265848 | T→C | Intron 8 | 0.264 | |||
| 17 | rs1126672 | 100266835 | C→T | Exon 8 Non-syn (Ala→Gln) | 0.278 | |||
| 18 | rs1126671 | 100267437 | G→A | Exon 7 Non-syn (Val→Ile) | 0.304 | |||
| 19 | rs1126670 | 100271756 | T→G | Exon 6 Syn (Pro→Pro) | 0.301 | |||
| 20 | rs2032349 | 100281842 | C→T | Exon 3 Syn (Ser→Ser) | 0.022 | 0.045 | ||
| ADH4 mRNA 5′ | 100284472 | |||||||
| 21 | rs1800759 | 100284532 | C→T | Intergenic | 0.378 | 0.004 | ||
| 22 | rs4140388 | 100284757 | G→C | Intergenic | 0.441 | |||
| 23 | rs3762894 | 100285107 | T→C | Intergenic | 0.138 | 0.039 | ||
| 24 | rs1984364 | 100289806 | T→G | Intergenic | 0.280 | |||
| 25 | rs1984362 | 100289996 | C→T | Intergenic | 0.280 | |||
| 26 | rs1540053 | 100301177 | A→G | intergenic | 0.238 | |||
| 27 | rs2051428 | 100342209 | T→C | Intergenic | 0.207 | |||
| 28 | rs2000864 | 100342799 | G→T | Intergenic | 0.465 | |||
| ADH6 mRNA | 100342818 | |||||||
| 29 | rs4147545 | 100347776 | A→G | Intron 6 | 0.292 | |||
| 30 | rs3857224 | 100348708 | C→T | Intron 6 | 0.284 | 0.032 | ||
| 31 | rs4147544 | 100353537 | C→A | Intron 3 | 0.472 | |||
| ADH6 mRNA 5′ | 100359426 | |||||||
| 32 | rs1230021 | 100395030 | C→A | Intergenic | 0.022 | 0.046 | ||
| 33 | rs1497379 | 100395093 | T→C | Intergenic | 0.424 | |||
| 34 | rs1230025 | 100405399 | T→A | Intergenic | 0.229 | 0.026 | ||
| 35 | rs1618572 | 100414144 | C→G | Intergenic | 0.228 | 0.033 | ||
| ADH1A mRNA | 100416547 | |||||||
| 36 | rs3819197 | 100419532 | C→T | Intron 8 | 0.206 | |||
| 37 | rs1229976 | 100421101 | T→C | Intron 6 | 0.228 | 0.033 | ||
| 38 | rs2276332 | 100422470 | A→C | Intron 6 | 0.075 | 0.048 | ||
| 39 | rs1229967 | 100426601 | G→C | Intron 3 | 0.227 | 0.041 | ||
| 40 | rs931635 | 100429870 | C→T | Intron 1 | 0.226 | 0.041 | ||
| ADH1A mRNA 5′ | 100431165 | |||||||
| 41 | rs904092 | 100433187 | G→A | Intergenic | 0.173 | |||
| 42 | rs1789877 | 100445081 | A→G | Intergenic | 0.027 | 0.042 | 0.005 | |
| ADH1B mRNA | 100445157 | |||||||
| 43 | rs1042026 | 100447489 | A→G | Exon 9 3′-UTR | 0.258 | |||
| 44 | rs17033 | 100447968 | A→G | Exon 9 3′-UTR | 0.067 | 0.029 | ||
| 45 | rs1229985 | 100451901 | T→C | Intron 6 | 0.027 | 0.034 | 0.003 | |
| 46 | rs1789882 | 100454076 | G→A | Intron 6 | 0.175 | |||
| 47 | rs2018417 | 100454163 | G→T | Exon 6 Syn (Ala→Ala) | 0.041 | 0.015 | ||
| 48 | rs2075633 | 100458021 | A→G | Intron 3 | 0.257 | |||
| 49 | rs4147536 | 100458135 | G→T | Intron 3 | 0.204 | |||
| 50 | rs1229984 | 100458342 | G→A | Exon 3 Non-syn (Arg→His) | 0.035 | |||
| 51 | rs1353621 | 100460598 | A→G | Intron 1 | 0.417 | |||
| ADH1B mRNA 5′ | 100461581 | |||||||
| 52 | rs1159918 | 100462032 | G→T | intergenic | 0.333 | |||
| 53 | rs2866152 | 100470090 | C→G | intergenic | 0.287 | |||
| 54 | rs1789895 | 100475752 | C→G | intergenic | 0.353 | |||
| 55 | rs1662031 | 100475816 | A→G | intergenic | 0.454 | |||
| 56 | rs3098808 | 100475847 | A→G | intergenic | 0.078 | |||
| ADH1C 3′ | 100476672 | |||||||
| 57 | rs2298753 | 100476930 | T→C | exon-9 3′utr | 0.100 | |||
| 58 | rs1612735 | 100477030 | T→C | intron-8 | 0.454 | |||
| 59 | rs1662060 | 100478864 | A→G | intron-8 | 0.453 | 0.003 | ||
| 60 | rs698 | 100479812 | A→G | exon-8 Non Syn (Ile→Val) | 0.452 | |||
| 61 | rs1693481 | 100482857 | C→T | intron-6 | 0.450 | |||
| 62 | rs1789912 | 100482965 | C→T | intron-6 | 0.445 | |||
| 63 | rs1693482 | 100482988 | C→T | exon-6 Non Syn (Arg→Gln) | 0.450 | |||
| 64 | rs1693424 | 100484259 | C→G | intron-5 | 0.453 | |||
| 65 | rs1625439 | 100484348 | G→T | intron-5 | 0.453 | |||
| 66 | rs283411 | 100484980 | G→T | intron-5 | 0.052 | 0.015 | ||
| 67 | rs1693425 | 100485135 | C→T | exon-5 Syn (Val→Val) | 0.452 | |||
| 68 | rs2241894 | 100485156 | A→G | exon-5 Syn (Val→Val) | 0.216 | |||
| 69 | rs1693426 | 100485353 | A→G | intron-4 | 0.454 | |||
| 70 | rs1662053 | 100485606 | T→G | intron-3 | 0.454 | |||
| 71 | rs1662052 | 100485658 | T→C | intron-3 | 0.454 | |||
| 72 | rs1693431 | 100487072 | T→G | intron-3 | 0.454 | |||
| 73 | rs1629270 | 100490329 | A→G | intron-1 | 0.453 | |||
| 74 | rs283416 | 100490379 | C→T | intron-1 | 0.052 | 0.015 | ||
| ADH1C 5′ | 100492940 | |||||||
| 75 | rs1789924 | 100493309 | C→T | intergenic | 0.457 | |||
| 76 | rs980972 | 100498270 | C→A | intergenic | 0.457 | |||
| 77 | rs1596179 | 100506872 | G→A | intergenic | 0.454 | |||
| 78 | rs1583973 | 100506906 | G→A | intergenic | 0.103 | 0.007 | ||
| 79 | rs283406 | 100517494 | C→T | intergenic | 0.052 | 0.016 | ||
| 80 | rs1826906 | 100520071 | T→C | intergenic | 0.314 | |||
| 81 | rs1442484 | 100525199 | T→C | intergenic | 0.200 | |||
| 82 | rs2032350 | 100533085 | C→T | intergenic | 0.197 | |||
| 83 | rs1348276 | 100544653 | T→G | intergenic | 0.394 | |||
| 84 | rs994772 | 100546687 | G→A | intergenic | 0.118 | 0.016 | ||
| 85 | rs969804 | 100548716 | T→A | intergenic | 0.392 | |||
| 86 | rs729147 | 100552290 | A→G | intergenic | 0.228 | 0.023 | ||
| ADH7 mRNA | 100552441 | |||||||
| 87 | rs284787 | 100552579 | C→T | exon9-3′utr | 0.236 | |||
| 88 | rs3805329 | 100552635 | T→C | exon9-3′utr | 0.074 | |||
| 89 | rs894369 | 100552869 | C→G | exon9-3′utr | 0.229 | 0.014 | ||
| 90 | rs3805331 | 100552955 | A→G | exon9-3′utr | 0.073 | |||
| 91 | rs284786 | 100553000 | A→T | exon9-3′utr | 0.309 | 0.049 | ||
| 92 | rs284784 | 100554897 | G→T | intron-8 | 0.236 | |||
| 93 | rs1154454 | 100557365 | T→C | intron-7 | 0.182 | |||
| 94 | rs1154458 | 100559545 | C→G | intron-6 | 0.413 | |||
| 95 | rs971074 | 100560884 | G→A | exon 6 Syn (Arg→Arg) | 0.110 | |||
| 96 | rs1154461 | 100561925 | G→C | intron-5 | 0.336 | 0.0003 | 0.010 | |
| 97 | rs1573496 | 100568692 | C→G | exon-3 Non Syn (Ala→Gly | 0.100 | |||
| 98 | rs1154468 | 100573280 | A→T | intron-1 | 0.335 | 0.0006 | 0.016 | |
| 99 | rs1154470 | 100575360 | G→A | intron-1 | 0.335 | 0.0008 | 0.012 | |
| ADH7 mRNA 5′ | 100575548 | |||||||
| 100 | rs894363 | 100595869 | C→T | intergenic | 0.403 | 0.0007 | 0.0049 | |
| 101 | rs2851024 | 100610127 | T→G | intergenic | 0.480 | |||
| 102 | rs1583971 | 100626045 | A→T | intergenic | 0.107 | |||
| C4orf17 mRNA 5′ | 100651197 | |||||||
| 103 | rs1354368 | 100660909 | G→A | intron-2 | 0.350 | |||
| C4orf17 mRNA | 100682483 |
Single nucleotide polymorphism effects on alcohol metabolism
Following our previous approach (12), the effects of SNPs in the ADH region on blood and breath alcohol concentrations were assessed using a kinetic model of in vivo alcohol metabolism [see Eq. (1) in Materials and Methods]. This distinguished between SNPs that act early in the time course of in vivo metabolism (the joint effect of the two parameters _A_0 and _k_1 for 2 df) and later effects (the rate of elimination _k_2 for 1 df). Results are shown in Table 1.
The early effects were strongest for the SNPs within or close to the ADH7 gene. There are also significant early effects (P < 0.05) across ADH1A and ADH1B (but not ADH1C), and in ADH4 and ADH5. For the later effects on _k_2, reflecting post-absorptive alcohol elimination, significant associations were seen for a range of SNPs across the region between ADH7 and ADH1C, through ADH1C and into ADH1B (but not ADH1A). Associations are also seen for two SNPs in or near ADH4.
Linkage disequilibrium in the ADH region
The distribution of pairwise LD (_D_′) values (Supplementary Material, Fig. S1) shows several blocks where _D_′ is close to 1. In contrast, most values >0.5 of the genetic correlation coefficient _r_2 are confined to blocks of about 100 kb or less. (Although _r_2 and _D_′ are equivalent when both SNP allele frequencies are equal, _D_′ exceeds _r_2 when they are not.)
The pattern of LD for SNPs in the ADH1C region (Supplementary Material, Fig. S2) is of a major LD block (rs2032350 to rs2866152) although there is an apparent discontinuity at rs1826906, a SNP with intermediate frequency. The LD block in the ADH1C region flanks the transcribed sequences by 40.15 kb in the 5′ direction and 6.58 kb in the 3′ direction, although the highest allelic correlations are within the ADH1C transcriptional unit. SNPs rs1693482 (Arg272Gln in exon 6) and rs698 (Ile350Val in exon 8), the only two genotyped non-synonymous substitutions in the region, are in near-total LD. Although they are associated with a two-fold difference in ADH _V_max in vitro there was no evidence of association with in vivo alcohol oxidation, consistent with our earlier analyses of the same sample.
An extensive but weak LD block (170.6 kb) from ADH1B, across ADH1A and ADH6 to the ADH6–ADH4 intergenic region (Supplementary Material, Fig. S3) contains three instances where effects on blood or breath alcohol concentration reach a statistical significance level of P < 0.01, and there is a cluster of 12 SNPs for which 0.01 < P < 0.05 (Table 1, Fig. 1). This block extends beyond the three corresponding transcribed sequences. The significant effects in this region are for both the early and late stages of alcohol metabolism and are only associated with lower-minor allele frequency (MAF) alleles in the ADH1B haplotype block: rs2018417 (with an early-increasing effect on alcohol oxidation), rs1229985 (late-increasing effect), rs17033 (early-decreasing) and rs1789877 (late-increasing). The low-MAF SNP rs1229984 is the ADH1B Arg48His polymorphism, which was not associated with alcohol metabolism. In contrast, effects on early stage metabolism in the ADH1A region are associated with four common alleles (rs931635, rs1229967, rs1618572, rs1230025), all with an increasing effect, and one less common allele at rs2276332 (with a decreasing effect).
Figure 1.

Comparison of single nucleotide polymorphism (SNP) associations across the ADH gene region. All data points are plotted as −log (p) (_y_-axis) against SNP location (_x_-axis, converted where necessary from the original publication to NCBI Build 36). For alcohol metabolism, the effects are estimated from the kinetic model of the time course of alcohol absorption and elimination. They are presented as the joint effect of parameters _A_0 and _k_1 (for early stages of alcohol absorption and metabolism), and parameter _k_2, the rate of elimination of alcohol (for later stages of metabolism). Results are also shown for alcohol dependence (8,21–24), alcohol consumption (24) and alcohol-related upper aerodigestive cancers (25). The position of ADH genes is indicated by the boxes: A = ADH1A, B = ADH1B, C = ADH1C, 4 = ADH4, 5 = ADH5, 6 = ADH6, 7 = ADH7. Studies are distinguished as follows: this paper, early = effects on the absorption/distribution phase of alcohol pharmacokinetics, _A_0 and _k_1; this paper, late = effects on the elimination phase of alcohol pharmacokinetics, _k_2; Macgregor (24) QF = alcohol intake from quantity and frequency data; Macgregor AD = alcohol dependence symptom count; Choi (21) AD = alcohol dependence diagnosis; Edenberg (22) COGA = alcohol dependence by COGA criteria; Edenberg DSM4 = alcohol dependence by DSM-IV criteria; Kuo (23) AD = alcohol dependence diagnosis; Luo (8) HWE EA and AA = alcohol dependence diagnosis using Hardy–Weinberg disequilibrium testing in European-Americans or African-Americans, respectively; Luo EA and AA = alcohol dependence diagnosis using allelic association test in European-Americans or African-Americans, respectively; Hashibe (25) Ca = case–control study of upper aerodigestive cancers.
In the ADH6–ADH4 intergenic region two SNPs at intermediate frequency (rs3857224 and rs3762894) are related to early stages of metabolism. One SNP (rs1800759), located in the 5′ flanking region of the ADH4 coding sequence, is at intermediate frequency and associated (P < 0.01) with early stage metabolism. Two out of three less common SNPs (rs2032349, rs1573495) fall within the ADH4 transcribed region and are associated (0.05≥P ≥ 0.01) with rate of elimination.
Overall, the significantly lower MAF SNPs (MAF < 0.11) in the _ADH1C–ADH5_ region were generally related to rate of elimination (10 out of 13), and all seven significant SNPs at intermediate frequency (MAF > 0.11) were associated with early stages of metabolism (Table 1). MAF was significantly associated with early/late phase effects (P = 0.001, Mann–Whitney test) and even after taking haplotype sharing into account, the association between SNP frequency (low/intermediate) and physiological effect (early/late) in this region remained significant (P = 0.035 by Fisher's exact test).
In the ADH7 region, two LD blocks were found (see Supplementary Material, Fig. S4). Our previous analysis of this region (12) showed that variation in early alcohol metabolism is associated with the ADH7 5′ LD block, and that this is most likely associated with rs1154461, rs1154468, rs1154470 or rs894363. These SNPs show significant associations with early alcohol metabolism, assessed by either blood or breath alcohol results (Table 1), but because of the strong LD it is not possible to assign the effect to any individual SNP.
DISCUSSION
Oxidation of ethanol to acetaldehyde, catalysed by the high-affinity forms of ADH, is the initial and rate-limiting step in alcohol metabolism. It follows that variation in ADH genes, or in the control of their expression, may explain the genetic component of variation in human alcohol metabolism. Linkage between the family of ADH-encoding genes, located at 4q21-23, and both post-challenge alcohol concentrations (7) and alcohol dependence risk (32–34) strengthens this hypothesis. Associations between variation in at least one ADH polymorphism (ADH1B Arg48His, rs1229984) and alcohol dependence risk have repeatedly been found [summarized in (26,27)]. The effects of this polymorphism on in vitro enzyme activity are consistent with the theory that high ADH activity, leading to high rates of acetaldehyde generation, is protective against alcohol dependence.
Based on this prior information, we expect that polymorphic variation within the ADH gene cluster will affect a series of events: the rate of alcohol metabolism, the rate of formation and hence the steady-state concentration of acetaldehyde, the subjective effects of alcohol consumption, the quantity of alcohol consumed and the risk of alcohol dependence. Our recent work on these phenotypes related to alcohol dependence (24) has strengthened the evidence for this. There may also be effects of ADH variation on alcohol-induced liver damage [(35), but see (36)] and carcinogenesis (25). In this paper, we have examined associations between ADH SNP variation and alcohol metabolism in vivo, and we compare these associations with the previous findings on ADH variation and other alcohol-related phenotypes, including alcohol dependence.
Allelic association with alcohol metabolism
Multiple significant allelic associations between the tested SNPs and either the absorption or elimination phase of alcohol pharmacokinetics were found. The strongest were in the ADH7 region, as previously reported, and with the early or absorption phase. At first sight, it may seem surprising that the early phase of alcohol pharmacokinetics (captured by the volume of distribution _A_0 and the absorption rate constant _k_1) is associated with variation in ADH. However, there is significant ADH-dependent alcohol metabolism in the stomach, before absorption, and in the liver before alcohol reaches the systemic circulation. We have argued previously (12) that ADH7 is well-suited by its location and kinetic properties to participate in this ‘first-pass’ metabolism. Variation in first-pass metabolism will lead to variation in the apparent volume of distribution of alcohol.
Another noteworthy aspect of our results is that the detected SNP effects on early alcohol metabolism are mainly for SNPs at intermediate to high MAF. This may be a function of power to detect the effects, which will be greater for common polymorphisms, but several less common SNPs had detectable effects on the post-absorption or elimination phase and therefore their effect sizes must be substantial.
Compared with the effect size implied by our linkage analysis, the SNP associations we find in the ADH region have comparatively small effects on alcohol metabolism. The effect of variation in the extensively studied ADH1B Arg48His variant (rs1229984) on post-challenge alcohol concentrations is minimal; we estimated it to contribute <1% of variance in our previous analysis of these data. Others have presented relevant data on this polymorphism from East Asian subjects, where no significant in vivo effects were found (29,30); and from Israelis (37) in whom a significant effect accounting for 8% of the population variation was found. The largest effect in the ADH region on blood or breath alcohol concentration was located in an LD block in the 5′ part of the ADH7 gene, and only accounts for approximately 18% of the genetic variance (12).
Variation which is not tagged by the SNPs typed here, where we mainly targeted coding regions, must be contributing to the linkage effect. Such linkage in the absence of SNP association could be observed for several reasons; multiple rare variants, each arising on a different haplotype background and associated with different alleles at the tagging SNPs, or by polymorphisms not in LD with any of our typed SNPs that modify or regulate ADH levels. _Cis_-acting regulatory polymorphisms can be located within or outside a gene cluster and can result in coordinated control of a set of genes.
The nature and locations of regulatory elements for ADH gene expression in the ADH region have been studied by several groups (38). The regulatory elements are not necessarily gene-specific; for example a HNF1-binding site controlling Class 1 ADH expression, located upstream of ADH1C, interacted with promoter sequences for all Class 1 ADH genes (39). Polymorphisms in sites with regulatory functions have an obvious potential to affect alcohol metabolism; a promoter polymorphism affects ADH4 expression in transfected hepatoma cells (40). Haplotypes which included a 66-bp insertion/deletion polymorphism upstream of _ADH1C_-affected promoter activity in a transfection assay (41), accounting for a two-fold change in transcription activity. We can therefore expect to find polymorphisms both for the coordinated regulation of several members of the ADH gene family, and regulation of specific ADH genes.
Genome-wide association and expression array methods allow detection of SNP-associated levels of gene expression (transcript abundance). This approach may be useful for relating ADH gene expression, and by implication of ADH enzyme activity, to rate of metabolism after alcohol challenge. Studies on gene expression in lymphocytes have shown linkage of ADH1B expression to loci elsewhere on 4q (42). A comprehensive genome-wide study of SNPs affecting gene expression in transformed lymphocytes (http://www.sph.umich.edu/csg/liang/asthma/mRNA_bySNP_browser_v1.0.1.exe) (43) showed effects of SNPs between ADH1A and ADH6 on ADH1A expression. However, a similar study on gene expression in the liver (44), which is more relevant to post-absorptive alcohol metabolism, did not report SNPs which significantly affected transcript abundance of any of the ADHs.
Single nucleotide polymorphism effects, alcohol dependence and alcohol-related disease
Many studies have shown associations between ADH polymorphisms and the probability of alcohol dependence. The assumption is that this association is mediated by variation in alcohol metabolism. Therefore, it is useful to consider how far the ADH polymorphisms reported to affect alcohol dependence show associations with either early or late alcohol metabolism in our data. To facilitate this comparison, our SNP association results for the early and late phases of alcohol metabolism are plotted in Figure 1, together with those from five other studies which tested multiple SNPs in ADH genes for association with alcohol dependence (20–24), and one (25) which tested for associations with alcohol-related cancers. Although the methods and the SNPs tested varied, some general conclusions about the genes or regions showing significant associations can be drawn.
As described above, variation in the early phase of alcohol metabolism was associated with SNPs in ADH7 and to a lesser extent with SNPs across ADH1B and ADH1A, in ADH4, and possibly ADH6. Variation in the elimination phase was associated with SNPs in Class 1 ADHs, particularly ADH1B and ADH1C. The SNPs associated with alcohol dependence in other studies may be compared with these. Although the specific SNPs typed vary between studies, the existence of substantial LD leads us to expect that the regions showing significant effects should be identifiable. Figure 1 shows that significant associations for alcohol dependence or alcohol intake cluster in ADH1B and ADH1C, with some in ADH1A. There are also some in or near ADH4 and ADH5, but associations are not usually found in ADH6 or ADH7. There are some features of individual studies which deserve comment: the study by the COGA consortium (22) found different SNP associations (near ADH4, or across ADH1A–1B) with different definitions of the alcohol dependence phenotype. Another US study (20) stratified the analysis by race and found that the different non-synonymous coding SNPs found in ADH1B in European-Americans and African-Americans (Arg48His and Arg370Cys) both affected dependence risk. Their conventional allelic association analysis identified SNPs in ADH1B and ADH1C, but a test based on deviation from Hardy–Weinberg equilibrium also suggested effects in ADH5 and ADH7. It is also notable that all studies, including ours, report a mixture of significant and non-significant SNPs in regions of substantial LD, where one might expect a high degree of concordance for either positive or negative results.
In addition to the studies which focused on ADH variants affecting alcohol dependence risk, a large multicentre study on upper aerodigestive cancers (25) found that rs1229984 (in ADH1B) and rs1573496 (in ADH7) had highly significant effects on risk for this group of cancers. However, these associations are also at variance with our results on alcohol metabolism, because rs1229984 is the Arg48His polymorphism discussed above and has no significant effect on blood or breath alcohol concentrations. We did find [(12) and Table 1] that variation within ADH7 affects post-challenge alcohol concentrations but rs1573496 has no significant effect. This reinforces the paradox of well-documented ADH effects on disease risk, but with no evidence that the proposed causal mechanism of variation in the rate of conversion of ethanol to acetaldehyde is involved.
Conclusions
A number of SNPs which show significant allelic associations with alcohol metabolism have been identified. The early or ‘first-pass’ phase of alcohol metabolism is affected by variation in or near ADH7, ADH1A and ADH1B, and possibly in ADH4. Post-absorptive alcohol metabolism is affected by variation across ADH1A, ADH1B, ADH1C and the intergenic region between ADH1C and ADH7, and again possibly in ADH4. Because of multiple testing, any of these associations could have arisen by chance but it is unlikely that they are all false-positives. There is evidence that variation in the Class 1 ADHs, ADH1A, ADH1B and ADH1C, affects alcohol dependence risk as well as alcohol metabolism. In contrast, ADH7 affects alcohol metabolism but not dependence. The combined effects of the tested SNPs in the ADH region account for only approximately 20% of the total genetic variance for alcohol metabolism, in contrast to the approximately 60% because of the linked quantitative trait loci, implying that other large effects on in vivo alcohol metabolism in the region, not in LD with the SNPs we tested, are still to be discovered. Given the importance of the ADH gene family in alcohol detoxification and risk of alcoholism, a search for rare single-nucleotide or copy-number polymorphisms in regulatory elements close to the ADH gene cluster may provide the key to the unexplained genetic variation in alcohol metabolism.
MATERIALS AND METHODS
The Alcohol Challenge Twin Study (ACTS) took place during 1979–1981 and details of the twins and procedures used to obtain the 10 breath and six blood alcohol readings are given elsewhere (2,7,12). The revised zygosity status of participants, based on genotyping since the original study, is 91 monozygotic (MZ) twin pairs (46 female and 45 male) and 115 dizygotic (DZ) twin pairs (41 female, 35 male and 39 opposite sex). Twin ancestry was 87% northern European and nearly all the remaining 13% was southern European/Mediterranean (15).
Genotyping was carried out on samples from 812 people. The median number of SNPs typed per person was 104 (range 89–104) and the median number of people typed per SNP was 808 (range 753–812). One SNP (rs1041969) was monomorphic, and the remaining 103 are listed in Table 1. Both twins were genotyped from 69 MZ pairs and 102 DZ pairs, and one twin was typed from 16 MZ and eight DZ pairs. In addition, 216 parents from 144 families and 226 non-twin siblings from 133 families were genotyped. The cross-tabulation of family members typed is shown in Supplementary Material, Table S1. Although non-twin relatives were not phenotyped, their genotypes provide information for within-family association tests.
Genotyping and quality control
Alleles were assayed by primer extension on mass spectrometry (Sequenom MassArray system; Sequenom, San Diego, CA, USA). Historic polymorphisms previously analysed using restriction fragment length polymorphism-type assays were converted to the primer extension format. All known gene-coding regions including 3′- and 5′-untranslated region polymorphisms were included. Because of high homology among some of these gene family members, PCR primers were carefully chosen for single-locus specificity and verified on appropriate pedigrees.
No Mendelian errors were identified by inheritance checks [PEDSTATS version 0.4.6 (45)]. Of the 103 SNPs, four showed departures from Hardy–Weinberg equilibrium, within the expectations of sampling error. Genotyping errors were also identified as inconsistencies in the co-inheritance of SNPs [MERLIN version 1.0.1 (46)] identified 66 genotyping errors or 0.01% of all genotypes. These errors (14 SNP loci) were not attributable to location (map order provided by NCBI Build 36.1). Twelve of these SNPs gave error rates in the range of 0.14–0.95% while two were higher (1.9% and 1.5%). Inspection of the distribution of errors by family (34 families) did not provide any systematic indication of their cause and they were recoded as missing. Comparison of MAFs for the 98 SNPs also present in data for the CEU population [CEPH (Utah Residents with Northern and Western European Ancestry)], NCBI Build 36.1 (http://www.ncbi.nlm.nih.gov/projects/SNP/) or from ALFRED (http://alfred.med.yale.edu/alfred/index.asp) gave a very small mean difference (0.00062 ± 0.00423) between allele frequencies genotyped in the present study and published MAFs.
Linkage disequilibrium
Pairwise estimates of LD across the ADH region were obtained using HAPLOVIEW (version 4.1; http://www.broad.mit.edu.mpg/haploview/). The most likely haplotypes were identified following the examination of LD blocks with MERLIN 1.0.1 (46). Clusters of LD and haplotypes were resolved with the cluster option.
Single nucleotide polymorphism associations with blood and breath alcohol levels—the pharmacokinetic model
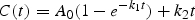
Our approach to data analysis was described in a previous paper on the ADH7 region (12). The SNP association analysis was based on deriving two sets of pharmacokinetic parameters from the observed blood or breath alcohol concentrations at six times (for blood) or 10 times (for breath) after consumption of the 0.75 g/kg dose of alcohol. The relationship between alcohol concentration and time follows Eq. (1):
 |
1 |
|---|
Alcohol levels during the early absorptive phases are estimated by _A_0 (the concentration of alcohol that would be achieved if all ingested alcohol were absorbed and evenly distributed throughout the whole body volume) and _k_1 (the absorption rate constant). Because of substrate saturation, the rate of elimination of _k_2 is independent of ethanol concentration; hence the concentration–time relationship in the elimination phase follows zero-order kinetics. The fit between this kinetic model and the observed data was examined in our previous paper [see Fig. 3 in (12)]; there was a good fit for the blood alcohol data, and although the difference was significant for breath alcohol its magnitude was small.
The three parameters _A_0, _k_1 and _k_2 were estimated from the blood or breath alcohol concentrations C at time t, as main effects and as allelic deviations. The maximum-likelihood estimates of effect sizes at alleles for the 103 SNPs were estimated in the means part of the multivariate normal equation using Mx (47). The model for the expected means (2,12,48) included adjustment for the covariates sex and age. The expected sib pair covariance matrices were modelled jointly with means and were parameterized as additive and specific environmental covariance by Cholesky decomposition taking into account the zygosity of twin pairs. Tests of significance for allelic deviations from the kinetic model were made from the corresponding change in log-likelihood when parameter values were set to zero. The change in log-likelihood follows a _χ_2 distribution and results are presented as −log10(P).
SUPPLEMENTARY MATERIAL
Supplementary Material is available at HMG online.
FUNDING
The National Health and Medical Research Council of Australia, the National Institutes of Health (AA007535, AA007728, AA011998, AA013321, AA013326 and A014041) and the Australian Brewers Foundation.
Supplementary Material
[Supplementary Data]
ACKNOWLEDGEMENTS
We would like to thank the participants in the Alcohol Challenge Twin Study, and all those who helped in carrying it out. We also thank Dr Howard Edenberg for supplying details of the _P_-values for SNP associations with alcohol dependence in the COGA study.
Conflict of Interest statement. None declared.
REFERENCES
- 1.Jones A.W. Interindividual variations in the disposition and metabolism of ethanol in healthy men. Alcohol. 1984;1:385–391. doi: 10.1016/0741-8329(84)90008-9. [DOI] [PubMed] [Google Scholar]
- 2.Martin N.G., Perl J., Oakeshott J.G., Gibson J.B., Starmer G.A., Wilks A.V. A twin study of ethanol metabolism. Behav. Genet. 1985;15:93–109. doi: 10.1007/BF01065891. [DOI] [PubMed] [Google Scholar]
- 3.Kopun M., Propping P. The kinetics of ethanol absorption and elimination in twins and supplementary repetitive experiments in singleton subjects. Eur. J. Clin. Pharmacol. 1977;11:337–344. doi: 10.1007/BF00566530. [DOI] [PubMed] [Google Scholar]
- 4.Jones A.W., Jonsson K.A. Between-subject and within-subject variations in the pharmacokinetics of ethanol. Br. J. Clin. Pharmacol. 1994;37:427–431. doi: 10.1111/j.1365-2125.1994.tb05709.x. [DOI] [PMC free article] [PubMed] [Google Scholar]
- 5.Norberg A., Gabrielsson J., Jones A.W., Hahn R.G. Within- and between-subject variations in pharmacokinetic parameters of ethanol by analysis of breath, venous blood and urine. Br. J. Clin. Pharmacol. 2000;49:399–408. doi: 10.1046/j.1365-2125.2000.00194.x. [DOI] [PMC free article] [PubMed] [Google Scholar]
- 6.Vesell E.S., Page J.G., Passananti G.T. Genetic and environmental factors affecting ethanol metabolism in man. Clin. Pharmacol. Ther. 1971;12:192–201. doi: 10.1002/cpt1971122part1192. [DOI] [PubMed] [Google Scholar]
- 7.Birley A.J., Whitfield J.B., Neale M.C., Duffy D.L., Heath A.C., Boomsma D.I., Martin N.G. Genetic time-series analysis identifies a major QTL for in vivo alcohol metabolism not predicted by in vitro studies of structural protein polymorphism at the ADH1B or ADH1C loci. Behav. Genet. 2005;35:509–524. doi: 10.1007/s10519-005-3851-6. [DOI] [PubMed] [Google Scholar]
- 8.Duester G., Hatfield G.W., Smith M. Molecular genetic analysis of human alcohol dehydrogenase. Alcohol. 1985;2:53–56. doi: 10.1016/0741-8329(85)90015-1. [DOI] [PubMed] [Google Scholar]
- 9.Gonzalez-Duarte R., Albalat R. Merging protein, gene and genomic data: the evolution of the MDR-ADH family. Heredity. 2005;95:184–197. doi: 10.1038/sj.hdy.6800723. [DOI] [PubMed] [Google Scholar]
- 10.Farres J., Moreno A., Crosas B., Peralba J.M., Allali-Hassani A., Hjelmqvist L., Jornvall H., Pares X. Alcohol dehydrogenase of class IV (sigma sigma-ADH) from human stomach. cDNA sequence and structure/function relationships. Eur. J. Biochem. 1994;224:549–557. doi: 10.1111/j.1432-1033.1994.00549.x. [DOI] [PubMed] [Google Scholar]
- 11.Bosron W.F., Li T.K. Genetic polymorphism of human liver alcohol and aldehyde dehydrogenases, and their relationship to alcohol metabolism and alcoholism. Hepatology. 1986;6:502–510. doi: 10.1002/hep.1840060330. [DOI] [PubMed] [Google Scholar]
- 12.Birley A.J., James M.R., Dickson P.A., Montgomery G.W., Heath A.C., Whitfield J.B., Martin N.G. Association of the gastric alcohol dehydrogenase gene ADH7 with variation in alcohol metabolism. Hum. Mol. Genet. 2008;17:179–189. doi: 10.1093/hmg/ddm295. [DOI] [PubMed] [Google Scholar]
- 13.Higuchi S. Polymorphisms of ethanol metabolizing enzyme genes and alcoholism. Alcohol Alcohol Suppl. 1994;30:29–34. [PubMed] [Google Scholar]
- 14.Chen W.J., Loh E.W., Hsu Y.P., Chen C.C., Yu J.M., Cheng A.T. Alcohol-metabolising genes and alcoholism among Taiwanese Han men: independent effect of ADH2, ADH3 and ALDH2. Br. J. Psychiatry. 1996;168:762–767. doi: 10.1192/bjp.168.6.762. [DOI] [PubMed] [Google Scholar]
- 15.Whitfield J.B., Nightingale B.N., Bucholz K.K., Madden P.A., Heath A.C., Martin N.G. ADH genotypes and alcohol use and dependence in Europeans. Alcohol. Clin. Exp. Res. 1998;22:1463–1469. [PubMed] [Google Scholar]
- 16.Osier M., Pakstis A.J., Kidd J.R., Lee J.F., Yin S.J., Ko H.C., Edenberg H.J., Lu R.B., Kidd K.K. Linkage disequilibrium at the ADH2 and ADH3 loci and risk of alcoholism. Am. J. Hum. Genet. 1999;64:1147–1157. doi: 10.1086/302317. [DOI] [PMC free article] [PubMed] [Google Scholar]
- 17.Borras E., Coutelle C., Rosell A., Fernandez-Muixi F., Broch M., Crosas B., Hjelmqvist L., Lorenzo A., Gutierrez C. Genetic polymorphism of alcohol dehydrogenase in europeans: the ADH2*2 allele decreases the risk for alcoholism and is associated with ADH3*1. Hepatology. 2000;31:984–989. doi: 10.1053/he.2000.5978. [DOI] [PubMed] [Google Scholar]
- 18.Ehlers C.L., Carr L., Betancourt M., Montane-Jaime K. Association of the ADH2*3 allele with greater alcohol expectancies in African-American young adults. J. Stud. Alcohol. 2003;64:176–181. doi: 10.15288/jsa.2003.64.176. [DOI] [PubMed] [Google Scholar]
- 19.Ehlers C.L., Montane-Jaime K., Moore S., Shafe S., Joseph R., Carr L.G. Association of the ADHIB*3 allele with alcohol-related phenotypes in Trinidad. Alcohol. Clin. Exp. Res. 2007;31:216–220. doi: 10.1111/j.1530-0277.2006.00298.x. [DOI] [PubMed] [Google Scholar]
- 20.Luo X., Kranzler H.R., Zuo L., Wang S., Schork N.J., Gelernter J. Diplotype trend regression analysis of the ADH gene cluster and the ALDH2 gene: multiple significant associations with alcohol dependence. Am. J. Hum. Genet. 2006;78:973–987. doi: 10.1086/504113. [DOI] [PMC free article] [PubMed] [Google Scholar]
- 21.Choi I.G., Son H.G., Yang B.H., Kim S.H., Lee J.S., Chai Y.G., Son B.K., Kee B.S., Park B.L., Kim L.H., et al. Scanning of genetic effects of alcohol metabolism gene (ADH1B and ADH1C) polymorphisms on the risk of alcoholism. Hum. Mutat. 2005;26:224–234. doi: 10.1002/humu.20209. [DOI] [PubMed] [Google Scholar]
- 22.Edenberg H.J., Xuei X., Chen H.J., Tian H., Wetherill L.F., Dick D.M., Almasy L., Bierut L., Bucholz K.K., Goate A., et al. Association of alcohol dehydrogenase genes with alcohol dependence: a comprehensive analysis. Hum. Mol. Genet. 2006;15:1539–1549. doi: 10.1093/hmg/ddl073. [DOI] [PubMed] [Google Scholar]
- 23.Kuo P.H., Kalsi G., Prescott C.A., Hodgkinson C.A., Goldman D., van den Oord E.J., Alexander J., Jiang C., Sullivan P.F., Patterson D.G., et al. Association of ADH and ALDH genes with alcohol dependence in the Irish Affected Sib Pair Study of alcohol dependence (IASPSAD) sample. Alcohol. Clin. Exp. Res. 2008;32:785–795. doi: 10.1111/j.1530-0277.2008.00642.x. [DOI] [PMC free article] [PubMed] [Google Scholar]
- 24.Macgregor S., Lind P.A., Bucholz K.K., Hansell N.K., Madden P.A.F., Richter M.M., Montgomery G.W., Martin N.G., Heath A.C., Whitfield J.B. Associations of ADH and ALDH2 gene variation with alcohol reactions, consumption and dependence: an integrated analysis. Hum. Mol. Genet. 2009;18:580–593. doi: 10.1093/hmg/ddn372. [DOI] [PMC free article] [PubMed] [Google Scholar]
- 25.Hashibe M., McKay J.D., Curado M.P., Oliveira J.C., Koifman S., Koifman R., Zaridze D., Shangina O., Wunsch-Filho V., Eluf-Neto J., et al. Multiple ADH genes are associated with upper aerodigestive cancers. Nat. Genet. 2008;40:707–709. doi: 10.1038/ng.151. [DOI] [PubMed] [Google Scholar]
- 26.Whitfield J.B. Alcohol dehydrogenase and alcohol dependence: variation in genotype-associated risk between populations. Am. J. Hum. Genet. 2002;71:1247–1250. doi: 10.1086/344287. [DOI] [PMC free article] [PubMed] [Google Scholar]
- 27.Eng M.Y., Luczak S.E., Wall T.L. ALDH2, ADH1B, and ADH1C genotypes in Asians: a literature review. Alcohol Res. Health. 2007;30:22–27. [PMC free article] [PubMed] [Google Scholar]
- 28.Whitfield J.B., Zhu G., Duffy D.L., Birley A.J., Madden P.A., Heath A.C., Martin N.G. Variation in alcohol pharmacokinetics as a risk factor for alcohol dependence. Alcohol. Clin. Exp. Res. 2001;25:1257–1263. [PubMed] [Google Scholar]
- 29.Yamamoto K., Ueno Y., Mizoi Y., Tatsuno Y. Genetic polymorphism of alcohol and aldehyde dehydrogenase and the effects on alcohol metabolism. Arukoru Kenkyuto Yakubutsu Ison. 1993;28:13–25. [PubMed] [Google Scholar]
- 30.Mizoi Y., Yamamoto K., Ueno Y., Fukunaga T., Harada S. Involvement of genetic polymorphism of alcohol and aldehyde dehydrogenases in individual variation of alcohol metabolism. Alcohol Alcohol. 1994;29:707–710. [PubMed] [Google Scholar]
- 31.Thomasson H.R., Beard J.D., Li T.K. ADH2 gene polymorphisms are determinants of alcohol pharmacokinetics. Alcohol. Clin. Exp. Res. 1995;19:1494–1499. doi: 10.1111/j.1530-0277.1995.tb01013.x. [DOI] [PubMed] [Google Scholar]
- 32.Long J.C., Knowler W.C., Hanson R.L., Robin R.W., Urbanek M., Moore E., Bennett P.H., Goldman D. Evidence for genetic linkage to alcohol dependence on chromosomes 4 and 11 from an autosome-wide scan in an American Indian population. Am. J. Med. Genet. 1998;81:216–221. doi: 10.1002/(sici)1096-8628(19980508)81:3<216::aid-ajmg2>3.0.co;2-u. [DOI] [PubMed] [Google Scholar]
- 33.Reich T., Edenberg H.J., Goate A., Williams J.T., Rice J.P., Van Eerdewegh P., Foroud T., Hesselbrock V., Schuckit M.A., Bucholz K., et al. Genome-wide search for genes affecting the risk for alcohol dependence. Am. J. Med. Genet. 1998;81:207–215. [PubMed] [Google Scholar]
- 34.Williams J.T., Begleiter H., Porjesz B., Edenberg H.J., Foroud T., Reich T., Goate A., Van Eerdewegh P., Almasy L., Blangero J. Joint multipoint linkage analysis of multivariate qualitative and quantitative traits. II. Alcoholism and event-related potentials. Am. J. Hum. Genet. 1999;65:1148–1160. doi: 10.1086/302571. [DOI] [PMC free article] [PubMed] [Google Scholar]
- 35.Lorenzo A., Auguet T., Vidal F., Broch M., Olona M., Gutierrez C., Lopez-Dupla M., Sirvent J.J., Quer J.C., Santos M., et al. Polymorphisms of alcohol-metabolizing enzymes and the risk for alcoholism and alcoholic liver disease in Caucasian Spanish women. Drug Alcohol Depend. 2006;84:195–200. doi: 10.1016/j.drugalcdep.2006.03.002. [DOI] [PubMed] [Google Scholar]
- 36.Lee H.C., Lee H.S., Jung S.H., Yi S.Y., Jung H.K., Yoon J.H., Kim C.Y. Association between polymorphisms of ethanol-metabolizing enzymes and susceptibility to alcoholic cirrhosis in a Korean male population. J. Korean Med. Sci. 2001;16:745–750. doi: 10.3346/jkms.2001.16.6.745. [DOI] [PMC free article] [PubMed] [Google Scholar]
- 37.Neumark Y.D., Friedlander Y., Durst R., Leitersdorf E., Jaffe D., Ramchandani V.A., O'Connor S., Carr L.G., Li T.K. Alcohol dehydrogenase polymorphisms influence alcohol-elimination rates in a male Jewish population. Alcohol. Clin. Exp. Res. 2004;28:10–14. doi: 10.1097/01.ALC.0000108667.79219.4D. [DOI] [PubMed] [Google Scholar]
- 38.Edenberg H.J. Regulation of the mammalian alcohol dehydrogenase genes. Prog. Nucleic Acid Res. Mol. Biol. 2000;64:295–341. doi: 10.1016/s0079-6603(00)64008-4. [DOI] [PubMed] [Google Scholar]
- 39.Su J.S., Tsai T.F., Chang H.M., Chao K.M., Su T.S., Tsai S.F. Distant HNF1 site as a master control for the human class I alcohol dehydrogenase gene expression. J. Biol. Chem. 2006;281:19809–19821. doi: 10.1074/jbc.M603638200. [DOI] [PubMed] [Google Scholar]
- 40.Edenberg H.J., Jerome R.E., Li M. Polymorphism of the human alcohol dehydrogenase 4 (ADH4) promoter affects gene expression. Pharmacogenetics. 1999;9:25–30. doi: 10.1097/00008571-199902000-00004. [DOI] [PubMed] [Google Scholar]
- 41.Chen H.J., Tian H., Edenberg H.J. Natural haplotypes in the regulatory sequences affect human alcohol dehydrogenase 1C (ADH1C) gene expression. Hum. Mutat. 2005;25:150–155. doi: 10.1002/humu.20127. [DOI] [PubMed] [Google Scholar]
- 42.Vawter M.P., Atz M.E., Rollins B.L., Cooper-Casey K.M., Shao L., Byerley W.F. Genome scans and gene expression microarrays converge to identify gene regulatory loci relevant in schizophrenia. Hum. Genet. 2006;119:558–570. doi: 10.1007/s00439-006-0172-7. [DOI] [PMC free article] [PubMed] [Google Scholar]
- 43.Dixon A.L., Liang L., Moffatt M.F., Chen W., Heath S., Wong K.C., Taylor J., Burnett E., Gut I., Farrall M., et al. A genome-wide association study of global gene expression. Nat. Genet. 2007;39:1202–1207. doi: 10.1038/ng2109. [DOI] [PubMed] [Google Scholar]
- 44.Schadt E.E., Molony C., Chudin E., Hao K., Yang X., Lum P.Y., Kasarskis A., Zhang B., Wang S., Suver C., et al. Mapping the genetic architecture of gene expression in human liver. PLoS Biol. 2008;6:e107. doi: 10.1371/journal.pbio.0060107. [DOI] [PMC free article] [PubMed] [Google Scholar]
- 45.Wigginton J.E., Abecasis G.R. PEDSTATS: descriptive statistics, graphics and quality assessment for gene mapping data. Bioinformatics. 2005;21:3445–3447. doi: 10.1093/bioinformatics/bti529. [DOI] [PubMed] [Google Scholar]
- 46.Abecasis G.R., Cherny S.S., Cookson W.O., Cardon L.R. Merlin–rapid analysis of dense genetic maps using sparse gene flow trees. Nat. Genet. 2002;30:97–101. doi: 10.1038/ng786. [DOI] [PubMed] [Google Scholar]
- 47.Neale M.C. Mx: Statistical Modeling. 5th edn. Richmond, VA: Department of Psychiatry, Medical College of Virginia; 1999. [Google Scholar]
- 48.Martin E., Moll W., Schmid P., Dettli L. The pharmacokinetics of alcohol in human breath, venous and arterial blood after oral ingestion. Eur. J. Clin. Pharmacol. 1984;26:619–626. doi: 10.1007/BF00543496. [DOI] [PubMed] [Google Scholar]
Associated Data
This section collects any data citations, data availability statements, or supplementary materials included in this article.
Supplementary Materials
[Supplementary Data]