A quantitative model of transcription factor–activated gene expression (original) (raw)
. Author manuscript; available in PMC: 2009 Jun 15.
Published in final edited form as: Nat Struct Mol Biol. 2008 Oct 12;15(11):1192–1198. doi: 10.1038/nsmb.1500
Abstract
A challenge facing biology is to develop quantitative, predictive models of gene regulation. Eukaryotic promoters contain transcription factor binding sites of differing affinity and accessibility, but we understand little about how these variables combine to generate a fine-tuned, quantitative transcriptional response. Here we used the PHO5 promoter in budding yeast to quantify the relationship between transcription factor input and gene expression output, termed the gene-regulation function (GRF). A model that captures variable interactions between transcription factors, nucleosomes and the promoter faithfully reproduced the observed quantitative changes in the GRF that occur upon altering the affinity of transcription factor binding sites, and implicates nucleosome-modulated accessibility of transcription factor binding sites in increasing the diversity of gene expression profiles. This work establishes a quantitative framework that can be applied to predict GRFs of other eukaryotic genes.
In eukaryotic cells, environmental stimuli commonly lead to activation of transcription factors and alteration of gene expression levels1. Many transcription factors control multiple genes, but these genes are often expressed at different time points and levels, thus differing in induction threshold and expression capacity. Because transcription factors bind to specific DNA sequences in the promoter region to help initiate transcription, the variable mode of interaction between transcription factors and the promoter is key to the diversification of gene expression profiles. For example, the interaction between a transcription factor and DNA can be perturbed by either a change in DNA sequence or a change in the accessibility of the DNA by nucleosomes. However, we currently do not understand how such diverse modes of interaction between transcription factors and promoters translate into quantitative gene expression profiles. To explore these issues, we constructed and empirically tested a quantitative model of transcriptional regulation that captures variable interactions between transcription factors and a nucleosomal promoter.
As a model system, we studied expression of PHO5, a Saccharomyces cerevisiae gene that encodes an acid phosphatase and is controlled by the transcription factor Pho4. The PHO5 promoter contains two upstream activation sequences (UASs) recognized by Pho4 and four positioned nucleosomes numbered from −4 through −1 (ref. 2). In conditions of high phosphate concentrations, the low-affinity Pho4 binding site (UASp1) in the nucleosome-free region between nucleosomes −2 and −3 is accessible, whereas the high-affinity binding site (UASp2) is occluded by nucleosome −2 and is inaccessible3,4 (see box in Fig. 1). Under phosphate-starvation conditions, chromatin-modifying and -remodeling complexes are recruited to PHO5 in a Pho4-dependent manner5-7 and trigger the displacement of nucleosomes8,9, a prerequisite for recruitment of the general transcription machinery and transcriptional activation10,11. For repression of PHO5, the TATA binding protein and RNA polymerase II must be displaced, and nucleosomes must be reassembled12.
Figure 1.
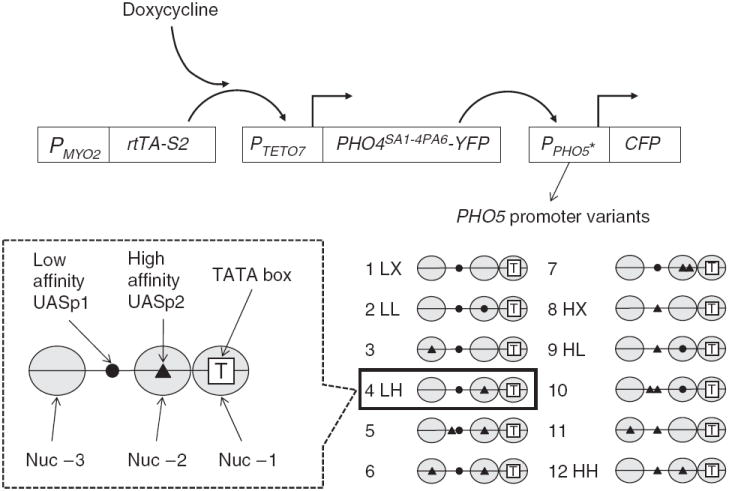
Measuring the GRF from the tetracycline-regulated gene expression system. A variant of a tetracycline-controlled reverse transactivator is constitutively expressed under the control of the MYO2 promoter (PMYO2). When bound to doxycycline, it can activate the TETO7 promoter (PTETO7, containing seven repeats of the tetO operator sequence) and drive the expression of PHO4-YFP, which in turn activates the expression of CFP from a PHO5 promoter variant (PPHO5*). Pho4SA1-4PA6 used in this study is a constitutively nuclear form of Pho4 that has serine-to-alanine substitutions at phosphorylation sites 1, 2, 3 and 4, and a proline-to-alanine substitution at site 6 (ref. 16). Nhp6a, a chromatin protein in the nucleus, was also tagged with RFP to mark the nucleus and to serve as an internal standard for intensity normalization. The chromatin architectures of the PHO5 promoter variants are shown, with nucleosomes (Nuc) −3, −2 and −1 drawn as ellipses. Nucleosome −1 is the closest to the PHO5 open reading frame and occludes the TATA box, which is depicted as a white square with the letter T. Low-affinity (●) and high-affinity (▲) Pho4 binding sites differ by 1 bp out of a 6-bp core sequence (CACGTT versus CACGTG)4. Variant 4 shown inside the box is the wild-type PHO5 promoter, with a low-affinity site (UASp1) in the exposed region between nucleosome −3 and −2, and a high-affinity site (UASp2) under nucleosome −2. Variants 1, 2, 4, 8, 9 and 12 are labeled as LX, LL, LH, HX, HL and HH, respectively, where H, L and X are the high-affinity sites, the low-affinity site and no site, respectively.
We previously observed that the ratio of the expression level of phosphate-responsive genes in intermediate phosphate concentrations to that in the absence of phosphate depends largely on the affinity of the exposed, non-nucleosomal Pho4 binding sites, whereas the absolute expression level in the absence of phosphate depends more on the affinity of nucleosomal sites4. These previous results provided an excellent opportunity to investigate how transcription factor binding and chromatin remodeling combine to produce quantitative regulation of PHO5 expression. In this new study, we separated the transcription factor Pho4 and the PHO5 promoter from the phosphate-responsive signaling pathway and measured gene expression output of the PHO5 promoter as a direct function of Pho4 input—the GRF13-15. We constructed a quantitative model of gene expression that relates the affinity and accessibility of transcription factor binding sites in the promoter to the induction threshold and maximum level of expression in relative units. The model faithfully recapitulated the experimentally observed quantitative changes in the induction threshold and the maximum level of the GRF upon altering the affinity of Pho4 binding sites. We anticipate that the method and model presented is broadly applicable to other examples of eukaryotic transcriptional regulation.
RESULTS
Measuring GRFs of PHO5 promoter variants
To measure the GRF of the PHO5 promoter, we modified the transcription module consisting of the transcription factor Pho4 and the PHO5 promoter so that the input to the GRF could be easily controlled and measured. Measuring the active portion of Pho4 in a live cell, the true input to the PHO5 promoter, is challenging, because localization and the phosphorylation state of Pho4 can be heterogeneous. We solved this problem by directly controlling the expression of a constitutively active, unphosphorylated, nuclear form of Pho4 (refs. 16,17) with the tetracycline (TET)-regulated promoter PTETO7 (ref. 18). We quantified the input and output signals of this transcription module using fluorescent markers: Pho4 was tagged with YFP (yEmCitrine19) and the PHO5 open reading frame (ORF) was replaced with CFP (Cerulean20) (Fig. 1). Growing cells at four different concentrations of doxycycline (an analog of tetracycline) allowed sufficient variation in Pho4 levels to cover a broad range of the GRF from baseline to saturation. We grew cells to steady state at different doxycycline concentrations, pooled them for imaging under a wide-field microscope (Supplementary Fig. 1 online) and then determined the GRF by relating transcription factor input to expression output using the YFP and CFP fluorescence intensities of single cells (Fig. 2 and Supplementary Fig. 2 online). The nuclear level of wild-type Pho4 in phosphate starvation was just enough to saturate the GRF (data not shown). Thus, the native amount of Pho4 seems to be tuned to a level that ensures maximum activation of the PHO5 promoter when the phosphate-responsive signaling pathway is fully activated.
Figure 2.
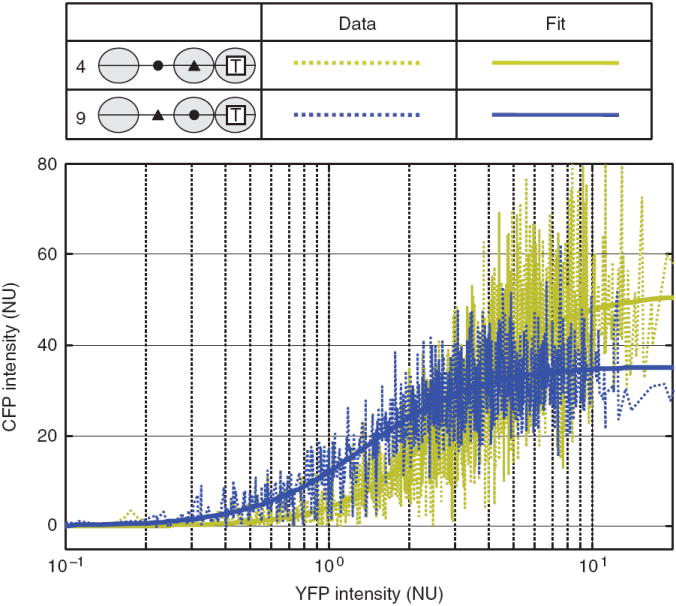
Raw data of fluorescence intensities from single cells and the fits to GRFs. YFP and CFP intensities were obtained from single cells, normalized to RFP intensity and plotted as dashed lines in arbitrary normalized units (NU). As an example, the GRFs of variant 4 and variant 9 are shown in gold and blue, respectively. Variant 4 (LH) is the wild-type strain, and variant 9 (HL) is obtained by swapping UASp1 and UASp2. The Hill curves fit to the data are shown as solid lines in corresponding colors.
To probe the effect of Pho4 binding on the gene expression profile, we used strains that have sequence mutations in the promoter (PHO5 promoter variants) and measured their GRFs. These variants have either altered affinities of the original Pho4 binding sites or have additional Pho4 binding sites in or between the nucleosome −2 or −3 regions4 (Fig. 1). A subset of variants that have a UAS in the non-nucleosomal region and/or a second UAS in the nucleosome −2 region are of a particular interest for later analysis and are symbolized by the affinities of their UASs: LX (variant 1), LL (variant 2), LH (variant 4), HX (variant 8), HL (variant 9) and HH (variant 12), where H, L and X represent high-affinity binding, low-affinity binding and no Pho4 binding site, respectively (Fig. 1). The GRFs of all promoter variants reached a plateau with the doxycycline concentration series chosen.
To characterize the GRFs of the promoter variants, we fitted the GRFs to the Hill equation and extracted the threshold (how readily the gene induces), sensitivity (how sensitive the induction is) and maximum expression level (how much gene expression is achievable)14,18. The measured GRFs of the promoter variants were indeed well described by the Hill equation (for example, Fig. 2) with three fitting parameters: maximum expression level (the plateau value); threshold (Pho4 concentration required to activate expression to half-maximal level); and sensitivity (the Hill coefficient). The maximum expression level differed by as much as five-fold among of the promoter variants, whereas the variation of threshold was less than ~three-fold (Fig. 3a). The sensitivity was greater than 1 (1.95 ± 0.14) but did not vary markedly among the variants. We observed no correlation between the sensitivity and the number of Pho4 binding sites (Supplementary Fig. 3 online). This suggests that the sensitivity does not result from cooperative binding of Pho4 to different sites, but rather from events before Pho4 binding to DNA, such as Pho4 monomer-dimer equilibrium21 (Supplementary Discussion online). The threshold and the maximum expression values could be grouped according to the affinities of the exposed and nucleosomal Pho4 binding sites, respectively (Fig. 3a, dashed lines), in accordance with the previous results of our laboratory4.
Figure 3.
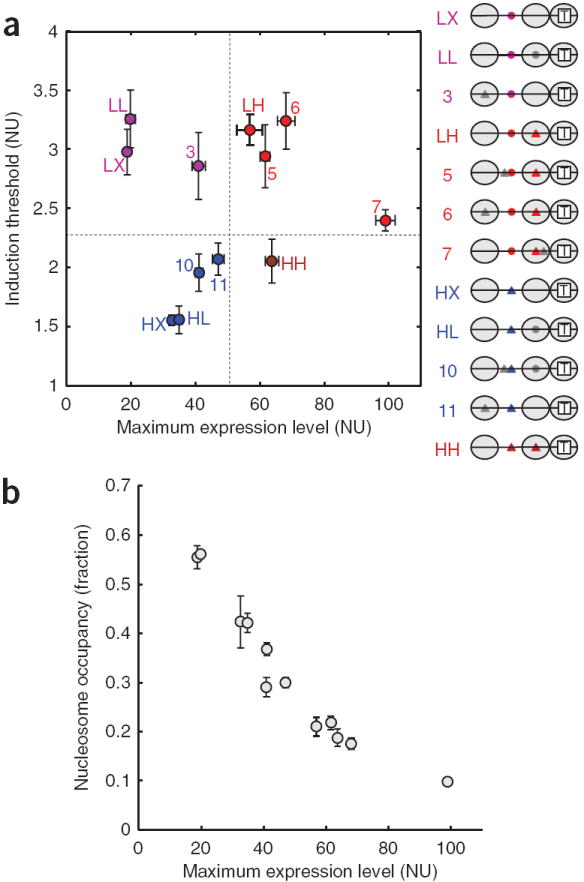
The diversity of GRFs and the relationship between the maximum expression level and the nucleosome occupancy over the TATA box region. (a) The GRF of each strain is represented by its maximum expression level on the x axis and its induction threshold on the y axis (NU, normalized unit). The labeling of the promoter variants is the same as in Figure 1. Error bars are one s.d. from a minimum of five different measurements. The variants are grouped by their similarity to one of the four representative variants—LX, LH, HX and HH, colored purple, red, blue and brown, respectively. The distinct features in the promoter architecture of each group are also highlighted in the corresponding group color. The segregation of variants by the horizontal and vertical dashed lines suggests that the induction threshold is determined by the affinity of the exposed binding site (LX and LH versus HX and HH), whereas the maximum expression level depends strongly on the affinity of the binding site under nucleosome −2 (LX and HX versus LH and HH). (b) The normalized histone H3 occupancy was measured by ChIP and plotted against the maximum expression level for each strain. The error bars are one s.d. of six different points, coming from three independent measurements normalized in two different ways (Methods). The inverse relationship supports the idea that the nucleosome occupancy over the TATA box region limits gene expression.
Nucleosomes over the TATA box region limit gene expression
We observed that the GRFs of the promoter variants reached different maximum expression levels (Fig. 3a). This was surprising, because we expected complete removal of nucleosomes from the promoter in all variants under saturating concentrations of Pho4. Therefore, we asked whether different maximum expression levels corresponded to different levels of nucleosome occupancy. To address this question, we measured the occupancy of histone H3 at nucleosome −1 located over the TATA box region by using chromatin immunoprecipitation (ChIP)8. We observed an inverse correlation between the maximum expression level and the level of nucleosome occupancy at saturating Pho4 concentrations among all 12 variants (Fig. 3b). This result indicates that, even at full activation, the TATA box is accessible for only a fraction of time, determined by the arrangement of the UASs, and this accessibility is likely to be translated into gene expression level. The switching of the TATA box accessibility may correspond to promoter transitions between transcriptionally active and inactive states22. This is supported by the fact that removal of the nucleosome from the TATA box region23 seems to be sufficient for PHO5 promoter activation12. One explanation for this is that Pho4 binds to UASs along with chromatin-remodeling complexes, the nucleosome occupancy over the TATA box is reduced in a time-averaged sense and transcription occurs during times when the TATA box is nucleosome free. Although an additional role for Pho4 in recruitment of the general transcription machinery cannot be ruled out, removal of Pho4 from the UASs does not have a substantial impact on the expression level for a nucleosome-free PHO5 promoter12. Therefore, we take the level of nucleosome clearance from the TATA box region as a proxy for gene expression level.
A quantitative model of gene expression
Our data indicate that a description of PHO5 regulation requires the integration of both nucleosome occupancy (that is, chromatin structure) and Pho4 binding (that is, transcription factor association and disassociation). We therefore built a steady-state model that links all possible combinations of Pho4 and nucleosome occupancy on the promoter; an illustration of a minimal promoter with one UAS in the exposed region and a nucleosome over the TATA box is provided in Figure 4a. The central idea behind the model is that Pho4 binding to an accessible UAS triggers the displacement of adjacent nucleosomes, leading to an accumulation of TATA box–accessible, transcriptionally active states. Such a model scheme allows us to quantitatively relate the concentration of Pho4 to the competency of the promoter for transcription in steady state. For clarity, we define the term ‘rate constant’ denoted by the symbol k as the frequency of the transition between different states, or the reciprocal of the average ‘decay time’ of the initial state. Our model makes the following simplifications: (i) the representation of Pho4 includes factors that may affect Pho4 binding (such as the transcription factor Pho2 (ref. 24)), as well as chromatin-remodeling and -modifying complexes that are recruited to the promoter by Pho4 (refs. 6,24,25); (ii) the Pho4 concentration dependence of the association reaction between Pho4 and DNA is incorporated into kassoc∗, the apparent association rate constant of Pho4 binding to DNA; (iii) the sequence of a Pho4 binding site affects only _k_dissoc, the dissociation rate constant of the Pho4–DNA complex (and not kassoc∗); and (iv) remodeling and displacement of a nucleosome is treated as a single-step process.
Figure 4.
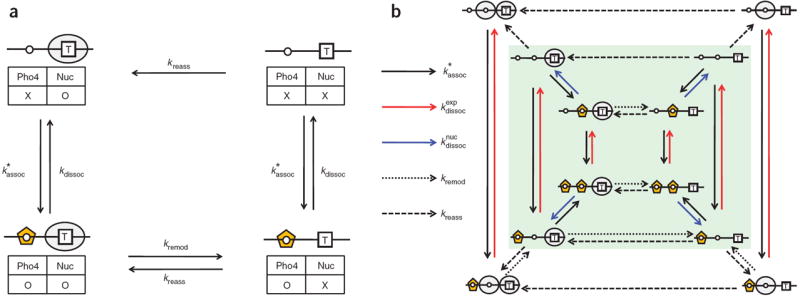
Quantitative models of Pho4-dependent chromatin remodeling. (a) This minimal model describes a promoter composed of one exposed Pho4 binding site and one adjacent nucleosome containing the TATA box. The presence or absence of Pho4 and the nucleosome (Nuc) are marked by O or X in the table, the combination of which defines the four states in this model. The orange pentagon represents Pho4, and all other symbols are as defined in Figure 1. The two states on the right are considered to be transcriptionally active as the general transcription machinery can access the TATA box region. The transitional frequencies of association, dissociation, remodeling and reassembly are described by kassoc∗, _k_dissoc, _k_remod and _k_reass, respectively. (b) This model expands on the minimal model in a to describe the variants LX, LL, LH, HX, HL and HH. The six states on the right comprise the transcriptionally active fraction. The rate constants in this model are for the association of Pho4 to DNA (kassoc∗), dissociation from the exposed (kdissocexp) or nucleosomal region (kdissocnuc), remodeling of nucleosome −2 or −1 (_k_remod) and the reassembly of nucleosome −2 or −1 (_k_reass). The arrow scheme for these rate constants is shown on the left. The entire model with three layers of squares is the model with nucleosome −2, and the model with the inner two layers highlighted in green corresponds to the model without nucleosome −2.
We assumed that kassoc∗ saturates at high concentrations of Pho4 because, otherwise, kassoc∗ would be proportional to the concentration of Pho4, and the fraction of nucleosome-free states would plateau at a value that does not depend on _k_dissoc, contrary to our data (for more details, see Supplementary Discussion). We speculate that kassoc∗ might saturate because it may be limited by the concentrations of cofactors such as Pho2 (ref. 24) or chromatin-remodeling or -modifying complexes6,25, which may influence binding of Pho4 to UASp1. In mathematical form, kassoc∗ is treated as a Hill function of the concentration of Pho4, which inflects at K (the phenomenological midpoint for Pho4 binding) with Hill coefficient n and approaches kmax∗ the maximum value for the association rate constant of Pho4 binding to the UAS): kassoc∗=kmax∗1+(K/[Pho4])n (a brief discussion of this expression is presented in the Supplementary Discussion).
Agreement between gene expression data and the model
We expanded the minimal model to describe a _PHO5_-like promoter with two Pho4 binding sites and two nucleosomes to remodel (Fig. 4b). Here we assumed that nucleosomes are remodeled in sequence from −2 to −1, with an identical remodeling rate constant (_k_remod) for all remodeling steps, and randomly reassembled to their target DNA sequences with an identical reassembly rate constant (_k_reass). This mechanism is in agreement with previously observed spreading of nucleosome displacement from the nucleosome-free region of the PHO5 promoter26. Dissociation rate constants of Pho4 from the exposed and the nucleosomal sites are denoted by kdissocexp and kdissocnuc, respectively. To remove absolute units of time and concentration, and to simplify the fitting procedure, we nondimensionalized the model by using the ratios of all rate constants to kmax∗ and the ratio of Pho4 concentration to K (the midpoint for Pho4 binding) as variables for the model. To simulate the measured GRF with the model, the relationship between the concentration of Pho4 and the fraction of states that have an exposed (for example, non-nucleosomal) TATA box was calculated and fit with the Hill function to extract parameters directly comparable to those that represent the measured GRF (Supplementary Discussion). The values for the expression threshold and maximum depend on the four dimensionless rate constants, k¯dissocexp, k¯dissocnuc, _k̄_remod and _k̄_reass.
We tested the validity of the model by fitting the thresholds and maximum expression levels of LX, LL, LH, HX, HL and HH predicted by the model to the measured values (Supplementary Fig. 4 online). We defined the nondimensional dissociation rate constants from the high-affinity site (H) and the low-affinity site (L) to be _k̄_H and _k̄_L, respectively. k¯dissocexp of variants LX, LL, LH, HX, HL and HH can be either _k̄_H for H or _k̄_L for L, whereas k¯dissocnuc can be _k̄_H for H, _k̄_L for L, or ∞ (infinity) for X. All the variants have the same values of _k̄_remod and _k̄_reass. We performed a fit with four parameters, _k̄_H, _k̄_L, _k̄_remod and _k̄_reass to globally minimize the deviation of six pairs of threshold and maximum expression level between the data and the model prediction (Supplementary Fig. 5 online). The fits show good agreement with the data (Fig. 5a, purple dotted lines), suggesting that despite the simplifications the model successfully captures the in vivo situation. We also considered more complex models in which remodeling rate constants varied as a function of the distance between the UAS and the nucleosome, as well as models with no preferred order of nucleosome remodeling. These models fit the data equally well, which suggests that the detailed mode of chromatin remodeling cannot be pinpointed by our data.
Figure 5.
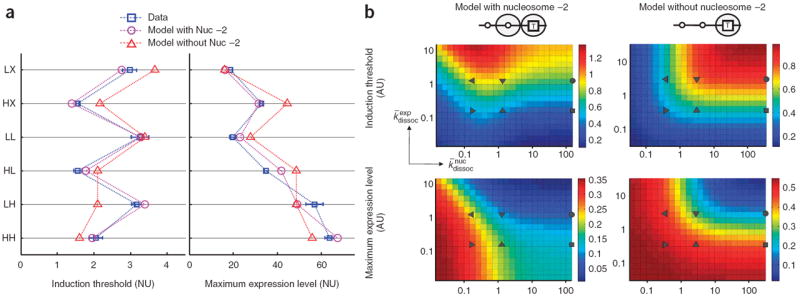
Comparison between the data and the model prediction. (a) We globally fitted six threshold values and six maximum expression levels from variants LX, LL, LH, HX, HL and HH using two different models—those with and without nucleosome −2. The experimental data (blue squares with error bars) are compared to the results from the model with nucleosome −2 (purple circles) and the model without nucleosome −2 (red circles). The promoter variants used are listed on the left axis. (b) Gene expression landscapes from the models with and without nucleosome −2. The maximum expression level and the induction threshold are plotted as a function of k¯dissocnuc (x axis) and k¯dissocexp (y axis) as heat maps. The other parameters were set to the values obtained from the global fit (Supplementary Discussion). The color scale is shown next to each heat map (AU, arbitrary unit). k¯dissocnuc and k¯dissocexp values of the six variants determined by the global fitting are plotted on each heat map: LX (●), LL (▼), LH (◄), HX (■), HL (▲) and HH (►). For these variants, k¯dissocexp can be either _k̄_H or _k̄_L, and k¯dissocnuc can be _k̄_H, _k̄_Lor infinity (∞). _k̄_H and _k̄_L are 0.17 and 1.27, respectively, with nucleosome −2, and 0.34 and 2.76, respectively, without nucleosome −2. For convenience, k¯dissocnuc = infinity is plotted as the maximum k¯dissocnuc value shown in the heat map. Nucleosome −2, by occluding one of the transcription factor binding sites, breaks the anti-correlated change of the maximum expression level and the induction threshold, thus increasing the variety of gene expression profiles.
Nucleosomes diversify gene expression profiles
So why are there transcription factor binding sites occluded by nucleosomes when it is more costly to use them for transcriptional activation than exposed ones? To gain insight into this question, we considered a hypothetical model without nucleosome −2. This model was obtained by removing the states forming the outermost square from the original model (Fig. 4b, highlighted in green). Despite having the same number of fit parameters as the model with nucleosome −2, the model lacking nucleosome −2 fitted the data poorly (Fig. 5a, red lines). This analysis indicated that, if all Pho4 binding sites had been readily accessible, changing their sequences could not have generated the observed variety of GRFs.
To visualize how threshold and maximum values change as a function of the affinities of Pho4 binding sites, we projected them onto a two-dimensional plane of k¯dissocexp and k¯dissocnuc as heat maps, fixing _k̄_remod and _k̄_reass to estimated values from the global fitting (Fig. 5b). The heat maps from the two-nucleosome model (left half) recapitulate qualitative aspects of the measured GRFs (Fig. 3a). The threshold landscape (top left) shows a steeper change along the axis of the exposed site affinity (k¯dissocexp, y axis) than that of the nucleosomal site affinity (k¯dissocnuc, x axis), which indicates that the threshold is determined mainly by the affinity of the exposed site. The maximum landscape (bottom left) shows decay along the diagonal direction, skewed toward the x axis of the nucleosomal site affinity, indicating that, although both sites contribute to the maximum expression level, the nucleosomal site has a greater influence than the exposed site. In the absence of nucleosome −2 (right half), however, the landscapes of threshold and maximum values are strongly anticorrelated, thus limiting the variety of GRFs as a function of UAS affinities. In this case, a more highly inducible promoter (higher maximum) is always a more readily inducible one (lower threshold), and increase or decrease of both the threshold and the maximum expression level (as observed in Fig. 2) is not possible.
DISCUSSION
In summary, we studied how sequence changes in transcription factor binding sites in the promoter give rise to different gene expression profiles. We developed a transcription module to quantify the GRF of the PHO5 promoter and built a steady-state model to explain the dependence of the GRF on Pho4 binding configuration. The model quantitatively recapitulated our observation that the threshold of the PHO5 GRF is primarily influenced by the affinity of the exposed UAS, whereas its maximum expression level is influenced more by the affinity of the nucleosomal UAS. Correct prediction of GRFs required the incorporation of the known chromatin architecture of the PHO5 promoter into the model. We thus provided a rare quantitative description of how transcription factor binding and nucleosome positioning combine to generate diverse gene expression profiles.
Some constraints emerged from the globally fitted single set of parameters, which were robustly reproduced in all models we tested: (i) _k_H and _k_L (the dissociation rate constants of Pho4 dissociating from the high- and low-affinity sites, respectively) differ by a factor of ~10; (ii) _k_H and _k_L have values that are within an order of magnitude of kmax∗ (the maximum association rate constant of Pho4 binding to UAS); (iii) _k_remod and _k_reass (the remodeling and the reassembly rate constants) are of a similar order of magnitude. The first result is consistent with the ten-fold difference in equilibrium dissociation constant between high- and low-affinity sites measured in vitro7,27. The certainty of the second and third results cannot be assessed because of the technical limitations to directly measuring some of the rate constants. Nevertheless, together with the observations that Pho4 binding can be detected during a 10-min time by dimethyl sulfate footprinting from cells grown in high-phosphate concentrations28, and chromatin reassembly at the PHO5 promoter occurs within 20 min after addition of phosphate to phosphate-starved cells12,29, our model suggests that the maximum Pho4 association and chromatin-remodeling rate constants may be on the order of reciprocal minutes. Similarly to the suggested binding kinetics of Pho4, some yeast transcription factors such as Gal4, the heat-shock factor and Ace1 exchange with regulatory sites on a timescale of minutes30-32.
One conclusion from this study is that the maximum association rate constant of Pho4 binding to the UAS (kmax∗) is in a range such that changes in _k_H or _k_L translate into changes in the maximum expression level or the induction threshold. For variants with a single exposed UAS such as LX and HX, we can regard the occupancy of the UAS by Pho4 as the determinant of the gene expression level and analyze how the magnitude of kmax∗ affects the gene expression profile. The Pho4 occupancy reaches half maximum (50%) when kassoc∗ is equal to _k_H or _k_L and approaches 100% when kassoc∗≫kL for both variants. Therefore, if kmax∗≫kL, the fold change in the induction threshold is maximized, whereas the effect on the maximum expression level is negligible. In contrast, if kmax∗≪kH (that is, kassoc∗ saturates well below _k_L and _k_H), the fold change in the induction threshold is negligible, whereas the change in maximum expression level is substantial (Supplementary Discussion). Thus, kmax∗, a property that is likely to be determined by _trans_-elements only, seems to be tuned near _k_H and _k_L so that the maximum expression level and the induction threshold are both sensitive to perturbations in UAS sequences.
The PHO5 promoter has two independently evolvable UASs, one exposed and one nucleosomal, a feature that enables more fine-tuned control of the maximum expression level and the induction threshold by changing UAS sequences. Our analysis shows that, in the absence of a nucleosome occluding one of the two UASs, the maximum expression level and the induction threshold would be anticorrelated (Fig. 5b), thus limiting the degree of variation in the gene expression profile as a result of UAS sequence alteration. Therefore, the nucleosomal context of UASs, a feature missing in prokaryotic promoters, seems to be crucial for evolving quantitatively distinct gene expression profiles. For example, one can decrease the threshold and increase the expression capacity of the PHO5 promoter by swapping UASp1 and UASp2 (Fig. 2). In light of growing efforts to predict expression pattern as a function of the _cis_-regulatory sequence33, our results highlight the importance of considering chromatin architecture at promoters and the kinetics of association and dissociation of _trans_-activators for a more accurate description of transcription factor–driven gene expression. Recently, a mechanism of sliding-mediated nucleosome disassembly was proposed to explain the low variability observed in the number of nucleosomes retained on the PHO5 promoter34. It will be an exciting next step to incorporate the molecular mechanisms of chromatin remodeling35 into our framework.
METHODS
Plasmids and strains
The strains and plasmids used in this study are presented in Supplementary Figure 6 online. First, we constructed a tetracycline-regulated base strain to drive the PHO5 promoter and its variants. This strain has the MYO2 promoter driving rtTA-S2, the TETO7 promoter driving PHO4SA1-4PA6-yEmCitrine, and NHP6A-RFP. The MYO2 promoter was PCR-amplified from genomic DNA, and the rtTA-S2 gene was taken from pUHrT10-1 (ref. 36). These fragments were cloned into the URA3 integration vector pRS306. This plasmid was linearized by StuI digestion and integrated at the URA3 locus. The TETO7 promoter from pCM173 (ref. 37), PHO4 _SA1_-4PA6 and yEmCitrine-SpHIS5 from pKT211 (ref. 19) were cloned into pBluescript II KS+ (Stratagene). The cassette including PTETO7-PHO4SA1-4PA6-yEmCitrine-SpHIS5 was PCR amplified and integrated at the native PHO4 locus by homologous recombination. Nhp6a, a chromatin protein in the nucleus, was tagged with RFP to mark the nucleus and serve as an internal standard for intensity normalization. Next, we used Cerulean20 to replace the PHO5 ORF in the 12 PHO5 promoter variants using a previously published protocol4, mated these PHO5 promoter variant strains to the base strain, generated haploids by random sporulation and selected those with uracil and histidine prototrophy and resistance to nourseothricin (clonNAT, Werner Bioagents) and G418. All strains share the same genetic background (K699 ADE2 trp1-1 can1-100 leu2-3,112 his3-11,15 ura3∷URA3-PMYO2-rtTA(S2) pho4Δ∷PTETO7-PHO4SA1-4PA6-yEmCitrine-SpHIS5 PHO5Δ∷Cerulean-kanR nhp6aΔ∷NHP6A-RFP-natR).
Fluorescence measurements
Yeast strains were grown at 30 °C in synthetic complete medium. For fluorescence-intensity measurements on single cells, cells from a single colony were grown in a 96-well masterblock (Greiner Bio-one) overnight to saturation. A sterile glass bead (~3 mm in diameter) was put into each well of the masterblock in advance; this is necessary to prevent the cells from settling to the bottom and ensuring their optimal growth. Using this method, our collection of 12 strains could be grown in each row of the masterblock and processed in parallel. Overnight cultures were diluted and grown for another 12 h to reach an optical density at 600 nm (OD600) of about 0.2. The culture of each strain was then diluted 500-fold into 1 ml of medium containing doxycycline (44577, Sigma) at 0, 0.1, 0.2 or 0.4 μg ml−1 and grown for another 16 h. At this point, the optical densities of cultures were generally lower than 0.4. To compensate for the doxycycline-dependent differences in growth rate, 0.2, 0.3, 0.4 and 0.5 ml were pooled from the 0, 0.1, 0.2 and 0.4 μg ml−1 cultures, respectively, into a microcentrifuge tube. Cells were concentrated by brief centrifugation in a benchtop centrifuge (Centrifuge 5415D, Eppendorf) and resuspended in ~15 μl medium, of which 2 μl was placed between a microscope slide (3″ × 1″ × 1 mm) and a coverslip (18 mm × 18 mm × #1) (Fisherfinest premium, Fisher Scientific) and imaged immediately. We carried out fluorescence microscopy using a commercial inverted microscope (Axiovert 200M, Zeiss) with cooled charge-coupled device (CCD; Coolsnap HQ, Photometrics), a xenon arc lamp (Lambda DG-4, Sutter instruments), and a motorized stage (Ludl Electronics Products) automated by Metamorph imaging software (Version 6.3r7, Molecular Devices) through the MAC5000 controller (Ludl Electronics Products). We used commercial filter sets optimized for detection of CFP (Filter set 47HE, Carl Zeiss), eYFP (Filter set 46HE) and DsRed (Filter set 43HE) and acquired images in three different channels. For additional details, see Supplementary Methods online.
Data analysis
We used Matlab (R2007a, The MathWorks) to analyze and process single-cell data. The RFP channel was used to pick cells that were in focus, well separated and not dividing. The RFP intensity was also used as a normalization standard to correct for temporal or spatial variation in illumination intensity. The nuclear boundary selected from the RFP channel was allowed to move up to 2 pixels in all directions to maximize the mean YFP and CFP intensities within the boundary, as it was observed to drift as many as 2 pixels between successive images. YFP and RFP background values were estimated from the cytoplasmic region of cells grown in the absence of doxycycline. The mean background values for CFP were obtained from the five lowest-intensity cells in each measurement and were nearly identical to CFP intensities measured from Pho4-deletion strains. Background subtracted values of YFP and CFP were divided by background subtracted values of RFP (Supplementary Data online), and these numbers were reported in the main figures. For additional details, see the Supplementary Methods.
Chromatin immunoprecipitation (ChIP)
Strains were grown in 15 ml medium containing 0.5 μg ml−1 doxycycline to logarithmic growth phase. At this doxycycline concentration, CFP expression reaches its maximum level. At OD600 of 0.3, they were cross-linked in 1% (v/v) formaldehyde for 15 min at room temperature (22 °C). Cells were then harvested and homogenized by subjecting them to a 2-min bead beating (mini beadbeater-8, BioSpec Products) and a 2-min pause, repeated four times. Chromatin was sheared by sonication (sonicator 3000, Misonix) at 20% power for 30 s three times. Lysate (100 μl from 1 ml lysate) was set aside as a normalization control (input DNA). The remaining 90 μl was incubated with 1.25 μg of antibody raised against the C terminus of human histone H3 (ab1791, Abcam) and 17 μl of protein A Sepharose bead slurry (Protein A Sepharose Fast Flow, GE Healthcare) for 90 min at room temperature. Immunoprecipated material was eluted, and cross-links reversed by incubating in de–cross-linking buffer at 65 °C4. We used the Qiagen PCR purification kit to recover immunoprecipitated DNA (IP DNA). The amount of IP DNA was quantitatively measured by quantitative PCR (qPCR; MX3000p, Strategene) using SYBR Green I (Sigma-Aldrich) and three primer pairs that target the TATA box region (5′-GGGTAAACATCTTTGAATTGTCGAA; 5′-AAGCCATACTAACCTCGACTTAGCA-3′), the adjacent ORF upstream of PHO5 (5′-GATCAAACGGTTCATTAGACAATAGGT-3′; 5′-TGAGTGGATATTAATCGATGGAACTC-3′) and the heterochromatic locus REC104 (5′-CCTTTAGCTAATAGAGTAAGCCACA-3′; 5′-TTTAACACTACTG GTTTATGAAAGAAA-3′). The last two primers target a constitutively nucleosomal region that is regulated independently of Pho4 and serve as a proper normalization standard. In each qPCR run, we first calibrated the amount of IP DNA of these three targets using a standard curve generated with the nucleosome-free input DNA of the wild-type strain. We then normalized the amount of IP DNA of the TATA box region against the other two regions and obtained two independent nucleosome-occupancy values. We separately confirmed that, in the absence of doxycycline, the TATA box nucleosome occupancy is approximately 100% and does not vary among strains tested.
Supplementary Material
supplements
Acknowledgments
We are especially grateful to F. Lam, Whitehead Institute, Cambridge, for the series of PHO5 promoter variant strains and protocols for ChIP and qPCR, and B. Margolin, University of California at San Francisco, for assistance with basic yeast techniques and helpful discussions. We thank members of the O’Shea laboratory, the Xie laboratory and the Bauer center as well as anonymous reviewers for advice and comments on the manuscript. We also thank A. van Oudenaarden, Massachusetts Institute of Technology, Cambridge, for the gift of the TETO7 plasmid. H.D.K. is supported by a CASI award from the Burroughs Wellcome Fund. E.K.O. acknowledges support from the US National Institutes of Health grant GM51377 and the Howard Hughes Medical Institute.
Footnotes
Note: Supplementary information is available on the Nature Structural & Molecular Biology website.
AUTHOR CONTRIBUTIONS H.D.K. and E.K.O. designed the research; H.D.K. performed the experiments; H.D.K. analyzed the data; H.D.K. and E.K.O. wrote the paper.
References
- 1.Cyert MS. Regulation of nuclear localization during signaling. J Biol Chem. 2001;276:20805–20808. doi: 10.1074/jbc.R100012200. [DOI] [PubMed] [Google Scholar]
- 2.Vogel K, Horz W, Hinnen A. The two positively acting regulatory proteins PHO2 and PHO4 physically interact with PHO5 upstream activation regions. Mol Cell Biol. 1989;9:2050–2057. doi: 10.1128/mcb.9.5.2050. [DOI] [PMC free article] [PubMed] [Google Scholar]
- 3.Venter U, Svaren J, Schmitz J, Schmid A, Horz W. A nucleosome precludes binding of the transcription factor Pho4 in vivo to a critical target site in the PHO5 promoter. EMBO J. 1994;13:4848–4855. doi: 10.1002/j.1460-2075.1994.tb06811.x. [DOI] [PMC free article] [PubMed] [Google Scholar]
- 4.Lam FH, Steger DJ, O’Shea EK. Chromatin decouples promoter threshold from dynamic range. Nature. 2008;453:246–250. doi: 10.1038/nature06867.. [DOI] [PMC free article] [PubMed] [Google Scholar]
- 5.Barbaric S, Reinke H, Horz W. Multiple mechanistically distinct functions of SAGA at the PHO5 promoter. Mol Cell Biol. 2003;23:3468–3476. doi: 10.1128/MCB.23.10.3468-3476.2003. [DOI] [PMC free article] [PubMed] [Google Scholar]
- 6.Steger DJ, Haswell ES, Miller AL, Wente SR, O’Shea EK. Regulation of chromatin remodeling by inositol polyphosphates. Science. 2003;299:114–116. doi: 10.1126/science.1078062. [DOI] [PMC free article] [PubMed] [Google Scholar]
- 7.Dhasarathy A, Kladde MP. Promoter occupancy is a major determinant of chromatin remodeling enzyme requirements. Mol Cell Biol. 2005;25:2698–2707. doi: 10.1128/MCB.25.7.2698-2707.2005. [DOI] [PMC free article] [PubMed] [Google Scholar]
- 8.Reinke H, Horz W. Histories are first hyperacetylated and then lose contact with the activated PHO5 promoter. Mol Cell. 2003;11:1599–1607. doi: 10.1016/s1097-2765(03)00186-2. [DOI] [PubMed] [Google Scholar]
- 9.Boeger H, Griesenbeck J, Strattan JS, Kornberg RD. Nucleosomes unfold completely at a transcriptionally active promoter. Mol Cell. 2003;11:1587–1598. doi: 10.1016/s1097-2765(03)00231-4. [DOI] [PubMed] [Google Scholar]
- 10.Adkins MW, Howar SR, Tyler JK. Chromatin disassembly mediated by the histone chaperone Asf1 is essential for transcriptional activation of the yeast PHO5 and PHO8 genes. Mol Cell. 2004;14:657–666. doi: 10.1016/j.molcel.2004.05.016. [DOI] [PubMed] [Google Scholar]
- 11.Adkins MW, Williams SK, Linger J, Tyler JK. Chromatin disassembly from the PHO5 promoter is essential for the recruitment of the general transcription machinery and coactivators. Mol Cell Biol. 2007;27:6372–6382. doi: 10.1128/MCB.00981-07. [DOI] [PMC free article] [PubMed] [Google Scholar]
- 12.Adkins MW, Tyler JK. Transcriptional activators are dispensable for transcription in the absence of Spt6-mediated chromatin reassembly of promoter regions. Mol Cell. 2006;21:405–416. doi: 10.1016/j.molcel.2005.12.010. [DOI] [PubMed] [Google Scholar]
- 13.Bintu L, et al. Transcriptional regulation by the numbers: applications. Curr Opin Genet Dev. 2005;15:125–135. doi: 10.1016/j.gde.2005.02.006. [DOI] [PMC free article] [PubMed] [Google Scholar]
- 14.Rosenfeld N, Young JW, Alon U, Swain PS, Elowitz MB. Gene regulation at the single-cell level. Science. 2005;307:1962–1965. doi: 10.1126/science.1106914. [DOI] [PubMed] [Google Scholar]
- 15.Kalisky T, Dekel E, Alon U. Cost-benefit theory and optimal design of gene regulation functions. Phys Biol. 2007;4:229–245. doi: 10.1088/1478-3975/4/4/001. [DOI] [PubMed] [Google Scholar]
- 16.Komeili A, O’Shea EK. Roles of phosphorylation sites in regulating activity of the transcription factor Pho4. Science. 1999;284:977–980. doi: 10.1126/science.284.5416.977. [DOI] [PubMed] [Google Scholar]
- 17.Springer M, Wykoff DD, Miller N, O’Shea EK. Partially phosphorylated Pho4 activates transcription of a subset of phosphate-responsive genes. PLoS Biol. 2003;1:e8. doi: 10.1371/journal.pbio.0000028. [DOI] [PMC free article] [PubMed] [Google Scholar]
- 18.Becskei A, Kaufmann BB, van Oudenaarden A. Contributions of low molecule number and chromosomal positioning to stochastic gene expression. Nat Genet. 2005;37:937–944. doi: 10.1038/ng1616. [DOI] [PubMed] [Google Scholar]
- 19.Sheff MA, Thorn KS. Optimized cassettes for fluorescent protein tagging in Saccharomyces cerevisiae. Yeast. 2004;21:661–670. doi: 10.1002/yea.1130. [DOI] [PubMed] [Google Scholar]
- 20.Rizzo MA, Springer GH, Granada B, Piston DW. An improved cyan fluorescent protein variant useful for FRET. Nat Biotechnol. 2004;22:445–449. doi: 10.1038/nbt945. [DOI] [PubMed] [Google Scholar]
- 21.Shimizu T, et al. Crystal structure of PHO4 bHLH domain-DNA complex: flanking base recognition. EMBO J. 1997;16:4689–4697. doi: 10.1093/emboj/16.15.4689. [DOI] [PMC free article] [PubMed] [Google Scholar]
- 22.Raser JM, O’Shea EK. Control of stochasticity in eukaryotic gene expression. Science. 2004;304:1811–1814. doi: 10.1126/science.1098641. [DOI] [PMC free article] [PubMed] [Google Scholar]
- 23.Zhang H, Reese JC. Exposing the core promoter is sufficient to activate transcription and alter coactivator requirement at RNR3. Proc Natl Acad Sci USA. 2007;104:8833–8838. doi: 10.1073/pnas.0701666104. [DOI] [PMC free article] [PubMed] [Google Scholar]
- 24.Barbaric S, Munsterkotter M, Goding C, Horz W. Cooperative Pho2-Pho4 interactions at the PHO5 promoter are critical for binding of Pho4 to UASp1 and for efficient transactivation by Pho4 at UASp2. Mol Cell Biol. 1998;18:2629–2639. doi: 10.1128/mcb.18.5.2629. [DOI] [PMC free article] [PubMed] [Google Scholar]
- 25.Nourani A, Utley RT, Allard S, Cote J. Recruitment of the NuA4 complex poises the PHO5 promoter for chromatin remodeling and activation. EMBO J. 2004;23:2597–2607. doi: 10.1038/sj.emboj.7600230. [DOI] [PMC free article] [PubMed] [Google Scholar]
- 26.Jessen WJ, Hoose SA, Kilgore JA, Kladde MP. Active PHO5 chromatin encompasses variable numbers of nucleosomes at individual promoters. Nat Struct Mol Biol. 2006;13:256–263. doi: 10.1038/nsmb1062. [DOI] [PubMed] [Google Scholar]
- 27.Maerkl SJ, Quake SR. A systems approach to measuring the binding energy landscapes of transcription factors. Science. 2007;315:233–237. doi: 10.1126/science.1131007. [DOI] [PubMed] [Google Scholar]
- 28.Gregory PD, Barbaric S, Horz W. Analyzing chromatin structure and transcription factor binding in yeast. Methods. 1998;15:295–302. doi: 10.1006/meth.1998.0633. [DOI] [PubMed] [Google Scholar]
- 29.Schmid A, Fascher KD, Horz W. Nucleosome disruption at the yeast PHO5 promoter upon PHO5 induction occurs in the absence of DNA replication. Cell. 1992;71:853–864. doi: 10.1016/0092-8674(92)90560-y. [DOI] [PubMed] [Google Scholar]
- 30.Nalley K, Johnston SA, Kodadek T. Proteolytic turnover of the Gal4 transcription factor is not required for function in vivo. Nature. 2006;442:1054–1057. doi: 10.1038/nature05067. [DOI] [PubMed] [Google Scholar]
- 31.Yao J, Munson KM, Webb WW, Lis JT. Dynamics of heat shock factor association with native gene loci in living cells. Nature. 2006;442:1050–1053. doi: 10.1038/nature05025. [DOI] [PubMed] [Google Scholar]
- 32.Karpova TS, et al. Concurrent fast and slow cycling of a transcriptional activator at an endogenous promoter. Science. 2008;319:466–469. doi: 10.1126/science.1150559. [DOI] [PubMed] [Google Scholar]
- 33.Segal E, Raveh-Sadka T, Schroeder M, Unnerstall U, Gaul U. Predicting expression patterns from regulatory sequence in Drosophila segmentation. Nature. 2008;451:535–540. doi: 10.1038/nature06496. [DOI] [PubMed] [Google Scholar]
- 34.Boeger H, Griesenbeck J, Kornberg RD. Nucleosome retention and the stochastic nature of promoter chromatin remodeling for transcription. Cell. 2008;133:716–726. doi: 10.1016/j.cell.2008.02.051. [DOI] [PMC free article] [PubMed] [Google Scholar]
- 35.Cairns BR. Chromatin remodeling: insights and intrigue from single-molecule studies. Nat Struct Mol Biol. 2007;14:989–996. doi: 10.1038/nsmb1333. [DOI] [PMC free article] [PubMed] [Google Scholar]
- 36.Urlinger S, et al. Exploring the sequence space for tetracycline-dependent transcriptional activators: novel mutations yield expanded range and sensitivity. Proc Natl Acad Sci USA. 2000;97:7963–7968. doi: 10.1073/pnas.130192197. [DOI] [PMC free article] [PubMed] [Google Scholar]
- 37.Gari E, Piedrafita L, Aldea M, Herrero E. A set of vectors with a tetracycline-regulatable promoter system for modulated gene expression in Saccharomyces cerevisiae. Yeast. 1997;13:837–848. doi: 10.1002/(SICI)1097-0061(199707)13:9<837::AID-YEA145>3.0.CO;2-T. [DOI] [PubMed] [Google Scholar]
Associated Data
This section collects any data citations, data availability statements, or supplementary materials included in this article.
Supplementary Materials
supplements