Virus-specific T cells engineered to coexpress tumor-specific receptors: persistence and antitumor activity in individuals with neuroblastoma (original) (raw)
. Author manuscript; available in PMC: 2009 Sep 23.
Published in final edited form as: Nat Med. 2008 Nov 2;14(11):1264–1270. doi: 10.1038/nm.1882
Abstract
Cytotoxic T lymphocytes (CTLs) directed to nonviral tumor–associated antigens do not survive long term and have limited antitumor activity in vivo, in part because such tumor cells typically lack the appropriate costimulatory molecules. We therefore engineered Epstein-Barr virus (EBV)-specific CTLs to express a chimeric antigen receptor directed to the diasialoganglioside GD2, a nonviral tumor–associated antigen expressed by human neuroblastoma cells. We reasoned that these genetically engineered lymphocytes would receive optimal costimulation after engagement of their native receptors, enhancing survival and antitumor activity mediated through their chimeric receptors. Here we show in individuals with neuroblastoma that EBV-specific CTLs expressing a chimeric GD2-specific receptor indeed survive longer than T cells activated by the CD3-specific antibody OKT3 and expressing the same chimeric receptor but lacking virus specificity. Infusion of these genetically modified cells seemed safe and was associated with tumor regression or necrosis in half of the subjects tested. Hence, virus-specific CTLs can be modified to function as tumor-directed effector cells.
The promise of tumor antigen–specific T lymphocytes for the treatment of melanoma and EBV-associated malignancies1–7 has led to efforts to retarget effector T cells and thereby extend the range of tumors that they can treat. A common strategy has been to introduce a synthetic receptor with an antigen-binding domain from an antibody coupled to a signal-transducing endodomain derived from the native T cell receptor into activated T cells (ATCs)8. These chimeric antigen receptors (CARs) thus have the specificity of an antibody coupled to the cytotoxic effector mechanisms of the T cell. To date, however, this strategy has had only limited success, owing in part to the lack of essential costimulatory signals to the T cell during engagement of its CAR and perhaps also to the introduction of the CAR into regulatory T (Treg) cells, as well as into conventional T effector cells9. Consequently, even when the infusion of large numbers of CAR-bearing T cells is supplemented with exogenous growth factors, such as interleukin-2 (IL-2), survival in vivo is poor and antitumor activity minimal10,11. By contrast, small numbers of CTLs with native receptor specificity directed to persistent human viruses such as EBV can survive long term after infusion and eradicate even bulky EBV-associated malignancies, such as Hodgkin’s disease and nasopharyngeal cancer2,12–14. A contributing factor to the superior survival and function of EBV-specific CTLs is that engagement of their native receptors by EBV-infected B cells produces extensive co-stimulation during their preparation ex vivo and by encounters with (latent) viral antigens on antigen-presenting cells in vivo15.
This knowledge has given rise to the concept of engineering antigen-specific CTLs to provide them with a second specificity for tumor antigens16–18. However, many tumors generate their own immunosuppressive environment19,20, and it is unknown whether the desirable functional characteristics of CTLs would be retained in individuals with cancer once these cells co-express a CAR that retargets them to a tumor-associated antigen. We therefore administered EBV-specific CTLs expressing such a CAR to individuals with neuroblastoma to determine whether the survival times of these CAR-CTLs are indeed longer than those of ATCs expressing the same tumor-directed CAR. We made this comparison in the same individuals by expressing functionally identical but molecularly distinguishable tumor-specific CARs in the two discrete T cell populations. Thus, each subject acted as a ‘self control’, avoiding the confounding variables otherwise inherent in a comparison of CTL versus ATC behavior in a heterogeneous group of humans with cancer. Here we show the superior persistence and retained cytotoxicity of CAR-CTLs compared to CAR-ATCs, as well as measurable tumor responses after infusion of these genetically engineered cells into subjects with neuroblastoma. With additional refinements and further clinical testing, infusion of CAR-CTLs may provide a general approach to the cell therapy of cancer.
RESULTS
Modification, phenotype and ex vivo activity of CTLs and ATCs
Both CTLs and ATCs were transduced with a CAR directed to the GD2 antigen, which is present on the tumor cells of most individuals with neuroblastoma, a pediatric malignancy derived from neural crest cells21. The GD2-specific CAR vectors were made from the same 14G2a antibody16, but each incorporated a distinguishable noncoding 3′ oligonucleotide. Through PCR analysis, these distinct signals allowed us to determine the proportion of GD2 signal coming from each vector source (Supplementary Fig. 1 and Supplementary Methods online). These distinguishable CARs were introduced into autologous ATCs and EBV-specific CTLs from each individual. We rotated the transducing vector between ATCs and CTLs in consecutive subjects to ensure that apparent differences in persistence and function between the transduced cells would not be due to differences in vector transduction efficiency or function. Eleven individuals with neuroblastoma who had EBV-specific IgGs (indicating persistent virus infection) received a single injection of an equal number of CAR-CTLs and CAR-ATCs, for a total dose of 2 × 10⁷ to 2 × 10⁸ cells (Table 1).
Table 1.
Subject characteristics
| Subject number | Age, sex | Disease stagea and status at treatment | Sites of evaluable tumorb | Dose of each cell productc (cells per m2) | Response at 6 weeks after treatment |
|---|---|---|---|---|---|
| 1 | 10, M | 4 (_MYCN_−); relapsed (bulk) | Bone marrow, bone, pleura | 2 × 10⁷ | PD |
| 2 | 11, M | 4 (_MYCN_−); refractory (bulk) | Liver, bone, diaphragm, lung | 2 × 10⁷ | PD |
| 3 | 4, F | 4 (_MYCN_−); refractory (bulk) | Extradural/calvarial mass | 2 × 10⁷ | PR by MIBG scan; CR by 16 weeks |
| 4 | 10, F | 4 (MYCN+); relapsed (NED) | NED | 1 × 10⁸ | NED |
| 5 | 9, F | 4 (MYCN+); relapsed (bulk) | Bone, brain, dura | 1 × 10⁸ | SD |
| 6 | 15, F | 4; relapsed (bone marrow) | Bone marrow | 1 × 10⁸ | NED (marrow clear) |
| 7 | 3, M | 4 (MYCN+); refractory (bulk) | Abdominal mass, bone, bone marrow, lung | 1 × 10⁸ | SD |
| 8 | 5, F | 3 (MYCN+); relapsed (bulk) | Left scapular lesion | 1 × 10⁸ | Tumor necrosis |
| 9 | 6, F | 4 (MYCN+); relapsed (NED) | NED | 1 × 10⁸ | NED |
| 10 | 6, F | 4 (MYCN+); relapsed (bulk) | Liver | 2 × 10⁸ | Tumor necrosis |
| 11 | 7, M | 4 (_MYCN_−); relapsed (NED) | NED | 2 × 10⁸ | NED |
Before infusing the modified T cells, we characterized their phenotype and ex vivo function. The transduction efficiency for both cell types was consistently above 35% (Fig. 1a,b), with a good correlation between the percentages of positive cells found by PCR and by immunofluorescence, with the mean (± s.d.) efficiency for ATCs exceeding that for CTLs (P = 0.02 for each comparison). CAR-ATCs and CAR-CTLs both consisted of a polyclonal mixture of CD4+ and CD8+ T cells with few CD56+ natural killer (NK) cells present, but the ratio of CD4+ to CD8+ cells was consistently higher in the CTL population than in the ATC population (P = 0.05) and covered a wider range of values (Fig. 2a). At the time of freezing, 2.2–4.4% of cells in the ATC population had a central memory (CD45RO+CCR7+CD62L+) phenotype, whereas 42–76% had an effector memory phenotype (CD45RO+CCR7−CD62L−; Fig. 2b). Between 23% and 44% were CD45RO− and CD45RA+ (Fig. 2b), showing the expected mixture of naive and memory T cells22. CAR-CTLs at freezing were uniformly CD45RO+ and CD45RA− and uniformly CCR7− and CD62L−, so their phenotype was consistent with the presence of effector memory cells (Fig. 2b). CXCR4, (the receptor for SDF1, a chemokine associated with marrow homing) was more highly expressed on ATCs (P = 0.02) than on CTLs, but all other chemokine receptors and adhesion molecules tested were comparably expressed by the two populations (Fig. 2c), suggesting that the ATCs and CTLs would have similar trafficking properties in vivo.
Figure 1.

Transduction of CTLs and ATCs with GD2-specific CARs. (a) Transduction efficiency of subject-derived CTLs and ATCs by the GD2 vectors, as evaluated by quantitative PCR (qPCR, left) and FACS (right). Each symbol represents 1 of the 11 individual subjects, and the horizontal lines indicate the mean group value. Surface expression by FACS and qPCR amplification are described in Methods. (b) FACS analyses of receptor expression shown in more detail for subject 5. Percentages represent the proportion of transduced cells.
Figure 2.

Immunophenotypes of CAR-transduced CTLs and ATCs. (a) Phenotypic composition of CTL and ATC population after transduction with the GD2-specific CARs. Percentages of CD4+ and CD8+ T cells, natural killer cells (CD3−CD56+) and T cells expressing TCR-γδ are shown. Each symbol represents a transduced cell line infused into a single subject. A significant difference between CTLs and ATCs was observed only for the percentage of CD8+ cells (P = 0.05). (b) Expression of naive, central memory and effector memory surface markers on GD2-specific CAR-CTLs and CAR-ATCs. The data are means ± s.d. (c) Expression of chemokine receptors and adhesion molecules on GD2-specific CAR-CTLs and CAR-ATCs. The data are means ± s.d. (d) Results of standard 51Cr release assay at an effector:tumor cell (E:T) ratio of 20:1. Data represent the mean ± s.d. percentage of specific chromium released from the CAR-CTLs and CAR-ATCs generated from each of the 11 subjects. Targets were autologous LCLs, allogeneic LCLs, autologous PHA blasts and LAN-1 cells.
To ensure that the transduced CTLs retained their EBV specificity (mediated through their native receptor) and that both CAR-CTLs and CAR-ATCs gained specificity against GD2+ neuroblasts, we measured cytotoxic effector function against EBV+ B cells and GD2+ neuroblastoma cells. The transduced CTLs killed autologous but not allogeneic EBV+ B cells (lymphoblastoid cell lines, LCLs), whereas the transduced ATCs failed to kill either of these targets (Fig. 2d). Conversely, an allogeneic GD2+ neuroblast line (LAN-1), which expresses few major histocompatibility complex (MHC) class I molecules, was effectively killed by both CAR-CTLs and CAR-ATCs (Fig. 2d). As expected, therefore, CAR-CTLs recognize and kill EBV+ target cells through their native receptor (in an MHC-restricted manner), whereas both CAR-CTLs and CAR-ATCs kill GD2+ neuroblasts through their MHC-unrestricted chimeric receptor.
In vivo persistence of modified CTLs and ATCs
We anticipated that the CAR-CTLs would persist at an initially higher level than the CAR-ATCs because of the additional co-stimulation they received ex vivo from the EBV antigens expressed by autologous lymphoblastoid cell lines23 and subsequently persist longer because they had the advantage of activation through their native receptors by endogenous antigen and concomitant co-stimulation from EBV-infected B cells24. Thus, in each subject, we measured the PCR signal from the vector associated with CAR-CTLs and from the vector associated with CAR-ATCs. As expected, within 24 h of infusion, the PCR signal from the CAR-CTLs consistently reached higher levels than that from the CAR-ATCs and was detectable beyond 6 weeks, compared to only 3 weeks for the modified ATCs (Fig. 3). These higher initial and subsequent CAR-CTL numbers in the circulation seem to be the consequence of in vitro and then in vivo native antigen receptor engagement rather than the result of any intrinsic differences in antigen-independent survival between CAR-ATCs and CAR-CTLs (Supplementary Table 1, Supplementary Figs. 2 and 3, and Supplementary Results online). Overall, the mean ± s.e.m. area under the curve (positive cells × duration of signal) was more than tenfold higher for CAR-CTLs than for CAR-ATCs (0.189 ± 0.082 vs. 0.014 ± 0.004, P = 0.05; Fig. 3).
Figure 3.
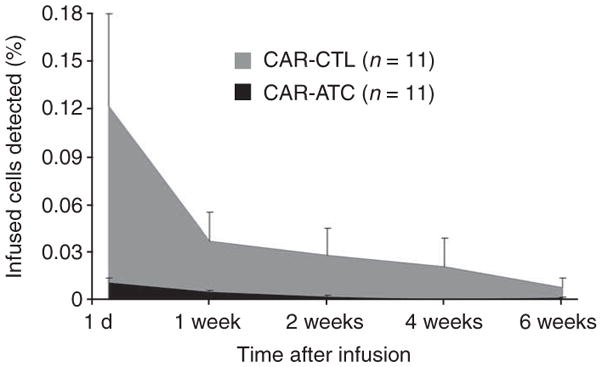
In vivo persistence of infused CAR-CTLs versus CAR-ATCs in peripheral blood as determined by real-time quantitative PCR. A comparison of mean ± s.e.m. areas under the curve of the qPCR signal for ATCs and CTLs detected in PBMCs of treated subjects at the indicated times after infusion is shown. Five of the subjects (7 –11) received monoclonal antibodies to the common leukocyte antigen (CD45)25 at 2–3 d before ATC and CTL infusion and had 44–91% depletion of endogenous circulating lymphocytes25. There were no measurable differences between the areas under the curve for either ATCs or CTLs between subjects 1–6 (no CD45) and 7–11 (CD45-treated).
It is unlikely that the number of effector cells infused had a substantial impact on the outcome of the experiments. Indeed, as we have previously observed21, the percentages of gene-modified ATCs and CTLs in peripheral blood do not change if larger numbers of cells are infused15. Nor were these percentages increased in the present study after partial lymphodepletion mediated by monoclonal antibodies to CD45 (ref. 25) (Supplementary Results). It is also possible that the observed differences in the numbers and persistence of CAR-ATCs versus CAR-CTLs in peripheral blood resulted from increased trafficking to marrow by CAR-ATCs, which typically express the CXCR4 receptor, or by immediate trafficking to tumor sites. However, less than half of the ATC population (mean 43.8%) expressed CXCR4 (Fig. 2c), and marrow aspirates and tumor biopsies lacked evidence of increased CAR-ATC infiltration (data not shown).
CAR-CTLs show sustained proliferation and cytotoxicity in vivo
CAR-expressing CTLs and ATCs introduced into individuals with advanced cancer can become anergic20. This functional loss has multiple causes, including increased numbers and activity of Treg cells and secretion of inhibitory cytokines such as transforming growth factor-β by the tumor itself19,26. We therefore asked whether the CAR-CTLs in peripheral blood at 4–24 weeks after infusion had become unresponsive. After culturing peripheral blood mononuclear cells (PBMCs) from six individuals with their autologous EBV-expressing B cells, we measured the intensity of the CAR-derived signal by PCR amplification (Fig. 4). Even after 24 weeks in the treated subjects, the CAR-CTLs consistently expanded in response to native receptor stimulation by EBV+ target cells (Fig. 4b, Supplementary Fig. 4 and Supplementary Results online), resulting in a 2–20-fold enrichment of PCR signal. We found no evidence for such expansion in the CAR-ATC population (Fig. 4a), although highly specific methods for selective expansion of CAR-ATCs in ex vivo cultures are lacking. Enrichment of CAR DNA was accompanied by a corresponding enrichment of CAR expression on the cell surface (Fig. 4c). To show that these CAR-enriched cells (from a 2-week sample) also retained cytotoxic activity against cells targeted through both native and chimeric receptors, we cultured them with autologous EBV+ targets and allogeneic GD2+ neuroblasts and confirmed the persistence of recognition and killing through both native and chimeric receptors (Fig. 4d). Hence, even after prolonged in vivo survival, the CAR-expressing CTLs can remain responsive to signals through their native receptors and retain tumor-directed cytotoxic effector function through the chimeric receptors. By contrast, CAR-ATCs could not be detected among mononuclear cells in peripheral blood (even after mitogen stimulation) and thus were not available for assessment.
Figure 4.

Reactivation of CAR-CTLs ex vivo. (a,b) Fold change in the level of GD2-receptor-transgene positivity in the cultures before and after exposure to EBV antigen in ATCs (a) and CTLs (b). PBMCs were collected at increasing times after infusion (indicated on the x axis) and re-expanded ex vivo in the presence of EBV+ targets (total of three or four stimulations). Each symbol represents a single subject. (c) Change in percentage of cells expressing the GD2 chimeric receptor on _ex vivo-_reactivated CTLs. The y axis for the top panels indicates the isotype control, whereas for the bottom panels it indicates antibody 1A7. Percentages represent the proportions of cells expressing the CAR. (d) Cytotoxicity of _ex vivo-_reactivated CTLs against autologous LCLs, allogeneic LCLs or LAN-1 cells. The data are means ± s.d. of triplicate experiments.
Tumor responses after infusion of modified T cells
Eleven individuals with neuroblastoma were treated with CAR-CTLs and CAR-ATCs. Four of the eight with evaluable tumors had evidence of tumor necrosis or regressions (summarized below), including a sustained complete remission (Table 1). None developed detectable antibodies to CAR-CTLs, and there were no adverse events attributable to the genetically modified T cells in the 11 subjects followed for up to 24 months.
Subject 3, a 4-year-old female whose disease was refractory to high-dose chemotherapy and radiation, had a persistent lesion (4 cm) in the left parietal region of the skull. This mass arose from the bone, extended into the extradural space (Fig. 5a) and accumulated meta-iodobenzylguanidine (MIBG). The extradural component resolved within 6 weeks after treatment, and the MIBG scan became negative 4 months later. This subject has remained in complete remission for more than 12 months without further therapy.
Figure 5.

Resolution of neuroblastoma in subjects 3 and 6 after infusion of genetically engineered T cells. (a) Sequential anatomic (MRI) and functional (MIBG) imaging of the head and neck of subject 3, a 4-year-old girl with relapsed metastatic neuroblastoma, with an extradural mass and overlying calvarial bone involvement. Progressive resolution of the extradural mass and loss of MIBG uptake in the lesion by 4 months after infusion are indicated by arrows. The signal in the salivary glands remains due to normal uptake. (b) H&E stain showing postinfusion normalization of bone marrow in subject 6 after extensive infiltration by neuroblasts.
Subject 6, a 15-year-old female with recurrent disease after chemotherapy, irradiation and double autologous stem cell transplantation, had extensive marrow disease repeatedly documented on bilateral bone biopsies (Fig. 5b). Re-examination 4 weeks after treatment revealed no residual tumor in either biopsy site, but 4 weeks later extramedullary disease became evident (data not shown).
Subject 8, a 5-year-old female with recurrent disease after chemotherapy, irradiation, and autologous stem cell transplantation, had a slowly progressing lesion (10 cm) in the left scapula. Two weeks after cell infusion, she developed fever, local (axillary) lymphadenopathy and then pain at the site of the tumor. Computed tomography imaging showed necrosis in the scapular lesion and axillary lymph nodes (data not shown); necrosis was confirmed by biopsy (Supplementary Fig. 5 online). A residual tumor persisted, but its size remained stable at 12 months after treatment (data not shown).
Subject 10, a 6-year-old female with recurrent disease after chemotherapy, radiation and autologous stem cell transplantation, had multiple metastatic lesions (2–6 cm) in the liver. Twelve days after receiving the modified T cells, she developed fever and hepatalgia. Computed tomography imaging showed hyperlucency of the multiple liver lesions (data not shown), a finding indicative of necrosis that was subsequently confirmed on biopsy (Supplementary Fig. 6 online). The liver lesions were rapidly resurgent (data not shown), leading to the subject’s death at 4 months after treatment.
We were unable to relate these responses to the clinical characteristics of the individual tumors (such as size, extent or genetic markers) or to the infused dose of the genetically engineered T cells. Needle biopsy specimens of necrotic tumor sites from subjects 6, 8 and 10, although revealing T cell infiltrates, lacked PCR signal for CAR-CTLs or CAR-ATCs, suggesting that the observed tumor responses may have resulted from indirect mechanisms of cytotoxicity27.
DISCUSSION
Our results show that human virus-specific CTLs expressing a synthetic chimeric antigen receptor directed to a nonviral tumor–associated antigen persist in higher numbers and for longer times after administration to individuals with cancer than do activated T cells expressing the same receptor but lacking viral specificity. Moreover, these engineered CTLs retain the ability to recognize both virus-infected and tumor targets through their native and chimeric receptors, respectively, and their infusion may be associated with subsequent tumor necrosis or sustained complete remission. Hence, virus-specific CTLs seem to offer distinct advantages as tumor-directed effector cells.
The chimeric antigen receptor we describe was derived from a combination of an antibody and a T cell receptor, but retargeting may also be achieved by cloning the MHC-peptide–binding α and β chains of the native T cell receptor (TCR-αβ) itself and transferring them to polyclonal T cells1,28. Although encouraging results have been obtained1, the αβ receptors are MHC restricted, so that multiple receptors and vectors must be made to cover common MHC polymorphisms for every peptide. More problematically, many tumors, including neuroblastoma, evade T cell immune responses by down-regulating their MHC expression or by degrading their antigen-processing mechanisms19,29,30. Thus, T cells expressing αβ receptors may be of value for only a restricted number of tumors.
A limitation of CAR-mediated T cell therapy has been the brief persistence of the engineered cells, even when they are infused in large numbers. We suggest that CAR-CTLs were able to overcome this limitation in the present study (Fig. 3) because of the ex vivo and subsequent in vivo antigen stimulation and co-stimulation they received after engagement of their native receptor. The almost immediate difference in survival seen between CAR-CTLs and CAR-ATCs at less than 24 h after infusion is unlikely to have resulted from differences in in vivo proliferation and more probably reflects the greater ability of CAR-CTLs to recirculate in the peripheral blood, perhaps by avoiding trapping in capillary beds31. The subsequent survival advantage of CAR-CTLs over CAR-ATCs does not seem to be an artifact resulting from differences in the intrinsic, antigen-independent survival ability of the two populations (Supplementary Figs. 2 and 3), but rather a consequence of continuing native receptor stimulation by latent EBV antigen on endogenous antigen-presenting cells. Both in vitro and in vivo preclinical studies have shown16,18 that CAR-CTL survival requires continued native receptor stimulation; otherwise, these cells cease to divide and undergo apoptosis within 2–3 weeks (Supplementary Fig. 4). Moreover, in an earlier clinical study15, we adoptively transferred an autologous CTL monoculture containing EBV-, cytomegalovirus (CMV)- and adenovirus-specific CTLs to stem cell transplant recipients and observed persistence of the autologous CMV-specific and EBV-specific CTLs in the latently infected CMV- and EBV-seropositive recipients. By contrast, adenovirus-specific CTLs persisted only when there was concomitant adenovirus infection of the recipient (and thus antigen stimulation). Because the CMV-, EBV- and adenovirus-specific CTLs used in the study had all received the same in vitro stimulation and co-stimulation from the same antigen-presenting cells, we concluded that native receptor stimulation in vitro is insufficient to produce subsequent long-term persistence of CTLs in peripheral blood and that in vivo engagement of the native receptor is required as well.
Our CTLs and ATCs each expressed a chimeric receptor containing only the ζ-chain of the T cell receptor. An alternative means of preparing CAR+ T cells is to incorporate additional costimulatory endodomains such as CD28 into the CAR32 or to express transgene-encoded costimulatory ligands from the effector T cell itself33. These strategies initiate costimulatory signaling to the nucleus after CAR engagement and thereby help to compensate for the lack of physiological co-stimulation when chimeric receptors engage most tumor cells32. Despite promising results in preclinical testing34, such constitutively expressed ‘compound’ CARs cannot mimic the complicated temporal or spatial pattern of costimulatory signals required for the full and sustained activation and function of effector T cells, suggesting that they may undergo suboptimal activation unless the targeted tumor itself expresses a range of additional costimulatory receptors or ligands34. By contrast, when virus-infected B cells engage EBV-CTLs through their native receptor, a panoply of physiological co-stimulation follows35, increasing the likelihood of an effective T cell response. Similarly, in our study, the T cells were activated ex vivo by a CD3 mitogenic antibody (OKT3) alone before transduction. Other investigators have used a mixture of OKT3 and the costimulatory molecule CD28 to prepare ATCs. Although this combination may facilitate ex vivo expansion of ATCs to the larger numbers infused in those studies, the transience of the activation response to CD28 and its incompleteness as a costimulatory signal26–29 means that such cells may not have in vivo survival superior to that of the OKT3-stimulated ATCs used here36.
We found no correlation between the dose of the genetically modified cells infused and their subsequent numbers in peripheral blood, and neither of these measures correlated with tumor response, a result similar to previous observations13,14. Indeed, with few exceptions, the precise mechanisms by which T lymphocytes damage or destroy solid human tumors in vivo are far from defined7,14. Although it is possible that earlier tumor biopsies would have enabled detection of gene-modified cells, an alternative explanation is that effective T cell–based cancer therapies stimulate an immune cascade involving multiple types of antitumor effector cells, including T lymphocytes with different origins and different antigen specificities from those actually infused27,28. Nonetheless, given that functional CAR-CTLs persist after infusion, we suggest that the EBV-specific CAR–expressing CTLs, rather than the modified ATCs, initiated the tumor responses and necrosis observed in this study. It is noteworthy that even large numbers of CAR-ATCs (>1 × 10⁹ cells) have failed to influence tumor survival or growth in previous studies10, supporting a clinically important antitumor contribution from the EBV-specific CTLs expressing the chimeric antigen receptor. Thus, we have shown that a CAR introduced into virus-specific CTLs has biological advantages over an identical CAR introduced into OKT3-activated primary T cells. This general model will probably be of value in studies of other combinations of CARs and native receptors17,37 and may yield improved clinical results as we implement refinements made on the basis of a better understanding of the antitumor mechanisms involved1,31.
METHODS
Subjects
This study was open to individuals who had recurrent or refractory advanced-stage neuroblastoma or were unable to receive or complete standard therapy (Table 1). All were seropositive for IgG specific for the viral capsid antigen of EBV, had appropriate organ function and performance scores and lacked human antibodies to mouse antigen or to rat antigen. We obtained 30–60 ml of peripheral blood for production of EBV-transformed LCLs, phytohemagglutinin blasts, and gene-modified ATCs and EBV-CTLs under current ‘good tissue practice’ conditions. The investigation was approved by the US Food and Drug Administration, the Recombinant DNA Advisory Committee and the Institutional Review Board of Baylor College of Medicine. All participants or their guardians gave informed consent on enrollment. Assent given by the participants was as is appropriate for their age and level of development.
We treated subjects with single infusions of CAR-ATCs and CAR-CTLs at the doses given in Table 1 and evaluated them for tumor responses 4–6 weeks after infusion38. We assessed toxicity on the basis of physical examinations, performance tests and laboratory tests of organ function conducted at 1, 2, 4 and 6 weeks after infusion and again at 3, 6, 9 and 12 months after infusion. We tested the retroviruses for their replication competence before the study and at 3, 6, and 12 months after infusion.
Generation of retroviral constructs
The retroviral vector encoding the scFv domain targeting the GD2a antigen has been previously described16. To generate two PCR-distinguishable retroviral constructs (Zeta-5 and Zeta-6), we opened SFG.lacZ (a splicing Maloney murine leukemia virus–based vector generously provided by R.C. Mulligan)39 with _Nco_I and _Bam_HI, removing the lacZ gene. We generated a pair of double-stranded DNA cassettes with X_ho_I- and _Bam_HI-compatible ends by annealing oligonucleotides with sequences 5′-TCGAACGCGTCATCATC-3′ with 5′-CTAGCTACTACT GCGCA-3′ and oligonucleotides with sequences 5′-TCGATGCATGCAAC CTC-3′ with 5′-CTAGCTCCAACGTACGT-3′, respectively. We cloned the chimeric receptor with either of these cassettes into the opened SFG vector to generate the Zeta-5 and Zeta-6 vectors, which on confirmatory sequencing differed only in a 12–base pair stretch between the receptor stop codon and the 3′ long terminal repeat. This 12–base pair stretch includes an _Mlu_I site in Zeta-5 and an _Sph_I site in Zeta-6.
Generation and validation of retrovirus packaging cell lines
We transfected the Phoenix Eco cell line (American Type Culture Collection SD3444) with vectors Zeta-5 or Zeta-6 to generate a pseudotyped transient supernatant, which we used repeatedly to transduce PG13 cells (gibbon ape leukemia virus pseudotyping packaging cell line; American Type Culture Collection CRL-10686). We detected the GD2-specific CAR by FACS analysis on the transduced PG13 cells with the idiotypic antibody 1A7 (TriGem, Titan Pharmaceutical)16. After single-cell cloning, we used the highest-titer clone for each vector to establish a master cell bank. We released the clones for clinical use only after safety testing and vector sequencing; none produced replication-competent retrovirus. We stored the final viral supernatant at −80 °C and tested it before clinical release. Virus titers ranged from 6 × 10⁵ to 1.6 × 10⁶ virus particles per ml.
Generation and transduction of activated T cells and cytotoxic T cells
To generate CAR-ATCs, we transduced PBMCs, activated them with OKT3 (Ortho Biotech) antibody and recombinant human IL-2 (rhIL-2, 100 U ml−1, Proleukin Chiron) in 24-well plates precoated with a recombinant fibronectin fragment (FN CH-296, Retronectin Takara). At 48 h after transduction, we expanded T cells with rhIL-2 (50 U ml−1) added every 3 d. We generated EBV-CTLs as previously described23 with PBMCs stimulated with gamma-irradiated (40 Gy) autologous LCLs. For transduction, we plated EBV-CTLs (obtained after at least three stimulations) in retronectin-coated 24-well plates with the retroviral supernatant. We transduced CAR-ATCs on day 3 after culture initiation and froze them on day 15 (± 3 d), and we transduced CAR-CTLs on day 23 (± 5 d) after culture initiation and froze them on day 45 (± 9 d).
Immunophenotyping
We stained ATC and CTL lines with monoclonal antibodies to CD3, CD4, CD8, CD56, CD19, TCR-αβ, TCR-γδ, CD62L, CD27, CD28, CD45RA, CD45RO, CCR2, CCR4, CCR5, CCR7, CXCR3, CXCR4, CD162, CD54, CD38, CD106, CD11a, CD11c and CD18 (Becton-Dickinson). We included control samples labeled with appropriate isotype-matched antibodies in each experiment. We detected the 14g2a CAR with the idiotypic antibody 1A7 (ref. 16). We analyzed the cells by FACScan (Becton-Dickinson) equipped with a filter set for four fluorescence signals.
Chromium release assay
We evaluated the cytotoxic specificity of ATCs and EBV-CTLs with a standard 4-h 51Cr release assay, as previously described8,17.
Real-time quantitative PCR
We used quantitative PCR to quantify the retrovirus integrants for both the Zeta-5 and the Zeta-6 vectors in PBMCs. After DNA extraction with the QIAamp DNA Blood Mini Kit (Qiagen), we amplified the DNA in duplicate with primer and probe sequences (Applied Biosystems) for the Zeta-5 and Zeta-6 vectors in the ABI Prism 7700 Sequence Detector (Perkin-Elmer). The baseline range was set at cycles 6–15 with the threshold at ten standard deviations above the baseline fluorescence. To generate DNA standards, we established single-cell clones from the Jurkat cell line and transduced them with either Zeta-5 or Zeta-6. We serially diluted DNA obtained from these clones with DNA extracted from nontransduced control Jurkat cells (Supplementary Fig. 1 and Supplementary Methods).
Before and at different times afterinfusion, we extracted DNA was extracted from the PBMCs of subjects. We amplified both marker sequences as described above and plotted the results as the mean percentage of positive cells for all 11 subjects, with a known positive cloned line used as a reference standard. Comparison of mean ± s.e.m. areas under the curve for ATCs and CTLs was based on data from the primary PCR analysis above.
Statistical analyses
We relied on descriptive statistics (means, ranges and standard deviations or standard errors) to summarize most datasets. We compared the data by the two-tailed _t_-test or by the nonparametric Wilcoxon signed-rank test (area-under-the-curve analysis). Differences with a P value of <0.05 were considered statistically significant.
Supplementary Material
Supplementary data
Acknowledgments
Maloney murine leukemia virus–based vector was generously provided by R.C. Mulligan (Harvard Stem Cell Institute). This work was supported by grant PO1 CA94237 from the US National Institutes of Health, the General Clinical Research Centers at Baylor College of Medicine (RR00188) and a Doris Duke Distinguished Clinical Scientist Award to H.E.H.
Footnotes
Note: Supplementary information is available on the Nature Medicine website.
AUTHOR CONTRIBUTIONS
This study was developed and designed by M.A.P., C.M.R., H.E.H. and M.K.B. The principal investigators on the clinical trial were G.D.M. and H.V.R. M.A.P. and C.R. performed the preclinical studies. M.A.P. and Z.M. manufactured the clinical vectors, and M.A.P. and G.D. designed the vectors and developed the gene transfer monitoring studies. B.S., G.D., E.L. and E.Y. performed the PCR and immune reconstitution studies. H.L.W. and H.L. provided statistical support. C.M.R., M.H.H. and B.S. supervised CTL and ATC preparation, and A.P.G. supervised quality assurance. B.S., G.D. C.M.R., H.E.H. and M.K.B. contributed to the writing of the paper.
References
- 1.Morgan RA, et al. Cancer regression in patients after transfer of genetically engineered lymphocytes. Science. 2006;314:126–129. doi: 10.1126/science.1129003. [DOI] [PMC free article] [PubMed] [Google Scholar]
- 2.Heslop HE, et al. Long-term restoration of immunity against Epstein-Barr virus infection by adoptive transfer of gene-modified virus-specific T lymphocytes. Nat Med. 1996;2:551–555. doi: 10.1038/nm0596-551. [DOI] [PubMed] [Google Scholar]
- 3.Bollard CM, et al. Cytotoxic T lymphocyte therapy for Epstein-Barr virus–positive Hodgkin’s disease. J Exp Med. 2004;200:1623–1633. doi: 10.1084/jem.20040890. [DOI] [PMC free article] [PubMed] [Google Scholar]
- 4.Young LS, Rickinson AB. Epstein-Barr virus: 40 years on. Nat Rev Cancer. 2004;4:757–768. doi: 10.1038/nrc1452. [DOI] [PubMed] [Google Scholar]
- 5.Khanna R, Moss D, Gandhi M. Technology insight: applications of emerging immunotherapeutic strategies for Epstein-Barr virus–associated malignancies. Nat Clin Pract Oncol. 2005;2:138–149. doi: 10.1038/ncponc0107. [DOI] [PubMed] [Google Scholar]
- 6.Blattman JN, Greenberg PD. Cancer immunotherapy: a treatment for the masses. Science. 2004;305:200–205. doi: 10.1126/science.1100369. [DOI] [PubMed] [Google Scholar]
- 7.Leen AM, Rooney CM, Foster AE. Improving T cell therapy for cancer. Annu Rev Immunol. 2007;25:243–265. doi: 10.1146/annurev.immunol.25.022106.141527. [DOI] [PubMed] [Google Scholar]
- 8.Sadelain M, Riviere I, Brentjens R. Targeting tumours with genetically enhanced T lymphocytes. Nat Rev Cancer. 2003;3:35–45. doi: 10.1038/nrc971. [DOI] [PubMed] [Google Scholar]
- 9.Stauss HJ, et al. Monoclonal T cell receptors: new reagents for cancer therapy. Mol Ther. 2007;15:1744–1750. doi: 10.1038/sj.mt.6300216. [DOI] [PubMed] [Google Scholar]
- 10.Park JR, et al. Adoptive transfer of chimeric antigen receptor re-directed cytolytic T lymphocyte clones in patients with neuroblastoma. Mol Ther. 2007;15:825–833. doi: 10.1038/sj.mt.6300104. [DOI] [PubMed] [Google Scholar]
- 11.Kershaw MH, et al. A phase I study on adoptive immunotherapy using gene-modified T cells for ovarian cancer. Clin Cancer Res. 2006;12:6106–6115. doi: 10.1158/1078-0432.CCR-06-1183. [DOI] [PMC free article] [PubMed] [Google Scholar]
- 12.O’Reilly RJ, et al. Adoptive transfer of antigen-specific T cells of donor type for immunotherapy of viral infections following allogeneic hematopoietic cell transplants. Immunol Res. 2007;38:237–250. doi: 10.1007/s12026-007-0059-2. [DOI] [PubMed] [Google Scholar]
- 13.Bollard CM, et al. Complete responses of relapsed lymphoma following genetic modification of tumor-antigen presenting cells and T lymphocyte transfer. Blood. 2007;110:2838–2845. doi: 10.1182/blood-2007-05-091280. [DOI] [PMC free article] [PubMed] [Google Scholar]
- 14.Straathof KC, et al. Treatment of nasopharyngeal carcinoma with Epstein-Barr virus–specific T lymphocytes. Blood. 2005;105:1898–1904. doi: 10.1182/blood-2004-07-2975. [DOI] [PubMed] [Google Scholar]
- 15.Leen AM, et al. Monoculture-derived T lymphocytes specific for multiple viruses expand and produce clinically relevant effects in immunocompromised individuals. Nat Med. 2006;12:1160–1166. doi: 10.1038/nm1475. [DOI] [PubMed] [Google Scholar]
- 16.Rossig C, Bollard CM, Nuchtern JG, Rooney CM, Brenner MK. Epstein-Barr virus–specific human T lymphocytes expressing antitumor chimeric T cell receptors: potential for improved immunotherapy. Blood. 2002;99:2009–2016. doi: 10.1182/blood.v99.6.2009. [DOI] [PubMed] [Google Scholar]
- 17.Heemskerk MH, et al. Reprogramming of virus-specific T cells into leukemia-reactive T cells using T cell receptor gene transfer. J Exp Med. 2004;199:885–894. doi: 10.1084/jem.20031110. [DOI] [PMC free article] [PubMed] [Google Scholar]
- 18.Savoldo B, et al. Epstein Barr virus specific cytotoxic T lymphocytes expressing the anti-CD30ζ artificial chimeric T cell receptor for immunotherapy of Hodgkin disease. Blood. 2007;110:2620–2630. doi: 10.1182/blood-2006-11-059139. [DOI] [PMC free article] [PubMed] [Google Scholar]
- 19.Zou W. Immunosuppressive networks in the tumour environment and their therapeutic relevance. Nat Rev Cancer. 2005;5:263–274. doi: 10.1038/nrc1586. [DOI] [PubMed] [Google Scholar]
- 20.Rabinovich GA, Gabrilovich D, Sotomayor EM. Immunosuppressive strategies that are mediated by tumor cells. Annu Rev Immunol. 2007;25:267–296. doi: 10.1146/annurev.immunol.25.022106.141609. [DOI] [PMC free article] [PubMed] [Google Scholar]
- 21.Maris JM, Hogarty MD, Bagatell R, Cohn SL. Neuroblastoma. Lancet. 2007;369:2106–2120. doi: 10.1016/S0140-6736(07)60983-0. [DOI] [PubMed] [Google Scholar]
- 22.Berger C, et al. Adoptive transfer of effector CD8+ T cells derived from central memory cells establishes persistent T cell memory in primates. J Clin Invest. 2008;118:294–305. doi: 10.1172/JCI32103. [DOI] [PMC free article] [PubMed] [Google Scholar]
- 23.Rooney CM, et al. Infusion of cytotoxic T cells for the prevention and treatment of Epstein-Barr virus–induced lymphoma in allogeneic transplant recipients. Blood. 1998;92:1549–1555. [PubMed] [Google Scholar]
- 24.Rossig C, et al. Target antigen expression on a professional antigen-presenting cell induces superior proliferative antitumor T cell responses via chimeric T cell receptors. J Immunother. 2006;29:21–31. doi: 10.1097/01.cji.0000175492.28723.d6. [DOI] [PubMed] [Google Scholar]
- 25.Krance RA, et al. Hematopoietic and immunomodulatory effects of lytic CD45 monoclonal antibodies in patients with hematologic malignancy. Biol Blood Marrow Transplant. 2003;9:273–281. doi: 10.1053/bbmt.2003.50024. [DOI] [PubMed] [Google Scholar]
- 26.Wahl SM, Wen J, Moutsopoulos N. TGF-β: a mobile purveyor of immune privilege. Immunol Rev. 2006;213:213–227. doi: 10.1111/j.1600-065X.2006.00437.x. [DOI] [PubMed] [Google Scholar]
- 27.Hunder NN, et al. Treatment of metastatic melanoma with autologous CD4+ T cells against NY-ESO-1. N Engl J Med. 2008;358:2698–2703. doi: 10.1056/NEJMoa0800251. [DOI] [PMC free article] [PubMed] [Google Scholar]
- 28.Gattinoni L, Powell DJ, Jr, Rosenberg SA, Restifo NP. Adoptive immunotherapy for cancer: building on success. Nat Rev Immunol. 2006;6:383–393. doi: 10.1038/nri1842. [DOI] [PMC free article] [PubMed] [Google Scholar]
- 29.Smyth MJ, Dunn GP, Schreiber RD. Cancer immunosurveillance and immunoediting: the roles of immunity in suppressing tumor development and shaping tumor immunogenicity. Adv Immunol. 2006;90:1–50. doi: 10.1016/S0065-2776(06)90001-7. [DOI] [PubMed] [Google Scholar]
- 30.Zitvogel L, Tesniere A, Kroemer G. Cancer despite immunosurveillance: immunoselection and immunosubversion. Nat Rev Immunol. 2006;6:715–727. doi: 10.1038/nri1936. [DOI] [PubMed] [Google Scholar]
- 31.Fisher B, et al. Tumor localization of adoptively transferred indium-111 labeled tumor infiltrating lymphocytes in patients with metastatic melanoma. J Clin Oncol. 1989;7:250–261. doi: 10.1200/JCO.1989.7.2.250. [DOI] [PubMed] [Google Scholar]
- 32.Maher J, Brentjens RJ, Gunset G, Riviere I, Sadelain M. Human T lymphocyte cytotoxicity and proliferation directed by a single chimeric TCRζ/CD28 receptor. Nat Biotechnol. 2002;20:70–75. doi: 10.1038/nbt0102-70. [DOI] [PubMed] [Google Scholar]
- 33.Stephan MT, et al. T cell–encoded CD80 and 4-1BBL induce auto- and transco-stimulation, resulting in potent tumor rejection. Nat Med. 2007;13:1440–1449. doi: 10.1038/nm1676. [DOI] [PubMed] [Google Scholar]
- 34.Brentjens RJ, et al. Eradication of systemic B cell tumors by genetically targeted human T lymphocytes co-stimulated by CD80 and interleukin-15. Nat Med. 2003;9:279–286. doi: 10.1038/nm827. [DOI] [PubMed] [Google Scholar]
- 35.Mescher MF, et al. Signals required for programming effector and memory development by CD8+ T cells. Immunol Rev. 2006;211:81–92. doi: 10.1111/j.0105-2896.2006.00382.x. [DOI] [PubMed] [Google Scholar]
- 36.June CH. Principles of adoptive T cell cancer therapy. J Clin Invest. 2007;117:1204–1212. doi: 10.1172/JCI31446. [DOI] [PMC free article] [PubMed] [Google Scholar]
- 37.Cooper LJ, et al. Enhanced antilymphoma efficacy of CD19-redirected influenza MP1-specific CTLs by cotransfer of T cells modified to present influenza MP1. Blood. 2005;105:1622–1631. doi: 10.1182/blood-2004-03-1208. [DOI] [PubMed] [Google Scholar]
- 38.Jaffe CC. Measures of response: RECIST, WHO, and new alternatives. J Clin Oncol. 2006;24:3245–3251. doi: 10.1200/JCO.2006.06.5599. [DOI] [PubMed] [Google Scholar]
- 39.Riviere I, Brose K, Mulligan RC. Effects of retroviral vector design on expression of human adenosine deaminase in murine bone marrow transplant recipients engrafted with genetically modified cells. Proc Natl Acad Sci USA. 1995;92:6733–6737. doi: 10.1073/pnas.92.15.6733. [DOI] [PMC free article] [PubMed] [Google Scholar]
Associated Data
This section collects any data citations, data availability statements, or supplementary materials included in this article.
Supplementary Materials
Supplementary data