Diversity and Complexity in DNA Recognition by Transcription Factors (original) (raw)
. Author manuscript; available in PMC: 2010 Jul 19.
Published in final edited form as: Science. 2009 May 14;324(5935):1720–1723. doi: 10.1126/science.1162327
Abstract
Sequence preferences of DNA-binding proteins are a primary mechanism by which cells interpret the genome. Despite these proteins’ central importance in physiology, development, and evolution, comprehensive DNA-binding specificities have been determined experimentally for few proteins. Here, we used microarrays containing all 10-base-pair sequences to examine the binding specificities of 104 distinct mouse DNA-binding proteins representing 22 structural classes. Our results reveal a complex landscape of binding, with virtually every protein analyzed possessing unique preferences. Roughly half of the proteins each recognized multiple distinctly different sequence motifs, challenging our molecular understanding of how proteins interact with their DNA binding sites. This complexity in DNA recognition may be important in gene regulation and in evolution of transcriptional regulatory networks.
The interactions between transcription factors (TFs) and their DNA binding sites are an integral part of the gene regulatory networks that control development, core cellular processes, and responses to environmental perturbations. However, only a handful of sequence-specific TFs have been characterized well enough to identify all the sequences that they can and, just as importantly, can not bind. Computational analysis of microarray readout of chromatin immunoprecipitation experiments (ChIP-chip) suggests extensive use of low affinity binding sites in yeast (1), and computational models of gene expression during fly embryonic development suggest that low affinity binding sites contribute as much as high affinity sites (2).
The availability of TF binding data spanning the full affinity range would improve our understanding of the biophysical phenomena underlying protein-DNA recognition, and would improve accuracy in analyzing cis regulatory elements. Here we report the comprehensive determination of the DNA binding specificities of 104 known and predicted mouse TFs using the universal protein binding microarray (PBM) technology (3). These TFs represent 22 different DNA binding domain (DBD) structural classes that are the major DBD classes found in metazoan TFs.
We created (4) N-terminal GST fusion constructs of the DBDs of 104 known and predicted mouse TFs (Fig. S1 and Table S1). Five of these proteins – Max, Bhlhb2, Gata3, Rfx3, and Sox7 – were also represented as full-length fusions to N-terminal GST, yielding a total set of 109 non-redundant proteins represented by 115 samples (5). Each protein was used in two PBM experiments (6, 7) (Figs. S2, S3, S4 and Table S2). DNA binding site motifs initially were derived using the Seed-and-Wobble algorithm (3, 8); Seed-and-Wobble first identifies the single 8-mer (ungapped or gapped) with the greatest PBM enrichment score (E-score) (3), and then systematically tests the relative preference of each nucleotide variant at each position both within and outside the seed (5). Later analyses incorporated additional motif finding algorithms, including RankMotif++ (9) and Kafal (5).
Beyond simply providing a DNA binding site motif, these data provide a rank-ordered listing of the preference of a protein for every gapped and ungapped _k_-mer ‘word’, where k is the number of informative nucleotide positions in the binding site. This dataset consists of 9.6 million measurements, from which we can derive binding data for 22.3 million ungapped and gapped 8-mers (up to 12 positions) for each protein. For each of the 8-mers for each protein, we report its E-score, median signal intensity Z-score, and false discovery rate _Q_-value (5). We found that the average number of ungapped 8-mers considered ‘bound’ at a _Q_-value threshold of 0.001 varied across classes, ranging from 65 for the MADS class factor SRF to 871 for the E2F class.
For TFs that had previously known binding site motifs, we observed general agreement with prior motif data (Fig. S5 and Table S3) (5). Comparisons to Kd data (10) for Max, and for the yeast TF Cbf1 (3), indicate that words with higher E-scores are generally bound with higher affinity (3) (Fig. S6). Confirmation by electrophoretic mobility shift assays (EMSA) for three newly characterized proteins and one recently characterized protein (11) — Zfp740, Osr2, Sp100, and Zfp161 (ZF5) (12), respectively — is shown in Fig. S7.
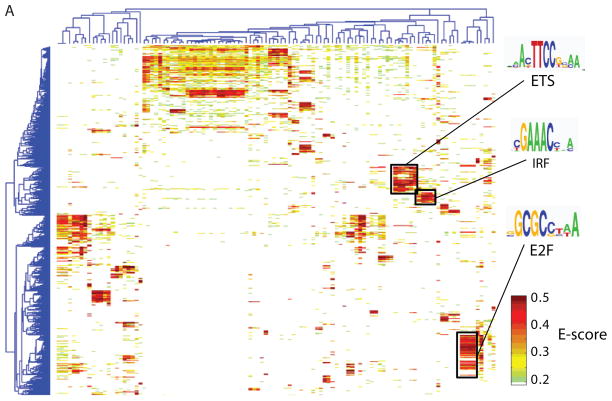
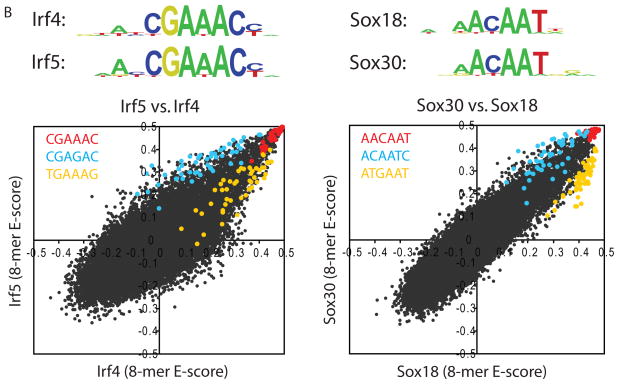
To examine correlations among the proteins’ DNA binding specificities and to identify DNA sequences that distinguish the binding profiles of different TF families, we hierarchically clustered the _k_-mers that met a stringent binding threshold (E ≥ 0.45) for at least one of the proteins. We utilized E-scores because they are robust to differences in protein concentration and thus facilitate comparison of _k_-mer data across arrays (3); we consider them as a proxy for relative affinities. Different DBD classes generally recognize distinct portions of sequence space (Fig. 1A and Fig. S8). However, even proteins with up to 67% amino acid sequence identity exhibited distinct DNA binding profiles. For example, although Irf4 and Irf5 both bind the same highest affinity sites (8-mers containing CGAAAC), they prefer different lower affinity sites (TGAAAG vs. CGAGAC) (Fig. 1B). We verified for five TFs that the full-length protein displays a virtually identical spectrum of 8-mer preferences to that of the DBD and that the spectrum is distinct from other proteins of the same structural class (Figs. S2, S9).
Figure 1.
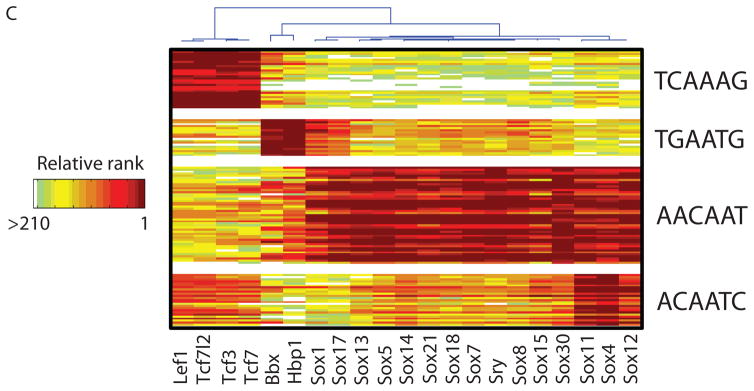
High-resolution PBM _k_-mer data. (A) Heatmap of 2-D hierarchical agglomerative clustering analysis of 4,740 ungapped 8-mers over 104 nonredundant TFs, with both 8-mers and proteins clustered using averaged E-score from the two different array designs. The 4,740 8-mers were selected because they have an E-score of 0.45 or greater for at least one of the proteins. A motif representative of the 8-mers contained in each of the indicated clusters is shown, derived from running the 8-mers on ClustalW (32) and entering groups of related aligned sequences into WebLogo (33). (B) Scatter plots comparing 8-mer scores for each pair of TFs, whose primary Seed-and-Wobble logos are shown above the plots. 8-mers containing each 6-mer sequence (inset) are highlighted, revealing consistent differences between sequence preferences among lower affinity 8-mers despite identical preferences for the same highest affinity 8-mers. (Left) Irf5 versus Irf4, (right) Sox30 versus Sox18. (C) Clustergram of _k_-mers for Sox family of TFs. 310 8-mers with E ≥ 0.45 for at least one of the 21 Sox and Sox-related TFs were hierarchically clustered according to their relative ranks for each TF, and then the rows, corresponding to _k_-mers, were rearranged to group together 8-mers with shared sequence patterns.
Our dataset includes most members of three TF structural classes in mouse: Sox and Sox-related, IRF, and AP-2. In an extreme case, we find no evidence that the binding profiles of the AP-2 class members are different from each other (Fig. S9B), consistent with reports that the human counterparts of AP-2α, AP-2β, and AP-2γ all bind GCCNNNGGC (13). In contrast, members of the IRF class all appeared to have different binding profiles (Fig. S9L).
The Sox and Sox-related family presents an intriguing instance of highly conserved DNA-binding domains with closely related but distinct binding preferences. We found striking differences in the binding specificities of the Sox (14), Tcf/Lef (15, 16), and Hbp1/Bbx (17) families (Fig. 1C). In most cases, our data are roughly consistent with known binding sequences (Fig. 1C), although there are also clear differences: Hpb1 and Bbx have been described as preferring WRAATGGG (17), while in our data Hbp1 and Bbx prefer TGAATG, and have lesser preference for AATGGG. Our data confirm that there are at least four different varieties of Sox and Sox-related DNA binding specificity (Fig. 1C), and suggest that there are subtle variations among Sox proteins (Fig. 1B).
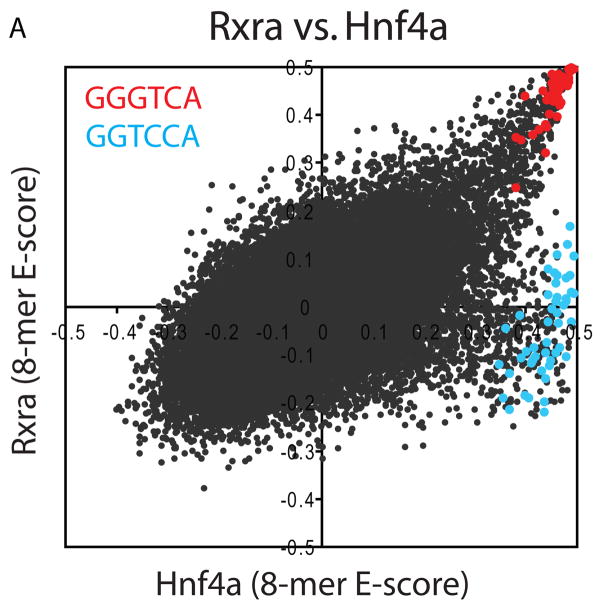
Several TFs had two distinct sets of high-scoring _k_-mers. For example, the nuclear receptor hepatic nuclear factor 4 alpha (Hnf4a; C4 ZnF DNA-binding domain) exhibits strong binding both to sequences containing GGTCA and sequences containing GGTCCA (Fig. 2A), while all four other C4 ZnF TFs that we examined bind only to GGTCA. We confirmed binding of Hnf4a to both variants by EMSA (Fig. S10). TFs that can recognize two distinctly different DNA sequences have been noted before (18). We hypothesized that the existence of secondary motifs may be a general phenomenon and therefore searched for alternate binding preferences throughout our entire dataset.
Figure 2.
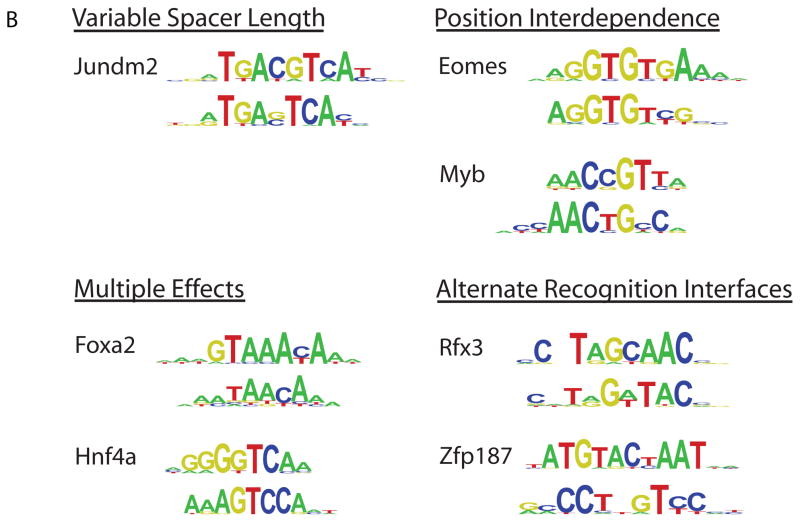
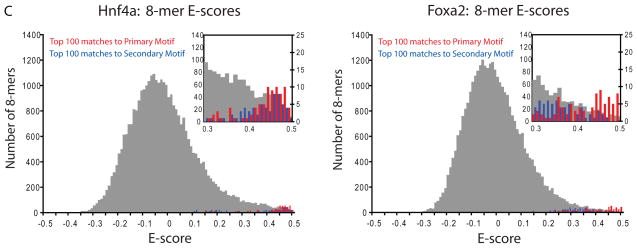
TF binding site secondary motifs. (A) Scatter plot comparing 8-mer E-scores for closely related TFs. Hnf4a and Rxra, two C4 zinc finger TFs, both exhibit strong binding to 8-mers containing GGGTCA (red), whereas Hnf4a shows specific binding to an additional set of 8-mers containing GGTCCA (blue). (B) Examples of motifs from different categories of secondary motifs. (C) Histograms of E-scores for all 8-mers (gray), the top 100 8-mer matches to the primary motif (red), and the top 100 8-mer matches to the secondary motif (blue). 8-mers were scored for matches to PWMs according to the GOMER (27) scoring framework. Insets provide a magnified display of the tails of the distributions; y-axis labels along the right of each inset refer to the red and blue bars. Based on the 8-mer scores, the primary and secondary Hnf4a motifs are essentially interchangeable (left), whereas Foxa2 shows a clear preference for 8-mers corresponding to its primary motif (right).
To aid in the identification of secondary binding preferences, we further developed our Seed-and-Wobble algorithm to search specifically for motifs that represent the _k_-mers of high signal intensity that are not explained well by the primary motif; we refer to these as the secondary motifs. A further iteration can be employed to search for a tertiary motif. As an initial test case, we examined PBM data for the human TF Oct-1 (3); the PBM-derived Oct-1 primary motif corresponded to the full Oct-1 DNA binding site motif, while the secondary and tertiary motifs corresponded to the binding site motifs of the POUHD and POUs domains (19), respectively (Fig. S11). Analysis of 100 simulated long, 14-bp motifs (5) indicated that Seed-and-Wobble was highly successful in identifying the simulated motifs, and that essentially all of the secondary motifs we found in analyzing the real PBM data were unlikely to be attributable to a motif-finding artifact due to long motifs (5).
We observed clear secondary DNA binding preferences for nearly half of our 104 mouse TFs. Their secondary motifs fell into four different categories (Fig. 2B; Supporting Online Text), which we annotated manually. We confirmed binding to the secondary motifs by 6 TFs – Hnf4a, Nkx3.1, Myb, Mybl1, Foxj3, and Rfxdc2 – by EMSAs (Fig. S10).
We found 19 clear cases of ‘position interdependence’ TFs, which exhibited strong interdependence (20) among the nucleotide positions of their binding sites. Position interdependencies frequently spanned more than just dinucleotides; for example, estrogen related receptor alpha (ESRRa) has a strong preference for binding either CAAGGTCA or AGGGGTCA, but not CAGGGTCA or CGGGGTCA. Interdependent nucleotide positions were not always adjacent to each other; for example, Myb (Fig. S10) exhibited strong interdependence at positions separated by 1 nt, with preference for binding either AACCGTCA or AACTGCCA. While position interdependence has been observed (21–25), that this phenomenon occurs on such a broad scale was not known and has important implications because commonly used TF binding site models assume mononucleotide independence.
One protein, the mouse transcriptional regulator Jundm2, a member of the basic leucine zipper (bZIP) structural class, bound to a ‘variable spacer length’ motif (Fig. S12). ‘Multiple effects’ motifs appeared to display a combination of position interdependence and variable distances separating different parts of their motifs; at least 16 TFs fell into this category.
Finally, at least 5 secondary motifs in the ‘alternate recognition interfaces’ category were not readily explainable by either a variable spacer length or position interdependence. This category is the most intriguing, as it suggests that some TFs recognize their DNA binding sites through multiple completely different interaction modes, either through alternate structural features or by switching between alternate conformations. Support for this hypothesis comes from the co-crystal structure of human RFX1 bound to DNA, which indicated that RFX1 uses β-strands and a connecting loop to interact with the major groove of one half-site, and an alpha-helix to interact with the minor groove of the other half-site (26). It is likely that RFX3, RFX4, and RFXDC2 use this same mechanism of alternative DNA recognition modes (Fig. S13).
For several TFs the secondary motifs were bound nearly as well as the primary motifs, while in most cases the motifs represented different affinity classes. For example, the top twenty 8-mers that matched Hnf4a’s primary motif were fairly evenly intermingled (_p_=0.037 by Wilcoxon-Mann-Whitney U-test, using GOMER (27) scoring of motifs) with those that matched its secondary motif (Fig. 2C, left). In contrast, for Foxa2, the secondary motif represented lower affinity binding sequences (_p_=1.94×10⁻⁶) (Fig. 2C, right).
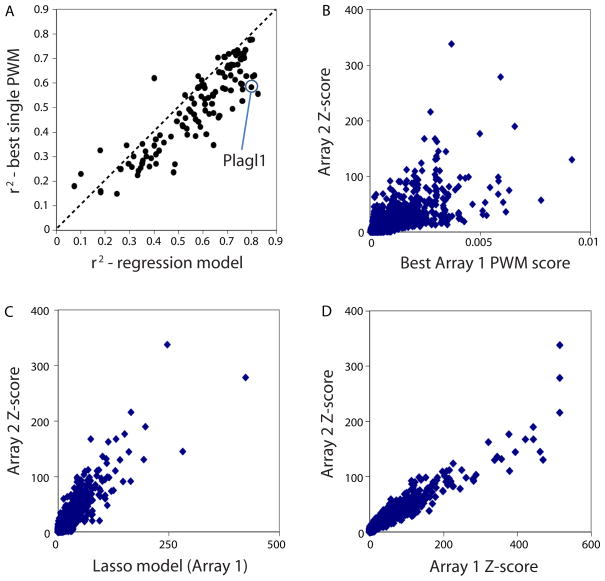
We further considered the possibility that some proteins’ DNA binding specificities might be represented best by multiple motifs. We applied a linear regression approach (5) to learn weighted combinations of position weight matrices (PWMs) generated from several different motif finding algorithms. We found that the binding profiles for all but 15 proteins were represented best by more than one motif (Fig. 3 and Fig. S14). Some of these multiple motifs did not appear to represent different protein-DNA interaction properties described above, but nevertheless captured different subsets of the _k_-mer data.
Figure 3.
Multiple motif models typically better represent the binding profiles than do single motif models. (A) Considering all TFs in this study, in general multiple motif models are a better representation of the data than are single motif models. Variance in 8-mer median intensity (Z-score) on Array 2 explained by our PWM regression model (_x_-axis) compared to GOMER (27) scores for the single best PWM model obtained (best is defined as highest variance explained), over all 8-mers, with models derived from Array 1; the GOMER scoring framework calculates binding probabilities over the 8-mers according to PWMs (27). Each point represents one of the TFs analyzed. (B) The GOMER score for the best PWM derived from Array 1 is compared to the Z-scores from Array 2, for Plagl1 as a case example. Each point is a single 8-mer; all 32,896 8-mers are shown. (C) Same as (B), except the Array 1 regression model scores (which are a linear combination, built by using the least absolute shrinkage and selection operator (Lasso) algorithm (34), of GOMER scores from individual motifs) are compared to the Z-scores from Array 2. (D) 8-mer Z-scores for Plagl1 derived from Array 1 compared to the Z-scores from Array 2. Each point is a single 8-mer; all 32,896 8-mers are shown.
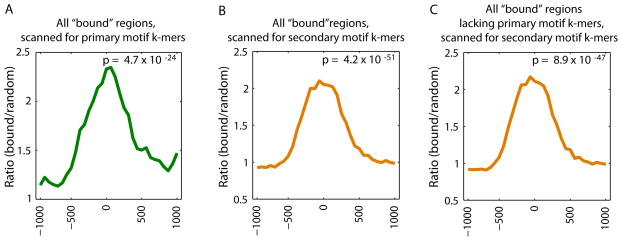
We explored the in vivo usage of the secondary motifs by considering their TF occupancy. We calculated the relative enrichment of 8-mers corresponding to the primary versus secondary Seed-and-Wobble motifs within genomic regions bound in ChIP-chip data as compared to randomly selected sequences (5) for Hnf4a (Fig. 4 and Figs. S15A,C,D). As expected, Hnf4a-bound regions are enriched for matches to 8-mers corresponding to the primary motif for Hnf4a PBM data, with the greatest enrichment towards the centers of the ‘bound’ regions (Fig. 4A). Hnf4a-bound regions are also enriched for matches to 8-mers corresponding to the secondary motif (Fig. 4B). Hnf4a secondary motif 8-mers are enriched even among those Hnf4a-bound regions that lack primary motif 8-mers (Fig. 4C), suggesting that the secondary motif can recruit Hnf4a to genomic loci independently of the primary motif. We observed similar results for Bcl6 (28) (Fig. S15).
Figure 4.
Enrichment of primary versus secondary motif sequences bound in vitro within genomic regions bound in vivo. Relative enrichment of _k_-mers corresponding to the primary versus secondary Seed-and-Wobble motifs within (A, B) all bound genomic regions in ChIP-chip data, or (C) those bound regions lacking primary motif _k_-mers, as compared to randomly selected sequences was calculated (5) for Hnf4a (GEO accession #GSE7745). ChIP-chip ‘bound’ peaks were identified according to the criteria of that study (28). A window size of 500 bp with a step size of 100 bp was used. The GOMER thresholds used are 2.958 × 10⁻⁷ and 8.419 × 10⁻⁷, corresponding to 9 primary and 20 secondary 8-mers scanned respectively for Hnf4a. _P_-values for enrichment of 8-mers within the bound genomic regions shown in each panel were calculated for the interval −250 to +250 by the Wilcoxon-Mann-Whitney rank sum test, comparing the number of occurrences per sequence in the bound set versus the background set.
Our characterization of 104 TFs from 22 different structural classes revealed a prevalence of complexity and richness in DNA binding preferences, both across and within classes. The breadth of the observed ‘secondary motif’ phenomenon had not been described before, and it has important implications for understanding how proteins interact with their DNA binding sites and for genome analysis.
Further experiments and analyses are needed to determine whether the same TF exerts different gene regulatory effects through distinct sequence motifs, and to determine whether TF-specific differences among members of a TF family (29) contribute to differences in binding in vivo and to distinct physiological functions. Although TFs bind a rich spectrum of _k_-mers not fully captured even by multiple PWMs, utilizing a multiple motif model is of practical consequence since most genome analysis tools employ PWMs. Algorithms that consider the quantitative nature of _k_-mer binding data in scoring candidate regulatory elements need to be developed.
Finally, these PBM data are likely to be highly informative for well-conserved homologs in other organisms. Generating (or inferring (29)) PBM data for all regulatory factors in all major model organisms is an important goal, as such _k_-mer data likely will be useful for improved prediction and analysis of regulatory elements, including the identification of direct versus indirect TF binding sites from ChIP data (30). Moreover, such data would aid in understanding the evolution of cis regulatory elements and transcriptional regulatory networks.
Supplementary Material
SOM without Suppl Tables
Table S1
Table S2
Table S3
Acknowledgments
This project was supported by funding from the Canadian Institutes of Health Research (MOP-77721 and postdoctoral fellowship to G.B.), Genome Canada through the Ontario Genomics Institute, the Ontario Research Fund, the Canadian Institute for Advanced Research to T.R.H., by the National Science Foundation to M.F.B., by the Canadian Foundation for Innovation and Ontario Research Fund to Q.M., and by grant R01 HG003985 from NIH/NHGRI to M.L.B. We thank Lourdes Peña-Castillo, Agatha Cheung, Melissa Chan, Sacha Bhinder, Frédéric Bréard, Paul Qureshi, Sanie Mnaimneh, Mariana Kekis, Faiqua Khalid, Jaime Holroyd, Dimitri Terterov, and Kimberly Robasky for technical assistance, and Steve Gisselbrecht, Kevin Struhl, and Shamil Sunyaev for critical reading of the manuscript.
Footnotes
**
Publisher's Disclaimer: This manuscript has been accepted for publication in Science. This version has not undergone final editing. Please refer to the complete version of record at http://www.sciencemag.org/. The manuscript may not be reproduced or used in any manner that does not fall within the fair use provisions of the Copyright Act without the prior, written permission of AAAS.
Websites:
(1) Sequences of the 60-mer probes on the universal arrays employed in this study.
(2) PBM data, including the _k_-mers’ various scores.
(3) Motif sequence logos and statistical performance plots.
References and Notes
- 1.Tanay A. Genome Res. 2006 Jun 29; doi: 10.1101/gr.5113606. [DOI] [PMC free article] [PubMed] [Google Scholar]
- 2.Segal E, Raveh-Sadka T, Schroeder M, Unnerstall U, Gaul U. Nature. 2008 Jan 31;451:535. doi: 10.1038/nature06496. [DOI] [PubMed] [Google Scholar]
- 3.Berger MF, et al. Nat Biotechnol. 2006 Nov;24:1429. doi: 10.1038/nbt1246. [DOI] [PMC free article] [PubMed] [Google Scholar]
- 4.Li MZ, Elledge SJ. Nat Genet. 2005 Mar;37:311. doi: 10.1038/ng1505. [DOI] [PubMed] [Google Scholar]
- 5.Materials and methods are available as supporting material on Science Online.
- 6.Bulyk ML, Huang X, Choo Y, Church GM. Proc Natl Acad Sci USA. 2001 Jun 19;98:7158. doi: 10.1073/pnas.111163698. [DOI] [PMC free article] [PubMed] [Google Scholar]
- 7.Mukherjee S, et al. Nat Genet. 2004 Dec;36:1331. doi: 10.1038/ng1473. [DOI] [PMC free article] [PubMed] [Google Scholar]
- 8.Berger MF, Bulyk ML. Nat Protoc. 2009;4:393. doi: 10.1038/nprot.2008.195. [DOI] [PMC free article] [PubMed] [Google Scholar]
- 9.Chen X, Hughes TR, Morris Q. Bioinformatics. 2007 Jul 1;23:i72. doi: 10.1093/bioinformatics/btm224. [DOI] [PubMed] [Google Scholar]
- 10.Maerkl SJ, Quake SR. Science. 2007 Jan 12;315:233. doi: 10.1126/science.1131007. [DOI] [PubMed] [Google Scholar]
- 11.Matys V, et al. Nucleic Acids Res. 2006 Jan 1;34:D108. doi: 10.1093/nar/gkj143. [DOI] [PMC free article] [PubMed] [Google Scholar]
- 12.Orlov SV, et al. FEBS J. 2007 Sep;274:4848. doi: 10.1111/j.1742-4658.2007.06006.x. [DOI] [PubMed] [Google Scholar]
- 13.Bosher JM, Totty NF, Hsuan JJ, Williams T, Hurst HC. Oncogene. 1996 Oct 17;13:1701. [PubMed] [Google Scholar]
- 14.Mertin S, McDowall SG, Harley VR. Nucleic Acids Res. 1999 Mar 1;27:1359. doi: 10.1093/nar/27.5.1359. [DOI] [PMC free article] [PubMed] [Google Scholar]
- 15.van de Wetering M, Oosterwegel M, Dooijes D, Clevers H. Embo J. 1991 Jan;10:123. doi: 10.1002/j.1460-2075.1991.tb07928.x. [DOI] [PMC free article] [PubMed] [Google Scholar]
- 16.Travis A, Amsterdam A, Belanger C, Grosschedl R. Genes Dev. 1991 May;5:880. doi: 10.1101/gad.5.5.880. [DOI] [PubMed] [Google Scholar]
- 17.Tevosian SG, et al. Genes Dev. 1997 Feb 1;11:383. doi: 10.1101/gad.11.3.383. [DOI] [PubMed] [Google Scholar]
- 18.Pfeifer K, Prezant T, Guarente L. Cell. 1987 Apr 10;49:19. doi: 10.1016/0092-8674(87)90751-3. [DOI] [PubMed] [Google Scholar]
- 19.Klemm JD, Rould MA, Aurora R, Herr W, Pabo CO. Cell. 1994 Apr 8;77:21. doi: 10.1016/0092-8674(94)90231-3. [DOI] [PubMed] [Google Scholar]
- 20.Benos PV, Bulyk ML, Stormo GD. Nucleic Acids Res. 2002 Oct 15;30:4442. doi: 10.1093/nar/gkf578. [DOI] [PMC free article] [PubMed] [Google Scholar]
- 21.Benos PV, Lapedes AS, Stormo GD. Bioessays. 2002 May;24:466. doi: 10.1002/bies.10073. [DOI] [PubMed] [Google Scholar]
- 22.Bulyk ML, Johnson PL, Church GM. Nucleic Acids Res. 2002 Mar 1;30:1255. doi: 10.1093/nar/30.5.1255. [DOI] [PMC free article] [PubMed] [Google Scholar]
- 23.Lee ML, Bulyk M, Whitmore G, Church G. Biometrics. 2002;58:981. doi: 10.1111/j.0006-341x.2002.00981.x. [DOI] [PubMed] [Google Scholar]
- 24.Man TK, Stormo GD. Nucleic Acids Res. 2001;29:2471. doi: 10.1093/nar/29.12.2471. [DOI] [PMC free article] [PubMed] [Google Scholar]
- 25.Barash Y, Elidan G, Friedman N, Kaplan T. paper presented at the Proceedings of the 7th Annual International Conference on Computational Molecular Biology (RECOMB); 2003. [Google Scholar]
- 26.Gajiwala KS, et al. Nature. 2000 Feb 24;403:916. doi: 10.1038/35002634. [DOI] [PubMed] [Google Scholar]
- 27.Granek JA, Clarke ND. Genome Biol. 2005;6:R87. doi: 10.1186/gb-2005-6-10-r87. [DOI] [PMC free article] [PubMed] [Google Scholar]
- 28.Ranuncolo SM, et al. Nat Immunol. 2007 Jul;8:705. doi: 10.1038/ni1478. [DOI] [PubMed] [Google Scholar]
- 29.Berger MF, et al. Cell. 2008 Jun 27;133:1266. doi: 10.1016/j.cell.2008.05.024. [DOI] [PMC free article] [PubMed] [Google Scholar]
- 30.Zhu C, et al. Genome Res. 2009 Apr;19:556. doi: 10.1101/gr.090233.108. [DOI] [PMC free article] [PubMed] [Google Scholar]
- 31.Newburger DE, Bulyk ML. Nucleic Acids Res. 2008 Oct 8; [Google Scholar]
- 32.Chenna R, et al. Nucleic Acids Res. 2003 Jul 1;31:3497. doi: 10.1093/nar/gkg500. [DOI] [PMC free article] [PubMed] [Google Scholar]
- 33.Crooks GE, Hon G, Chandonia JM, Brenner SE. Genome Res. 2004 Jun;14:1188. doi: 10.1101/gr.849004. [DOI] [PMC free article] [PubMed] [Google Scholar]
- 34.Tibshirani R. Journal of the Royal Statistical Society Series B-Methodological. 1996;58:267. [Google Scholar]
Associated Data
This section collects any data citations, data availability statements, or supplementary materials included in this article.
Supplementary Materials
SOM without Suppl Tables
Table S1
Table S2
Table S3
