Conservation of transcription factor binding events predicts gene expression across species (original) (raw)
Abstract
Recent technological advances have made it possible to determine the genome-wide binding sites of transcription factors (TFs). Comparisons across species have suggested a relatively low degree of evolutionary conservation of experimentally defined TF binding events (TFBEs). Using binding data for six different TFs in hepatocytes and embryonic stem cells from human and mouse, we demonstrate that evolutionary conservation of TFBEs within orthologous proximal promoters is closely linked to function, defined as expression of the target genes. We show that (i) there is a significantly higher degree of conservation of TFBEs when the target gene is expressed in both species; (ii) there is increased conservation of binding events for groups of TFs compared to individual TFs; and (iii) conserved TFBEs have a greater impact on the expression of their target genes than non-conserved ones. These results link conservation of structural elements (TFBEs) to conservation of function (gene expression) and suggest a higher degree of functional conservation than implied by previous studies.
INTRODUCTION
One of the most important mechanisms for regulation of gene expression is through the binding of transcription factors (TFs) to short DNA motifs within promoter proximal regions (1). Comparisons of the DNA sequences among related species have revealed that many proximal promoter regions show strong evolutionary conservation (2–6). Changes of TF-regulatory networks are thought to play a key role in evolution since they have a direct impact on gene-expression levels (7).
It is now possible to quantitatively study the locations of TF binding in a genome-wide fashion using chromatin immunoprecipitation followed by microarrays or high-throughput sequencing. These experiments do not distinguish between direct and indirect binding of the TF to DNA; hence, here we refer to the observations from these experiments as TF binding events (TFBEs). Studies comparing closely related yeast species have shown that, over evolutionary time scales, it is relatively common for TFBEs to diverge across species (8,9) or even for one factor to take over the regulatory role of another (8–10). These observations demonstrate a significant amount of plasticity in the circuitry regulating transcription. Comparisons between TFBEs in mouse and human have revealed a relatively low degree of conservation of binding events, ranging from 10 to 30%, similar to what was reported in yeast (9,10), in the promoter proximal regions for hepatocytes (11) and embryonic stem cells (ESCs) (12). Although the degree of TFBE conservation is significant, it is considerably lower than the conservation of coding sequences (5,6,13). Moreover, the large number of TFBEs found throughout the genome has raised questions about the specificity of binding and how individual TFBEs influence expression (14–16).
Genome-wide studies of TFBEs have led to the following suggestions: (i) there is a rapid turnover of binding events during evolution (10,16–19); (ii) the regulation of a gene's expression is decoupled from its function such that gene expression and function may be conserved across species even when the mechanisms of transcriptional control could differ (16,20–23); and (iii) the influence of a single TF on gene expression is limited and clusters of TFBEs may be required to control gene expression (1,16,24,25). To quantitatively examine whether the evolutionary conservation of transcriptional control mechanisms is decoupled from the evolutionary conservation of gene expression, it is important to simultaneously consider TFBEs and the expression levels of the target genes. Previous genome-wide studies that evaluated the degree of conservation of TFBEs did not take gene expression into consideration (9–11,22). We hypothesized that conservation of gene expression across species is positively correlated with the conservation of the promoter TFBEs. To test this hypothesis, we combined existing human and mouse genome-wide TF binding data [four TFs in hepatocytes (11) and two TFs in ESCs (12,26)] with gene-expression data for the same two cell types (27–29). We show that the evolutionary conservation of TF binding is correlated with conservation of gene expression at the individual gene level. Our analyses also provide evidence that synergistic binding among TFs is evolutionary conserved and that conserved TFBEs have a larger impact on expression levels than non-conserved TFBEs.
MATERIALS AND METHODS
Data sources
We considered existing chromatin immunoprecipitation combined with microarray (ChIP–chip) measurements using custom-made arrays quantifying the binding events of four TFs in human and mouse hepatocytes: FOXA2, HNF1A, HNF4A and HNF6 (11). The probes in this dataset covered a region of [−5, +5] kb centered on the annotated transcription start sites of 4022 human–mouse orthologous genes selected based on the RefSeq annotation and BLAST searches. We adopted the same definition as Odom et al. (11) whereby the binding of a TF is considered to be conserved from mouse to human if it is present at orthologous locations in both species (anywhere within the 10-kb window defined above). For a given TF, the degree of binding conservation in human with respect to mouse is defined as the conditional probability  that is, the probability that there is a binding event in human given the presence of a binding event in mouse. It should be noted that this is not symmetric, that is, the quantity
  is not necessarily the same as
  .
.
We combined the TF binding information with the gene-expression data from the GNF Gene Atlas for the liver obtained using microarrays (29). Out of the original set of 4022 genes with binding information, we kept only the 3051 genes for which there was expression information in the liver for both species. For those genes where there was more than one probe in the microarray, we used the median expression across probes. The GNF data set contains duplicate measurements, providing array intensity data (assumed to be approximately proportional to gene-expression levels) and also a ‘present’/‘absent’ binary call. The analyses in Figures 1–3 are based on the present/absent binary calls. Based on the present/absent categorization, we defined a gene as expressed if it was labeled as present in either one of the replicates. Requiring presence in both replicates reduces the number of expressed genes, but it does not change the conclusions of our study. From the set of 3051 genes for which both binding and expression data were available, there were 422 genes (13.8%) which were expressed in both species, 676 genes (22.2%) which were expressed in mouse but not human, 345 genes (11.3%) which were expressed in human and not mouse, and 1608 genes (52.7%) that showed no expression in either species. The analyses in Figure 4, Supplementary Figure S2 and S3 are based on the geometric mean of the intensity values for each gene. In Supplementary Figure S2 we show the effects of changing the threshold for determining whether a gene is expressed or not. To examine whether the conclusions were specifically dependent on expression in the liver, we repeated the analyses using the same four TFs but the expression data from a different tissue (cerebellum).
Figure 1.

Genes that are expressed in both human and mouse are more likely to have conserved TFBEs. (A) Schematic illustration of the different conditional gene sets and conditional probability computations for HNF4A (all the numbers and statistics for the other TFs are presented in parts B and C and Table 1). The outer oval (black) represents the total number of genes with a HNF4A TFBE in humans (n = 956; T_Hs). The gray oval represents the subset of genes that show an HNF4A TFBE in humans and which are expressed in the human liver (n = 344; T_Hs, E_Hs). The filled black oval represents the subset of those genes with a HNF4A binding event in human that also show a Hnf4a binding event for the ortholog genes in mouse (n = 307; T_Hs, T_Mm). The filled gray oval represents those genes that have conserved TFBEs and are expressed in both species (n = 106; T_Hs, E_Hs, T_Mm_, E_Mm). (B and C) The _y_-axis indicates the probability of finding a TFBE peak in hepatocytes or ESCs for human (B) or mouse (C) conditional on the presence of TFBE on the other species or on gene expression. The TFBE data are derived from the ChIP–Chip experiments reported in Refs. (11,12,26). The probability of finding a TFBE peak in human, P(_T_Hs), is shown as empty black bars in B [similarly, the probability of finding a TFBE peak in mouse, P(_T_Mm), is shown as empty black bars in C]. The probability of finding a TFBE consistently increases for those genes that are expressed: P(_T_Hs _| E_Hs) in B (empty gray bars, cf. empty black bars) and P(_T_Mm _| E_Mm) in C (empty gray bars, cf. empty black bars). The probability of finding a TFBE in one species given that there is a binding event in the other species is indicated by filled black bars (P(_T_Hs | T_Mm) in B and P(T_Mm| T_Hs) in C). The probability of finding a TFBE in one species given that there is a binding event in the other species and that the gene is expressed in both species is indicated by filled gray bars (P(T_Hs | T_Mm, E_Hs, E_Mm) in B and (P(TMm | T_Hs, E_Hs, E_Mm) in C). *P < 10−3; **P < 10−10 (see ‘Materials and Methods’ section).
Figure 2.

Groups of TFBEs are more likely to be conserved than isolated TFBEs and their targets are more likely to be expressed. (A) The _y_-axis indicates the ratio between the probability of observing a conserved group of two TFBEs and the product of the probabilities of observing conservation of each TFBE. Using the nomenclature defined in the text, the _y_-axis indicates  for human (black) and
  for mouse (gray). Assuming independence, this ratio should take a value of 1 (dashed line). The values for each individual pair as well as for higher-order combinations of TFs are presented in Table 1. The ‘asterisks’ denote significant difference from 1 as assessed by a binomial test (P < 0.05). ‘AVG’ denotes the average ratio for all six TF pairs in the liver data set (the error bars show the standard deviation). (B) Let P(Es | 1Ts, 2Ts, … , nTs) indicate the probability of gene expression in species s (s = Human or Mouse) given the presence of up to n different TFBEs (n = 2 in this figure). If the binding events of different TFs were independent, we would expect that the probability of a gene being expressed given the presence of multiple TFBEs would be the product of the individual probabilities of gene expression given each TFBE. The _y_-axis shows the probability ratio
  for human (black) and mouse (gray). This ratio should take a value of 1 under the null hypothesis of independence (dashed lines). We also considered higher-order combinations of TFs. For n = 3, the mean expression probability ratio was 6.11 for Hs and 3.42 for Mm. For n = 4, the expression probability ratio was 11.57 for Hs and 5.30 for Mm. As emphasized in the text the number of genes with n = 3 or n = 4 TFs was small; therefore this Figure focuses on the results for n = 2. The ‘asterisk’ denotes significant difference from 1 as assessed by a binomial test (P < 0.05). ‘AVG’ denotes the average ratio for all six TF pairs in the liver data set (the error bars show the standard deviation).
Figure 3.

For most pairs of TFs, rewiring events are more common between genes with conserved expression. (A) Definition of TF rewiring events. We consider a human gene (black line) and its mouse ortholog (gray line). The arrows indicate the transcription start site. The square and circle denote two different TFs. We illustrate TFBE conservation (top: a binding event is found in both species) and rewiring (bottom: for the same gene, one TF is found in one species and a different TF is found in the other species). (B and D) The proportion of rewired binding events is computed as the number of rewiring events divided by the number of rewiring events plus the number of gains and losses [ ]. For a given TF, we added all the rewiring events where that factor was present in human (B) or mouse (D). The filled bars were computed using all genes whereas the empty bars were computed using only those genes that were expressed in both species. *P < 0.01; P < 10−7 (binomial test). (C) We carried out a permutation test whereby the ‘conserved expression’ status was assigned at random (respecting the proportion of genes with conserved expression). Here, we summed the number of rewiring events for all TF pairs. For each permutation we counted the number of rewiring events that occurred between two genes with conserved expression. The histogram shows the distribution of results from 100 000 permutations and the arrow indicates the actual number of rewiring events found in the data. The dashed line denotes the mean of the distribution and the dotted lines denote 1, 2 and 3 SD.
Figure 4.

Conserved TFBEs have a greater impact on gene expression. The full lines show the square of the Pearson correlation coefficient (_R_2, fraction of variance explained) between the predicted gene-expression levels and the actual gene-expression levels for human (A) and mouse (B). The _x_-axis indicates the gene-expression level enrichment cut-off criterion (see ‘Materials and Methods’ section). For the Hs data, the number of genes included in the analysis decreases from 2322 for an enrichment ratio of 1.2 to 555 for an enrichment ratio of 3.5. For the Mm data, the number of genes included in the analysis decreases from 1806 for an enrichment ratio of 1.2 to 209 for an enrichment ratio of 3.5. The models are described in the text and in the ‘Materials and Methods’ section. To assess whether the _R_2 values could be obtained by chance, we constructed a null hypothesis by randomly shuffling the map between gene expression and TFBE data. The dotted lines show the _R_2 obtained after averaging 1000 shuffle iterations (the color and the dashes correspond to the model with the same solid or dashed line). The error bars represent standard deviations from n = 100 cross-validation steps where 10% of the genes were held out in each iteration.
To examine whether the conclusions were specifically linked to these particular four TFs, we repeated the same analysis for a different set of TFs and a different tissue: we considered the TF binding data for OCT4 and NANOG in ESCs in human (26) and mouse (12). The human binding data were obtained using ChIP–chip with a custom-made array covering the [−8, +2] kb region surrounding 17 917 promoters. The mouse experiments used a ChIP-Seq approach. The TF binding data set was combined with the expression data from references (27,28). We restricted the analyses to 6509 genes for which we could obtain TF binding data in humans and mice, expression data in humans and mice and a well-defined ortholog as defined by the array-manufacturer (28). Of these 6509 genes, 226 (3.5%) were expressed in both human and mouse, 511 (7.8%) were expressed in human but not mouse, 1400 (21.5%) were expressed in mouse but not human and 4372 were not expressed in either species (67.2%).
Data analyses
We computed the probability of TF binding conditional on conservation and gene expression. We used a Fisher test based on a 2 × 2 contingency table to calculate the statistical significance of these conditional probabilities. In this contingency table, the rows correspond to the number of conserved and non-conserved events in Hs and the columns correspond to the equivalent quantities in Mm. To determine the statistical significance of conservation conditioned on expression against the probability of observing conserved binding we employed a χ2-test, with four categories: TF bound in both species, TF bound in human but not mouse, TF bound in mouse but not human and no TF binding. The expected count in each category under the null hypothesis was based on the relative proportion of each category for the full set of genes. Throughout, when performing multiple comparisons, we used a Bonferroni correction and we report the highest _P_-value (i.e. the worst case scenario).
For the analysis of the conservation of multiple TFBEs (Figure 2), a ‘group of n TFBEs’ was defined by the presence of n different TFBEs in the 10-kb window centerd on the TSS of a gene (see Supplementary Figure S5 for the distribution of distances). This definition ignores groups that include multiple binding events for the same TF as well as the relative distance and positions among the binding events (Supplementary Figure S5). For a group of n binding events (n = 2, 3 or 4 different TFs) we computed the joint probability of finding a gene with binding events for all n TFs in one species given the presence of all n TFs in the other species:  . Under the null hypothesis, the conservation of different binding events is independent of each other. We therefore considered deviations from the null hypothesis by computing the ratio:
 (six pairs for n = 2, four triplets for n = 3 and one quadruple for n = 4). This formula corresponds to human and a similar formula applies to mouse by switching Hs and Mm. We used a binomial test to determine if the number of conserved pairs of TFBEs was greater than expected under the null hypothesis where the probability of conservation of a pair is given by the product of the marginal conservation probabilities for the two TFs. A similar scheme was used for testing the significance of the increased expression probability (Figure 2B). Here the null hypothesis was that the probability of observing an expressed gene with a pair of TFBEs i and j is given by
  .
.
In Figure 3, we considered the amount of rewiring of TFBEs. We computed the probability that a non-conserved TFBEs is rewired with respect to the other species, 
 , where ‘∼’ represents the absence of a TFBE. The fraction of rewired binding events shown in Figure 3 is defined as the arithmetic mean of the pair-wise rewiring probabilities,
 . For the randomized controls, we fixed the conserved TFBEs, permuted only the non-conserved ones and computed the average rewiring probability. The histogram in Figure 3D shows the distribution from 100 000 reshufflings.
In Figure 4, we asked whether conservation of TFBEs from Mm to Hs improves the predictability of the quantitative levels of gene expression using linear regression. For the linear regression analyses we first normalized all the indicator variables and the log of the gene-expression values by subtracting the mean and dividing by the standard deviation (30). The models are based on the following expression:
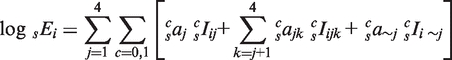
where the first term within the square brackets represents individual TFBEs, the second term represents pairs of TFBEs and the third term represents triplets of TFBEs. On the left hand side, sEi denotes the expression level of gene i in species s (s = Hs or Mm). The first sum runs over the four liver TFs. The second sum takes conservation into account: c takes the value 0 for non-conserved TFBEs and 1 for conserved TFBEs. sIij is a binary variable that takes the value 1 if TF j shows a binding event in the promoter region of gene i in species s (and 0 otherwise); sIijk is a binary variable that takes the value 1 if TFs j and k show a binding event in the promoter region of gene i in species s (10-kb window centered on the TSS) and sIi∼j is a binary variable that takes the value 1 if the three TFs except for j show a binding event in the promoter region of gene i in species s. The coefficient  describes the contribution of TF j to gene expression in species s;
  describes the contribution of the pair of TFs j and k;
  describes the contribution of the triplet of TFs excluding j. For the various models, some of the parameters were set to zero as described below.
The simplest model (M4), only has four parameters with one coefficient saj for each TF (no sum over c,  and
and  ). The next model (MC8) also accounts for conservation and contains eight coefficients,
  . The next model includes pairs of TFs (MP10) and includes sajk for a total of 10 coefficients (no sum over c;
  ). Adding conservation to MP10 gives us MCP20 which includes
  and has a total of 20 parameters. The last two models have coefficients for triplets of TFs and they have a total of 14 (MT14) and 28 (MCT28) coefficients.
All the linear regression _R_2 values were obtained using 10-fold cross-validation (100 iterations). Because these models have different number of parameters, we used the Akaike Information Criterion adjusted for small sample sizes [AICc to penalize for model complexity (31)]. For the model complexity comparison, the AICc is defined as  where k is the number of regression coefficients (indicated above for each model), n is the number of genes included in the linear regression and RSS is the sum of the squared errors for the regression model. When comparing two models, the enhanced probability for the model with lower AICc is given by
 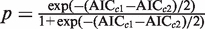 , where AIC_c_1 < AIC_c_2 (32).
For the motif analysis we used the software Weeder with default parameters (33). Weeder reports the best motif with length 6, 8, 10 and 12 bp. We focused only on the length which was closest to the one for the motifs reported in (11) and ignored the results for the other lengths.
RESULTS
We hypothesized that genes that show conserved expression in both human (Hs) and mouse (Mm) would reveal a higher degree of conservation of regulatory TF binding in the corresponding promoter regions. To test this hypothesis we considered the chromatin immunoprecipitation combined with microarray (ChIP–chip) genome-wide measurements of TF binding within the promoter region (−5 to +5 kb with respect to the transcription start site) in the liver for four TFs in Hs and Mm: FOXA2, HNF1A, HNF4A, HNF6 (11). The ChIP–chip measurements could reflect indirect binding and do not necessarily reflect the direct binding of the TF proteins to DNA; we refer to these measurements as TFBEs throughout the manuscript. We combined this data set with the microarray gene-expression measurements in the liver reported in (29). The data set used in the current study consisted of 3051 genes for which we had TF binding and gene-expression data in both species (see ‘Materials and Methods’ section).
We computed the probability of observing a binding event for each TF on a given promoter and species depending on whether the TF binds the orthologous gene in the other species. The computation is illustrated in Figure 1A for the HNF4A case (we present all the numbers and statistics for each of the four TFs in Figure 1B and C and Table 1). Out of the 3051 genes, there were 956 genes that showed a binding event for HNF4A in Hs based on the peak detection in the ChIP–chip study (11) (empty black oval in Figure 1A). The fraction 956/3051 = 0.31 is defined as P(_T_Hs) (empty black bars in Figure 1B). Similarly, out of the 3051 genes, there were 512 genes that showed a binding event for Hnf4a in Mm and we defined the fraction 512/3051 = 0.17 as P(_T_Mm) (empty black bars in Figure 1C). By considering the orthology between Hs and Mm genes (11), we determined that 307 genes had a binding event for human HNF4A and mouse Hnf4a (filled black oval in Figure 1A). The fraction 307/512 = 0.60 is defined as 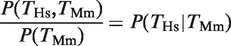 , that is, the conditional probability of finding a binding event for HNF4A in Hs given the presence of a binding event for Hnf4a in Mm (filled black bars in Figure 1B). The probability of finding a TFBE in a given gene promoter in Hs conditioned on the presence of a TFBE for the orthologous promoter in Mm,
  , was higher than the overall probability of finding a TFBE in Hs, P(_T_Hs), for all four TFs (Figure 1B compare filled against empty black bars). The same observation holds for Mm:
  (Figure 1C). The average increase in probability was
  = 3.1 (P < 10−12, Fisher test), where <…> indicates the average over all four TFs. This probability increase is the same for Hs and Mm since
  . The increased probability is comparable to the one reported in (11).
Table 1.
Groups of TFBEs in the promoter regions of expressed genes are more likely to be conserved than isolated TFBEs
| TF | _N_Hs,Mm (Cons) | NHs | NMm | Conservation ratio | TF & Expression | ||||||
|---|---|---|---|---|---|---|---|---|---|---|---|
| FOXA2 | HNF1A | HNF4A | HNF6 | Hs | Mm | Hs | Mm | Cons | |||
| X | 55 | 121 | 459 | 50 | 246 | 19 | |||||
| X | 40 | 199 | 169 | 80 | 95 | 20 | |||||
| X | 307 | 956 | 512 | 344 | 285 | 106 | |||||
| X | 37 | 119 | 259 | 43 | 148 | 17 | |||||
| X | X | 11 | 46 | 72 | 5.4 | 1.2 | 29 | 49 | 9 | ||
| X | X | 36 | 94 | 248 | 2.0 | 1.9 | 41 | 150 | 15 | ||
| X | X | 12 | 38 | 111 | 6.3 | 1.5 | 20 | 173 | 9 | ||
| X | X | 30 | 183 | 89 | 2.4 | 4.1 | 74 | 60 | 17 | ||
| X | X | 7 | 35 | 54 | 3.8 | 5.0 | 20 | 42 | 6 | ||
| X | X | 20 | 93 | 133 | 1.8 | 2.1 | 35 | 94 | 12 | ||
| X | X | X | 10 | 33 | 41 | 10.6 | 8.4 | 28 | 39 | 8 | |
| X | X | X | 10 | 33 | 84 | 6.7 | 11.6 | 17 | 59 | 8 | |
| X | X | X | 6 | 17 | 34 | 12.4 | 43.6 | 11 | 27 | 5 | |
| X | X | X | 7 | 44 | 57 | 7.7 | 10.3 | 19 | 34 | 6 | |
| X | X | X | X | 6 | 17 | 29 | 85.2 | 38.7 | 11 | 23 | 5 |
The key question in our study involves quantitatively assessing the relationship between the probability of finding a TFBE [P(_T_Hs) and P(_T_Mm)] and the probability of expression of the target gene [P(EHs) and P(EMm)]. We observed that knowledge about whether a gene is expressed or not increased the probability of finding a TFBE. Of the 3051 genes that we considered, 767 were expressed in the human liver (see ‘Materials and Methods’ section for definition of whether a gene is expressed or not based on the microarray data; see also Supplementary Figure S2). Of these, 344 genes showed a HNF4A binding event (empty gray oval in Figure 1A). The fraction 344/767 = 0.45 is defined as  , that is, the conditional probability of finding a binding event in human liver given that the gene is expressed in the liver (empty gray bars in Figure 1B). On average, expressed genes showed a higher probability of having a TFBE:
  = 1.53 (P < 10−3, Fisher test) in Hs and
  = 1.55 (P < 10−7, Fisher test) in Mm (compare black versus gray empty bars in Figure 1B and C). This increase is expected since the TFs in this study are known to be important activators in hepatocytes (34). As a negative control, we repeated the analysis using gene-expression data from the same database for cerebellum tissue instead of liver tissue. In this case, the corresponding ratios drop to 0.95 (Hs) and 1.04 (Mm), values which were not significantly different from the expected null ratio of 1.0. The analysis enables us to quantify the relative effect of gene-expression and TFBE conservation on P(_T_Hs): the ratio
  was 2.0 (P < 10−16, binomial test) for Hs and the ratio
  was 1.97 (P < 10−16, binomial test) for Mm. This shows that the presence of a TFBE in the orthologous gene in a related species is more informative than the gene's expression when trying to predict TFBEs.
To enquire whether the conservation of gene expression was correlated with the conservation in TFBEs, we considered those genes that were expressed in the liver in both species. There were 139 genes that had a binding event for Hnf4a in Mm and were expressed in both species and there were 106 genes that had a binding event for HNF4A in Hs, a binding event for Hnf4a in Mm and were expressed in both species (filled gray oval in Figure 1A). The fraction 106/139 = 0.76 defines  , that is, the conditional probability of finding a binding event in Hs liver given that there is a binding event in the Mm liver and that the gene is expressed in both species (filled gray bars in Figure 1B). Consistent with our hypothesis, we observed that the degree of TFBE conservation was higher for those genes that were expressed in the liver in both species for all four TFs. The increase in the probability of TFBE conservation for the subset of genes that showed conserved expression was on average
  = 1.59 for Hs (range = 1.28–1.97) and
  = 1.62 for Mm (range = 1.35–1.89) (Figure 1B and C, compare black versus gray filled bars). These ratios were significantly different from 1 (χ2-test, four degrees of freedom (P < 10−10). Another way of demonstrating the relationship between TF binding conservation and gene-expression conservation is by considering the ratio
  = 6.05 (_P_ < 10−17, Fisher test). The fact that the ratio is >1 indicates that conserved TF binding and conserved gene expression are not independent.
Since the results in Figure 1 depend on a binary classification of TF binding and gene expression, we also investigated how the outcome is affected by the choice of cut-offs. We found that almost all TFBEs are located within 2.5 kb of the TSS (Supplementary Figure S1A and S1B). Hence, using a smaller distance cut-off for the definition of a promoter does not significantly change the conclusions of our study (Supplementary Figure S1C and S1D). We also investigated the effect of using a more or less stringent cut-off for determining which genes are considered ‘expressed’ based on the scalar values obtained from the gene-expression data (Supplementary Figure S2). As expected, a more lenient threshold that includes a large fraction of all the genes leads to smaller ratios  and
and  (i.e. smaller effects of gene-expression conservation). In the extreme of using all genes, these ratios become 1. With the exception of HNF4A, the results of varying the gene-expression cut-off in Supplementary Figure S2 confirmed the results obtained using the ‘absence’/‘presence’ gene calls in Figure 1.
Conserved TFBEs may show stronger binding than the non-conserved ones and this might explain why they are detected more frequently in both species and why they are better predictors of gene expression. However, comparing the binding strengths of the conserved TFBEs and the non-conserved TFBEs did not reveal any systematic difference (Supplementary Figure S4). We followed up the comparison of binding strengths by characterizing the DNA motifs found at the conserved and non-conserved TFBEs. We separated the peak sequences into conserved and non-conserved groups and ran the de novo peak-finding algorithm Weeder on each group separately (33). The highest-ranking motif from each category showed good agreement between conserved and non-conserved genes and, in the few cases where this did not happen, the matching motif was found as the second or third one reported by the algorithm.
To assess the generality of our findings, we repeated the analysis using a different set of TFs and a different tissue by considering genome-wide TFBE measurements of OCT4 and NANOG within the promoter regions (from −8 to +2 kb with respect to the TSS) and expression profiles of 6509 genes in ESCs in Hs and Mm (12,26–28). We found a pattern similar to the one in hepatocytes. The degree of conserved TFBEs was between 6 and 19%. When we considered the conservation of gene expression, the degree of conservation of TFBEs increased to 40% (OCT4) and 35% (NANOG) for Hs and 33% (Oct4) and 13% (Nanog) for Mm (Figure 1B and C), (χ2-test P < 10−3). Moreover, there was evidence for a dependence between conserved binding and expression since  = 4.84 (P = 0.0007 for OCT4 and 0.16 for NANOG, Fisher test). The above analyses support the hypothesis that genes whose expression is conserved across species are more likely to have conserved TFBEs in their promoter regions.
Several studies have suggested that the expression of many metazoan genes is regulated by more than one TF, with clusters of TFs forming _cis_-regulatory modules (24,35–40). We hypothesized that, if coordinated action among TFs is important for regulating the expression of the target genes, we would expect a higher degree of conservation for groups of TFBEs than for the same TFBEs occurring in isolation. Let P(1_T_Hs) and P(2_T_Hs) indicate the probability that TF ‘1’ and TF ‘2’ show a binding event in the Hs data [similarly, P(1_T_Mm) and P(2_T_Mm) for Mm]. Let  indicate the probability that both TFs bind to the promoter region of a given gene and let
  indicate the probability that the group formed by the two TFs appears in humans conditional on the group's presence in mouse. According to the null hypothesis assuming independent conservation of TFBEs, the probability that the group is conserved is given by the product of the probabilities that each individual TFBE is conserved:
  . Contrary to the null hypothesis, we find that the degree of conservation for pairs of TFs in the liver was increased on average by a factor of 3.6 for Hs and 2.6 for Mm (Figure 2A and Table 1). For ESCs, pairs of TFBEs were 8.2 times more likely to be conserved for Hs and 6.2 times more likely for Mm (Figure 2A and Table 1). For most (but not all) TF pairs, the conservation of groups of TFs could not be accounted by the null hypothesis based on independent conservation of TFBEs (Binomial test; Figure 2A). These definitions can be readily extended to higher-order combinations of TFBEs (triplets, quadruplets, etc). The number of conserved pairs, triplets and quadruplets for all possible combinations among the four liver TFs can be found in Table 1. The degree of conservation for triplets and quadruplets in the hepatocytes increased by a factor of 9.4 and 85.2 for Hs and by a factor of 18.5 and 38.7 for Mm (Binomial test, P < 10−6). A potential caveat with this analysis, particularly for triplets and quadruplets, is that the numbers used to calculate the enrichment ratios are quite small (Table 1) and consequently they are quite sensitive to noise. Further evidence in favor of the functional significance of groups of TFs comes from the observation that genes with groups of TFBEs are more likely to be expressed (Figure 2B). The increased conservation of groups of TFBEs located within the same promoter and the increased expression of the target genes is consistent with the notion that these TFs may interact synergistically to regulate gene expression.
Studies in yeast have revealed that the role of a given TF may be taken over by another TF over evolutionary timescales (9,10). To examine whether this ‘rewiring’ was evident between Hs and Mm, we define TF rewiring as the event that TF 1 but not TF 2 is present at the promoter of a given gene in Hs and that TF 2 but not TF 1 is present at the promoter of the orthologous gene in Mm (Figure 3A). Given the hypothesis that the role of one TF may be assumed by another over evolutionary time, it follows that the number of rewiring events between genes where both genes are expressed in Hs and Mm should be greater than expected by chance. For most (but not all) of the TF combinations, we observed an increase fraction of rewired binding sites in those genes with conserved gene expression compared to all genes both for humans (Figure 3B) and mouse (Figure 3D). The exceptions are FOXA2 in Figure 3B and Hnf1A in Figure 3D. To assess the statistical significance of the difference between the fraction of rewired sites in all promoters versus promoters with conserved expression, we carried out a Monte Carlo simulation whereby the ‘conserved expressed’ labels were randomized amongst the genes. For this analysis, we pooled the rewiring events across all TF pairs to increase the reliability in the analysis. We found that the degree of rewiring within the subset of genes that are expressed in both species is significantly higher than what one would expect by chance (P < 10−5, from 100 000 permutations; Figure 3C). The results suggest a significant degree of plasticity in the regulatory network as was found in yeast (9,10).
Finally, we investigated whether conserved TFBEs have a greater impact on gene expression compared to non-conserved TFBEs. To quantify the relative effect of TFBEs conservation on gene expression, we tried to predict the quantitative levels of gene expression as measured by microarrays (in contrast with the analysis in Figures 1–3 where gene expression was assumed to be binary) (30,41,42). To quantify the relationship between TF binding and gene expression we used a linear regression approach. Our ‘basic’ model (M4) did not include TFBE conservation and used four parameters to predict the expression sEi of gene i in species s (s = Hs or Mm):  where sIij is a binary variable that takes the value 1 if TF j showed a binding event in the promoter region (10 kb centered on the TSS) of gene i in species s and 0 otherwise (where j corresponds to one of the four TFs) and the coefficient aj indicates the contribution of TF j to gene expression. For this analysis we only considered genes that are expressed above a given enrichment level (Figure 4) defined as the ratio between the average log-expression value of the two liver probes divided by the median log-expression of the probes from all other tissues in the GNF Gene Atlas (29). We quantified the goodness of fit in the linear regression by using the _R_2 value between the experimental expression levels and the predictions. All _R_2 values reported below were computed using ten-fold cross-validation. To examine the influence of TFBE conservation on the quantitative levels of gene expression, in our second model (MC8) we used eight binary variables, distinguishing between TFBEs which are conserved and not conserved (see ‘Materials and Methods’ section). For both Hs and Mm we found that the MC8 model, which incorporates TFBE conservation, performs significantly better for all the enrichment cut-off values that we examined [Figure 4; compare solid blue line (M4) and dashed blue line (MC8)]. Furthermore, comparing the coefficients for the different TFBE in MC8, we find that the conserved coefficients were on average eight times larger than the non-conserved ones for Hs and three times larger for Mm, indicating that conserved TFBEs played a larger contribution in determining the expression level in our linear regression model. Our third model (MP10) included six additional coefficients compared to M4, one for each pair of TFBEs to account for the contributions from TF pair wise interactions. Although this model performed better than the basic model, the _R_2 values were lower than those for MC8 which takes conservation into account. Our fourth model (MCP20) included 20 coefficients; two for each TF and two for each TF pair to account for the conserved individual TFBEs and the conserved pairs of TFBEs. The final models (MT14 and MCT28) involved adding four parameters to MP10 or eight parameters to MCP20 to account for the TF triplets; both MCP20 and MCT28 provided an additional improvement of the _R_2. We examined a model that included coefficients for the simultaneous binding of all four TFs but this model did not provide any additional improvements, presumably due to the small number of genes with all four TFBEs in this data set. In Hs, when conservation was taken into account the relative improvement of _R_2 is 42 ± 6% (MC8 versus M4), 58 ± 10% (MCP20 versus MP10) and 48 ± 15% (MCT28 versus MT14), where the average is taken over all enrichment cut-offs used in Figure 4. In Mm, when conservation was taken into account _R_2 improved by 15 ± 4% (MC8 versus M4), 16 ± 4% (MCP20 versus MP10) and 18 ± 5% (MCT28 versus MT14). The curves in Figure 4 never cross, indicating that the relative performance of the models is qualitatively similar for all enrichment values.
While the increasingly more sophisticated models account for more complex biological mechanisms and provide a better fit, they also add free parameters. To take the model complexity into account, we used the Akaike Information Criterion adjusted for small sample size (AICc) to penalize for model complexity (31,32). The AICc value enables us to compare the models with different numbers of free parameters. The AICc can be used to rank competing models for the same data set and the model with the lowest AICc provides the best trade-off between precision and complexity (Supplementary Figure S3). The models including conservation have lower AICc values for both species over a wide range of enrichment cut-offs, even for the models including triplets of TFBEs (i.e. all curves are mostly above 0 in Supplementary Figure S3). For each model family (single TFBEs, TFBE pairs, TFBE triplets) we calculated ΔAICc = AICcMX − AICcMCX, which can be used to estimate the relative likelihood of each model given the evidence provided by the data (32). The ΔAICc was around 20 providing a strong case in favor of the more complex models including conservation (Supplementary Figure S3).
DISCUSSION
Our study provides only initial steps towards characterizing the evolution of transcriptional circuits and several assumptions and caveats should be noted. An important assumption in our study is that the TFs function as activators. This is likely to be true for the hepatocyte TFs (34), whereas the evidence is more ambiguous for OCT4/NANOG (26). A caveat of our work is that we merged data sets from different studies to compare TFBEs and gene expression. Clearly, it would be better to examine the same cells simultaneously quantifying both binding events and gene expression. Differences in experimental procedures and sample preparation between the studies probably introduce additional noise. Thus, the enhanced TFBE conservation for genes with conserved expression reported here likely constitutes a lower bound to the actual degree of TFBE conservation.
Our results show a correlation between conservation of TFBEs and conservation of the target gene expression. Many studies of genome-wide TF binding have revealed tens of thousands of binding events for a single TF and this has raised questions about the functional significance of these binding events (11,15). Our results show that the subset of binding events that are conserved across species have a greater impact on gene expression compared to the ones that are not conserved. This suggests that a fraction of the observed binding events may have little functional significance and that comparative studies of TF binding can serve as an important guide for revealing key regulatory binding events. As shown in our study, it is not only helpful to have information about TF binding in other species when predicting gene expression, the reverse is also true as information about the expression of orthologous target genes helps us predict the presence of TFBEs.
Several previous studies have attempted to quantitatively predict gene-expression levels from TF binding information. These approaches have been more common in prokaryotic systems and in yeast (30,41–43). Methods based on bioinformatics predictions of TFBEs in yeast have achieved an _R_2 value of 0.30 (30). The values that we obtained are consistent with other studies that aim to predict expression levels in Mm; for example an _R_2 value of ∼0.1 was reported in references (43,44). Independent of the absolute values of _R_2, the main comparison in our study pertains to the importance of TFBE conservation on _R_2 (Figure 4). We observed that _R_2 values improved by ∼30% when taking conservation of TFBEs into account. The fact that conserved TFBEs have a larger impact on our ability to quantitatively predict the expression levels compared to non-conserved TFBEs is consistent with the notion that conservation of TFs and their corresponding binding events over evolutionary time scales is linked to biological function (45).
The few available genome-wide studies comparing TFBEs between Hs and Mm have revealed that only between 10 and 30% of the binding events are conserved between these two species (11,12,26). This relatively low degree of conservation has been interpreted to imply a significant degree of plasticity of the regulatory mechanisms at evolutionary time scales. Using the target gene expression as a proxy for TFBE function, we investigated the degree of TFBE conservation between Hs and Mm in genes where the expression is conserved across species. We observed that genes with conserved expression are almost twice as likely to have conserved TFBEs compared to the overall set of TFBEs. The higher degree of conservation is consistent with the conclusions from a similar but smaller study of 51 human genes where binding events that had been experimentally validated in rodents were analyzed (21) and a recent study of six species of Drosophila (16). We also found evidence for evolutionary conserved groups of TFBEs, involving 2–4 different TFs, which could indicate evolutionary conserved synergistic interactions among groups of TFs. The enhanced conservation of TFBEs for expressed genes does not preclude plastic changes in gene-expression control whereby a TF acquires a large set of new binding events (Figure 3). In addition to the plasticity in TF binding emphasized in previous studies (9,10), our observations reveal that combining functional aspects of gene regulation (gene-expression measurements) with measurements of TFBEs may enhance our understanding of the evolution of transcriptional regulatory circuits.
SUPPLEMENTARY DATA
Supplementary Data are available at NAR Online.
FUNDING
The Klingenstein Fund; the Whitehall foundation, National Institutes of Health (R21EY019710); National Institutes of Health New Innovator Award (DP2OD006461) and National Science Foundation (NSF 0954570). Funding for open access charge: National Institutes of Health.
Conflict of interest statement. None declared.
Supplementary Material
Supplementary Data
ACKNOWLEDGEMENTS
The authors would like to thank Erik Hemberg, Anders Ståhlberg, Gabriel Corfas and Jesse Gray for comments on the manuscript.
REFERENCES
- 1.Arnone M, Davidson E. The hardwiring of development: organization and function of genomic regulatory systems. Development. 1997;124:1851–1864. doi: 10.1242/dev.124.10.1851. [DOI] [PubMed] [Google Scholar]
- 2.Boffelli D, McAuliffe J, Ovcharenko D, Lewis KD, Ovcharenko I, Pachter L, Rubin EM. Phylogenetic shadowing of primate sequences to find functional regions of the human genome. Science. 2003;299:1391–1394. doi: 10.1126/science.1081331. [DOI] [PubMed] [Google Scholar]
- 3.Boffelli D, Nobrega MA, Rubin EM. Comparative genomics at the vertebrate extremes. Nat. Rev. Genet. 2004;5:456–465. doi: 10.1038/nrg1350. [DOI] [PubMed] [Google Scholar]
- 4.McGuire AM, Hughes JD, Church GM. Conservation of DNA regulatory motifs and discovery of new motifs in microbial genomes. Genome Res. 2000;10:744–757. doi: 10.1101/gr.10.6.744. [DOI] [PubMed] [Google Scholar]
- 5.Li H, Rhodius V, Gross C, Siggia ED. Identification of the binding sites of regulatory proteins in bacterial genomes. Proc. Natl Acad. Sci. USA. 2002;99:11772–11777. doi: 10.1073/pnas.112341999. [DOI] [PMC free article] [PubMed] [Google Scholar]
- 6.Woolfe A, Goodson M, Goode DK, Snell P, McEwen GK, Vavouri T, Smith SF, North P, Callaway H, Kelly K, et al. Highly conserved non-coding sequences are associated with vertebrate development. PLoS Biol. 2005;3:e7. doi: 10.1371/journal.pbio.0030007. [DOI] [PMC free article] [PubMed] [Google Scholar]
- 7.King M, Wilson A. Evolution at two levels in humans and chimpanzees. Science. 1975;188:107–116. doi: 10.1126/science.1090005. [DOI] [PubMed] [Google Scholar]
- 8.Tuch BB, Li H, Johnson AD. Evolution of eukaryotic transcription circuits. Science. 2008;319:1797–1799. doi: 10.1126/science.1152398. [DOI] [PubMed] [Google Scholar]
- 9.Borneman AR, Gianoulis TA, Zhang ZD, Yu H, Rozowsky J, Seringhaus MR, Wang LY, Gerstein M, Snyder M. Divergence of transcription factor binding sites across related yeast species. Science. 2007;317:815–819. doi: 10.1126/science.1140748. [DOI] [PubMed] [Google Scholar]
- 10.Tuch BB, Galgoczy DJ, Hernday AD, Li H, Johnson AD. The evolution of combinatorial gene regulation in fungi. PLoS Biol. 2008;6:e38. doi: 10.1371/journal.pbio.0060038. [DOI] [PMC free article] [PubMed] [Google Scholar]
- 11.Odom DT, Dowell RD, Jacobsen ES, Gordon W, Danford TW, MacIsaac KD, Rolfe PA, Conboy CM, Gifford DK, Fraenkel E. Tissue-specific transcriptional regulation has diverged significantly between human and mouse. Nat. Genet. 2007;39:730–732. doi: 10.1038/ng2047. [DOI] [PMC free article] [PubMed] [Google Scholar]
- 12.Loh Y-H. The Oct4 and Nanog transcription network regulates pluripotency in mouse embryonic stem cells. Nat. Genet. 2006;38:431–440. doi: 10.1038/ng1760. [DOI] [PubMed] [Google Scholar]
- 13.Makalowski W, Zhang J, Boguski MS. Comparative analysis of 1196 orthologous mouse and human full-length mRNA and protein sequences. Genome Res. 1997;6:846–857. doi: 10.1101/gr.6.9.846. [DOI] [PubMed] [Google Scholar]
- 14.Wunderlich Z, Mirny L. Different gene regulation strategies revealed by analysis of binding motifs. Trends Genet. 2009;10:434–440. doi: 10.1016/j.tig.2009.08.003. [DOI] [PMC free article] [PubMed] [Google Scholar]
- 15.Tanay A. Extensive low-affinity transcriptional interactions in the yeast genome. Genome Res. 2006;16:962–972. doi: 10.1101/gr.5113606. [DOI] [PMC free article] [PubMed] [Google Scholar]
- 16.He Q, Bardet AF, Patton B, Purvis J, Johnston J, Paulson A, Gogol M, Stark A, Zeitlinger J. High conservation of transcription factor binding and evidence for combinatorial regulation across six Drosophila species. Nat. Genet. 2011;43:414–420. doi: 10.1038/ng.808. [DOI] [PubMed] [Google Scholar]
- 17.Schmidt D, Wilson MD, Ballester B, Schwalie PC, Brown GD, Marshall A, Kutter C, Watt S, Martinez-Jimenez CP, Mackay S, et al. Five-vertebrate ChIP-seq reveals the evolutionary dynamics of transcription factor binding. Science. 2010;328:1036–1040. doi: 10.1126/science.1186176. [DOI] [PMC free article] [PubMed] [Google Scholar]
- 18.Doniger SW, Fay JC. Frequent gain and loss of functional transcription factor binding sites. PLoS Comput. Biol. 2007;3:e99. doi: 10.1371/journal.pcbi.0030099. [DOI] [PMC free article] [PubMed] [Google Scholar]
- 19.Moses AM, Pollard DA, Nix DA, Iyer VN, Li X-Y, Biggin MD, Eisen MB. Large-scale turnover of functional transcription factor binding sites in Drosophila. PLoS Comput. Biol. 2006;2:1219–1231. doi: 10.1371/journal.pcbi.0020130. [DOI] [PMC free article] [PubMed] [Google Scholar]
- 20.Chiba H, Yamashita R, Kinoshita K, Nakal aK. Weak correlation between sequence conservation in promoter regions and in protein-coding regions of human-mouse orthologous gene pairs. BMC Genomics. 2008;9 doi: 10.1186/1471-2164-9-152. [DOI] [PMC free article] [PubMed] [Google Scholar]
- 21.Dermitzakis ET, Clark AG. Evolution of transcription factor binding sites in Mammalian gene regulatory regions: conservation and turnover. Mol. Biol. Evol. 2002;19:1114–1121. doi: 10.1093/oxfordjournals.molbev.a004169. [DOI] [PubMed] [Google Scholar]
- 22.Fisher S, Grice EA, Vinton RM, Bessling SL, McCallion AS. Conservation of RET regulatory function from human to zebrafish without sequence similarity. Science. 2006;312:276–279. doi: 10.1126/science.1124070. [DOI] [PubMed] [Google Scholar]
- 23.McGaughey DM, Vinton RM, Huynh J, Al-Saif A, Beer MA, McCallion AS. Metrics of sequence constraint overlook regulatory sequences in an exhaustive analysis at phox2b. Genome Res. 2008;18:252–260. doi: 10.1101/gr.6929408. [DOI] [PMC free article] [PubMed] [Google Scholar]
- 24.Berman BP, Nibu Y, Pfeiffer BD, Tomancak P, Celniker SE, Levine M, Rubin GM, Eisen MB. Exploiting transcription factor binding site clustering to identify cis-regulatory modules involved in pattern formation in the Drosophila genome. Proc. Natl Acad. Sci. USA. 2002;99:757–762. doi: 10.1073/pnas.231608898. [DOI] [PMC free article] [PubMed] [Google Scholar]
- 25.Davidson EH. The Regulatory Genome. Boston: Academic Press; 2006. [Google Scholar]
- 26.Boyer LA, Lee TI, Cole MF, Johnstone SE, Levine SS, Zucker JP, Guenther MG, Kumar RM, Murray HL, Jenner RG, et al. Core transcriptional regulatory circuitry in human embryonic stem cells. Cell. 2005;122:947–956. doi: 10.1016/j.cell.2005.08.020. [DOI] [PMC free article] [PubMed] [Google Scholar]
- 27.Ramalho-Santos M, Yoon S, Matsuzaki Y, Mulligan RC, Melton DA. ‘Stemness’: Transcriptional profiling of embryonic and adult stem cells. Science. 2002;298:597–600. doi: 10.1126/science.1072530. [DOI] [PubMed] [Google Scholar]
- 28.Sato N, Sanjuan IM, Heke M, Uchida M, Naef F, Brivanlou AH. Molecular signature of human embryonic stem cells and its comparison with the mouse. Dev. Biol. 2003;260:404–413. doi: 10.1016/s0012-1606(03)00256-2. [DOI] [PubMed] [Google Scholar]
- 29.Su A, Wiltshire T, Batalov S, Lapp H, Ching K, Block D, Zhang J, Soden R, Hayakawa M, Kreiman G, et al. A gene atlas of the mouse and human protein-encoding transcriptomes. Proc. Natl Acad. Sci. USA. 2004;101:6062–6067. doi: 10.1073/pnas.0400782101. [DOI] [PMC free article] [PubMed] [Google Scholar]
- 30.Bussemaker H, Li H, Siggia E. Regulatory element detection using correlation with expression. Nat. Genet. 2001;27:167–171. doi: 10.1038/84792. [DOI] [PubMed] [Google Scholar]
- 31.Akaike H. A new look at the statistical model identification. IEEE Trans. Automat. Control. 1974;19:716–723. [Google Scholar]
- 32.Burnham KP, Anderson D. Model Selection and Multi-Model Inference. 2nd edn. New York: Springer; 2002. [Google Scholar]
- 33.Pavesi G, Mauri G, Pesole G. An algorithm for finding signals of unknown length in DNA sequences. Bioinformatics. 2001;17(Suppl. 1):S207–S214. doi: 10.1093/bioinformatics/17.suppl_1.s207. [DOI] [PubMed] [Google Scholar]
- 34.Odom DT, Dowell RD, Jacobsen ES, Nekludova L, Rolfe PA, Danford TW, Gifford DK, Fraenkel E, Bell GI, Young RA. Core transcriptional regulatory circuitry in human hepatocytes. Mol. Sys. Biol. 2006;2:2006.0017. doi: 10.1038/msb4100059. [DOI] [PMC free article] [PubMed] [Google Scholar]
- 35.Gotea V, Visel A, Westlund J, Nobrega M, Pennacchio L, Ovcharenko I. Homotypic clusters of transcription factor binding sites are a key component of human promoters and enhancers. Genome Res. 2010;20:567–577. doi: 10.1101/gr.104471.109. [DOI] [PMC free article] [PubMed] [Google Scholar]
- 36.Murakami K, Kojima T, Sakaki Y. Assessment of clusters of transcription factor binding sites in relationship to human promoter, CpG islands and gene expression. BMC Genomics. 2004;5:16. doi: 10.1186/1471-2164-5-16. [DOI] [PMC free article] [PubMed] [Google Scholar]
- 37.Erwin DH, Davidson EH. The evolution of hierarchical gene regulatory networks. Nat. Rev. Genet. 2009;10:141–148. doi: 10.1038/nrg2499. [DOI] [PubMed] [Google Scholar]
- 38.Tuteja G, Jensen ST, White P, Kaestner KH. Cis-regulatory modules in the mammalian liver: composition depends on strength of Foxa2 consensus site. Nucleic Acids Res. 2008;36:4149–4157. doi: 10.1093/nar/gkn366. [DOI] [PMC free article] [PubMed] [Google Scholar]
- 39.Wasserman WW, Fickett JW. Identification of regulatory regions which confer muscle-specific gene expression. J. Mol. Biol. 1998;278:167–181. doi: 10.1006/jmbi.1998.1700. [DOI] [PubMed] [Google Scholar]
- 40.Kreiman G. Identification of sparsely distributed clusters of cis-regulatory elements in sets of co-expressed genes. Nucleic Acids Res. 2004;32:2889–2900. doi: 10.1093/nar/gkh614. [DOI] [PMC free article] [PubMed] [Google Scholar]
- 41.Ward LD, Bussemaker HJ. Predicting functional transcription factor binding through alignment-free and affinity-based analysis of orthologous promoter sequences. Bioinformatics. 2008;24:i165–i171. doi: 10.1093/bioinformatics/btn154. [DOI] [PMC free article] [PubMed] [Google Scholar]
- 42.Ouyang Z, Zhou Q, Wong WH. ChIP-Seq of transcription factors predicts absolute and differential gene expression in embryonic stem cells. Proc. Natl Acad. Sci. USA. 2009;106:21521–21526. doi: 10.1073/pnas.0904863106. [DOI] [PMC free article] [PubMed] [Google Scholar]
- 43.Kim HD, Shay T, O'Shea EK, Regev A. Transcriptional Regulatory Circuits: Predicting Numbers from Alphabets. Science. 2009;325:429–432. doi: 10.1126/science.1171347. [DOI] [PMC free article] [PubMed] [Google Scholar]
- 44.Consortium TF, Center ROS. The transcriptional network that controls growth arrest and differentiation in a human myeloid leukemia cell line. Nat. Genet. 2009;41:553–562. doi: 10.1038/ng.375. [DOI] [PMC free article] [PubMed] [Google Scholar]
- 45.Xie X, Lu J, Kulbokas EJ, Golub TR, Mootha V, Lindblad-Toh K, Lander ES, Kellis M. Systematic discovery of regulatory motifs in human promoters and 3′ UTRs by comparison of several mammals. Nature. 2005;434:338–345. doi: 10.1038/nature03441. [DOI] [PMC free article] [PubMed] [Google Scholar]
Associated Data
This section collects any data citations, data availability statements, or supplementary materials included in this article.
Supplementary Materials
Supplementary Data