Human Topoisomerase IIα: Targeting to Subchromosomal Sites of Activity during Interphase and Mitosis (original) (raw)
Abstract
Mammalian topoisomerase IIα (topo IIα) plays a vital role in the removal of topological complexities left on DNA during S phase. Here, we developed a new assay to selectively identify sites of catalytic activity of topo IIα with subcellular resolution. We show that topo IIα activity concentrates at replicating heterochromatin in late S in a replication-dependent manner and at centric heterochromatin during G2 and M phases. Inhibitor studies indicate that this cell cycle-dependent concentration over heterochromatin is sensitive to chromatin structure. We further show that catalytically active topo IIα concentrates along the longitudinal axis of mitotic chromosomes. Finally, we found that catalytically inert forms of the enzyme localize predominantly to splicing speckles in a dynamic manner and that this pool is differentially sensitive to changes in the activities of topo IIα itself and RNA polymerase II. Together, our data implicate several previously unsuspected activities in the partitioning of the enzyme between sites of activity and putative depots.
INTRODUCTION
Control of DNA topology in the eukaryotic cell is performed by dedicated enzymes termed topoisomerases (types I and II) and is essential for a number of cellular processes namely transcription, DNA replication, recombination, and chromatin organization. Most of the catalytic activity of type II topoisomerases is devoted to the resolution, in an ATP-dependent manner, of topological complexities (knots, tangles, and catenanes) that remain on DNA after replication (Wang, 1996; Austin and Marsh, 1998). This requires the passage of an intact helix through a transient double-stranded breakage that topoisomerase II (topo II) generates in a separate helix. By contrast, type I enzymes, which induce transient breaks in one strand of the double helix and do not use ATP, perform only the relaxation of the superhelical twist (Wang, 1996). The roles of topo II in chromosome condensation and separation preceding mitosis may, however, be indirect and subsidiary to topology restoration (Wang, 1996; Warburton and Earnshaw, 1997). Mammals have at least two isoforms of topo II, termed α and β. The α isoform, which is essential for cell survival, remains the best characterized. Besides an enzymatic function, topo IIα may also play a structural role in chromatin organization by mediating the attachment of chromatin loops to proteinaceous frameworks during interphase and mitosis (Earnshaw et al., 1985; Gasser et al., 1986; Laemmli et al., 1992; Warburton and Earnshaw, 1997).
In cycling cells topo IIα levels rise steadily throughout S phase, reaching a peak during G2/M stages (Heck et al., 1988; Austin and Marsh, 1998). During G2, when strand passage activity of topo IIα is maximal (Andreassen et al., 1997), cells must pass through a decatenation-sensitive checkpoint before reaching mitosis (Downes et al., 1994). Despite its well-established role during G2 stage, it remains unclear how relevant is the activity of topo IIα through S phase and whether it is exerted preferentially on replicating DNA (Nelson et al., 1986; Andreassen et al., 1997). Perhaps reflecting complexities in regulation of topo IIα activity, the intracellular localization of the protein is dynamic throughout the cell cycle (Rattner et al., 1996; Meyer et al., 1997; Austin and Marsh, 1998). However, little is known about the variables controlling the subcellular distribution of topo IIα and to what extent sites of accumulation correlate with increased catalytic activity.
Recently, it was shown that topo IIα interacts directly with histone deacetylases (HDACs) 1 and 2 (Tsai et al., 2000; Johnson et al., 2001) and with RNA polymerase II (Mondal and Parvin, 2001), raising the interesting possibility that the spectrum of activities of topo IIα may be broader than suspected previously.
During the catalytic cycle of type II topoisomerases, transient covalent topo II-cleaved DNA intermediates, termed cleavage (or cleavable) complexes, are formed that can be stabilized by drugs targeted to the enzyme (Austin and Marsh, 1998; Burden and Osheroff, 1998). Indeed, topo II is targeted by many anticancer drugs and is, therefore, the subject of intense biomedical research. Some of these drugs, called poisons, stabilize cleavage complexes, e.g., etoposide (Burden and Osheroff, 1998). Other drugs, termed inhibitors, interfere with catalytic activity without any effect on cleavable complex stability, e.g., bisdioxopiperazines of the ICRF group (Andoh and Ishida, 1998). In contrast to poisons, inhibitors do not induce DNA lesions (Andreassen et al., 1997; Andoh and Ishida, 1998). Both types of drugs have been widely used in mammalian cell systems to elucidate basic aspects of the biology of topo II. Indeed, the selective trapping of catalytically active topo IIα onto DNA by drugs targeted to the enzyme has provided the basis of biochemical assays that allow either the quantification of its strand-passage activity or the high-resolution mapping of its sites of cleavage on DNA (Wang, 1996). Here, we used this same principle to develop an assay that provides subcellular resolution to identify chromosomal regions enriched in topo IIα-dependent strand-passage activity and some of the factors that influence the subcellular partitioning of the enzyme.
MATERIALS AND METHODS
Chemicals, Antibodies, and DNA Constructs
Trichostatin A (TSA), sodium butyrate, etoposide (VP-16), hydroxyurea (HU), 4,6-diamidino-2-phenylindole (DAPI), and 5-bromo-2′-deoxyuridine (BrdU) were purchased from Sigma-Aldrich (St. Louis, MO); cytosine arabinoside (AraC) was from Calbiochem (La Jolla, CA), and ICRF-187 (also termed dexrazoxane) was from Chiron Laboratories (Zaventem, Belgium). TO-PRO-3 iodide was purchased from Molecular Probes (Eugene, OR). The following antibodies were used for immunostaining at the specified dilutions: mouse monoclonals against topo IIα clone Ki-S1 (Boehringer Mannheim, Indianapolis, IN; 1:80) and clone 3D4 (previously termed PT 1342; Ishida et al., 1996; Stressgen Biotechnologies Corp., Victoria, British Columbia, Canada; 1:80); sheep polyclonal antiserum against BrdU (Biodesign International, Saco, ME; 1:300); mouse monoclonal anti-BrdU clone BU-33 (Sigma-Aldrich; 1:100). We note that the two monoclonal antibodies against topo IIα (clones Ki-S1 and 3D4) used in this work have been extensively characterized before (Ishida et al., 1996; Meyer et al., 1997). Rabbit polyclonal antiserum against acetylhistone H4 (lysine 5; 1:250) and immunoaffinity-purified rabbit IgG against acetyl-histone H4 (lysine 16; 1:250) were purchased from Upstate Biotechnology (Lake Placid, NY). Anti-kinetochore autoimmune antisera specific for CENP-A and CENP-C (1:200) was a kind gift of W. van Venrooij (Katholieke Universiteit, Nijmegen, The Netherlands). FITC (1:150), Texas red (1:150), and Cy5-conjugated (1:300) affinity-purified secondary antibodies were purchased from Jackson ImmunoResearch Laboratories (West Grove, PA). Antibodies that were used for Western blotting include mouse monoclonals antitubulin clone B-5–1-2 (Sigma-Aldrich; 1:2000) and anti–topo IIβ (2010–2; Topogen, Columbus, OH; 1:100); rabbit polyclonal antiserum against poly (A)-binding protein II (1:2000), kindly supplied by Elmar Wahle (Martin-Luther-Universität, Germany); rabbit polyclonal antiserum against lamin B (Serum 16; 1:1000), kindly supplied by Spyros Georgatos (University of Crete, Greece); antitopoisomerase I autoimmune antiserum (1:1000), a kind gift of W. van Venrooij (Katholieke Universiteit, Nijmegen, The Netherlands).
Plasmids carrying EGFP-topo IIα wild-type and an EGFP-topo IIα point mutant for the active Tyr 805 (Tyr 805–Phe 805) were a generous gift of William Beck (University of Chicago, IL) and were previously described (Mo and Beck, 1999).
Cell Culture and Transfection
HeLa cells (American Type Culture Collection [ATCC[rqsb], Rockville, MD) were cultured in DMEM (Gibco Life Technologies, Rockville, MD) supplemented with 2 mM glutamine, nonessential amino acids, antibiotics (gentamicin 50 μg/ml), and 10% FCS and maintained at 37°C with an atmosphere of 5% CO2. Cells were synchronized at different substages of the cell cycle essentially as described before (Ferreira et al., 1997). In brief, mitotic cells were harvested from logarithmically growing cultures by mitotic shakeoff, centrifuged briefly (700 × g, 6 min), and replated at ∼60% confluency. After attachment, cells were grown in presence of hydroxyurea (1.5 mM) for 10–12 h. Cells at early G1 stage were collected ∼4 h after replating of mitotics. After release from the G1/S hydroxyurea block, collection of cells at early stages of S phase was done within the first 3 h, late S phase cells between 4 and 6 h, and cells at G2 stage between 8 and 10 h. A mitotic burst was typically observed at 11–12 h after release from the G1/S block.
Human diploid fibroblasts (WI-38, ATCC) that had stopped to proliferate (passage 26–27) for 5–7 days were used here as senescent cells. Recently thawed, actively proliferating fibroblasts (passage 17–19) were used as controls for estimations of endogenous topo IIα levels.
Plasmids carrying EGFP-topo IIα were introduced into cells using the FuGENE 6 Transfection Reagent according to the instructions provided by the manufacturer (Roche Applied Science, Indianapolis, IN). Chimerical proteins were allowed to express for 18–24 h before manipulation of the cells.
Immunoblotting of topo IIα and Band-depletion Assay
Cell lysates were separated on 6 or 7% SDS-PAGE under reducing conditions, and transferred to nitrocellulose membranes (Schleicher & Schuell, Keene, NH). The membranes were blocked for 1 h with 5% nonfat dry milk powder in PBS and incubated for 2 h with a topo IIα–specific monoclonal (clone Ki-S1; 1:500). Membranes were washed three times with PBS/5% milk and incubated with peroxidase-conjugated affinity-purified goat anti-mouse IgG (Bio-Rad Laboratories, Hercules, CA; 1:1000) for 2 h. The reaction was developed by enhanced chemoluminescent staining according to the specifications of the manufacturer (ECL; Amersham Buchler GmbH, Braunschweig, Germany). 125I-labeled sheep anti-mouse Ig (Amersham Pharmacia Biotech, Piscataway, NJ) was used for quantitation by phosphoimaging (Typhoon 9210, Molecular Dynamics, Sunnyvale, CA; ImageQuant software, Molecular Dynamics) of gel-resolved bands of topo IIα.
Band-depletion assays were used to verify the presence of catalytic intermediates (cleavable complexes, also termed cleavage complexes) of topo IIα that were retained onto substrate DNA after treatment of the cultures with etoposide. Cell lysates were prepared essentially as described previously (Meyer et al., 1997). In brief, cells were lysed in 1× Laemmli′s sample buffer supplemented with PMSF (1 mM) and a commercially available mixture of protease inhibitors (Complete Mini EDTA-free; Roche Diagnostics, Mannheim, Germany; 1 tablet/ml) and incubated at 90°C for 5 min; gross, mechanical fragmentation of the DNA was achieved by passing the sample into a syringe (10 times) through a 25-gauge needle. Subsequently, samples were supplemented with MgCl2 (5 mM), and duplicates were incubated with recombinant endonuclease with DNase/RNase activity (benzonase, 0.4 Units/μl; Sigma-Aldrich) for 30 min at room temperature before separation on 7% SDS-PAGE. Immunoblotting with anti–topo IIα was performed as described above (ECL method).
The Differential Retention of Topo II Assay
This assay was inspired in a previously described, and widely used, assay whereby the specific trapping of covalent topo II-DNA adducts induced by topo II poisons is quantified by immunofluorescence microscopy after comparison with untreated controls (Willmore et al., 1998). HeLa cells growing on coverslips were briefly exposed to ICRF-187 (50 μg/ml; 5–30 min) before collection. Control cells were treated with drug solvent for identical periods of time and processed in parallel. Cells were rinsed in PBS and subsequently extracted on ice, with gentle agitation, for 1.5–2 min with HPEM buffer (30 mM HEPES, 65 mM Pipes, 10 mM EGTA, 2 mM MgCl2, pH 6.9) supplemented with 350 mM NaCl, 0.5% Triton X-100, 1 mM PMSF and a commercially available mixture of protease inhibitors (Complete Mini EDTA-free; Roche Diagnostics). Finally, the cells were fixed in 3.7% formaldehyde in HPEM for 10 min at room temperature before immunostaining.
Immunolabeling Procedures
Whenever the differential retention of topoisomerase (DRT) protocol was not used, i.e., for routine detection of antigens by immunofluorescence, cells growing on coverslips were fixed in 3.7% paraformaldehyde in PBS, pH 7.4, for 10 min at room temperature. Immediately before use cells were permeabilized with 0.1% saponin, 0.1% NP-40 in PBS for 6–7 min at room temperature with mild agitation. Alternatively, cells were fixed/extracted in 3.7% paraformaldehyde in HPEM buffer plus 0.5% Triton X-100 for 10 min at room temperature. Together, the above protocols are referred to throughout the text as “routine fixation.” In some experiments cells were fixed in methanol, or acetone, at –20°C for 10 min. The cells were then washed in PBS containing 0.05% (vol/vol) Tween 20 (PBS-Tw) three times for 5–10 min and were either immediately used or kept at 4°C for a maximum of 4 days. Dilutions of primary and secondary antibodies and washes during immunostaining procedures were done in PBS-Tw. Where appropriate, total DNA was stained with either DAPI (0.5 μg/ml) or TO-PRO-3 iodide (0.3 μM) diluted in PBS. For microscopical analysis, the samples were mounted in Vectashield (Vector Laboratories Inc., Burlingame, CA).
Microscopy and Image Analysis
The samples were examined using a Zeiss 510 confocal microscope (Carl Zeiss, Jena, Germany) with two lasers giving excitation lines at 488, 543, and 630 nm. The data from the channels were collected separately using narrow-band-pass filter settings; in multiple staining experiments, the laser intensities were adjusted to avoid bleedthrough between channels. Data were collected with four- to eightfold averaging at resolution of 512 × 512 or, more commonly, 1024 × 1024 pixels using pinhole settings between 1.05 and 1.10 airy units. Data sets were processed using the Zeiss 510, version 2.8, software package and were subsequently exported for preparation for printing using Adobe Photoshop, version 7.0.
Quantitative analysis of fluorescence intensity was performed using an algorithm developed in PV-WAVE (Visual Numerics Inc., Houston). The images were first visualized in the LSM Image Examiner software (Carl Zeiss), and an intensity threshold was chosen to discriminate between the specific signals (topo IIα staining; BrdU-labeled DNA) and background in all the images. This threshold was subsequently used for image segmentation, followed by the calculation of mean intensity (or total number of pixels) within regions of interest in the images.
Fluorescence ratio maps for mitotic chromosomes were obtained using the Zeiss LSM 510 image processing software. Intensity values for each pixel in the topo IIα image were divided by the intensity values of the corresponding pixels in the DNA image. The ratio of these values was estimated for every pixel in the resulting image and then multiplied by a scalar (typical values were between 100 and 200) to improve the dynamic range of the final image; this was then saved in a pseudocolor palette, showing low ratio values in green and high ratio values in red.
RESULTS
Localization of Catalytically Active Topo II In Situ: the DRT Assay
It has been shown that type II topoisomerases concentrate in the DNA-poor nucleolus (Christensen et al., 2002), whereas strand-passage activity is exerted predominantly on extranucleolar chromosomal DNA. Because sites of concentration do not necessarily correlate with increased activity of topo II, we sought to implement an assay that allows the discrimination between catalytically active and catalytically inert pools of the enzyme with subcellular resolution. In this assay, hereafter termed DRT, after a short (5–30 min) exposure to a topo II–speccific drug known to trap catalytically engaged topo II onto target DNA, cells are extracted in the presence of both Triton X-100 and 350 mM NaCl. Cells are subsequently fixed in formaldehyde and immunolabeled with specific anti–topo II antibodies. Controls exposed to solvent alone are processed in parallel. This assay is based on the knowledge that some topo II–specific drugs retain onto DNA selectively the forms of the enzyme that are engaged in strand passage activity. Therefore, subchromosomal domains where the protein is extractable by salt plus detergent and hence absent (or low level) in controls, but show significantly increased levels of topo IIα in drug-treated cells are considered as sites of catalytic activity (Figure 1). To assign sites of topo II activity to known chromosomal subregions (or domains), a reliable marker of the latter (e.g., CENP antigens for centromere-associated kinetochores, bromodeoxyuridine [BrdU] incorporation for sites of replication) shall be used in parallel with immunostaining of topo II. Clearly, a prior thorough analysis of the subcellular distribution of the enzyme using routine fixation and immunolabeling procedures provides an important complement for the interpretation of the data.
Figure 1.

The differential retention of topoisomerase (DRT) assay. Nuclei are shown as large ovals. ND1 and ND2 represent nuclear DNA/chromatin domains harboring topo IIα (black filling) that are identifiable by the presence of specific markers (e.g., BrdU for replicating chromatin).
During the initial set up of the DRT assay we used the topo II–specific poison etoposide, which stabilizes covalent topo II-DNA adducts (cleavage complexes) that form during the catalytic cycle. Except where stated otherwise, HeLa cells that were synchronized in G2 were used because both topo IIα levels and catalytic activity are known to be highest at this stage of the cell cycle (Meyer et al., 1997; Andreassen et al., 1997; Austin and Marsh, 1998). After exposure to etoposide (50 μM, 15 min) cells were salt-detergent extracted according to the DRT procedure, fixed in formaldehyde, and immunostained for topo IIα. An increase in staining intensity in the nuclei of etoposide-treated cells was readily apparent when compared with controls given solvent (DMSO) alone (Figure 2A, top panels). To check whether this additional retention of topo II reflected the trapping of catalytic intermediates (cleavage complexes) onto DNA we performed a standard band-depletion assay using as starting material cells treated as above (–/+ etoposide) that were salt-detergent extracted according to the DRT procedure and lysed for SDS-PAGE; untreated, nonextracted cells provided an internal control for total levels of topo IIα (WCE; whole cell extract, Figure 2A, bottom panels). In this assay, depletion of the topo II–specific band in immunoblots correlates with the amount of stable topo II-DNA adducts (cleavage complexes) because these do not enter the separating gel (Meyer et al., 1997). To better judge to what extent depletion reflects formation of topo II-DNA adducts, duplicates of the cell extracts were digested with a DNase (benzonase) and run in parallel. The results showed that in the DMSO-treated controls an insoluble fraction of topo IIα that was insensitive to DNase digestion remained in nuclei after salt-detergent extraction (Figure 2A, bottom panels, lanes 1 and 2). This fraction most likely corresponds to the so-called insoluble fraction of topo IIα that remains in nuclei after extraction with 350 mM NaCl, which is essentially inert catalytically (Meyer et al., 1997). Importantly, etoposide clearly induced nuclear retention of catalytically engaged intermediates as shown by the specific depletion of gel-resolved topo IIα (Figure 2A, compare lanes 3 and 4). This indicates that the increased retention of topo IIα in etoposide-treated nuclei is due, at least partially, to retention of topo II that entered the catalytic cycle.
Figure 2.

Catalytically committed topoisomerase IIα is retained by the DRT procedure. (A, top panel) HeLa cells exposed to DMSO (controls) or etoposide (Etop; 50 μm, 30 min) were salt-detergent extracted (DRT protocol), fixed in formaldehyde, stained for topo IIα, and imaged by confocal microscopy using identical image capture parameters as described in MATERIALS AND METHODS. (A, bottom panel) Cells treated as above (controls and etoposide-treated) were salt-detergent extracted (DRT protocol) and lysed for SDS-PAGE according to the band-depletion procedure as described in MATERIALS AND METHODS; untreated nonextracted cells were similarly processed (WCE; whole cell extracts). Duplicates of samples from each experimental group were digested with DNase preceding electrophoretic separation. After immunoblotting with a monoclonal anti–topo IIα antibody (Ki-S1), the same blots were probed with an anti–lamin B1 polyclonal to provide loading controls. Bar, 5 μm. (B) Cells transfected with plasmids carrying either enhanced GFP-tagged topo IIα wild-type (wt) or an enhanced GFP-tagged point mutant of topo IIα for the active Tyr 805 (mut) were treated with etoposide (50 μM, 15 min) or DMSO (controls), salt/detergent extracted (DRT procedure), and fixed in formaldehyde before imaging. Bar, 20 μM. (C, top panel) Human diploid fibroblasts (WI-38) either growing logarithmically (log; lane 1) or senescent (sen; lane 2) were lysed for SDS-PAGE and immunoblotted for topo IIα; ∼2 × 10⁶ cells were loaded onto each lane. Amounts of loaded whole cell extract from logarithmically growing cells are indicated in the lanes to the right. Lamin B1 detection provides loading controls. (C, bottom panel) Logarithmically growing (log) and senescent (sen) WI-38 fibroblasts exposed to either solvent (controls) or etoposide were salt-detergent extracted (DRT protocol), stained for topo IIα, and imaged by confocal microscopy using identical image capture settings. Bar 5 μm. (D, top panel) Hela cells exposed for the indicated times to etoposide (50 μM) or to solvent (45 min; controls) were salt-detergent extracted (DRT protocol), stained for topo IIα, and imaged by confocal microscopy using identical image capture parameters. Histograms depict the average topo IIα–specific fluorescent signals quantified in equatorial sections of 50 nuclei per time point as described in MATERIALS AND METHODS. (D, bottom panel) Cells exposed to etoposide or solvent (DMSO) exactly as above were processed for a standard band-depletion assay and immunoblotted for topo IIα as described in MATERIALS AND METHODS. Amounts of loaded whole cell extract from control cells are indicated in the lanes to the right. Lamin B1 detection provides loading controls.
To further test whether drug-induced retention requires strand-passage activity Hela cells were transfected with previously characterized (Mo and Beck, 1999) plasmids carrying either enhanced GFP (EGFP)-tagged topo IIα wild-type (wt) or an EGFP-tagged point mutant of topo IIα for the active Tyr 805 (mut; Tyr 805–Phe 805), exposed to etoposide (50 μM, 15 min) or solvent (controls) and salt-detergent extracted (DRT procedure). Imaging by fluorescence microscopy revealed that, consistent with activity-dependent retention, only the wild-type EGFP-tagged version of topo IIα was selectively retained by etoposide (Figure 2B). As negative controls, we utilized noncycling senescent cultures of human diploid fibroblasts (WI-38), which harbor <5% of the total topo IIα levels seen in logarithmically growing cells, as assessed by Western blotting (Figure 2C, top panels). Applying the DRT procedure as described above showed that, in contrast to cycling fibroblasts, in senescent populations no nuclear topo IIα antigen was detected by immunofluorescence in control cells and no additional retention of topo II was induced by etoposide (Figure 2C, bottom panels).
Given the potential of the DRT assay to detect catalytically committed forms of topo II, we wanted to compare the sensitivity of this new method with that of the canonical band-depletion assay. To do so, HeLa cells exposed to etoposide (50 μM) for increasing periods of time (5–45 min) were either processed for band-depletion analysis as described in MATERIALS AND METHODS or else subjected to the DRT extraction protocol, followed by subsequent detection of retained topo IIα by immunofluorescence; parallel control cultures were exposed for 45 min to solvent (DMSO) alone. In the DRT group, for each time point 50 cells were optically sectioned by confocal microscopy at an equatorial plane of the nucleus using identical image capture settings. This showed that using the DRT protocol significant retention of topo IIα above control levels was already seen at the 5-min time point (Figure 2D, histogram), whereas depletion of the topo IIα–specific bands was detectable only after 15 min of exposure to etoposide (Figure 2D, bottom panel).
In subsequent experiments we used a catalytic inhibitor of topo II, ICRF-187, which unlike etoposide does not induce DNA breaks and allows progression through S phase (Andoh and Ishida, 1998). ICRF traps dimers of topo II that have entered the catalytic cycle in a “closed clamp” conformation around DNA fibers, thus stabilizing topo II-DNA interactions at a stage that is subsequent to cleavage complex formation (Andoh and Ishida, 1998).
To test whether utilizing ICRF-187 the DRT procedure promotes the selective retention of type II topoisomerases, we first compared by Western blotting a spectrum of proteins that remain in ICRF-treated cells and solvent-exposed controls after extraction with salt plus detergent (DRT protocol). The results show that, as expected, type II topoisomerases (α and β) are selectively retained after ICRF-187 treatment; although an insoluble fraction remains in the solvent-treated controls, ICRF clearly induces retention of additional topo II (Figure 3). By contrast, topo I and the poly-A binding protein PABP2, both of which localize to the nucleus, and tubulin, an exclusively cytoplasmic protein show no difference in retention after exposure to ICRF (Figure 3).
Figure 3.
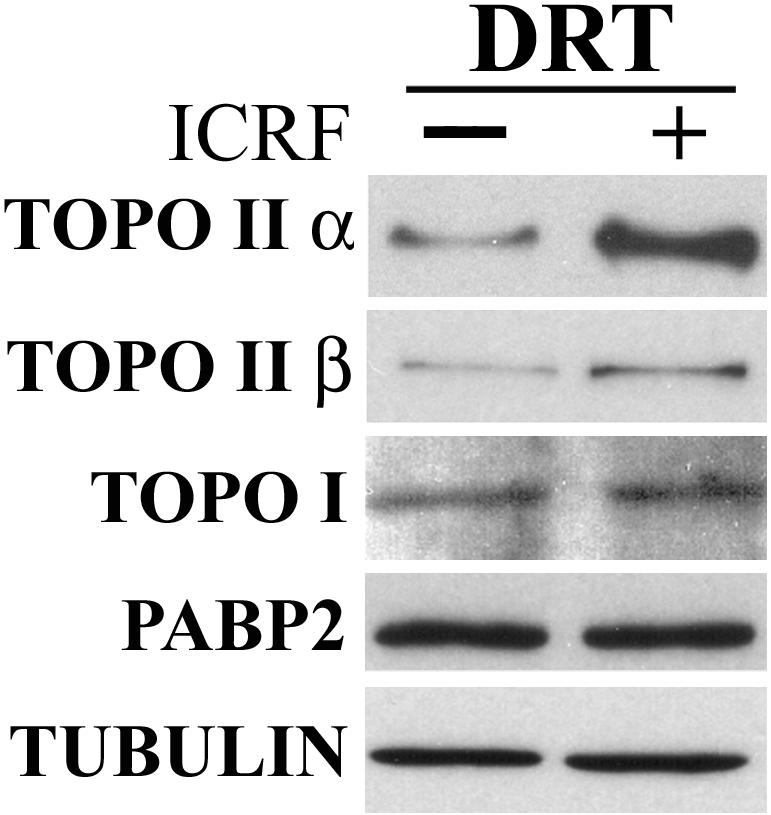
Topoisomerase II is selectively retained by ICRF-187. HeLa cells exposed to ICRF-187 (50 μg/ml, 15 min) or drug solvent alone (controls) were salt-detergent extracted according to the DRT procedure, lysed for SDS-PAGE, and immunoblotted for topo IIα, topo IIβ, topo I, PABP2, and tubulin (ECL method); ∼5.5 × 10⁵ cells were loaded onto each lane.
We next addressed whether known cell cycle differences in catalytic activity of topo IIα could be reliably reproduced using the DRT procedure described here. To this end, HeLa cells were synchronized at different stages of the somatic cell cycle, namely early G1, G1/S, early S, and late S and G2 stages (MATERIALS AND METHODS). At each stage parallel cultures were treated with either ICRF (50 μg/ml, 15 min) or solvent alone, and subsequently salt-detergent extracted (DRT protocol). Untreated, nonextracted cells were also included as an additional internal control for total levels of topo IIα (WCE; whole cell extract, Figure 4A). Cells were lysed for SDS-PAGE and the lysates were immunoblotted for topo IIα with a specific mAb, Ki-S1. Phosphorimager quantification of the specific signals shows that total topo IIα levels are lower at the G1/S transition and highest in G2 phase (Figure 4A, WCE). In populations subjected to the DRT extraction ICRF-induced retention of topo IIα is also predominant during G2 (Figure 4A). This is consistent with the previously reported increase in catalytic activity of topo IIα toward G2 stage (Meyer et al., 1997; Andreassen et al., 1997; Austin and Marsh, 1998). Subsequently, we tested whether utilizing the DRT assay the retention of catalytically active topo IIα induced by ICRF could be quantitatively estimated by immunofluorescence microscopy. To do so, HeLa cells synchronized at defined stages of the cell cycle were treated with ICRF (50 μg/ml; 15 min), salt-detergent extracted according to the DRT procedure, fixed in formaldehyde, and probed with a topo IIα–specific mAb by indirect immunofluorescence. For each cell cycle substage, 25 ICRF-treated and 25 control cells were equatorially sectioned by confocal microscopy using identical image capture parameters. Representative images of ICRF-treated cells and the corresponding controls are shown in Figure 4B. Note that differences in staining intensity between ICRF-treated and control cells are most noticeable during early G1 and G2 phases and that in the topo IIα–poor controls nucleoli (Figure 4B, arrowheads) are among the more prominent structures containing salt/detergent-insoluble topo IIα (to be detailed below). Quantification of the fluorescent signals is graphically depicted in Figure 4C. These results, showing a decline in ICRF-dependent retention of topo IIα from early G1 to late G1 followed by a steep rise toward G2, are in good, though not absolute, agreement with those obtained above (Figure 4A) by Western blotting. Finally, we tested whether in the context of the DRT assay ICRF-187 (50 μg/ml) induces trapping of topo IIα in a quantitative manner as a function of time. With this aim, cells synchronized at G2 stage were exposed for various periods (5–45 min) to ICRF or solvent (45 min; controls) and were processed and imaged (50 cells per time point) as described above. This showed that significant retention of topo IIα was, again, achieved after a short exposure (5 min) to the drug, and that saturation of the fluorescent signal was reached after 30–45 min (Figure 4D).
Figure 4.

ICRF-187–dependent retention of topoisomerase IIα changes with cell cycle stage and duration of exposure. (A) HeLa cells synchronized at the specified stages were extracted according to the DRT procedure (controls plus ICRF-treated cells); intact, nonextracted cells (WCE; whole cell extracts) were collected in parallel. Cells were lysed for SDS-PAGE and immunoblotted for topo IIα; ∼5.0 × 10⁵ cells were loaded onto each lane. Shown is one of two experiments with similar outcomes. Histogram represents the normalized intensities of the corresponding phosphoimages (100% score was assigned to the experimental group showing the highest intensity, i.e., WCE from cells at G2 stage). (B) HeLa cells synchronized at specified stages were exposed to ICRF-187 (50 μg/ml, 15 min) or drug solvent (controls), extracted according to the DRT protocol, and stained with anti–topo IIα; arrowheads denote nucleoli. Bar 5 μm. (C) Histograms depict the average topo IIα–specific fluorescent signals quantified in equatorial sections of 25 nuclei per experimental group as described in MATERIALS AND METHODS; fluorescence intensities are expressed in arbitrary units (AU). (D) Cells synchronized at G2 stage were exposed to ICRF-187 (50 μg/ml) for the indicated times, extracted according to the DRT procedure, and stained for topo IIα; controls exposed to drug solvent (45 min) were processed in parallel. Histograms depict average topo IIα–specific signals quantified in equatorial sections of 50 nuclei as described in MATERIALS AND METHODS.
Taken together, these data indicate that the DRT assay affords a sensitive and reliable estimation of catalytically committed forms of topo II using microscopy. This has prompted us to next use this approach to identify sites of activity of topo IIα with subcellular detail.
Topo IIα Is an Active Component of Late-replicating Heterochromatic Domains
The pattern of incorporation of BrdU indicates which cells are undergoing DNA replication and identifies the stage of S phase. Replication of euchromatin appears as multiple foci of BrdU incorporation dispersed throughout the nucleoplasm and occurs early in S phase (Figure 5A, top panel); heterochromatin, which distributes mostly at the nuclear and nucleolar periphery plus a few dispersed nucleoplasmic sites, replicates later in S phase (for example, O'Keefe et al., 1992; Ferreira et al., 1997, and references therein; a typical distribution of late replicating sites visualized after detection of BrdU-DNA is depicted in Figure 5B, top panel). Because DNA replication is a major source of topological complexities that are to be subsequently resolved by topo II, we asked whether during S phase topo IIα concentrates at replication sites. Indeed, using routine fixation with formaldehyde, we noticed that some focal nucleoplasmic accumulations of topo IIα mimicking the spatial distribution of the late replicating heterochromatin were consistently seen in a fraction of cells in asynchronous populations. To test whether these foci correspond to late-replication sites, BrdU (20 μM) was added to asynchronous cultures of HeLa cells for 15–20 min before fixation with formaldehyde. Double-staining of BrdU and topo IIα showed extensive colocalization of both labeling patterns during late S phase (Figure 5B; line scans passing between arrowheads are shown at the bottom; our unpublished results); we note that the overlap between BrdU and topo IIα staining patterns is not perfect. Topo IIα did not, however, concentrate at the early replicating euchromatic sites (Figure 5A; our unpublished results). Subsequently, we used the DRT assay to test whether concentration of topo IIα at replicating heterochromatin reflects increased strand-passage activity. HeLa cells were then exposed to both ICRF (50 μg/ml) and BrdU (20 μM) for 15 min before salt-detergent extraction; in parallel controls ICRF was substituted for solvent. Costaining for BrdU and topo IIα showed that ICRF clearly induced more retention of topo IIα at late replicating chromosomal sites than in the surrounding nucleoplasm, whereas late replication foci from control cells showed little topo IIα staining (Figure 5, compare C and D and corresponding line scans). By contrast, in cells traversing early S phase ICRF-dependent retention of topo IIα at replication sites was similar to that seen over the remaining nonreplicating chromatin (our unpublished results). Subsequently, the topo IIα–specific signals originating from replication foci were quantified in ICRF-treated and control cells that were traversing either early or late S phase. To do so, equatorial confocal sections obtained with identical capture settings from 25 nuclei per experimental group were analyzed. This confirmed that ICRF-induced retention of topo IIα is only significant in the late S BrdU-foci (Figure 6).
Figure 5.

Late replicating heterochromatin is enriched in catalytically active topo IIα. HeLa cells traversing either early (A) or late (B) S phase were pulsed with BrdU, fixed routinely with formaldehyde, and double-stained for BrdU (red signal) and topo IIα (green signal). (C and D) HeLa cells in late S phase were pulsed with BrdU (+/–ICRF, 50 μg/ml), subjected to the DRT extraction, and stained for BrdU (red signal) and topo IIα (green signal); arrows denote nucleoli. Graphs depict the normalized intensities (arbitrary units; AU) of signals from BrdU (red line) and topo IIα (green line) staining across a line scan passing between arrowheads. Bar, 5 μm.
Figure 6.

Quantification of topoisomerase IIα in early and late replication foci. HeLa cells were pulsed with BrdU (+/–ICRF, 50 μg/ml), subjected to the DRT extraction procedure, and stained for BrdU and topo IIα. Histogram depicts the results of quantification of the topo IIα–specific signals that colocalize with replication foci present in either early or late S cells. Equatorial optical sections from 25 nuclei were analyzed per experimental group as described in MATERIALS AND METHODS.
Because replication sites are de novo assembled in close proximity to earlier ones (Sporbert et al., 2002), the finding that the colocalization between topo IIα and late S foci that actively incorporate BrdU is not perfect is better explained if topo IIα persists for some time over neighbor foci that replicated earlier. To analyze the temporal dynamics of topo IIα concentration at replicating heterochromatin cells were first pulsed with BrdU (15 min) and then collected after 0, 30, or 60 min of culture in BrdU-free medium. Although a partial overlap between the topo IIα– and the BrdU-specific signals persists until 30 min of chase, this is minimal at the 60-min time point (Figure 7, A–C, and corresponding line scans). Indeed, after a 60-min chase, in most late S phase cells the two staining patterns appear side-by-side but mostly spatially separated (cf. Figure 7C). We next investigated whether accumulation of topo IIα at late replicating heterochromatin required active DNA synthesis. To this end, exponential cultures of HeLa cells were first pulsed with BrdU (20 μM; 15 min), and subsequently treated with the replication inhibitors cytosine arabinoside (100 μM) or hydroxyurea (10 mM) for 60 min before routine fixation with formaldehyde. If localization of topo IIα in space and time proceeded unperturbed despite of inhibition of replication, BrdU and topo IIα staining patterns should reproduce the side-by-side distribution just described for the 60-min chase. Instead, in presence of either inhibitor, topo IIα no longer concentrated at, or next to, late replicating domains that had incorporated BrdU (Figure 7D and our unpublished results). Parallel control cultures confirmed that after 60 min in presence of inhibitors, incorporation of BrdU was either minimal or abolished (our unpublished results). Collectively, these results show that catalytically active topo IIα concentrates at heterochromatin in a replication-dependent manner. They further show that high levels of topo IIα persist at heterochromatic domains for ∼30 min past the replication phenomenon. The enrichment in catalytically active topo IIα at late replicating heterochromatin in reference to early replicating euchromatic sites was further tested using a different approach. Now, we took advantage of the known interference of DNA-topo II cleavable complexes covalently stabilized by etoposide with the replication machinery, presumed to result from a collision mechanism (Burden and Osheroff, 1998). Because formation of these complexes correlates with levels of catalytic activity of topo IIα, it is expected that their interference with DNA synthesis be more pronounced at the chromosomal regions where topo II is catalytically more active, i.e., late S sites. To test this prediction, HeLa cells were treated with etoposide (50 μM; 75 min) and pulsed with BrdU (20 μM) during the last 15 min of incubation; controls given DMSO alone were similarly pulsed. Although in controls the BrdU-stained regions from late S cells (denoted by arrowheads, Figure 8A) appear brighter than those seen in cells traversing early S (denoted by arrows, Figure 8A), the reverse occurs in etoposide-treated cells (Figure 8C). Quantification of the BrdU-specific fluorescent signals originating from early and late S cells present in control and etoposide-treated cultures are graphically depicted in Figure 8E. These results, showing that etoposide induces a significant attenuation of BrdU incorporation only in cells traversing late S corroborate the findings obtained above using the DRT assay.
Figure 7.

Spatiotemporal dynamics of topoisomerase IIα at late replicating heterochromatin clusters. Cells pulsed with BrdU (20 μM, 15 min) were either immediately collected at the end of the pulse (A) or chased for 30 (B), or 60 min (C), in BrdU-free medium and stained for BrdU (red signal) and topo IIα (green signal). A typical late replicating heterochromatin cluster is shown per time point. Regions of overlap appear yellow in the merged images. Bars, 0.5 μm. (D) Cells pulsed with BrdU were chased for 60 min in presence of hydroxyurea (HU; 10 mM) and stained for BrdU (red signal) and topo IIα (green signal). Bar, 5 μm. Graphs depict intensities of signals (arbitrary units; AU) from BrdU (red line) and topo IIα (green line) staining across a line scan passing between arrowheads.
Figure 8.

Etoposide interferes predominantly with late replication. HeLa cells grown in the absence (A and B; controls) or presence (C and D) of etoposide (50 μM, 75 min) were pulsed with BrdU (15 min) just before collection and stained with anti-BrdU (top panels). Arrows denote early S cells and arrowheads late S cells; inset depicts the late S cell denoted by double-arrowheads after digital intensity enhancement. Bar, 15 μm. (E) Histograms depict the quantification of the BrdU-specific signal present in equatorial optical sections of either early or late S cells that were processed as above; 50 nuclei were analyzed per experimental group as described in MATERIALS AND METHODS.
The data shown above are consistent with topo IIα–dependent strand-passage activity occurring throughout the nucleoplasm in late S but more prominently at heterochromatic sites that are either undergoing active DNA synthesis or that replicated shortly before.
Subchromosomal Sites of Topo IIα Activity during Mitosis
Centromeric heterochromatin was previously shown to concentrate topo IIα during G2 and M stages (Taagepera et al., 1993; Rattner et al., 1996), and there has been the suggestion that activity of topo IIα within centromeres is critical for chromatid separation during anaphase (Warburton and Earnshaw, 1997). Here, we searched for the presence of catalytic activity of topo IIα at centromeres during G2 and M phase. To this end, we applied the DRT assay to cells synchronized at G2 stage that were subsequently double-stained for topo IIα– and centromere-associated kinetochores with topo IIα– and CENP A/C-specific antibodies, respectively. This revealed that topo IIα was significantly retained at centromeric domains in ICRF-treated cells when compared with controls; also, in ICRF-treated G2 cells centromeric domains concentrated topo IIα above nucleoplasmic levels (Figure 9, compare A and B). We next analyzed mitotic cells present in asynchronous populations after application of the DRT procedure. Again, from prophase to anaphase centromeric regions showed the highest ICRF-dependent retention of topo IIα when compared with the rest of the chromosome arm (Figure 9, C and D; inset denotes magnified centromeric region; our unpublished results). We then quantified the topo IIα–specific fluorescence intensities at centromeres and chromosome arms in ICRF-treated and control mitotic cells (metaphase, n = 6; anaphase, n = 6). This showed that the ratio between ICRF-induced retention of topo IIα at centromeres/chromosome arms was ∼2.5 during metaphase and ∼1.8 during anaphase (our unpublished results). However, ICRF failed to induce privileged retention of topo IIα at centromeric domains as cells entered early G1 stage (Figure 9, E and F). These results are consistent with centromeric domains being major sites of DNA-based topo IIα activity during G2 and M phases.
Figure 9.

Centromeric domains concentrate catalytically active topoisomerase IIα during G2 and M stages. Cells at G2 (A and B), metaphase (C and D), and early G1 (E and F) were subjected to the DRT protocol. Controls (left panels) and ICRF-treated cells (right panels) subjected to salt-detergent extraction (DRT protocol) were stained for CENP A/C (red signal) and topo IIα (green signal). Regions of overlap appear yellow in the merges; arrowheads denote subsets of centromeric regions for comparison; inset (D) denotes a magnified centromeric region stained for CENP A/C and topo IIα. Bar, 5 μm.
Within the chromosome arm topo IIα shows a tendency toward a higher concentration along the longitudinal axis (Earnshaw and Heck, 1985; Gasser et al., 1986; Tavormina et al., 2002; Maeshima and Laemmli, 2003). In this study, this was readily apparent in confocal sections of mitotic HeLa cells that were fixed routinely with formaldehyde, detergent-extracted, and costained for topo IIα and DNA (our unpublished results). Interestingly, in mitotic cells subjected to the DRT procedure a preferential, ICRF-dependent retention of topo IIα was seen along the axis (Figure 10, B and C), whereas little staining of topo IIα was present in solvent-treated controls imaged with identical settings (Figure 10A). We note that when more sensitive image capture settings are used chromosome arms of controls were shown to still harbor detectable topo IIα (our unpublished results). The preferential concentration of ICRF-retained topo IIα along the chromosomal axis is best appreciated in chromosome color maps, which depict the ratios obtained for each pixel between the intensities of the topo IIα and the DNA staining (Figure 10, B and C, bottom; progressively lower topo II/DNA ratios appear, respectively, as red, yellow, and green colors).
Figure 10.

Catalytically active topoisomerase IIα concentrates along the mitotic chromosomal axis. (A–C) DRT assay: metaphase chromosomes from solvent-exposed controls (A) and ICRF-treated cells (B and C) stained for DNA (TO-PRO-3 iodide; red signal) and topo IIα (green signal); arrowheads denote centromeric domains. Regions of overlap appear yellow in the merged images. Chromosome color maps depict the ratios obtained for each pixel between the intensities of the topo IIα and the DNA staining; red, yellow, and green colors correspond, respectively, to progressively lower estimates. Bar, 1 μm.
Inhibition of Deacetylase Activity Delocalizes Topo IIα
The preceding analyses showed that in a cell cycle–dependent manner heterochromatin (replicating and centromeric) was a privileged target for strand-passage activity of topo IIα. We became therefore interested in disclosing whether chromatin structure played any role in the timely targeting of topo IIα to heterochromatic regions. To disrupt the underacetylated state of histones, a hallmark of heterochromatin (Richards and Elgin, 2002), we treated cells with deacetylase inhibitors and then checked whether topo IIα still concentrated at centromeres during mitosis and at replicating heterochromatin in late S phase. The effects on mitotic cells were tested in asynchronous populations of HeLa cells exposed to trichostatin A (TSA; 100 ng/ml, 8–9 h) before routine fixation with formaldehyde. Cells were double-stained with a topo IIα–specific mAb and the anti-CENP A/C antiserum and then analyzed by confocal microscopy. Serial optical sections of 11 cells at prometaphase stage revealed that topo IIα distributes across the chromatid arms, like in solvent-treated controls, but does not concentrate at centromeric regions; centromeric staining, albeit present is at intensities that are similar to those seen in the remaining of the chromosome (Figure 11, top panels). Sodium butyrate (10 mM), another deacetylase inhibitor, yielded identical results (our unpublished results). To test whether in presence of TSA topo IIα still concentrates over replicating heterochromatin asynchronous populations were treated with TSA (100 or 200 ng/ml) for 2.5 or 4 h before a short (15 min) exposure to BrdU. Simultaneous detection of BrdU and topo IIα showed that in cells traversing late S topo IIα does not concentrate at heterochromatic replication sites in the TSA-treated population (Figure 11, bottom panel; arrowhead denotes replicating heterochromatin), in contrast to mock-treated cells (our unpublished results). This was observed irrespectively of incubation time (2½ or 4 h), or dose (100 or 200 ng/ml) of TSA that was used. Incubation times shorter than 2½ h did not, however, lead to a consistent reduction of topo IIα staining at late replication sites. Importantly, only incubation times with TSA in excess of 2½ h allowed the reliable detection of hyperacetylation of H4, at either lysine 5 or lysine 16, by immunofluorescence with specific antisera (our unpublished results). As for TSA, sodium butyrate (10 mM) also abrogated the concentration of topo IIα at replicating heterochromatin (our unpublished results). Collectively, these data suggest a role for chromatin structure in the proper localization of topo IIα at heterochromatin during S and M stages.
Figure 11.

TSA abrogates cell cycle–regulated concentration of topoisomerase IIα at heterochromatin. Top panels: Prometaphase chromosomes from cells exposed to TSA (100 ng/ml, 9h), routinely fixed in formaldehyde and labeled for topo IIα (green signal) and CENP A/C (red signal). Bottom panels: Late S cell treated with TSA (100 ng/ml, 4 h), pulsed with BrdU immediately before routine fixation with formaldehyde, and stained for topo IIα (green signal) and BrdU (red signal); arrowhead denotes a late replicating domain. Bars, 5 μm.
The Insoluble Fraction of Topo IIα
Previous research has consistently shown the presence of a salt-insoluble (350 mM NaCl) fraction of topo IIα, which is currently regarded as mostly catalytically inert (Meyer et al., 1997, and references therein). Here, we searched for the intranuclear localization of this pool of the enzyme and for nuclear activities that might influence its distribution. As noted previously in this research, in absence of exposure to ICRF the salt-detergent extracted nuclear remnant shows nucleoli among the prominent structures labeled for topo IIα (cf. Figure 4B; also Figure 12, A and B; prominent nucleoli are denoted by dotted lines, central panels depict topo IIα staining). We note that the amount of salt-insoluble topo IIα seen at nucleoli is variable from cell to cell showing a tendency to increase as cells approach G2 stage (our unpublished observations). Besides nucleoli, a nucleoplasmic staining pattern comprising large speckles plus numerous minute nucleoplasmic foci is consistently observed (Figure 12, A and B, central panels, arrows denote minute foci, arrowheads indicate speckles). Simultaneous staining of DNA shows that although the minute foci colocalize mostly with DNA, the speckled component localizes predominantly to DNA-poor nucleoplasmic regions (Figure 12A). Because this latter pattern closely resembles the well-known speckled distribution of components of the splicing machinery (Lamond and Earnshaw, 1998; Dundr and Misteli, 2001; Carmo-Fonseca, 2002), we asked whether the two staining patterns overlapped. Double staining with an anti-Sm antiserum, which recognizes an epitope that is common to all splicing snRNPs, and a topo IIα–specific mAb, shows that both recognize the same speckles (Figure 12B); on close inspection, however, it was clear that within each speckle the two probes overlap only partially (Figure 12B, insets).
Figure 12.

Topoisomerase IIα localizes dynamically in nuclear speckles in response to changes in topoisomerase II and RNA polymerase II activities. (A) Cells salt-detergent extracted according to the DRT procedure and stained for DNA (TO-PRO-3 iodide) and topo IIα; dotted lines: nucleoli; arrowheads: nuclear speckle; arrows: minute nucleoplasmic foci. (B) Cells extracted as above and labeled for Sm antigens and topo IIα; regions of overlap appear yellow in the merge; dotted lines denote nucleoli, insets denote a single speckle. (C and D) Cells exposed to α-amanitin (C; 50 μg/ml, 5 h) or DMSO (D; controls) were fixed routinely and labeled for topo IIα and Sm; regions of overlap appear yellow in the merge. (E) Cells treated with ICRF-187 (50 μg/ml, 20 min), fixed routinely with formaldehyde, and stained for topo IIα and Sm; arrowheads denote speckles, dotted lines denote nucleoli. Bar, 5 μm.
After inhibition of pol II–dependent transcription nuclear speckles round up, increase in size, and accumulate additional splicing snRNPs and splicing factors at the expense of a reduction in their nucleoplasmic levels (Lamond and Earnshaw, 1998; Dundr and Misteli, 2001). To further characterize the behavior of the insoluble fraction of topo IIα, we tested whether, like components of the splicing machinery, it also redistributes to nuclear speckles in response to transcription inhibitors. Asynchronous HeLa cells were then treated with either α-amanitin (50 μg/ml; 5 h) or DRB (75 μM; 1–2 h), both of which inhibit pol II activity, before routine fixation with formaldehyde. Controls given solvent alone were processed in parallel. Detection of splicing snRNPs in drug-treated cultures revealed, as expected, the occurrence of enlarged nuclear speckles (Figure 12C, left image). Interestingly, topo IIα also concentrated in the enlarged speckles in ∼60% (n = 212) of the cells, in contrast to controls (compare Figure 12, C and D). It was reported that topo II–specific drugs that trap the enzyme at sites of activity on chromatin lead to a concurrent depletion of topo II from the DNA-poor nucleoli, reflecting the shuttling of topo IIα between these two compartments (Christensen et al., 2002). We next tested whether ICRF-187 also induces a similar delocalization of topo IIα from the nuclear speckles. Indeed, after exposure of HeLa cells to the drug (50 μg/ml, 20 min), simultaneous detection of topo IIα and Sm epitopes reveals a significant depletion of topo IIα from nuclear speckles, in parallel with the expected depletion at nucleoli (Figure 12E, arrowheads indicate speckles, dotted lines outline nucleoli). Taken together, these data indicate that the pool of insoluble topo IIα localizing in the nuclear speckles is dynamic and can be differentially mobilized in response to changes in activity of RNA polymerase II and topoisomerase II.
DISCUSSION
Recent findings highlight the fact that in vivo the true substrate of topo IIα activity is chromatin rather than DNA and that the well-established role in DNA decatenation is most probably an underestimation of the full range of its activities (Tsai et al., 2000; Johnson et al., 2001; Mondal and Parvin, 2001).
Here, we have identified subchromosomal sites where topo IIα is catalytically active using a new assay called DRT (Figure 1). This assay was inspired in a previously described in situ retention assay, which allows visualization by immunofluorescence and quantification of cleavable complexes, but not subcellular resolution (Willmore et al., 1998). Our results revealed a strong, cell cycle–dependent connection between activity of topo IIα and heterochromatin and suggest a role for DNA replication and chromatin structure in the proper localization of topo IIα at relevant heterochromatic subregions. They are also consistent with a role for the activities of topo IIα and RNA polymerase II in regulating the distribution of the enzyme between sites of strand-passage activity on the genome and DNA-poor subnuclear domains that harbor insoluble, catalytically inert forms of the enzyme.
Specifically, in this work we have shown that topo IIα transiently concentrates at heterochromatin during its replication in late S phase. We also showed that concentration of topo IIα over heterochromatin requires ongoing DNA synthesis and that it persists at late replicating sites for ∼30 min. When cells traversing late S phase were first pulsed with BrdU and then chased for various times before a second pulse with a differently modified nucleotide, a partial separation of the two replication foci was apparent already within 15 min of the interval between the pulses; after 30 min the two foci localized side-by-side and could be distinguished by confocal microscopy in most cases (Ma et al., 1998; Taddei et al., 1999). Similar results were recently obtained by direct analysis of replication foci in living cells (Leonhardt et al., 2000; Sporbert et al., 2002). Our data are, therefore, compatible with topo IIα remaining at late replicating sites during a full replication event. Utilizing the DRT assay we showed that the accumulation of topo IIα over replicating heterochromatin corresponds mostly to the catalytically active form of the enzyme. Somewhat surprisingly, early replicating euchromatic sites did not seem to concentrate catalytically active topo IIα. Using biochemical poisonbased binding assays enrichment in topo IIα activity near replication forks was previously reported (Nelson et al., 1986). At replicating euchromatin this enrichment may, however, be too transient or too low to result in detectable accumulation of catalytically active topo IIα utilizing the DRT assay. Our data highlight topo IIα as a novel member of the group of proteins that concentrate at replication sites exclusively during late S phase, the other one being HDAC2 (Rountree et al., 2000). HDAC2 is recruited to late S sites via its interaction with the maintenance DNA methyl transferase DNMT1, and both may cooperate to maintain the heterochromatic state (Rountree et al., 2000). Because topo IIα also directly interacts with HDACs 1 and 2 (Tsai et al., 2000; Johnson et al., 2001), it will be important in the future to test its possible role in heterochromatin maintenance mechanisms that operate after replication.
The reported direct interaction between topo IIα and HDACs 1 and 2, possibly as part of the NURD (nucleosome remodeling and deacetylation) complex, strongly suggests a connection between topo IIα activity and chromatin modification (Tsai et al., 2000). Here, we tested whether shortterm exposure of cells to deacetylase inhibitors (TSA and butyrate) had any effect on the cell cycle-dependent localization of topo IIα at heterochromatic sites of activity. TSA is known to interfere with the pathway of maturation of heterochromatin, which involves the deacetylase-dependent removal of specific acetyl groups from histone tails at heterochromatic regions shortly after their replication in late S phase (Taddei et al., 1999). TSA also interferes with centromere function during M stage, probably via a defective biogenesis of centric heterochromatin, resulting in abnormal chromosome disjunction (Taddei et al., 2001). In this work, we show that TSA and butyrate induce the delocalization of topo IIα from replicating heterochromatin during late S phase and from centric heterochromatin during mitosis (Figure 11). Although in vitro topo IIα seems to be attracted chiefly by the presence of topological complexities on DNA (Burden and Osheroff, 1998), our data are consistent with its targeting in vivo to heterochromatic sites of activity being also sensitive to chromatin structure. Interestingly, a recent detailed analysis of the preferred sites for topo IIα cleavage activity across the centromeric α-repeats in human cells has also led to the suggestion of a role for chromatin structure (Spence et al., 2002). We speculate that as part of complexes with chromatin altering activity (e.g., the NURD complex), topo IIα might participate in the sensing of sites of altered chromatin structure within the nucleus and thus influence the targeting of the whole complex.
Preceding studies have shown that topo IIα transiently concentrates at the centromere from G2 up until anaphase (Taagepera et al., 1993; Rattner et al., 1996). In this study, using the DRT procedure we show that this correlates with increased levels of catalytic activity and that in mitotic cells the highest ratio between ICRF-dependent retention at centromeres in reference to chromosome arms is reached at metaphase (ratio centromere/arms ∼2.5). The activity of the enzyme at centromeres is still predominant during anaphase (ratio centromere/arms ∼1.8), but decreases to nucleoplasmic levels as cells enter early G1 stage (Figure 9, E and F; our unpublished results). Although the function of topo IIα at the centromere during G2-M is still unknown, the data presented here are consistent with its predicted role in maintenance of centromeric structure before M stage (Rattner et al., 1996) and in assisting in the final decatenations within centromeric DNA before sister separation (Warburton and Earnshaw, 1997).
There is compelling cytological evidence that mitotic chromosomes of mammals harbor a distinct topo IIα–enriched structure, termed the scaffold, that extends along the longitudinal axis of the chromosome arms (Earnshaw et al., 1985; Gasser et al., 1986; Maeshima and Laemmli, 2003). Over time, it has become an established view that the role of the enzyme in the scaffold is chiefly structural participating in the organization of chromatin loops. More recently, this view has been reiterated with the suggestion that at the scaffold the interaction between Ca2+ and topo IIα might result in inactivation of its catalytic activity (Strick et al., 2001). Whether topo IIα concentrates along the mitotic chromosomal axis is, however, still a matter of debate. Indeed, two recent analyses using stably transfected GFP-topo IIα yielded contradictory results (Christensen et al., 2002; Tavormina et al., 2002). The homogeneous (i.e., nonaxial) distribution reported in one study (Christensen et al., 2002) was subsequently shown to result from over expression of the chimerical protein (Maeshima and Laemmli, 2003). Using the DRT assay we showed that in mitotic cells sites of catalytic activity of topo IIα distribute along the chromosome arms, with the highest concentration being observed at centromeric domains (Figure 9, C and D). Within the chromosomal arms, a tendency for the concentration of catalytically active topo IIα to peak toward the longitudinal axis was observed (Figure 10, B and C). Clearly, this is more consistent with topo IIα at the scaffold being engaged in strand-passage activity, rather than playing a passive structural role.
The insoluble fraction of topo IIα, which is mostly catalytically inert (Meyer et al., 1997), has been assigned a structural role in the organization of chromatin inside the nucleus via tethering DNA loops to a stable proteinaceous framework termed the nuclear matrix (Berrios et al., 1985; Laemmli et al., 1992). Our results show that the distribution of the pool of topo IIα that remains insoluble in 350 mM NaCl localizes to both the nucleoli and the nucleoplasm (Figure 12, A and B; our unpublished results). Within the nucleoplasm, a distribution pattern is seen consisting of numerous minute foci; these may conform to the DNA-anchoring role predicted for topo IIα in nuclear matrix models, given their codistribution with DNA. Surprisingly, the major fraction of insoluble nucleoplasmic topo IIα colocalized with subnuclear domains, known as the nuclear speckles (cf. Figure 12B). Nuclear-speckled domains are enriched in splicing snRNPs and other components of the splicing machinery but devoid of DNA (Lamond and Earnshaw, 1998; Dundr and Misteli, 2001), which makes them unlikely sites of topo II–dependent strand-passage activity. When pol II–dependent transcription is inhibited, snRNPs accumulate in enlarged speckles because they are no longer recruited to sites of transcription in the surrounding chromatin (Lamond and Earnshaw, 1998; Dundr and Misteli, 2001). Interestingly, topo IIα shows a similar redistribution upon inhibition of pol II activity (Figure 12C). It was recently shown that topo IIα interacts with pol II in vivo as part of the pol II “holoenzyme” and that this interaction is critical for transcription of chromatin templates (Mondal and Parvin, 2001). We suggest that inhibition of transcription reduces the pol II–coupled fraction of topo II at transcribing chromatin, thus shifting the equilibrium toward a preferential localization in splicing speckles. The dynamic behavior of the insoluble, speckle-associated pool of topo IIα shown here is in good agreement with the finding that GFP-tagged topo IIα is mobile within the nucleus, leaving little room for a truly immobile insoluble fraction performing a predominantly structural role (Christensen et al., 2002). As noted previously, this does not exclude that the fraction of topo IIα with a slower mobility in FRAP analysis, likely to correlate with the insoluble pool in biochemical fractionation studies, might play a significant role in the organization of chromatin (Christensen et al., 2002; Tavormina et al., 2002).
Overall, our results highlight a previously unsuspected spectrum of chromatin-based activities that influence the targeting of this vital enzyme to its subcellular sites of activity, in particular to heterochromatin. Future studies will aim to elucidate the underlying molecular mechanisms and the connections between topo IIα and chromatin modification.
Acknowledgments
We thank Maria Carmo-Fonseca, Angus I. Lamond, and Geneviéve Almouzni for helpful comments on the manuscript and Patrick Varga-Weisz, Margarete Heck, and James Wang for advice on experiments. We are grateful to William Beck and Martina Vaskova for the kind gift of EGFP-tagged topo IIα constructs. This study was supported by Fundação para a Ciência e Tecnologia and FEDER (refs. BCI/36149/99-00; MA/BD/6107/2001; SRFM/BPD/3547/2000), and by a Calouste Gulbenkian Foundation Award to M.A.
Abbreviations used: BrdU, bromodeoxyuridine; DRB, 5,6-dichloro-1-β-d-ribofuranosylbenzimidazole; FRAP, fluorescence recovery after photobleaching; GFP, green fluorescent protein; EGFP, enhanced green fluorescent protein; HDAC, histone deacetylase; NURD, nucleosome remodeling and deacetylation complex; PABP2, poly(A)-binding protein II; TSA, trichostatin A.
References
- Andoh, T., and Ishida, R. (1998). Catalytic inhibitors of DNA topoisomerase II. Biochim. Biophys. Acta 1400, 155–171. [DOI] [PubMed] [Google Scholar]
- Andreassen, P.R., Lacroix, F.B., and Margolis, R.L. (1997). Chromosomes with two intact axial cores are induced by G2 checkpoint override: evidence that DNA decatenation is not required to template the chromosome structure. J. Cell Biol. 136, 29–43. [DOI] [PMC free article] [PubMed] [Google Scholar]
- Austin, C.A., and Marsh, K.L. (1998). Eukaryotic DNA topoisomerase II beta. Bioessays 20, 215–226. [DOI] [PubMed] [Google Scholar]
- Berrios, M., Osheroff, N., and Fisher, P.A. (1985). In situ localization of DNA topoisomerase II, a major polypeptide component of the Drosophila nuclear matrix fraction. Proc. Natl. Acad. Sci. USA 82, 4142–4146. [DOI] [PMC free article] [PubMed] [Google Scholar]
- Burden, D.A., and Osheroff, N. (1998). Mechanism of action of eukaryotic topoisomerase II and drugs targeted to the enzyme. Biochim. Biophys. Acta 1400, 139–154. [DOI] [PubMed] [Google Scholar]
- Carmo-Fonseca, M. (2002). The contribution of nuclear compartmentalization to gene regulation. Cell 108, 513–521. [DOI] [PubMed] [Google Scholar]
- Christensen, M.O., Larsen, M.K., Barthelmes, H.U., Hock, R., Andersen, C.L., Kjeldsen, E., Knudsen, B.R., Westergaard, O., Boege, F., and Mielke, C. (2002). Dynamics of human DNA topoisomerases IIα and IIβ in living cells. J. Cell Biol. 157, 31–44. [DOI] [PMC free article] [PubMed] [Google Scholar]
- Downes, C.S., Clarke, D.J., Mullinger, A.M., Gimenez-Abian, J.F., Creighton, A.M., and Johnson, R.T. (1994). A topoisomerase II-dependent G2 cycle checkpoint in mammalian cells. Nature 372, 467–470. [DOI] [PubMed] [Google Scholar]
- Dundr, M., and Misteli, T. (2001). Functional architecture in the cell nucleus. Biochem. J. 356, 297–310. [DOI] [PMC free article] [PubMed] [Google Scholar]
- Earnshaw, W.C., Halligan, B., Cooke, C.A., Heck, M.M., and Liu, L.F. (1985). Topoisomerase II is a structural component of mitotic chromosome scaffolds. J. Cell Biol. 100, 1706–1715. [DOI] [PMC free article] [PubMed] [Google Scholar]
- Earnshaw, W.C., and Heck, M.M. (1985). Localization of topoisomerase II in mitotic chromosomes. J. Cell Biol. 100, 1716–1725. [DOI] [PMC free article] [PubMed] [Google Scholar]
- Ferreira, J., Paolella, G., Ramos, C., and Lamond, A.I. (1997). Spatial organization of large-scale chromatin domains in the nucleus: a magnified view of single chromosome territories. J. Cell Biol. 139, 1597–1610. [DOI] [PMC free article] [PubMed] [Google Scholar]
- Gasser, S. M., Laroche, T., Falquet, J., Boy de la Tour, E., and Laemmli, U.K. (1986). Metaphase chromosome structure. Involvement of topoisomerase II. J. Mol. Biol. 188, 613–629. [DOI] [PubMed] [Google Scholar]
- Heck, M.M., Hittelman, W.N., and Earnshaw, W.C. (1988). Differential expression of DNA topoisomerases I and II during the eukaryotic cell cycle. Proc. Natl. Acad. Sci. USA 85, 1086–1090. [DOI] [PMC free article] [PubMed] [Google Scholar]
- Ishida, R., Iwai, M., Marsh, K.L., Austin, C.A., Yano, T., Shibata, M., Nozaki, N., and Hara, A. (1996). Threonine 1342 in human topoisomerase IIalpha is phosphorylated throughout the cell cycle. J. Biol. Chem. 271, 30077–30082. [DOI] [PubMed] [Google Scholar]
- Johnson, C.A., Padget, K., Austin, C.A., and Turner, B.M. (2001). Deacetylase activity associates with topoisomerase II and is necessary for etoposide-induced apoptosis. J. Biol. Chem. 276, 4539–4542. [DOI] [PubMed] [Google Scholar]
- Lamond, A.I., and Earnshaw, W.C. (1998). Structure and function in the nucleus. Science 280, 547–553. [DOI] [PubMed] [Google Scholar]
- Laemmli, U.K., Kas, E., Poljak, L., and Adachi, Y. (1992). Scaffold-associated regions: cis-acting determinants of chromatin structural loops and functional domains. Curr. Opin. Genet. Dev. 2, 275–285. [DOI] [PubMed] [Google Scholar]
- Leonhardt, H., Rahn, H.P., Weinzierl, P., Sporbert, A., Cremer, T., Zink, D., and Cardoso, M.C. (2000). Dynamics of DNA replication factories in living cells. J. Cell Biol. 149, 271–280. [DOI] [PMC free article] [PubMed] [Google Scholar]
- Ma, H., Samarabandu, J., Devdhar, R.S., Acharya, R., Cheng, P.C., Meng, C., and Berezney, R. (1998). Spatial and temporal dynamics of DNA replication sites in mammalian cells. J. Cell Biol. 143, 1415–1425. [DOI] [PMC free article] [PubMed] [Google Scholar]
- Maeshima, K., and Laemmli, U.K. (2003). A two-step scaffolding model for mitotic chromosome assembly. Dev. Cell 4, 467–480. [DOI] [PubMed] [Google Scholar]
- Meyer, K.N., Kjeldsen, E., Straub, T., Knudsen, B.R., Hickson, I.D., Kikuchi, A., Kreipe, H., and Boege, F. (1997). Cell cycle-coupled relocation of types I and II topoisomerases and modulation of catalytic enzyme activities. J. Cell Biol. 136, 775–788. [DOI] [PMC free article] [PubMed] [Google Scholar]
- Mo, Y-Y., and Beck, W.T. (1999). Association of human DNA topoisomerase IIα with mitotic chromosomes in mammalian cells is independent of its catalytic activity. Exp. Cell Res. 252, 50–62. [DOI] [PubMed] [Google Scholar]
- Mondal, N., and Parvin, J.D. (2001). DNA topoisomerase IIalpha is required for RNA polymerase II transcription on chromatin templates. Nature 413, 435–438. [DOI] [PubMed] [Google Scholar]
- Nelson, W.G., Liu, L.F., and Coffey, D.S. (1986). Newly replicated DNA is associated with DNA topoisomerase II in cultured rat prostatic adenocarcinoma cells. Nature 322, 187–189. [DOI] [PubMed] [Google Scholar]
- O'Keefe, R.T., Henderson, S.C., and Spector, D.L. (1992). Dynamic organization of DNA replication in mammalian cell nuclei: spatially and temporally defined replication of chromosome-specific alpha-satellite DNA sequences. J. Cell Biol. 116, 1095–1110. [DOI] [PMC free article] [PubMed] [Google Scholar]
- Rattner, J.B., Hendzel, M.J., Furbee, C.S., Muller, M.T., and Bazett-Jones, D.P. (1996). Topoisomerase II alpha is associated with the mammalian centromere in a cell cycle- and species-specific manner and is required for proper centromere/kinetochore structure. J. Cell Biol. 134, 1097–1107. [DOI] [PMC free article] [PubMed] [Google Scholar]
- Richards, E.J., and Elgin, S.C.R. (2002). Epigenetic codes for heterochromatin formation and silencing: rounding up the usual suspects. Cell 108, 489–500. [DOI] [PubMed] [Google Scholar]
- Rountree, M.R., Bachman, K.E., and Baylin, S.B. (2000). DNMT1 binds HDAC2 and a new co-repressor, DMAP1, to form a complex at replication foci. Nat. Genet. 25, 269–277. [DOI] [PubMed] [Google Scholar]
- Sporbert, A., Gahl, A., Ankerhold, R., Leonhardt, H., and Cardoso, M.C. (2002). DNA polymerase clamp shows little turnover at established replication sites but sequential de novo assembly at adjacent origin clusters. Mol. Cell 10, 1355–1365. [DOI] [PubMed] [Google Scholar]
- Spence, J.M., Critcher, R., Ebersole, T.A., Valdivia, M.M., Earnshaw, W.C., Fukagawa, T., and Farr, C.J. (2002). Co-localization of centromere activity, proteins and topoisomerase II within a subdomain of the major human X α-satellite array. EMBO J. 21, 5269–5280. [DOI] [PMC free article] [PubMed] [Google Scholar]
- Strick, R., Strissel, P.L., Gavrilov, K., and Levi-Setti, R. (2001). Cation-chromatin binding as shown by ion microscopy is essential for the structural integrity of chromosomes. J. Cell Biol. 155, 899–910. [DOI] [PMC free article] [PubMed] [Google Scholar]
- Taagepera, S., Rao, P.N., Drake, F.H., and Gorbsky, G.J. (1993). DNA topoisomerase II alpha is the major chromosome protein recognized by the mitotic phosphoprotein antibody MPM-2. Proc. Natl. Acad. Sci. USA 90, 8407–8411. [DOI] [PMC free article] [PubMed] [Google Scholar]
- Taddei, A., Maison, C., Roche, D., and Almouzni, G. (2001). Reversible disruption of pericentric heterochromatin and centromere function by inhibiting deacetylases. Nat. Cell Biol. 3, 114–120. [DOI] [PubMed] [Google Scholar]
- Taddei, A., D. Roche, J.B. Sibarita, B.M. Turner, and Almouzni, G. (1999). Duplication and maintenance of heterochromatin domains. J. Cell Biol. 147, 1153–1166. [DOI] [PMC free article] [PubMed] [Google Scholar]
- Tavormina, P.A., Côme, M-G., Hudson, J.R., Mo, Y-Y., Beck, W.T., and Gorbsky, G.J. (2002). Rapid exchange of mammalian topoisomerase IIα at kinetochores and chromosome arms in mitosis. J. Cell Biol. 158, 23–29. [DOI] [PMC free article] [PubMed] [Google Scholar]
- Tsai, S.C., Valkov, N., Yang, W.M., Gump, J., Sullivan, D., and Seto, E. (2000). Histone deacetylase interacts directly with DNA topoisomerase II. Nat. Genet. 26, 349–353. [DOI] [PubMed] [Google Scholar]
- Wang, J.C. (1996). DNA topoisomerases. Annu. Rev. Biochem. 65, 635–692. [DOI] [PubMed] [Google Scholar]
- Warburton, P.E., and Earnshaw, W.C. (1997). Untangling the role of DNA topoisomerase II in mitotic chromosome structure and function. Bioessays 19, 97–99. [DOI] [PubMed] [Google Scholar]
- Willmore, E., Frank, A.J., Padget, K., Tilby, M.J., and Austin, C.A. (1998). Etoposide targets topoisomerase IIα and IIβ in leukemic cells: isoform-specific cleavable complexes visualized and quantified in situ by a novel immunofluorescence technique. Mol. Pharmacol. 53, 78–85. [DOI] [PubMed] [Google Scholar]