Biological 2-Input Decoder Circuit in Human Cells (original) (raw)
Abstract
Decoders are combinational circuits that convert information from n inputs to a maximum of 2_n_ outputs. This operation is of major importance in computing systems yet it is vastly underexplored in synthetic biology. Here, we present a synthetic gene network architecture that operates as a biological decoder in human cells, converting 2 inputs to 4 outputs. As a proof-of-principle, we use small molecules to emulate the two inputs and fluorescent reporters as the corresponding four outputs. The experiments are performed using transient transfections in human kidney embryonic cells and the characterization by fluorescence microscopy and flow cytometry. We show a clear separation between the ON and OFF mean fluorescent intensity states. Additionally, we adopt the integrated mean fluorescence intensity for the characterization of the circuit and show that this metric is more robust to transfection conditions when compared to the mean fluorescent intensity. To conclude, we present the first implementation of a genetic decoder. This combinational system can be valuable toward engineering higher-order circuits as well as accommodate a multiplexed interface with endogenous cellular functions.
Keywords: synthetic circuit, decoder, integrated mean fluorescence, combinational logic, Boolean logic
Biomolecular computing systems1 have the potential for a range of key technological and medical applications, including valuable compound production2−4 and biosensors for disease and pathogens,5,6 all the way to bioremediation.7−9 Over the past decade, characterization and standardization of various biological parts and components through experiments and computational analysis have been crucial in moving the field forward.10−21 Expanding experimental characterization to large-scale analysis,22 using synthetic circuits as benchmarks for reverse engineering,23 and integrating domain specific languages24 are prime examples of cross fertilization of engineering principles to synthetic biology. Overall, the area has seen remarkable growth and progress. Genetic circuit engineering has transitioned from two-node circuits25 to complex architectures which respond to input stimuli by generating cellular memory through recombinase-based mechanisms26 and multilayered transcriptional and post-transcriptional regulation.27,28
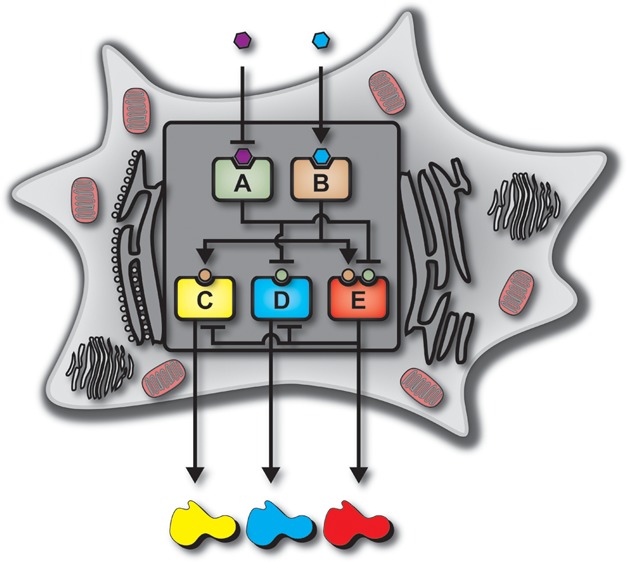
Toward advanced computing applications, multioutput systems are just as important as multi-input circuits, yet the former is an underexplored and largely unsolved problem for computations performed in single human cells. Notably, it is not currently feasible to utilize cell-to-cell communication in mammalian systems to achieve intercellular multilayered circuits.12 Here, as a means of enabling the control of multiple outputs with a few inputs, we introduce a biological intracellular multilayered circuit that emulates an electrical decoder. Specifically, we introduce a novel genetic architecture that converts two chemical inputs into four unique outputs. The circuit achieves the combinational effect of a system composed of four parallel Boolean logic AND-gates (Figure 1a). It consists of a five node system that utilizes a network of transcription factors and synthetic microRNAs to receive the inputs, process, and transduce the information into four responses (Figure 1b). The decoder operation is based on two general layers, a “regulating layer” and a “regulated layer”, offering a flexible platform for achieving combinational logic in mammalian cells.
Figure 1.
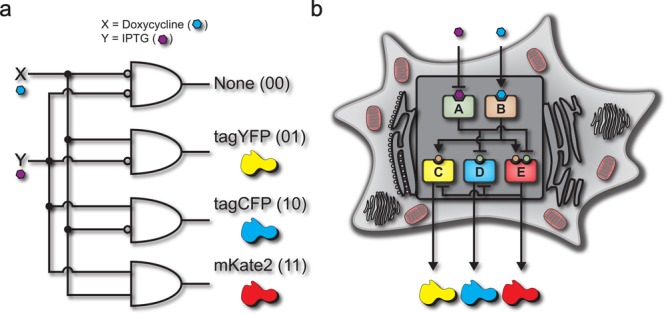
(a) Boolean logic illustration of a biological decoder with chemical inputs and fluorescence proteins as the outputs of the genetic circuit. (b) Node and edge schematic of the decoder circuit within a cell. The system consists of five distinct nodes combined into two distinct layers which interact through activation and inhibition edges. Nodes A and B comprise the “regulating” nodes, while nodes C, D, and E comprise the “regulated” nodes.
We provide experimental results that show proper operation of the decoder in human cells and serve as a proof-of-principle toward future biological and medical applications. Importantly, the modular outputs of the current implementation can be easily replaced with any gene product (e.g., custom transcription activator-like effectors30), thereby allowing for a multiplexed interface with a diverse array of cellular functions.
Results and Discussion
Decoder Architecture and Implementation
Each node of the circuit is composed of well-studied biological parts (Figure 2a, Supporting Information Biological Parts). We use two promoters, two transcription factors (TFs), a synthetic microRNA, and the corresponding three operator sites. The promoters are a human polybiquitin C (UbC) and the Cytomegalovirus (CMV) immediate-early. The transcription factors are the reverse tetracycline-controlled transactivator (rtTA; an activator) and the LacI-KRAB fusion protein (an inhibitor). We use a synthetic microRNA based on miR30, the miR-FF4.11,28 The operator sites are the TET response element (TRE), the lac operator (LacO), and finally, three tandem targets of perfect complementarity to miR-FF4. Combinations of these parts were used to build distinct computation layers: the “regulating” layer (nodes A and B) and the “regulated” layer (nodes C, D, and E), shown in Figure 2a. We used the small molecules doxycycline (DOX) and Isopropyl β-d-1-thiogalactopyranoside (IPTG) as the inducers that control the “regulating” layer, which in turn programs the “regulated” nodes to produce the four outputs (including the nonproduct case).
Figure 2.

(a) Illustration showing the system nodes, the DNA architecture of each node, and the outputs of each node of the decoder. There are two layers of the decoder architecture: a “regulating” layer and a “regulated” layer. The “regulating” layer consists of two nodes: node A and node B. Both node A and B constitutively produce gene products which are the transcription factors rtTA and LacI-KRAB. Node A responds to the input IPTG by becoming inactivated. Node B responds to the input DOX by becoming activated. The “regulated” nodes consist of three nodes: node C, D, and E. Each node consists of combinations of promoters, transcription factors, operator sites, fluorescence proteins, synthetic microRNAs, and degradation tags. (b) Node and edge diagram for each state of the decoder, showing active edges for each individual state. In the “00” state (IPTG:0, DOX:0), node A is active and node B is inactive. Node A inhibits nodes D and E, while node B cannot activate nodes C and E. This results in the nonproduct case of the decoder. In the “01” state (IPTG:0, DOX:0), node A is active and node B is active. Node A inhibits nodes D and E, while node B activates nodes C and E. This results in the production of tagYFP as the decoder output. In the “10” state (IPTG:1, DOX:0), node A is inactive and node B is inactive. Node A is prevented from inhibiting nodes C and E, while node B cannot activate nodes C and E. This results in the production of tagCFP as the decoder output. In the “11” state (IPTG:1, DOX:1), node A is inactive and node B is active. Node A is prevented from inhibiting nodes C and E, while node B activates nodes C and E. This results in mRNA output of all three nodes (C, D, and E). However, a feedback mechanism is incorporated into node E which prevents the translation of the outputs from nodes C and D. This results in mKate2 as the decoder output. (c) Biological interactions of nodal components within the decoder architecture for each Boolean state. The four decoder cases are shown to illustrate the interactions the inputs have with the effector proteins, the interactions the effector proteins have with the DNA components, and the interactions between the feedback mechanism and its accompanying targets.
Node A of the system architecture is a genetic construct consisting of the CMV promoter followed by the downstream LacI-KRAB fusion gene. This node constitutively produces the LacI-KRAB protein and becomes inactivated with the addition of the input IPTG. Node B is a genetic construct consisting of the CMV promoter followed by the transactivation protein, rtTA. As with node A, node B constitutively produces its gene product, the rtTA protein, and becomes an active node only when the input DOX is added. Nodes A and B are the first layer of the decoder circuit and serve by creating a link between the input molecules and the regulated layer. The second, or regulated, layer of the decoder contains three nodes. Node C of this layer consists of the TRE followed by the downstream gene of yellow fluorescence protein (tagYFP), a protein degradation pest domain,31 and last, three targets of perfect complementarity to miR-FF4. Node D consists of the UbC promoter, two repeats of the lac operator sites, the cyan fluorescence protein (tagCFP), and three targets of perfect complementarity to miR-FF4. Node E contains the TRE promoter, two repeats of the lac operator sites, the far-red fluorescence protein mKate2,32 a pest domain, and last miR-FF4, which provides an internal feedback mechanism.
Inputs are the chemical signals received by the system and outputs are the fluorescent proteins produced. The input/output function of the circuit is a decoder that converts two cellular inputs into four unique outputs. Specifically, the four states are no signal without any input (IPTG:0, DOX:0), producing tagYFP with DOX input (IPTG:0, DOX:1), producing tagCFP with IPTG input (IPTG:1, DOX:0), and producing mKate2 when the circuit receives both IPTG and DOX inputs (IPTG:1, DOX:1) (Figure 2b and c).
The first state of the biological decoder is the absence of both IPTG and DOX inputs (Figure 2b and c, “00”). In the absence of IPTG, node A is active and constitutively produces the inhibitor LacI-KRAB, which allows this node to inhibit nodes D and E. The edge between these nodes prevents the production of the tagCFP and mKate2 outputs by the LacI-KRAB binding the lac operator in nodes D and E, therefore inhibiting transcription. Additionally, since the DOX input is absent, node B remains inactive because the rtTA protein requires DOX to operate as an active inducer, resulting in nodes C and E remaining inactive. This restricts the production of tagYFP and mKate2. Therefore, in the “00” state, the downstream effect of node A being ON and node B being OFF is the nonproduct case of the decoder state.
The second state of the biological decoder is the absence of IPTG and the presence of DOX inputs (Figure 2b and c, “01”). In this instance, when the DOX input is added to the system, node B becomes activated because rtTA undergoes a conformational change to its active state, which can subsequently bind and can activate the TRE in nodes C and E. However, node A is still active because of the absence of the IPTG input, and represses nodes D and E with LacI-KRAB. Even though the promoter on node E is activated by rtTA the (fine-tuned) presence of LacI-KRAB is sufficient to inhibit the production of mKate2. Therefore, in the “01” state, the downstream effect of node A being ON and node B being ON results in tagYFP being produced as the sole output.
The third state of the biological decoder is the presence of IPTG and the absence of DOX inputs (Figure 2b and c, “10”). In this case, the IPTG input serves to inactivate node A by causing a conformational change in the LacI-KRAB protein to an inactive state. With node A inactivated, the edge between node A and nodes D and E is turned OFF. Furthermore, node B is inactive because the absence of the DOX input, which prevents the rtTA protein from activating the TRE of nodes C and E. Therefore, in the “10” state, the downstream effect of node A being OFF and node B being OFF results in tagCFP being produced as the sole output.
The fourth state of the biological decoder is the presence of IPTG and the presence of DOX inputs (Figure 2a and b, “11”). The connections that occurred in states “01” and “10” are utilized within this final state of the decoder to achieve the last independent output. Similar to state “01”, node B is activated through the addition of the DOX input by causing the rtTA to transition to its active activation state. Also, as in state “10”, node A is inactivated through the addition of the IPTG input, which transitions the LacI-KRAB to its inactive repressor state. These changes in the regulating layer allow nodes D and E to be free of the repressor LacI-KRAB and nodes C and E to be activated by rtTA. Therefore, all nodes of the regulated layer are active. Here, we incorporate a feedback mechanism controlled by node E. When node E is active, along with the output mKate2, the microRNA miR-FF4 is cotranscribed, which inhibits the mRNAs produced by nodes C and D. This post-transcriptional inhibitory mechanism allows mKate2 to be produced independently from the other two outputs. The result of node A being OFF and node B being ON results in mKate2 being produced as the sole output of the “11” state. In summary, the decoder yields orthogonal outputs by responding to input signals, by means of processing the chemical information with a 2-node regulating layer, transducing the signal into a 3-node regulated layer, and finally producing a measurable response.
Decoder Characterization
The synthetic circuit was tested in human embryonic kidney cells (Tet-On 3G), which contain a stable integration of the rtTA protein under a constitutive promoter. To validate the circuit, approximately 200 000 cells were plated per well, transfected after 24 h, induced immediately after transfection with the appropriate “input” chemical molecule(s), and grown an additional 48 h, concluding with characterization by flow cytometry. The IPTG and DOX concentrations used to induce the decoder were 10 mM and 2.5 μg/mL, respectively. To emulate the four states, each perspective well was induced with or without the IPTG and DOX inputs immediately after transfection. For the experiment in Figure 3, 50 ng of each node (Figure 2a) were transfected into the kidney cells. Flow cytometry was performed to probe the population behavior and fluorescence microscopy was used to qualitatively confirm the results.
Figure 3.

(a) Histograms of kidney cells transfected with the decoder circuit (50 ng per node) for the four states of the decoder. Each row shows histograms for each color of each state, while each column shows each state. The ON states (“01”for tagYFP, “10” for tagCFP, and “11” mKate2) for each state of the decoder show significant increase from all OFF states. Additionally, in each histogram in the upper right-hand corner is the number of cells above the 102au threshold. (b) Fluorescence microscopy of the four outputs. There are five columns: a bright field showing the live cells, a tagYFP, tagCFP, and mKate2 field, and last an overlap of the three fluorescence fields. Each row is a different state of the decoder. Each field is normalized to the same intensity, so that images from the same column can be compared with each other. (c) The normalized background subtracted mean fluorescence intensity of single cells. The MFI corresponds to the data shown in panel a. Each state of the decoder shows the correct ON signal in the appropriate case, with leakage significantly lower in all OFF states. (d) Flow cytometry scatter plots showing the four states of the system. Each column shows a different fluorescent output on the _y_-axis and each row shows a different state of the circuit. In each scatter plot, in the upper right-hand corner is the frequency of cells that fall above the background fluorescence gate (102 au). The black dots on the scatter plots are single cells that fall below the background fluorescence threshold, while the colored dots are single cells that fall above this threshold. The bar graph on the side of the FACs scatter plots shows the integrated mean fluorescence intensity (iMFI) for each state of the decoder. This correlates with the MFI quantity, showing a 4–5 fold change between all ON and OFF states.
For analysis of the transfected cells using flow cytometry, single cells were isolated (Supporting Information Figure 1), followed by calculating the mean fluorescence intensity (MFI) of the gated cells and subtracting the mean background signal. As illustrated in Figure 3a, the circuit exhibits the desired input/output behavior: “01” to tagYFP, “10” to tagCFP, “11” to mKate2, and finally, no signal for “00”. The normalized microscopy images for each perturbation are shown in Figure 3b and are in agreement with the MFI cytometry data. Each row of images contains a bright field image, the tagYFP, tagCFP, and the mKate2 field, and finally the overlap of all signals. Notably, the microscopy images show a virtually digital behavior. Even when we apply a wide fluorescence intensity range for the normalization of each channel (Supporting Information Figure 2), the observable by microscopy leakage is minimal. In accordance with the flow cytometry data of Figure 3a, the most significant leakage appears for tagCFP in the “00” case, mKate2 in the “01” case, and tagYFP in the “11” case; however, these states are significantly lower than the ON states.
We hypothesize that the circuit leakage originates mainly from the multiplasmid transient transfection conditions. The complete decoder consists of four separate plasmids and 1 stably integrated gene. With the circuit residing in multiple vectors, because of the transient transfections, there is high likelihood that cells uptake a subset of the total circuit resulting in leakage or other incorrect input/output behavior. However, even with leakage, the fold MFI change is approximately 3-fold between all leakage OFF states and ON states (Figure 3c).
Numerous genetic circuits of different complexity have been created over the years. Importantly, there is a vast variety in the conditions associated with transient transfections (reagents, cells, mass of DNA). Typically the circuits are optimized for specific conditions and the mean fluorescence intensity is the standard metric in quantifying their output. In our case, 50 ng of each vector resulted in optimal separation of the ON/OFF states as judged by the MFI. Other concentrations and ratios between the decoder vectors resulted in inferior performance. Importantly, the MFI fold differences become progressively worse for low vector concentrations (Supporting Information Figure 3). The reason is that the MFI neglects a crucial circuit characteristic, namely the number of cells that yield output above background fluorescence. This number becomes particularly important in transient transfections of several plasmids and at low mass concentrations where only a few aberrant cells can bias significantly the mean fluorescence intensity.
To probe this issue, we performed a simple experiment utilizing one of the plasmids of the decoder circuit. The architecture of this plasmids is the same as “node C” in Figure 2. The node consists of the TRE followed by the downstream gene of yellow fluorescence protein (tagYFP), a protein degradation pest domain, and last, three targets of perfect complementarity to miR-FF4. In this example, when the plasmid is transfected alone, there are only two states. An “OFF” state when the small molecule doxycycline is absent and an “ON” state when the molecule is added to the transfected cells. In analyzing cells positively transfected for tagYFP, we set a gate based on untransfected cells (Supporting Information Figure 4). By taking the mean tagYFP fluorescence of cells within this transfected gate, we observe a 3-fold increase in tagYFP fluorescence in the “OFF” state compared to the “ON” state (Supporting Information Figure 5a), which is clearly an artifact. In analyzing this quantitative artifact, it is useful to look at the frequency of cells above the tagYFP transfected gate (Supporting Information Figure 5b). We observe that the “OFF” state has a frequency of cells within the gate of 0.21% while the “ON” state has as frequency of cells within the gate of 29.2% of all live single cells. Analyzing the frequency of cells above this gate, we indeed see that a few aberrant cells significantly bias the mean fluorescence intensity.
In order to address this issue, we used the integrated mean fluorescence intensity (iMFI)27,33,34 to analyze our data. We note that the integrated mean and median fluorescence intensity are practically the same for our data (Supporting Information Figure 6). The iMFI takes into consideration both the frequency (f) and the mean fluorescence intensity (MFI) of the cells within a selected gate. The frequency of the cells within the gate is the number of cells within the gate divided by the parent population (the total number of cells), expressed as a percentile. The iMFI is the product of f and MFI. The iMFI therefore approximates the area of a histogram, giving a quantitation of the pictorial descriptor, when the total amount of single live cells remains constant between circuit states. For the simple example used previously (Supporting Information 5d), the integrated mean fluorescence intensity shows a true fold change between the “ON” and “OFF” state of the genetic architecture, and in agreement with qualitative microscopy.
For our decoder experiments, the flow cytometer voltage for the tagYFP, tagCPP, and mKate2 was adjusted to set the negative (untransfected) population at under 102 arbitrary units. To calculate the iMFI we set a gate that collects events over the background fluorescence threshold (Supporting Information Figure 4). In Figure 3d, the black events correspond to the cells that are below the threshold while the rest are above (yellow, cyan, and red events). Additionally, in each graph the frequency of cells above the threshold is shown. As illustrated in Figure 3d, the normalized iMFI is similar to the MFI, showing approximately 5-fold difference between the ON and OFF states.
Importantly, if we compare the MFI and iMFI, we observe that the iMFI is more robust to the transfection conditions (Supporting Information Figure 3). The MFI of the very low concentration transfection (Supporting Information Figure 3, condition 1) shows high leakage on most OFF states. Specifically, the leakage for mKate OFF states in the “00” and “01” cases is in the same range with the ON state. However, if we examine the individual histograms and scatter plots, shown in Supporting Information Figure 7, we notice that the level of leakage is not significant and stems primarily from few, possibly false-positive, events thereby confirming our hypothesis. In contrast, at these low concentrations, the iMFI points to the true leaking states, tagCFP for “00”, mKate2 for “01”, and tagYFP for “11” (Supporting Information Figure 7). To summarize, we believe that the iMFI can be an important metric in the analysis of genetic circuits, in particular for multivector and low mass transient transfections, where false positive and negative events are common.
Conclusions
Here, we present a novel genetic architecture that can convert information from two chemical molecules into four observable responses in the form of fluorescent proteins. The circuit utilizes several modules in a two-layer architecture. The logic of the decoder can be extended to implement more than 2 inputs with relatively simple modifications. We show a clear separation between ON and OFF states with approximately 3-fold mean fluorescence difference. Additionally, we adopt the integrated mean fluorescence intensity for the characterization of the circuit and show that this metric is more robust to transfection conditions when compared to the mean fluorescent intensity.
General-purpose decoder architectures can allow us to implement combinational control in cells with several practical applications. As a direct application, the output fluorescence proteins can be replaced with active proteins in order to create an interface with endogenous cellular pathways (Supporting Information Figure 8). For example, the outputs can be used to apply transcriptional control through TALEs fused with transactivation or repression domains.30 In a more specific example, a decoder can interface with the cell-cycle by producing outputs that interact with crucial junction proteins of the cell cycle (e.g., retinoblastoma for G1 arrest, HIV-VPR for G2 arrest, hBax for apoptosis). Toward computing objectives, we envision that the decoder circuit can be used as a modular unit of higher-order circuits, such as a multiplexer (Supporting Information Figure 9).
As a future objective for decoder architectures, eliminating leakage in OFF states would be a highly desirable characteristic. In the current version, the negative feedback employed does not completely inhibit the target and does result to leakage in the “OFF” states. We expect that future architectures will adopt a collection of tools such as recombinases,26,37 in order to limit the use of inherently leaky transcriptional/post-transcriptional regulation mechanisms.
Methods
Mammalian Cell Culture and Transient Transfections
A Tet-On 3G cell line (Clonetech, catalog number: 630931) constitutively producing the protein rtTA was used for all experiments performed. The cell line was sustained in an environment at 37 °C, and atmosphere of 5% CO2. The cell line was grown in high glucose Dulbecco’s modified Eagle’s medium (DMEM, Invitrogen, catalog number: 11965-092) that was supplemented with 50 mL of 10% Fetal Bovine Serum (FBS, Atlanta Biologicals, catalog number: S11550), 2.5 mL of 10 000 units/mL penicillin antibiotic and 2.5 mL of 10 000 μg/mL streptomycin antibiotic (penicillin–streptomycin liquid, Invitrogen, catalog number: 151140-122) and 5.5 mL of 100X MEM nonessential amino acids (Invitrogen, catalog number: 11140-050). All transient transfections had 200 000 cells in 1 mL of complete supplemented DMEM media added to each well of a Cellstar 12 well cell culture multiwall plate (Greiner Bio-One, catalog number: 665180) and were allowed to grow for 24 h. For jetPRIME transfections, up to 1 μg of total plasmid DNA was added to 75 μL of jetPRIME Buffer and 2.4 μL of jetPRIME transfection reagent (Polyplus, catalog number: 114-07). All transfection solutions prepared were vortexed gently and allowed to incubate at room temperature for 10 min. After incubation, each solution was added to the cells and was mixed by gently shaking. When appropriate to the circuit architecture, Doxycycline (Sigma-Aldrich, product number: D9891) and IPTG (Sigma-Aldrich, product number: I6758) were added to the cells immediately after transfection. Quantitative and qualitative analysis of all experiments was performed 48 h after transfections were completed.
Fluorescence Microscopy
Microscopy was performed 48 h after transfections occurred. The cells grown on a Cellstar 12 well cell culture multiwall plate were image analyzed with a Olympus IX81 microscope equipped with Sutter filter wheels, a Solent brand environmental chamber held at 37 °C, and a Prior Scientific mechanized stage. Microscopy images were collected with an Orca ERII camera, which was cooled to −60 °C and utilized in the high precision (14 bit) mode. This mode was used with a 20X Plan-APOCHROMAT NA 0.8, PH2 objective. The Chroma filter settings were as follows: ET436/20x (excitation) and ET480/40m (emission) for tagCFP, ET500/20x (excitation) and ET535/30m (emission) for tagYFP, and ET560/40x (excitation) and ET630/74m (emission) for mKate2. Experimental data collection and processing of the images was performed in Slidebook 5.0 software package. All images obtained experimentally were collected at the same exposure time per field of interest, underwent identical processing, and when compared with various cases of the circuit, normalized to the same fluorescent intensities.
Flow Cytometry
Cells were prepared as follows: 48 h after transfection complete media was removed from cells plated on the Cellstar 12 well cell culture multiwall plate. Once media was removed, cells were trypsinized with 0.15 mL 0.25% trypsin–EDTA at 37 °C for 3 min. The trypsin–EDTA was then neutralized with 0.85 mL of supplemented DMEM which also resuspended the cells. The cell suspension was centrifuged at 1000 rpm for 5 min, the supernatant was decanted, and the cell pellet was resuspended in 0.5 mL PBS buffer. The cell suspension was then analyzed on a BD LSRII flow analyzer. TagCFP was measured with a 445 nm laser and a 515/20 band-pass filter at a voltage of 240 V. TagYFP was measured with a 488 nm laser, a 535 emission filter, and a 545/35 band-pass filter at a voltage of 300 V. MKate2 was measured with a 561 nm laser, 610 emission filter, and 610/20 band-pass filter at a voltage of 320 V. Over 150 000 events were collected per well.
Acknowledgments
This work was funded by the US National Institutes of Health (NIH) grant R15GM09627, TxACE SRC grant P12095, and National Science Foundation (NSF) grant 1105524. We thank Yi Li and Taek Kang for discussions.
Supporting Information Available
Additional figures as described in the text. This material is available free of charge via the Internet at http://pubs.acs.org/.
Author Contributions
M.G. conceived the circuit and performed the experiments. M.G. and L.B. analyzed the data and prepared the manuscript. L.B. supervised the project.
The authors declare no competing financial interest.
Funding Statement
National Institutes of Health, United States
Supplementary Material
References
- Benenson Y. (2012) Biomolecular computing systems: Principles, progress and potential. Nat. Rev. Genet. 13, 455–468. [DOI] [PubMed] [Google Scholar]
- Ro D.; Paradise E. M.; Ouellet M.; Fisher K. J.; Newman K. L.; Ndungu J. M.; Ho K. A.; Eachus R. A.; Ham T. S.; Kirby J.; Chang M. C. Y.; Withers S. T.; Shiba Y.; Sarpong R.; Keasling J. D. (2006) Production of the antimalarial drug precursor artemisinic acid in engineered yeast. Nature 440, 940–943. [DOI] [PubMed] [Google Scholar]
- Bokinsky G.; Peralta-Yahya P. P.; George A.; Holmes B. M.; Steen E. J.; Dietrich J.; Soon Lee T.; Tullman-Ercek D.; Voigt C. A.; Simmons B. A.; Keasling J. D. (2011) Synthesis of three advanced biofuels from ionic liquid-pretreated switchgrass using engineered Escherichia coli. Proc. Natl. Acad. Sci. U.S.A. 108, 19949–19954. [DOI] [PMC free article] [PubMed] [Google Scholar]
- Widmaier D. M.; Tullman-Ercek D.; Mirsky E. A.; Hill R.; Govindarajan S.; Minshull J.; Voigt C. A. (2009) Engineering the salmonella type III secretion system to export spider silk monomers. Mol. Syst. Biol. 5, 309. [DOI] [PMC free article] [PubMed] [Google Scholar]
- Xie Z.; Wroblewska L.; Prochazka L.; Weiss R.; Benenson Y. (2011) Multi-input RNAi-based logic circuit for identification of specific cancer cells. Science 333, 1307–1311. [DOI] [PubMed] [Google Scholar]
- Gupta S.; Bram E. E.; Weiss R. (2013) Genetically programmable pathogen sense and destroy. ACS Synth. Biol. 2, 715. [DOI] [PubMed] [Google Scholar]
- Appukuttan D.; Rao A. S.; Apte S. K. (2007) Engineering of deinococcus radiodurans R1 for bioprecipitation of uranium from dilute nuclear waste. Appl. Environ. Microbiol. 73, 1393–1393. [DOI] [PMC free article] [PubMed] [Google Scholar]
- Brim H.; McFarlan S. C.; Fredrickson J. K.; Minton K. W.; Zhai M.; Wackett L. P.; Daly M. J. (2000) Engineering Deinococcus radiodurans for metal remediation in radioactive mixed waste environments. Nat. Biotechnol. 18, 85–90. [DOI] [PubMed] [Google Scholar]
- Purnick P. E. M.; Weiss R. (2009) The second wave of synthetic biology: From modules to systems. Nat. Rev. Mol. Cell Biol. 10, 410–422. [DOI] [PubMed] [Google Scholar]
- Elowitz M. B.; Leibler S. (2000) A synthetic oscillatory network of transcriptional regulators. Nature 403, 335–338. [DOI] [PubMed] [Google Scholar]
- Rinaudo K.; Bleris L.; Maddamsetti R.; Subramanian S.; Weiss R.; Benenson Y. (2007) A universal RNAi-based logic evaluator that operates in mammalian cells. Nat. Biotechnol. 25, 795–801. [DOI] [PubMed] [Google Scholar]
- Tamsir A.; Tabor J. J.; Voigt C. A. (2011) Robust multicellular computing using genetically encoded NOR gates and chemical “wires”. Nature 469, 212–215. [DOI] [PMC free article] [PubMed] [Google Scholar]
- Friedland A. E.; Lu T. K.; Wang X.; Shi D.; Church G.; Collins J. J. (2009) Synthetic gene networks that count. Science 324, 1199–1202. [DOI] [PMC free article] [PubMed] [Google Scholar]
- Jayanthi S.; Nilgiriwala K. S.; Del Vecchio D. (2013) Retroactivity controls the temporal dynamics of gene transcription. ACS Synth. Biol. 2, 431–441. [DOI] [PubMed] [Google Scholar]
- Garg A.; Lohmueller J. J.; Silver P. A.; Armel T. Z. (2012) Engineering synthetic TAL effectors with orthogonal target sites. Nucleic Acids Res. 40, 7584. [DOI] [PMC free article] [PubMed] [Google Scholar]
- Sleight S. C.; Sauro H. M. (2013) Randomized BioBrick assembly: A novel DNA assembly method for randomizing and optimizing genetic circuits and metabolic pathways. ACS Synth. Biol. 2, 506–518. [DOI] [PubMed] [Google Scholar]
- Stricker J.; Cookson S.; Bennett M. R.; Mather W. H.; Tsimring L. S.; Hasty J. (2008) A fast, robust and tunable synthetic gene oscillator. Nature 456, 516–519. [DOI] [PMC free article] [PubMed] [Google Scholar]
- Bleris L.; Xie Z.; Glass D.; Adadey A.; Sontag E.; Benenson Y. (2011) Synthetic incoherent feedforward circuits show adaptation to the amount of their genetic template. Mol. Syst. Biol. 7, 519. [DOI] [PMC free article] [PubMed] [Google Scholar]
- Hasty J.; McMillen D.; Collins J. J. (2002) Engineered gene circuits. Nature 420, 224–230. [DOI] [PubMed] [Google Scholar]
- Lienert F.; Torella J. P.; Chen J.; Norsworthy M.; Richardson R. R.; Silver P. A. (2013) Two- and three-input TALE-based AND logic computation in embryonic stem cells. Nucleic Acids Res. 41, 9967. [DOI] [PMC free article] [PubMed] [Google Scholar]
- Rosenfeld N., Young J. W., Alon U., Swain P. S., Elowitz M. B. (2007) Accurate prediction of gene feedback circuit behavior from component properties. Mol. Syst. Biol. 3. [DOI] [PMC free article] [PubMed] [Google Scholar]
- Kosuri S.; Goodman D. B.; Cambray G.; Mutalik V. K.; Gao Y.; Arkin A. P.; Endy D.; Church G. M. (2013) Composability of regulatory sequences controlling transcription and translation in Escherichia coli. Proc. Natl. Acad. Sci. U.S.A. 10.1073/pnas.1301301110. [DOI] [PMC free article] [PubMed] [Google Scholar]
- Kang T.; White J. T.; Xie Z.; Benenson Y.; Sontag E.; Bleris L. (2013) Reverse engineering validation using a benchmark synthetic gene circuit in human cells. ACS Synth. Biol. 2, 255–262. [DOI] [PMC free article] [PubMed] [Google Scholar]
- Bilitchenko L.; Liu A.; Cheung S.; Weeding E.; Xia B.; Leguia M.; Anderson J. C.; Densmore D. (2011) Eugene—A domain specific language for specifying and constraining synthetic biological parts, devices, and systems. PLoS One 6, e18882. [DOI] [PMC free article] [PubMed] [Google Scholar]
- Gardner T. S.; Cantor C. R.; Collins J. J. (2000) Construction of a genetic toggle switch in Escherichia coli. Nature 403, 339–342. [DOI] [PubMed] [Google Scholar]
- Siuti P.; Yazbek J.; Lu T. K. (2013) Synthetic circuits integrating logic and memory in living cells. Nat. Biotechnol. 31, 448–452. [DOI] [PubMed] [Google Scholar]
- Auslander S.; Auslander D.; Muller M.; Wieland M.; Fussenegger M. (2012) Programmable single-cell mammalian biocomputers. Nature 10.1038/nature11149. [DOI] [PubMed] [Google Scholar]
- Leisner M.; Bleris L.; Lohmueller J.; Xie Z.; Benenson Y. (2010) Rationally designed logic integration of regulatory signals in mammalian cells. Nat. Nano 5, 666–670. [DOI] [PMC free article] [PubMed] [Google Scholar]
- Li Y.; Moore R.; Guinn M.; Bleris L. (2012) Transcription activator-like effector hybrids for conditional control and rewiring of chromosomal transgene expression. Sci. Rep. 2, 897. [DOI] [PMC free article] [PubMed] [Google Scholar]
- Corish P.; Tyler-Smith C. (1999) Attenuation of green fluorescent protein half-life in mammalian cells. Protein Eng. 12, 1035–1040. [DOI] [PubMed] [Google Scholar]
- Shcherbo D.; Murphy C. S.; Ermakova G. V.; Solovieva E. A.; Chepurnykh T. V.; Shcheglov A. S.; Verkhusha V. V.; Pletnev V. Z.; Hazelwood K. L.; Roche P. M.; Lukyanov S.; Zaraisky A. G.; Davidson M. W.; Chudakov D. M. (2009) Far-red fluorescent tags for protein imaging in living tissues. Biochem. J. 418, 567–574. [DOI] [PMC free article] [PubMed] [Google Scholar]
- Darrah P. A.; Patel D. T.; De Luca P. M.; Lindsay R. W. B.; Davey D. F.; Flynn B. J.; Hoff S. T.; Andersen P.; Reed S. G.; Morris S. L.; Roederer M.; Seder R. A. (2007) Multifunctional TH1 cells define a correlate of vaccine-mediated protection against leishmania major. Nat. Med. 13, 843–850. [DOI] [PubMed] [Google Scholar]
- Shooshtari P.; Fortuno E. S.; Blimkie D.; Yu M.; Gupta A.; Kollmann T. R.; Brinkman R. R. (2010) Correlation analysis of intracellular and secreted cytokines via the generalized integrated mean fluorescence intensity. Cytometry Part A 77A, 873–880. [DOI] [PMC free article] [PubMed] [Google Scholar]
- Bonnet J.; Yin P.; Ortiz M. E.; Subsoontorn P.; Endy D. (2013) Amplifying genetic logic gates. Science 340, 599–603. [DOI] [PubMed] [Google Scholar]
Associated Data
This section collects any data citations, data availability statements, or supplementary materials included in this article.