Epigenomic annotation of genetic variants using the Roadmap EpiGenome Browser (original) (raw)
. Author manuscript; available in PMC: 2016 Apr 1.
Published in final edited form as: Nat Biotechnol. 2015 Apr;33(4):345–346. doi: 10.1038/nbt.3158
To the Editor
Advances in next-generation sequencing platforms have reshaped the landscape of functional genomic and epigenomic research as well as human genetics studies. Annotation of non-coding regions in the genome with genomic and epigenomic data has allowed for new testable hypotheses regarding the functional consequences of genetic variants associated with human complex traits1,2. Large consortiums such as NIH Roadmap Epigenomics3 and ENCODE4 have generated tens of thousands of sequencing-based genome-wide datasets, creating a powerful resource for the scientific community5. The WashU EpiGenome Browser6–8 continues to provide a platform for investigators to effectively engage with this resource in the context of analyzing investigators’ own data.
We have created the Roadmap EpiGenome Browser (http://epigenomegateway.wustl.edu/browser/roadmap), a Genome Browser based on the WashU EpiGenome Browser. The Roadmap EpiGenome Browser is a visualization and bioinformatics tool to explore the tissue-specific regulatory roles of genetic variants associated with diseases. The Browser takes advantage of over ten thousand epigenomic datasets we currently host, including 346 "complete epigenomes", defined as tissues/cell types for which we have collected a complete set of DNA methylation, histone modification, open chromatin, and other genomic datasets9. The Browser seamlessly integrates the NIH Roadmap Epigenomics and ENCODE resources using a new “Data Hub Cluster” framework (Supplementary Notes, Supplementary Fig. 1,2). Investigators can specify any number of SNP-associated regions and any type of epigenomic data, for which the Browser automatically creates “virtual data hubs” through a shared hierarchical metadata annotation, retrieves the data, and performs real-time clustering analysis. Investigators interact with the Browser to determine the tissue specificity of the epigenetic state encompassing genetic variants in physiologically or pathogenically relevant cell types from normal or diseased samples (Supplementary Notes, Tutorial 1, Supplementary Fig. 3,4).
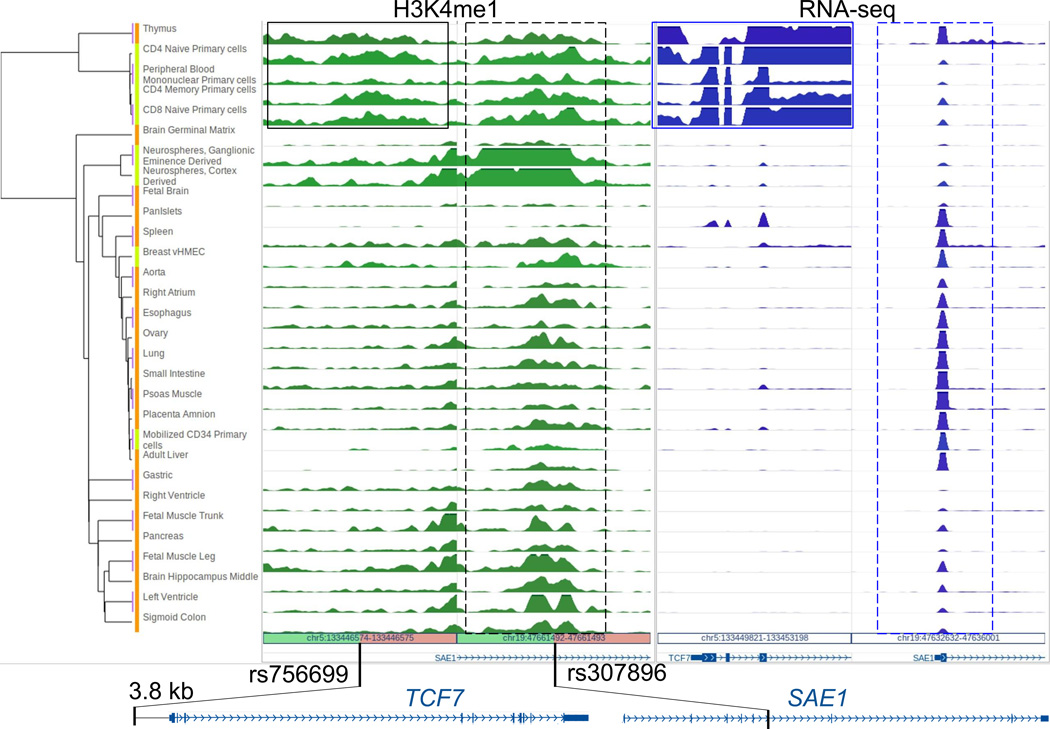
We illustrate the epigenomic annotation of two non-coding GWAS SNPs associated with multiple sclerosis (MS)10 by clustering the H3K4me1 profile of SNP-harboring regions and RNA-seq signal of their closest genes across multiple primary tissues and cells (Fig. 1). Both SNPs lie within putative enhancer regions. While rs307896 marks an enhancer common across cell types, rs756699 is located in an enhancer specific to immune cells and is potentially targeting TCF7, a T cell specific gene, 3.8kb downstream (Fig. 1, Supplementary Fig. 5). Thus, reference epigenomes provide important clues into the functional relevance of these genetic variants in the context of the pathophysiology of MS, including inflammation11. Investigators can also use the Browser to identify co-variation of epigenomic, transcriptomic, and transcription factor binding profiles across cell types to predict relationships between regulatory sites and target genes (Supplementary Notes, Tutorial 1, Supplementary Fig. 6–8). Additionally, investigators can explore multiple complete reference epigenomes in different Browser panels in parallel using synchronized genomic coordinates or independent genomic coordinates. A variety of EpiGenome Browser functions, including gene set view, genome juxtaposition, chromatin interaction display, and statistical testing can be applied to better engage with this epigenomic resource (Supplementary Notes, Tutorial 1, Supplementary Fig. 9). We also provide the means for investigators to build their own Data Hub Clusters of different scales and clone the Browser on Amazon Cloud to visualize and analyze private data in the context of public data (Tutorial 2). These tools, along with the rapidly growing epigenomic datasets of human cells of different states, will play a critical role in translating genetic signals into molecular mechanisms, leading to prognostic, diagnostic and therapeutic advances.
Figure 1.
Multiple sclerosis-associated GWAS SNPs are annotated using epigenomic and expression data from 31 primary human tissues (orange) and cells (light green). H3K4me1 ChIP-seq read density (in green) is shown for a 6-kb region centered on each SNP. RNA-seq read density (in blue) is shown over the 5’ end of genes that are closest to these SNPs. Hierarchical clustering is applied to both H3K4me1 and RNA-seq data. The region associated with rs756699 has H3K4me1 mostly confined to immune-related cell types (solid black box). The closest gene TCF7 (3.8 kb downstream) also shows strong expression in the same group of cell types (solid blue box, Supplementary Fig. 9). The region surrounding rs307896 has H3K4me1 signal in all tissues/cell types (dashed black box). rs307896 lies in an intron of SAE1, a gene which is also expressed in all the samples (dashed blue box). Normalized gene expression values (RPKM) for TCF7 and SAE1 are included in Supplementary Fig. 5.
Supplementary Material
Supplement-tutorial-1
Supplement-tutorial-2
supplemental-text
REFERENCES
- 1.Paul DS, Soranzo N, Beck S. BioEssays : news and reviews in molecular, cellular and developmental biology. 2014;36:191–199. doi: 10.1002/bies.201300126. [DOI] [PMC free article] [PubMed] [Google Scholar]
- 2.Ritchie GR, Dunham I, Zeggini E, Flicek P. Nature methods. 2014;11:294–296. doi: 10.1038/nmeth.2832. [DOI] [PMC free article] [PubMed] [Google Scholar]
- 3.Bernstein BE, et al. Nature biotechnology. 2010;28:1045–1048. doi: 10.1038/nbt1010-1045. [DOI] [PMC free article] [PubMed] [Google Scholar]
- 4.Consortium EP, et al. Nature. 2012;489:57–74. [Google Scholar]
- 5.Chadwick LH. Epigenomics. 2012;4:317–324. doi: 10.2217/epi.12.18. [DOI] [PMC free article] [PubMed] [Google Scholar]
- 6.Zhou X, Li D, Lowdon RF, Costello JF, Wang T. Bioinformatics. 2014 doi: 10.1093/bioinformatics/btu191. [DOI] [PMC free article] [PubMed] [Google Scholar]
- 7.Zhou X, et al. Nature methods. 2013;10:375–376. doi: 10.1038/nmeth.2440. [DOI] [PMC free article] [PubMed] [Google Scholar]
- 8.Zhou X, et al. Nature methods. 2011;8:989–990. doi: 10.1038/nmeth.1772. [DOI] [PMC free article] [PubMed] [Google Scholar]
- 9.Consortium RE. Nature. 2014 [Google Scholar]
- 10.Sawcer S, et al. Nature. 2011;476:214–219. doi: 10.1038/nature10251. [DOI] [PMC free article] [PubMed] [Google Scholar]
- 11.Compston A, Coles A. Lancet. 2002;359:1221–1231. doi: 10.1016/S0140-6736(02)08220-X. [DOI] [PubMed] [Google Scholar]
Associated Data
This section collects any data citations, data availability statements, or supplementary materials included in this article.
Supplementary Materials
Supplement-tutorial-1
Supplement-tutorial-2
supplemental-text
