S-S Synapsis during Class Switch Recombination Is Promoted by Distantly Located Transcriptional Elements and Activation-Induced Deaminase (original) (raw)
. Author manuscript; available in PMC: 2016 Aug 10.
SUMMARY
Molecular mechanisms underlying synapsis of activation-induced deaminase (AID)-targeted S regions during class switch recombination (CSR) are poorly understood. By using chromosome conformation capture techniques, we found that in B cells, the Eμ and 3′Eα enhancers were in close spatial proximity, forming a unique chromosomal loop configuration. B cell activation led to recruitment of the germline transcript (GLT) promoters to the Eμ:3′Eα complex in a cytokine-dependent fashion. This structure facilitated S-S synapsis because Sμ was proximal to Eμ and a downstream S region was corecruited with the targeted GLT promoter to Eμ:3′Eα. We propose that GLT promoter association with the Eμ:3′Eα complex creates an architectural scaffolding that promotes S-S synapsis during CSR and that these interactions are stabilized by AID. Thus, the S-S synaptosome is formed as a result of the self-organizing transcription system that regulates GLT expression and may serve to guard against spurious chromosomal translocations.
INTRODUCTION
In mature B cells, class switch recombination (CSR) promotes diversification of effector functions encoded in constant (CH) regions while maintaining the original antigen binding specificity arising from V(D)J joining. The mouse IgH locus (Igh) contains eight CH genes (encoding μ, δ, γ3, γ1, γ2a, γ2b, ε, and α chains) that are embedded in a 220 kb tract (Chevillard et al., 2002; Zhou et al., 2002) and are located downstream of the V, D, and J segments. Isotype class switching involves an intrachromosomal deletional rearrangement that focuses on regions of 1–10 kb of repetitive switch (S) DNA located upstream of each CH gene (with the exception of Cδ). In class switch recombination (CSR), hybrid Sμ-Sx junctions are formed on the chromosome while the intervening genomic material is looped out and excised as a circle. CSR is targeted to specific S regions by the selective transcriptional activation of germline transcripts (GLTs) (reviewed in Manis et al., 2002; Stavnezer, 2000) and may be dependent on isotype-specific factors (Kenter et al., 2004; Ma et al., 2002; Shanmugam et al., 2000). Activation-induced deaminase (AID) is a single-strand DNA-specific deaminase that is required for CSR (Muramatsu et al., 2000) and leads to the formation of double-strand breaks (DSBs) in S regions (Catalan et al., 2003; Rush et al., 2004; Schrader et al., 2005; Wuerffel et al., 1997). AID- and uracil-DNA glycosylase (UNG)-dependent DSBs are processed through a cascade of events mediated by base excision repair (BER), mismatch repair, nonhomologous end joining (NHEJ), and error-prone polymerases, thereby facilitating the formation of S-S junctions (Dudley et al., 2005; Kenter, 2005).
S regions targeted for recombination can be separated by as much as 150 kb, and this distance is likely to be an impediment for S-S synapse formation. It has been inferred that two DNA repair proteins, 53BP1 and γ-H2AX, are involved in S region synapsis because targeted deletion of the genes encoding these proteins abolished or reduced CSR, respectively, whereas intra-Sμ rearrangements and mutations were retained (Reina-San-Martin et al., 2003, 2007). However, 53BP1 and γ-H2AX normally engage in DSB repair processes that protect against large chromosomal deletions (Bekker-Jensen et al., 2005; Celeste et al., 2002; Mochan et al., 2004; Rogakou et al., 1999). This leads to the perplexing question of how distantly located S region-specific DSBs are recruited to partner in a CSR reaction that leads to intrachromosomal deletion.
The mouse β-globin genes and their locus control region (LCR) located more than 50 kb away engage in higher-order loop structures during transcription, and these interactions are tightly correlated with gene-specific expression (Carter et al., 2002; Tolhuis et al., 2002). Loop structures have also been detected in imprinted (Horike et al., 2005; Murrell et al., 2004) and cytokine (Spilianakis and Flavell, 2004) clusters and between chromatin boundary elements (Blanton et al., 2003). In the Igh locus, inducible transcription from the downstream GLT promoters requires the 3′Eα LCR (Manis et al., 1998; Pinaud et al., 2001) and suggests that communication might occur through direct interaction between these distant cis elements by loop formation. The physical proximity between the downstream GLT promoters with 3′Eα may facilitate transcription but would be unlikely to mediate S-S synapsis because the downstream S regions would not be in close proximity to Sμ.
By using chromosome conformation capture (3C) techniques, we have examined long-range interactions in the Igh locus. In splenic B cells poised for CSR, the Igh locus assumed a unique and unanticipated chromosomal loop conformation in vivo in which the Eμ enhancer directly interacted with the downstream 3′Eα LCR. The Sμ region was closely arrayed in cis with Eμ. The Eμ:3′Eα structure could facilitate S-S synapsis after GLT promoter activation, because an S region would travel with its proximal GLT promoter to the Eμ:3′Eα complex and there come into close proximity with Sμ. Strong recruitment of GLT promoters to the Eμ:3′Eα complex was cytokine dependent and correlated with transcription activation. These interactions were dependent on the 3′Eα LCR, as indicated by the fact that deletion of the hypersensitive site (hs) 3b,4 largely abrogated Eμ:3′Eα complex formation and GLT promoter association, whereas deletion of the Sμ tandem repeats (TR) had no apparent impact on these LRIs. Deletion of the 220 bp core Eμ enhancer had essentially no effect on recruitment of GLT promoters to the enhancer complex and only a slight effect on CSR. Although AID expression was not required for the interaction of Eμ with 3′Eα, it was required for strong GLT promoter association with the Eμ:3′Eα complex, indicating that AID stabilizes S-S synapsis either directly through a scaffolding function or indirectly through DNA repair processes emanating from AID-dependent DSB formation in S regions. Our investigation of Igh locus-wide intrachromosomal interactions has led to a new model for generating S-S synapsis in which GLT expression is integrally linked to the formation of an architectural scaffold produced through long-range associations between Igh transcription regulatory elements.
RESULTS
The Chromosome Conformation Capture Assay for the Igh Locus
The chromosome conformation capture (3C) assay (Dekker et al., 2002; Tolhuis et al., 2002) was used to detect long-range interactions (LRIs) between transcriptional regulatory elements in the CH subregion of the murine IgH locus. In this assay, treatment of live cells with formaldehyde leads to crosslinking of proteins to other nearby proteins and DNA. After cleavage with restriction enzyme, intramolecular ligation of interacting crosslinked DNA fragments results when the protein: DNA network is ligated under low concentration conditions. After ligation, crosslinks are reversed and ligation products are quantified by PCR with primer pairs located at the ends of the restriction fragments under study. The crosslinking frequency of any two restriction fragments is proportional to the frequency with which the genomic sites interact and provides a snapshot of the spatial organization of the locus in vivo.
The organization of the CH region of the Igh locus is diagrammed in Figure 1A. The Eμ intronic enhancer is located at the 5′ end of the CH subregion. The 3′ regulatory region, 3′Eα, contains hypersensitive sites (hs) 3a, hs1,2, hs3b, and hs4 and has been shown to function as an LCR (reviewed in Khamlichi et al., 2000). Further downstream there are additional hs sites 5–7 (Garrett et al., 2005). Sequestered between the two enhancers are eight CH region genes with their attendant S regions and GLT promoters (with the exception of Cδ). HindIII restriction fragments were used for 3C analysis of the Igh locus (Figure 1A). Fragments A and G contain the Eμ and 3′Eα enhancers, respectively, whereas fragments B, D, E, and F each encompass an S region with its I exon and GLT promoter. A HindIII fragment with no S region or GLT promoter was used as a negative control (fragment C).
Figure 1. B Cell-Specific Association of the Eμ and 3′Eα Enhancers and Looping of the Intervening Igh Locus.

(A) The 3′ portion of the Igh locus containing CH genes spans 220 kb (Chevillard et al., 2002). HindIII restriction fragments (A–G) used in the 3C assays are shown. Primers are indicated by arrows above and below each fragment.
(B) The Gapd locus is shown, and HindIII restriction fragments G.a and G.b are 3.5 kb apart.
(C) The equation used to calculate the relative crosslinking frequency between two Igh restriction fragments (XIgH). SIgH is the signal obtained with primer pairs for two different Igh restriction fragments, and SGapd is the signal obtained with primer pairs for the Gapd locus fragments G.a and G.b. This calculation gives the relative crosslinking frequency for each cell type or activation state and corrects for differences in PCR amplification efficiencies, crosslinking and ligation efficiencies, the amounts of template used, and the size of the PCR products.
(D) Representative examples of chromosome conformation capture (3C) assays of the Igh locus are shown. Primer pairs for Igh locus fragments A and G and Gapd fragments G.a and G.b were used in PCR to detect amplification products from crosslinked templates derived from unstimulated (U) and LPS+IL4 (L+I)-stimulated B cells (lanes 1 and 2), unstimulated (U) and ConA-stimulated splenic T cells (lanes 3 and 4), no template (lane 5), and control mix (lane 6). PCR was carried out in the presence of [α-32P]dCTP, and products were resolved by 6% PAGE in TBE and then were quantitated by phosphorimaging.
(E) The relative crosslinking frequencies observed in splenic B cells that were unstimulated (U) or activated with LPS (L) or LPS+IL4 (L+IL4) and splenic T cells that were unstimulated (U) or activated with ConA are shown (left). Templates were prepared in the presence or absence of formaldehyde (HCHO) as indicated. A schematic is shown of the looped Igh locus in which the Eμ and 3′Eα enhancers interact (right).
(F) Chromatin templates from unstimulated splenic B cells were analyzed for relative crosslinking frequencies between anchor fragment A (Eμ) and fragments C–G (left) and between anchor fragment G (3′Eα) and fragments A and C–F (right). The average relative crosslinking frequencies were derived from at least three independent chromatin preparations, and each sample was PCR amplified in duplicate at least twice and SEMs are shown. The crosslinking frequency of the two neighboring Gapd fragments (3.5 kb apart) is arbitrarily assigned the value of 1. Scaling on the y axis permits direct comparison with all other figures.
A series of controls to assess the efficacy of the 3C method for the Igh locus were performed (see Figures S1–S3 in the Supplemental Data available online). To permit comparison of crosslinking and ligation efficiencies between sample preparations, we measured the crosslinking frequency between two Gapd gene-specific HindIII fragments (G.a and G.b), which are separated by 3.5 kb and are located on chromosome 2 (Figure 1B). The equation for calculating the relative crosslinking frequency is shown (Figure 1C). The crosslinking frequency for the two Gapd fragments was arbitrarily set to a value of 1 to enable sample comparisons.
The Igh Locus Adopts a Looped Configuration in Splenic B Cells but Not in T Cells
We performed 3C analysis on IgM-expressing splenic B and nonexpressing splenic T cells to assess the spatial configuration of the Igh locus. In unstimulated B cells, there was an elevated crosslinking frequency for Eμ and 3′Eα, which are located on separate HindIII fragments (A and G in Figure 1A); such crosslinking was not evident in the absence of chromatin template (Figure 1D, compare lanes 1 and 5). Intrachromosomal association of Eμ and 3′Eα was cell type specific because little or no amplification was observed in T cells (Figure 1D, lane 3). The absence of Eμ and 3′Eα interaction in T cells does not reflect impaired annealing of primers resulting from polymorphisms because B and T cells were analyzed from the same mouse strain. Consistent results were obtained for three independent chromatin preparations assayed in duplicate in two independent PCR amplifications (Figure 1E). Next, we asked whether the intrachromosomal interaction between Eμ and 3′Eα was altered by cell activation. B cell stimulation with LPS or LPS+IL4 slightly augmented the association of Eμ and 3′Eα and depended on formaldehyde crosslinking, whereas this interaction was not evident in T cells after ConA stimulation (Figures 1D and 1E). These data indicated that the intrachromosomal association of the Eμ and 3′Eα elements created a looped structure encompassing the intervening Igh locus in unstimulated and activated splenic B cells (Figure 1E, right). In the nonexpressing T cells, the Igh locus was in a linear configuration as evidenced by the absence of Eμ and 3′Eα crosslinking. The association of the Eμ and 3′Eα enhancers in B cells was remarkable, considering that the two sites are separated by 200 kb on the linear chromatin template.
The Igh Locus Is Poised for Transcription Activation in B Cells
To further investigate the spatial organization of the Igh locus, we undertook a locus-wide assessment of LRIs involving the Eμ and 3′Eα enhancers with other elements of the locus in unstimulated B cells. We found detectable crosslinking between the Eμ and 3′Eα anchor fragments (A and G) and the γ3, γ1, and ε fragments (D, E, and F) that each contain S region and GLT promoter elements (Figure 1F). These intramolecular interactions did not occur due to simple proximity, as shown by the fact that fragment C, which was devoid of S DNA and GLT promoters, was not involved in crosslinking to either the Eμ or 3′Eα enhancer fragments. In addition, crosslinking frequencies were zero for templates isolated from unstimulated splenic T cells (data not shown). These data indicated that the loop created by the intrachromosomal association of Eμ and 3′Eα brought the GLT promoters into sufficient physical proximity with the enhancer core to enable a low amount of crosslinking (Figure 1F). Consequently, in B cells, the enhancers and GLT promoters are in a spatial configuration that is poised for transcription activation and GLT expression.
Long-Range Recruitment of the GLT Promoters to the Eμ-3′Eα Enhancer Complex Is Transcription Dependent
To relate the spatial configuration of the Igh locus and transcriptional status, 3C analyses were performed on splenic B cells that were stimulated to undergo CSR. At 48 hr of B cell activation, GLTs and AID are well expressed and AID-dependent DSBs have formed (Catalan et al., 2003; Rush et al., 2004; Schrader et al., 2005; Wang et al., 2006; Wuerffel et al., 1997), but recombination has not yet transpired (Figure S4; Casellas et al., 1998). The 48 hr time point was used for all 3C analyses because it is likely to be representative of events that are predisposing for CSR whereas later time points may reflect changes that occur as a consequence of recombination. B cell activation by LPS or LPS+IL4 was confirmed by the induction of Aicda (AID) and GLT transcription as compared to the Gapd loading control (Figure 2A, top). The γ3 GLTs were constitutively expressed in unstimulated B cells, induced after LPS activation, and repressed somewhat by the addition of LPS+IL4. In contrast, γ1 and ε GLT expression were found only after LPS+IL4 induction. CSR was assessed by the post-switch transcript (PST) RT-PCR assay, and switching was detectable at 5 days after activation and correlated with GLT expression (Figure 2B, bottom). The PST switching profile was confirmed by FACS analysis (Figure S5).
Figure 2. Locus-Wide 3C Assays Indicate that Recruitment of a GLT Promoter to the Eμ-3′Eα Enhancers Is Correlated with Transcription Activation.
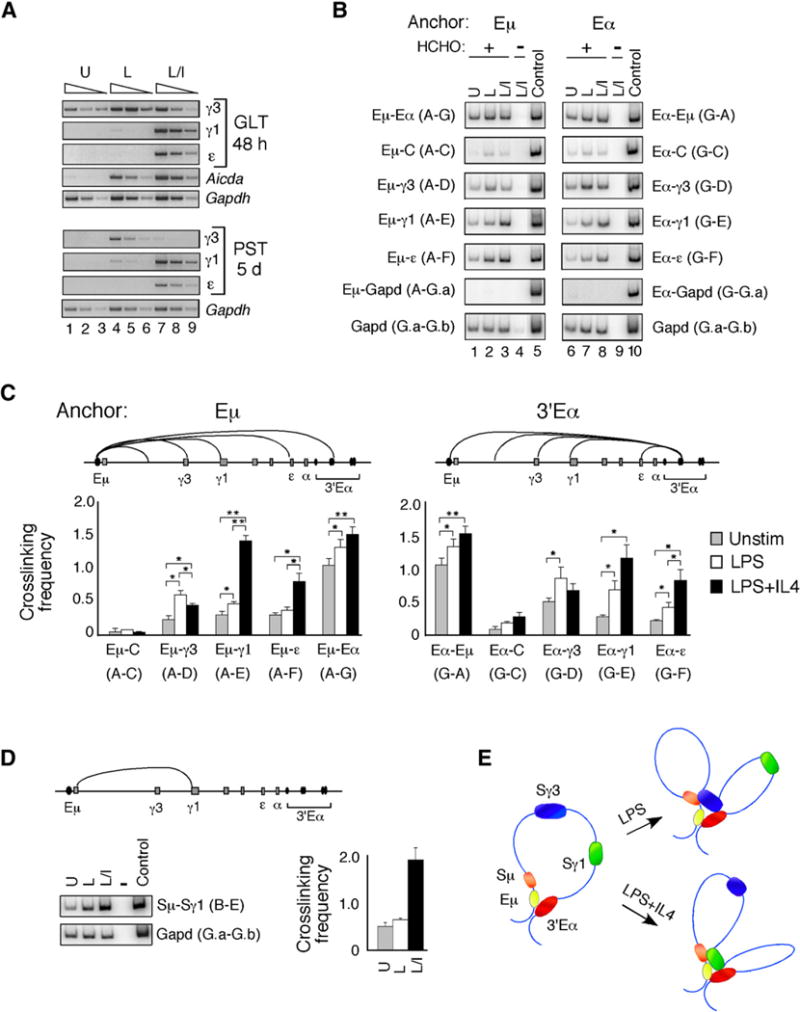
(A) GLTs (top) and post-switch transcripts (PSTs) (bottom) were analyzed by semiquantitative RT-PCR with cDNAs derived from splenic B cells that were unstimulated or activated with LPS or LPS+IL4 for 48 hr (GLTs) and 5 days (PSTs). Gapd PCR products were harvested after 30 cycles (lanes 1, 4, 7), 28 cycles (lanes 2, 5, 8), and 26 cycles (lanes 3, 6, 9). GLT, Aicda, and PST PCR products were harvested after 33 cycles (lanes 1, 4, 7), 31 cycles (lanes 2, 5, 8), or 29 cycles (lanes 3, 6, 9).
(B) B cells were unstimulated (U) or activated with LPS (L) or LPS+IL4 (L+I) for 48 hr, and chromatin templates were prepared in the presence or absence of formaldehyde (HCHO) as indicated. Representative examples of crosslinking in B cells between anchors Eμ and 3′Eα (fragments A and G) with each other and with all other fragments (C–F) in the Igh locus are shown. Crosslinking between each of the anchors Eμ and 3′Eα (fragments A and G) with the Gapd fragment G.a is shown. Amplification of the control mix containing all combinations of ligated fragments is shown for each primer pair.
(C and D) The average relative crosslinking frequencies were derived from at least three independent chromatin preparations and each sample was PCR amplified in duplicate at least twice and SEMs are shown.
(C) Chromatin templates from unstimulated, LPS−, or LPS+IL4-activated splenic B cells were analyzed for relative crosslinking frequencies between anchor fragment A (Eμ) and the rest of the locus fragments (C–G) (left) and between anchor fragment G (3′Eα) and the rest of the locus fragments (A, C–F) (right). Student’s t test was used to determine the significance of the different levels of crosslinking frequencies in chromatin samples (*p < 0.05; **p < 0.001).
(D) Chromatin templates from unstimulated, LPS−, or LPS+IL4-activated splenic B cells were analyzed for relative crosslinking frequencies between anchor fragment B (Sμ) and fragment E (γ1).
(E) A schematic illustrating the long-range interactions between the Eμ and 3′Eα elements of the Igh locus in mature B cells. After B cell activation with LPS, the γ3 GLT promoter is recruited to the Eμ:3′Eα complex. Alternatively, LPS+IL4 stimulation triggers the interaction of the γ1 GLT promoter with the with the Eμ:3′Eα enhancer hub.
Locus-wide 3C studies were performed on LPS− and LPS+IL4-activated B cells (Figure 2B; Figure S6). After LPS activation, the relative crosslinking frequency of Eμ enhancer with fragment D, containing the γ3 GLT promoter, was 2.5-fold greater than in unstimulated B cells, whereas LPS had little effect on the association of Eμ with fragments containing the γ1 and ε GLT promoters, and these differences were statistically significant (Figure 2C). Conversely, LPS+IL4 treatment slightly reduced the interaction of Eμ with the γ3 GLT promoter, whereas LRIs between Eμ with γ1 and ε fragments (E, F) were enhanced by 4- and 2.5-fold, respectively, as compared to unstimulated B cells (Figure 2C). Comparable interactions were observed with 3′Eα as the anchor fragment in locus-wide studies (Figures 2B and 2C). The intrachromosomal interactions detected here were dependent on crosslinking because they did not occur in the absence of formaldehyde treatment, indicating that they did not arise as a result of DNA rearrangements (Figure 2B, lanes 4 and 9; Figure S6). Fragment C and Gapd (fragment G.a) showed very little crosslinking with either Eμ or 3′Eα in response to either LPS or LPS+IL4, demonstrating the specificity of these LRIs (Figures 2B and 2C). Furthermore, the relative crosslinking frequency between the Sμ fragment (B) and the γ1 fragment (E) was elevated 4-fold after LPS+IL4 activation as compared to LPS alone or no treatment, confirming that IL4 specifically affected recruitment of the γ1 locus to the region of Eμ-Sμ (Figure 2D). These studies demonstrated that after the induction of specific GLTs, the active gene was recruited to the Eμ-3′Eα complex (Figure 2E). This created an ordered spatial architecture that was structured by transcriptional elements and had the effect of bringing the downstream S region targeted for recombination into the vicinity of the Eμ-Sμ region, thereby promoting S-S proximity. However, these studies did not distinguish the relative contribution of promoter-enhancer interactions from those involved in S-S synapsis.
To determine whether the relative crosslinking frequency at specific isotypes was related to CSR incidence, we analyzed μ → γ3 and μ → γ1 switching after B cell activation with LPS or LPS+IL4 for 5 days, by FACS analysis (Figure S5). The results from three independent experiments were amalgamated and indicated that μ → γ3 and μ → γ1 switching occurred in 15% ± 2% and 40% ± 4% of B cells, respectively. Therefore, the incidence of isotype switching paralleled the relative crosslinking frequency between the Eμ enhancer and the relevant GLT promoters, indicating that the interactions between the GLT promoters and the Eμ:3′Eα complex occurred in switching B cells. It should be noted that the γ3 GLT was expressed in unstimulated splenic B cells, providing an explanation for the relatively high association between the γ3 GLT promoter and the 3′Eα LCR prior to B cell activation.
S Region Sequence Is Not a Major Contributor to LRIs in the Igh Locus
The close proximity of the Eμ with Sμ and the downstream S regions with their paired GLT promoters makes it difficult to discern which elements contribute to the LRIs we detect in the Igh locus. To directly assess the importance of S DNA in S-S synapsis, we examined the locus-wide interactions of the Igh locus in splenic B cells derived from Sμ tandem repeat (TR)-deficient (SμTR Δ/Δ) mice (Luby et al., 2001). In these mice, all the Sμ TRs were removed, with the exception of 15 GAGCT pentamers, which are AID hotspot motifs. CSR frequency was reduced 50%–87% of WT, indicating that the Sμ TRs make a relatively modest contribution to the CSR efficiency (Luby et al., 2001). Appropriate B cell activation in SμTR Δ/Δ mice was achieved with LPS or LPS+IL4 treatment as assessed by the expression of GLTs and the presence of PSTs (Figure S7). Relative crosslinking frequencies between the Eμ and 3′Eα anchor fragments (A and G) and the downstream γ3, γ1, and ε fragments (D, E, and F) were overall very similar to those found for WT for all stimulation states, and differences in crosslinking frequencies induced by specific activation conditions were statistically significant (p values ranged from p < 0.05 to p < 0.001) (Figure 3). Fragment C, devoid of a GLT promoter, displayed almost no detectable interactions with either Eμ or 3′Eα (Figure 3). Overall, the absence of the Sμ TRs has a modest impact on LRIs detected in the Igh locus, indicating that S DNA per se was not a major structural element in these associations.
Figure 3. Interaction of Eμ and 3′Eα with Each Other and with GLT Promoters Does Not Require the Sμ Region but Is Dependent on the Integrity of the 3′Eα Enhancer and AID Expression.
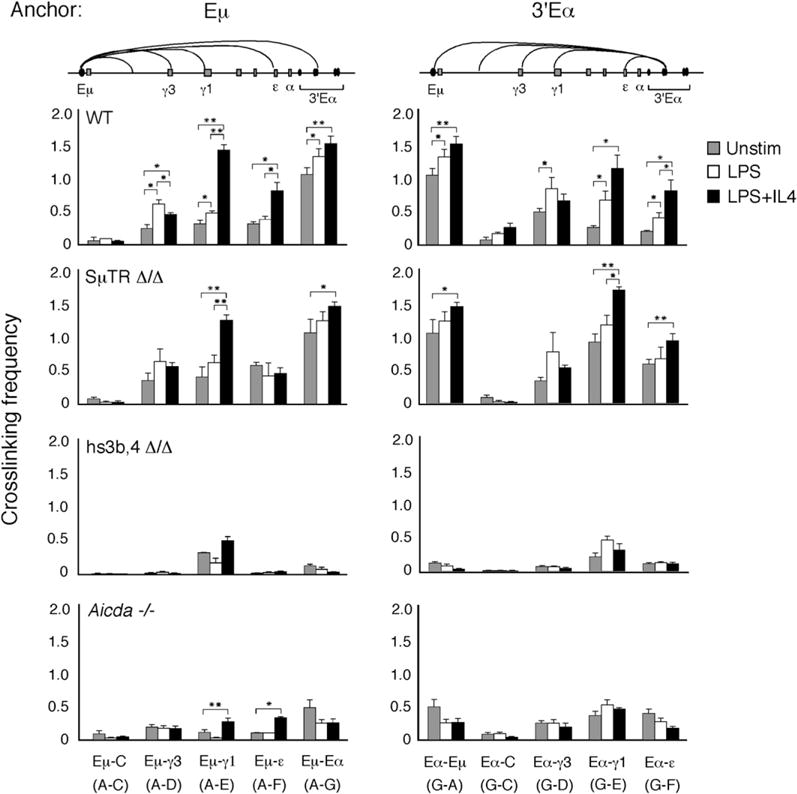
Relative crosslinking frequencies for three to six independent chromatin template preparations are shown for splenic B cells from WT, SμTR Δ/Δ, 3′Eα hs3b,4 Δ/Δ, and _Aicda_−/− mice that were unstimulated or activated with LPS alone or LPS+IL4 for 48 hr. Eμ or 3′Eα hs1,2 were used as anchor fragments that were used together with fragments from the rest of the locus, as indicated. Preparations of templates from C57BL/6 and C57BL/6×129 WT mice gave the same relative crosslinking values, and analyses were amalgamated here. Data represent standard errors of the mean values. Student’s t test was used to determine the significance of the different crosslinking frequencies in chromatin samples (*p < 0.05; **p < 0.001).
Deletion of the Core Eμ Enhancer Modestly Affects GLT Expression, Eμ:3′Eα Interactions, and CSR
The core Eμ (cEμ) enhancer is a 220 bp element that is flanked by two matrix attachment site sequences and is located between the JH cluster and SμTRs (reviewed in Ernst and Smale, 1995). VDJ joining is severely reduced in cEμ-deficient (Δ/Δ) mice, and consequently B cells represent only 10%–15% of cells in the spleen (Perlot et al., 2005; Sakai et al., 1999). In contrast, deletion of the cEμ enhancer causes at most a modest reduction of CSR (Perlot et al., 2005; Sakai et al., 1999). To determine whether the cEμ element influences Eμ:3′Eα complex formation, we analyzed chromatin samples from WT and cEμ Δ/Δ mice, derived from the 129Sve strain, by 3C technology. Resting (CD43−) B cells were isolated and were unstimulated or activated with LPS or LPS+IL4, as described above. Real-time RT-PCR analysis of the GLT profile revealed that in cEμ Δ/Δ B cells, the Iμ GLT was reduced relative to the WT (Figure S8A), as previously observed for pro-B cells (Perlot et al., 2005). In all other respects, the GLT expression profile appeared nearly identical in WT and cEμ Δ/Δ B cells (Figure S8A). FACS analysis revealed no reduction in μ → γ1 switching compared to WT, and μ → γ3 switching was reduced 50% of WT in cEμ Δ/Δ B cells (Figure S8B), as expected.
In unstimulated cEμ Δ/Δ B cells, the relative crosslinking frequencies between the Eμ and 3′Eα fragments (A and G) was reduced to 56% of WT, and this difference is statistically significant (p = 0.03), suggesting that cEμ may contribute somewhat to the Eμ:3′Eα interaction along with other as-yet-undefined elements (Figure 4). This pattern of intrachromosomal interaction was consistent with the reduced Iμ GLT expression found in unstimulated cEμ Δ/Δ B cells. After B cell activation, the relative crosslinking frequencies between the Eμ and 3′Eα fragments (A and G) and the downstream γ3, γ1, and ε fragments (D, E, and F) were overall very similar for both WT and cEμ Δ/Δ samples for all stimulation states (Figure 4). Fragment C, devoid of a GLT promoter, showed almost no interactions with either Eμ or 3′Eα (Figure 4). We concluded that deletion of the cEμ element modestly influenced the Eμ:3′Eα intrachromosomal interaction in unstimulated B cells and, upon B cell activation, had little influence on GLT promoter association with the Eμ:3′Eα complex. The equivalent recruitment of the downstream GLT promoters to the Eμ:3′Eα complex in WT and cEμ Δ/Δ B cells was strongly correlated with normal amounts of GLTs and CSR.
Figure 4. Eμ:3′Eα Complex Formation and Recruitment of GLT Promoters Is Not Dependent on the cEμ Enhancer Element.
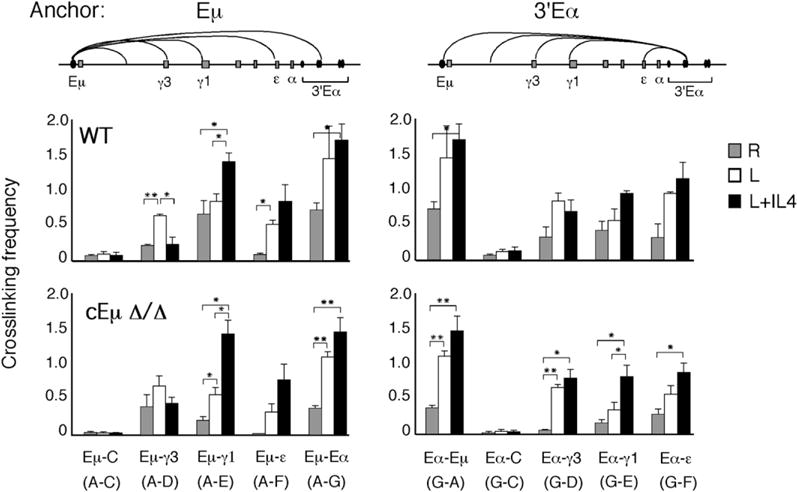
Relative crosslinking frequencies for two independent chromatin template preparations are shown for CD43− resting splenic B cells (R) from WT and cEμ Δ/Δ mice (129Sve strain) that were unstimulated or activated with LPS alone or LPS+IL4 for 48 hr. Eμ and 3′Eα hs1,2 were used as anchor fragments (A and G) that were used along with fragments from the rest of the locus, as indicated. Data represent standard errors of the mean values. Student’s t test was used to determine the significance of the different crosslinking frequencies in chromatin samples (*p < 0.05; **p < 0.001).
3′Eα Integrity Is Required for Intrachromosomal Interactions in the Igh Locus
The 3′Eα LCR is responsible for transcription of downstream GLTs, as indicated by the fact that targeted knockout of hs3b,4 leads to diminution of GLT expression (with the exception of γ1) (Pinaud et al., 2001). We sought to evaluate the influence of hs3b,4 on the ability of the 3′Eα element to associate with Eμ and GLT promoters by analyzing chromatin templates from the hs3b,4-deficient (Δ/Δ) mouse. The 3′Eα hs1,2 is located on fragment G, whereas hs3b,4 is located on a HindIII fragment 7 kb downstream. It was difficult to make primers for many of the HindIII fragments within 3′Eα because of the reiterated nature of the DNA sequence. Instead, we relied on the proximity of fragment G to hs3b,4 as an indicator of the disposition of this element. Analysis of hs3b,4 Δ/Δ B cells after activation with LPS and LPS+IL4 showed severely reduced γ3 and ε GLT and PST expression, whereas γ1 GLT and PST production were diminished but still detectable (Figure S7), as previously reported (Pinaud et al., 2001). In unstimulated hs3b,4 Δ/Δ-derived chromatin templates, the relative crosslinking frequency between Eμ and 3′Eα was reduced to 12% of WT and was not enhanced by LPS or LPS+IL4 treatment (Figure 3).
In stimulated B cells, relative crosslinking frequencies between Eμ and 3′Eα anchor fragments (A and G) and the downstream γ3 and ε fragments (D and F) were significantly reduced (p < 0.001) compared to those found for WT for all activation states (Figure 3), demonstrating that the structural integrity of the Eμ:3′Eα enhancer unit was dependent on the presence of hs3b,4 enhancer element and that the Eμ:3′Eα complex must form to enable subsequent GLT promoter recruitment and transcription from the γ3 and ε loci. We also observed that although the association of Eμ (fragment A) with the γ1 fragment (E) was poorly enhanced after B cell activation, the specific IL-4 inducibility of this interaction was retained whereas it was lost for 3′Eα and γ1 fragment interaction. Together, these results demonstrated that in any given hs3b,4 Δ/Δ B cell, the γ1 locus interacted with either Eμ or 3′Eα although these elements did not associate with each other. The long-range interaction of Eμ with the γ1 fragment preserved the possibility of CSR because Sμ and Sγ1 were in close proximity, and this was correlated with diminished but detectable μ → γ1 switching in hs3b,4-deficient B cells (see Figure S7 and Pinaud et al., 2001).
AID Expression Is a Major Contributor to LRIs in the Igh Locus
AID triggers the formation of DSBs in S regions (Rush et al., 2004; Schrader et al., 2005), and these breaks become a focus for recruitment of DNA repair proteins (Celeste et al., 2002; Petersen et al., 2001). To test the proposition that AID contributes to S-S synapsis, we analyzed Igh locus-wide interactions in AID-deficient mice. GLT and PST assays, for the _Aicda_−/− B cells, demonstrated appropriate GLT activation but absence of PSTs in response to LPS and LPS+IL4 activation (Figure S7), as previously described (Muramatsu et al., 2000). Surprisingly, in unstimulated _Aicda_−/− B cells, the relative crosslinking frequency between the Eμ and 3′Eα fragments (A and G) was reduced to 50% of WT (Figure 3). After B cell activation, locus-wide interactions between the Eμ and 3′Eα anchor fragments (A and G) and the downstream γ3, γ1, and ε fragments (D, E, and F) were reduced to between 14% and 17% of WT (Figure 3). Nonetheless, intrachromosomal interactions found for _Aicda_−/− B cells are higher than those of hs3b,4 Δ/Δ B cells, and these differences were statistically significant (p < 0.05) (Figure S9). Strikingly, in AID-deficient B cells, the reduced interaction between the Eμ and 3′Eα elements and GLT promoters was sufficient for GLT expression. The amount of GLT expression was essentially the same in WT and AID-deficient B cells, so it follows that the additional degree of crosslinking observed in WT chromatin templates arose from AID action independent of transcription. These findings demonstrated a role for AID or processes associated with DSB formation and DNA repair in stabilizing intrachromosomal interactions of the Igh locus.
The reduced degree of Eμ:3′Eα interaction in AID-deficient unstimulated splenic B cells was unexpected because AID is only slightly expressed in WT cells prior to B cell activation. The low Aicda expression in unstimulated cells was highlighted by comparison to that found in LPS+IL4-activated B cells (Figure 5A, compare lanes 1–3 and 7–9). Varying numbers of preactivated B cells were resident in the spleen and expressed Aicda and GLTs, whereas these molecules were absent in resting (CD43−) WT B cells (Figure 5A). To examine this issue, we sorted for resting (CD43−) WT B cells and found that the relative crosslinking frequency between Eμ and 3′Eα was reduced to 50% of total splenic B cells (Figure 5B). Next, we considered the possibility that the AID expressed in preactivated splenic B cells was responsible for enhanced Eμ:3′Eα interaction. The relative crosslinking frequencies for Eμ and 3′Eα were essentially the same in chromatin templates from _Aicda_−/− resting and total splenic B cells and very similar to WT resting B cells, thereby implicating AID rather than other aspects of B cell activation in stabilizing the Eμ:3′Eα complex (Figure 5B). We reasoned that AID expression in hs3b,4 Δ/Δ B cells might enhance Eμ:3′Eα interaction and obscure the real affect of hs3b,4 deletion on Eμ:3′Eα complex formation. Chromatin templates from hs3b,4 Δ/Δ total and resting B cells showed an essentially identical relative crosslinking frequency for Eμ:3′Eα and was reduced to 20% of WT and _Aicda_−/− resting B cells (Figure 5B), confirming that Eμ:3′Eα complex formation was critically dependent on the hs3b,4 element and leading to the not-mutually-exclusive suggestions that the initial formation of the Eμ:3′Eα complex was required prior to AID action and that AID later contributes to the scaffolding integrity.
Figure 5. AID Expression Augments the Association of the Eμ Enhancer and 3′Eα LCR Elements.
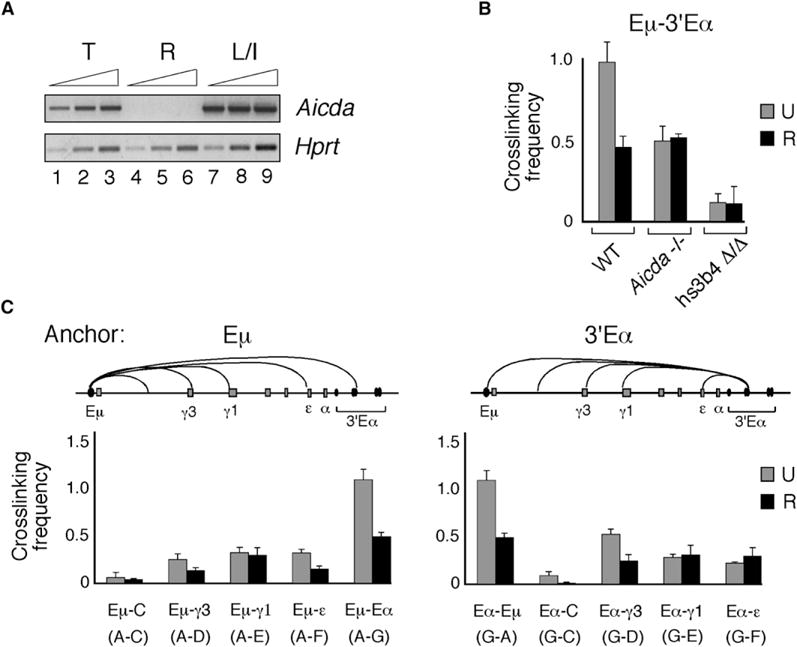
Unstimulated splenic B cell preparations (U) were obtained from B cell enrichment columns whereas resting splenic B cells (R) were isolated by sorting for CD43− B cells (Experimental Procedures).
(A) RT-PCR with cDNAs derived from unstimulated total splenic (T) B cells and CD43− resting (R) B cells. Hprt PCR products were harvested after 27 cycles (lanes 1, 4, 7), 29 cycles (lanes 2, 5, 8), and 31 cycles (lanes 3, 6, 9). AID PCR products were harvested after 33 cycles (lanes 1, 4, 7), 35 cycles (lanes 2, 5, 8), and 37 cycles (lanes 3, 6, 9).
(B and C) The average crosslinking frequencies along with SEMs were plotted on a scale where a value of 1 corresponds to the crosslinking frequency between the two neighboring Gapd fragments, G.a and G.b.
(B) Three independent chromatin template preparations were isolated from WT, _Aicda_−/−, and hs3b,4 Δ/Δ mice. Chromatin templates were prepared from unstimulated (U) and resting (R) splenic B cells, and crosslinking frequencies were determined for fragments A (Eμ) and G (3′Eα) and Gapd fragments G.a and G.b.
(C) Chromatin templates from unstimulated (U) and CD43− resting (R) splenic B cells from WT mice were analyzed for crosslinking frequencies between anchor fragment A (Eμ) and the rest of the Igh locus fragments (C–G) (left) and between anchor fragment G (3′Eα) and the rest of the locus fragments (A, C–F) (right).
DISCUSSION
Our studies indicate that the S-S synaptosome is formed in a stepwise process and in a manner contingent upon the presence of _Igh_-specific transcriptional regulatory elements and AID. In mature unstimulated B cells, the distantly located Eμ and 3′Eα regulatory elements associate in vivo to form a loop that encompasses the Igh CH genes, and these LRIs are not detected in splenic T cells. After B cell activation, GLT expression is dependent on recruitment of the targeted promoter and flanking S region to the Eμ:3′Eα complex and, therefore, into close proximity with the Sμ region. The proposition that GLT promoter and enhancer elements provide a scaffolding for S-S synapsis is supported by the observations that hs3b,4, a key regulatory component of the 3′Eα, is required for looping of the Igh locus as well as recruitment of GLT promoters to the Eμ:3′Eα enhancer complex. Deletion of the cEμ element leads to a modest reduction in Eμ:3′Eα interaction and is not required for the recruitment of the GLT promoters to the Eμ:3′Eα complex in activated B cells, consistent with its modest impact on CSR frequency. Similarly, the Sμ TRs are dispensible for these intrachromosomal interactions, and deletion of SμTRs has a modest effect on CSR. Thus, in B cells poised for CSR, the Igh locus assumes a unique and unanticipated chromosomal configuration that creates a structural scaffolding suitable for S-S synaptosome formation.
In unstimulated splenic B cells, looping in the Igh locus leads to closer spatial proximity of the GLT promoters with the Eμ:3′Eα complex to form a “poised” core chromatin conformation that later facilitates GLT expression in response to isotype-specific B cell activation. In the β-globin locus, a poised conformation has been reported in which the β-globin genes are not expressed but promoters and the LCR interact in erythroid cells (Carter et al., 2002; Tolhuis et al., 2002). The chromatin configuration in which a locus is heritably poised for gene expression even when it is transcriptionally silent may be a feature of genes that require rapid transcriptional activation (Smale, 2003). Indeed, B cell stimulation activates rapid GLT expression, consistent with a pre-existing poised Igh configuration.
After B cell activation, we found that the long-range interaction of tripartite Eμ, 3′Eα, and the targeted GLT promoter increased in WT B cells, thus juxtaposing Sμ and downstream S regions targeted for transcription. Although these interactions changed only slightly in _Aicda_−/− B cells in response to B cell activation, they were higher than those found in hs3b,4Δ/Δ B cells. Therefore, these intrachromosomal interactions in _Aicda_−/− B cells can account for the presence of GLT expression. However, the relationship between the relative crosslinking levels in 3C assays and gene function is only now being explored, and more work is needed to confirm the significance of the GLT promoter:Eμ:3′Eα interactions for GLT expression in _Aicda_−/− B cells. Our findings demonstrate that although transcriptional elements provide the architectural basis for initial S-S synapsis, the synaptosome is secondarily stabilized either directly through AID expression or indirectly through recruitment of DNA repair proteins to AID-dependent DSBs in S regions. In support of this interpretation, AID is required to initiate Nbs1 and γ-H2AX repair foci and mutations at S regions during CSR (Petersen et al., 2001). Activated γ-H2AX proteins form foci that spread up to a megabase flanking DSBs and have been implicated in S-S synapsis (Reina-San-Martin et al., 2003; Rogakou et al., 1999). DNA damage-induced foci are centers of DNA repair that simultaneously recruit multiple DSBs (Aten et al., 2004; Lisby et al., 2003), lending weight to the notion that increased S-S synapsis observed in our 3C assays is a consequence of DNA repair proteins coalesced at the sites of AID-induced DNA DSBs. Alternatively, AID may have scaffolding functions associated with its C terminus that mediate the LRIs after B cell activation. AID-directed scaffolding activity is suggested by a naturally occurring deletion at its C terminus that abolishes CSR while retaining the capability for mutagenesis in Sμ and V genes and introduction of intra-Sμ deletions (Barreto et al., 2003; Ta et al., 2003).
Low-frequency μ → γ1 CSR was recently detected in B cells in which the Sμ and Sγ1 regions were replaced by ISceI restriction sites, and DSBs were generated by the expression of the ISceI enzyme (Zarrin et al., 2006). These observations are consistent with our findings that the Igh locus assumes a poised configuration that favors the association of GLT promoters with the Eμ:3′Eα complex, thereby reducing the distance between S regions, although further work is required to confirm this interpretation. We propose that CSR evolved to ensure that S-S synapsis occurs only as a consequence of AID-dependent DSBs in two targeted S regions. In our model, the S-S synaptosome is formed in a process that couples a unique chromosomal architecture and the introduction of AID-dependent DSBs in two participating S regions directly with DNA repair to reduce the probability of chromosomal translocations.
In sum, our data indicate that the S-S synaptosome is formed as a result of a self-organizing transcription system leading to GLT production. The strict linkage of isotype-specific GLT expression and synapsis between S regions targeted for CSR spatially restricts DNA DSBs and may thereby reduce the danger of genome instability and chromosomal translocations.
EXPERIMENTAL PROCEDURES
Mice, Cell Culture, and FACS Analysis
The 3′Eα Δ/Δ mice (Pinaud et al., 2001) and matching wild-type (WT) were provided by J. Manis (Harvard University), Sμ TR Δ/Δ mice (Luby et al., 2001) and matching WT were a gift from E. Selsing (Tufts University), and the cEμ Δ/Δ and matched 129Sve WT mice (Perlot et al., 2005) were provided by F. Alt (Harvard University). C57BL/6 × 129 (AID WT) mice were purchased from Jackson Laboratories. _Aicda_−/− mice (Muramatsu et al., 2000) were a gift from T. Honjo (Kyoto University) and then bred under specific pathogen-free conditions in a fully accredited animal facility at the University of Illinois College of Medicine. Splenic B cells were prepared as described (Shanmugam et al., 2000; Wang et al., 2006) or were sorted for CD43− resting B cells by CD43 magnetic microbeads (MACS, Miltenyi) or were enriched for T cells with the mouse T cell enrichment column kit (MTCC-5, R&D) according to the manufacturer’s instructions. B cells were cultured and activated as described (Shanmugam et al., 2000; Wang et al., 2006). Splenic T cells were cultured at a density of 5 × 10⁵ to 1 × 10⁶ and stimulated in RPMI supplemented with 10% FCS and ConcanavalinA (ConA) (5 ng/ml) (15324505, MP Biomedical). Cells were collected at 0 hr, 48 hr, and 5 days to obtain RNA and DNA. Cells from 5 day cultures were washed in HBSS plus 2% FCS and were stained with various antibodies conjugated with fluorescein isothiocyanate (B220 –553087, IgG3 –553403, IgG1 –553443, Thy1.2 –553003, PharMingen; CD43 – 130-091-585, Miltenyi; IgM – 1020-02, Southern Biotech) and phycoerythrin (B220 –01125A, PharMingen) or biotin labeled (IgG1 –553441; PharMingen) and phycoerythrin-cy5 labeled (avidin –554062; PharMingen). Cells were analyzed with a FACSCalibur with Cellquest software (Becton Dickenson). The flow cytometry analyses represented 5,000–10,000 events and were gated for live lymphoid cells determined by forward and side scatter and by propidium iodide staining.
RNA Preparation and Semiquantitative RT-PCR
RNA was prepared with TRIzol (GIBCO) according to the manufacturer’s instructions. Semiquantitative RT-PCR for GLTs, PSTs, GAPDH, and AID transcripts were performed as described (Wang et al., 2006).
Chromosome Conformation Capture
The chromosome conformation capture (3C) assay (Dekker et al., 2002) was modified for mammalian cells (Tolhuis et al., 2002) and was used with additional adaptations. HindIII (Invitrogen) was used to generate restriction fragments in the Igh locus. Chromatin preparations were made from stimulated (5 × 10⁶) and unstimulated (1 × 10⁷) lymphocytes. Splenic B and T cells were washed in Hank’s Buffered Saline Solution (HBSS). Cells were crosslinked with 2% formaldehyde for 8 min at room temperature and the reaction was quenched with glycine. Next, nuclei were prepared by incubating the cells in cell membrane lysis buffer (CMLB) (10 mM Tris [pH 7.5], 5 mM MgCl2, 11% sucrose, 1% Triton X-100) containing protease inhibitors (1 mM PMSF, 10 μg/ml aprotonin, 10 μg/ml leupeptin, 10 μg/ml pepstatinA, 10 μg/ml phenanthroline, and 16 μg/ml benzamidine) for 10 min on ice. The cells were pelleted (720 × g for 10 min at 4°C) and treated again with CMLB. Treatment of the nuclei with HindIII and all subsequent steps, including restriction enzyme inactivation, ligation of the digested crosslinked chromatin, proteinase K treatment, reversal of crosslinks, and DNA purification, were performed as described (Tolhuis et al., 2002). After digestion with HindIII, aliquots of each chromatin sample were anayzed by real-time PCR with primers spanning each HindIII site to assess the degree of digestion (Figure S1). The control template was prepared as essentially described (Tolhuis et al., 2002). In brief, genomic DNA was PCR amplified across each HindIII site of interest to obtain a control fragment that was verified by DNA sequence analysis. DNA fragments spanning the HindIII sites were mixed in equimolar amounts, digested with HindIII, ligated, and added to genomic DNA. A complete laboratory protocol for 3C is available upon request.
PCR Analysis of the Ligation Products
The linear range of PCR amplification was determined for the control template and for the crosslinked chromatin templates by serial dilution as described (Tolhuis et al., 2002). PCR was carried out in 25 μl reactions containing 200 ng chromatin template DNA, 1.75 mM MgCl2, 400 μM each dNTP, 0.3 μl [α-32P]dCTP (3000 Ci/mmol), 0.4 μM each primer, and 1.5 U Platinum Taq (Invitrogen) with initial denaturation for 5 min at 95°C followed by 35 cycles of 94°C for 30 s/58°C for 30 s/72°C for 20 s. Radioactively labeled PCR products were resolved by 6% TBE PAGE and quantitated by phosphorimaging with a STORM 860 and ImageQuant software (Molecular Dynamics). Primer sequences are listed in Figure S3. In general, primers specific for the 3′ side of each restriction fragment were used for 3C analysis, with the exception of fragments C and E, where the 5′ side was used. All data points were generated from a minimum of three different chromatin samples derived from a minimum of three different mice. Relative crosslinking frequencies were calculated by the equation shown in Figure 1C. Data are presented in histograms as the average crosslinking frequency of all PCR reactions along with the standard error of the mean (SEM).
Supplementary Material
Wuerffel et al Suppl. Materils and Figures
Acknowledgments
This work was supported by the National Institutes of Health (AI052400 to A.L.K.; AI24465 to E.S.; and PO1CA092615 and Leukemia and Lymphoma Society SCOR grant to J.M). We thank T. Honjo for the _Aicda_−/− mice.
Footnotes
The authors declare that they have no competing financial interests.
References
- Aten JA, Stap J, Krawczyk PM, van Oven CH, Hoebe RA, Essers J, Kanaar R. Dynamics of DNA double-strand breaks revealed by clustering of damaged chromosome domains. Science. 2004;303:92–95. doi: 10.1126/science.1088845. [DOI] [PubMed] [Google Scholar]
- Barreto V, Reina-San-Martin B, Ramiro AR, McBride KM, Nussenzweig MC. C-terminal deletion of AID uncouples class switch recombination from somatic hypermutation and gene conversion. Mol Cell. 2003;12:501–508. doi: 10.1016/s1097-2765(03)00309-5. [DOI] [PubMed] [Google Scholar]
- Bekker-Jensen S, Lukas C, Melander F, Bartek J, Lukas J. Dynamic assembly and sustained retention of 53BP1 at the sites of DNA damage are controlled by Mdc1/NFBD1. J Cell Biol. 2005;170:201–211. doi: 10.1083/jcb.200503043. [DOI] [PMC free article] [PubMed] [Google Scholar]
- Blanton J, Gaszner M, Schedl P. Protein:protein interactions and the pairing of boundary elements in vivo. Genes Dev. 2003;17:664–675. doi: 10.1101/gad.1052003. [DOI] [PMC free article] [PubMed] [Google Scholar]
- Carter D, Chakalova L, Osborne CS, Dai YF, Fraser P. Long-range chromatin regulatory interactions in vivo. Nat Genet. 2002;32:623–626. doi: 10.1038/ng1051. [DOI] [PubMed] [Google Scholar]
- Casellas R, Nussenzweig A, Wuerffel R, Pelanda R, Reichlin A, Suh H, Qin XF, Besmer E, Kenter A, Rajewsky K, Nussenzweig MC. Ku80 is required for immunoglobulin isotype switching. EMBO J. 1998;17:2404–2411. doi: 10.1093/emboj/17.8.2404. [DOI] [PMC free article] [PubMed] [Google Scholar]
- Catalan N, Selz F, Imai K, Revy P, Fischer A, Durandy A. The block in immunoglobulin class switch recombination caused by activation-induced cytidine deaminase deficiency occurs prior to the generation of DNA double strand breaks in switch mu region. J Immunol. 2003;171:2504–2509. doi: 10.4049/jimmunol.171.5.2504. [DOI] [PubMed] [Google Scholar]
- Celeste A, Petersen S, Romanienko PJ, Fernandez-Capetillo O, Chen HT, Sedelnikova OA, Reina-San-Martin B, Coppola V, Meffre E, Difilippantonio MJ, et al. Genomic instability in mice lacking histone H2AX. Science. 2002;296:922–927. doi: 10.1126/science.1069398. [DOI] [PMC free article] [PubMed] [Google Scholar]
- Chevillard C, Ozaki J, Herring CD, Riblet R. A three-megabase yeast artificial chromosome contig spanning the C57BL mouse Igh locus. J Immunol. 2002;168:5659–5666. doi: 10.4049/jimmunol.168.11.5659. [DOI] [PubMed] [Google Scholar]
- Dekker J, Rippe K, Dekker M, Kleckner N. Capturing chromosome conformation. Science. 2002;295:1306–1311. doi: 10.1126/science.1067799. [DOI] [PubMed] [Google Scholar]
- Dudley DD, Chaudhuri J, Bassing CH, Alt FW. Mechanism and control of V(D)J recombination versus class switch recombination: similarities and differences. Adv Immunol. 2005;86:43–112. doi: 10.1016/S0065-2776(04)86002-4. [DOI] [PubMed] [Google Scholar]
- Ernst P, Smale ST. Combinatorial regulation of transcription II: The immunoglobulin mu heavy chain gene. Immunity. 1995;2:427–438. doi: 10.1016/1074-7613(95)90024-1. [DOI] [PubMed] [Google Scholar]
- Garrett FE, Emelyanov AV, Sepulveda MA, Flanagan P, Volpi S, Li F, Loukinov D, Eckhardt LA, Lobanenkov VV, Birshtein BK. Chromatin architecture near a potential 3′ end of the igh locus involves modular regulation of histone modifications during B-cell development and in vivo occupancy at CTCF sites. Mol Cell Biol. 2005;25:1511–1525. doi: 10.1128/MCB.25.4.1511-1525.2005. [DOI] [PMC free article] [PubMed] [Google Scholar]
- Horike S, Cai S, Miyano M, Cheng JF, Kohwi-Shigematsu T. Loss of silent-chromatin looping and impaired imprinting of DLX5 in Rett syndrome. Nat Genet. 2005;37:31–40. doi: 10.1038/ng1491. [DOI] [PubMed] [Google Scholar]
- Kenter AL. Class switch recombination: an emerging mechanism. Curr Top Microbiol Immunol. 2005;290:171–199. doi: 10.1007/3-540-26363-2_8. [DOI] [PubMed] [Google Scholar]
- Kenter AL, Wuerffel R, Dominguez C, Shanmugam A, Zhang H. Mapping of a functional recombination motif that defines isotype specificity for μ → γ3 switch recombination implicates NF-κB p50 as the isotype specific switching factor. J Exp Med. 2004;199:617–627. doi: 10.1084/jem.20031935. [DOI] [PMC free article] [PubMed] [Google Scholar]
- Khamlichi AA, Pinaud E, Decourt C, Chauveau C, Cogne M. The 3′ IgH regulatory region: a complex structure in a search for a function. Adv Immunol. 2000;75:317–345. doi: 10.1016/s0065-2776(00)75008-5. [DOI] [PubMed] [Google Scholar]
- Lisby M, Mortensen UH, Rothstein R. Colocalization of multiple DNA double-strand breaks at a single Rad52 repair centre. Nat Cell Biol. 2003;5:572–577. doi: 10.1038/ncb997. [DOI] [PubMed] [Google Scholar]
- Luby TM, Schrader CE, Stavnezer J, Selsing E. The mu switch region tandem repeats are important, but not required, for antibody class switch recombination. J Exp Med. 2001;193:159–168. doi: 10.1084/jem.193.2.159. [DOI] [PMC free article] [PubMed] [Google Scholar]
- Ma L, Wortis H, Kenter AL. Two new isotype specific switching factors detected for Ig class switching. J Immunol. 2002;168:2835–2846. doi: 10.4049/jimmunol.168.6.2835. [DOI] [PMC free article] [PubMed] [Google Scholar]
- Manis JP, van der Stoep N, Tian M, Ferrini R, Davidson L, Bottaro A, Alt FW. Class switching in B cells lacking 3′ immunoglobulin heavy chain enhancers. J Exp Med. 1998;188:1421–1431. doi: 10.1084/jem.188.8.1421. [DOI] [PMC free article] [PubMed] [Google Scholar]
- Manis JP, Tian M, Alt FW. Mechanism and control of class-switch recombination. Trends Immunol. 2002;23:31–39. doi: 10.1016/s1471-4906(01)02111-1. [DOI] [PubMed] [Google Scholar]
- Mochan TA, Venere M, DiTullio RA, Jr, Halazonetis TD. 53BP1, an activator of ATM in response to DNA damage. DNA Repair (Amst) 2004;3:945–952. doi: 10.1016/j.dnarep.2004.03.017. [DOI] [PubMed] [Google Scholar]
- Muramatsu M, Kinoshita K, Fagarasan S, Yamada S, Shinkai Y, Honjo T. Class switch recombination and hypermutation require activation-induced cytidine deaminase (AID), a potential RNA editing enzyme. Cell. 2000;102:553–563. doi: 10.1016/s0092-8674(00)00078-7. [DOI] [PubMed] [Google Scholar]
- Murrell A, Heeson S, Reik W. Interaction between differentially methylated regions partitions the imprinted genes Igf2 and H19 into parent-specific chromatin loops. Nat Genet. 2004;36:889–893. doi: 10.1038/ng1402. [DOI] [PubMed] [Google Scholar]
- Perlot T, Alt FW, Bassing CH, Suh H, Pinaud E. Elucidation of IgH intronic enhancer functions via germ-line deletion. Proc Natl Acad Sci USA. 2005;102:14362–14367. doi: 10.1073/pnas.0507090102. [DOI] [PMC free article] [PubMed] [Google Scholar]
- Petersen S, Casellas R, Reina-San-Martin B, Chen HT, Difilippantonio MJ, Wilson PC, Hanitsch L, Celeste A, Muramatsu M, Pilch DR, et al. AID is required to initiate Nbs1/gamma-H2AX focus formation and mutations at sites of class switching. Nature. 2001;414:660–665. doi: 10.1038/414660a. [DOI] [PMC free article] [PubMed] [Google Scholar]
- Pinaud E, Khamlichi AA, Le Morvan C, Drouet M, Nalesso V, Le Bert M, Cogne M. Localization of the 3′ IgH locus elements that effect long-distance regulation of class switch recombination. Immunity. 2001;15:187–199. doi: 10.1016/s1074-7613(01)00181-9. [DOI] [PubMed] [Google Scholar]
- Reina-San-Martin B, Difilippantonio S, Hanitsch L, Masilamani RF, Nussenzweig A, Nussenzweig MC. H2AX is required for recombination between immunoglobulin switch regions but not for intra-switch region recombination or somatic hypermutation. J Exp Med. 2003;197:1767–1778. doi: 10.1084/jem.20030569. [DOI] [PMC free article] [PubMed] [Google Scholar]
- Reina-San-Martin B, Chen J, Nussenzweig A, Nussenzweig MC. Enhanced intra-switch region recombination during immunoglobulin class switch recombination in 53BP1(−/−) B cells. Eur J Immunol. 2007;37:235–239. doi: 10.1002/eji.200636789. [DOI] [PubMed] [Google Scholar]
- Rogakou EP, Boon C, Redon C, Bonner WM. Megabase chromatin domains involved in DNA double-strand breaks in vivo. J Cell Biol. 1999;146:905–916. doi: 10.1083/jcb.146.5.905. [DOI] [PMC free article] [PubMed] [Google Scholar]
- Rush JS, Fugmann SD, Schatz DG. Staggered AID-dependent DNA double strand breaks are the predominant DNA lesions targeted to S mu in Ig class switch recombination. Int Immunol. 2004;16:549–557. doi: 10.1093/intimm/dxh057. [DOI] [PubMed] [Google Scholar]
- Sakai E, Bottaro A, Alt FW. The Ig heavy chain intronic enhancer core region is necessary and sufficient to promote efficient class switch recombination. Int Immunol. 1999;11:1709–1713. doi: 10.1093/intimm/11.10.1709. [DOI] [PubMed] [Google Scholar]
- Schrader CE, Linehan EK, Mochegova SN, Woodland RT, Stavnezer J. Inducible DNA breaks in Ig S regions are dependent on AID and UNG. J Exp Med. 2005;202:561–568. doi: 10.1084/jem.20050872. [DOI] [PMC free article] [PubMed] [Google Scholar]
- Shanmugam A, Shi MJ, Yauch L, Stavnezer J, Kenter A. Evidence for class specific factors in immunoglobulin isotype switching. J Exp Med. 2000;191:1365–1380. doi: 10.1084/jem.191.8.1365. [DOI] [PMC free article] [PubMed] [Google Scholar]
- Smale ST. The establishment and maintenance of lymphocyte identity through gene silencing. Nat Immunol. 2003;4:607–615. doi: 10.1038/ni0703-607. [DOI] [PubMed] [Google Scholar]
- Spilianakis CG, Flavell RA. Long-range intrachromosomal interactions in the T helper type 2 cytokine locus. Nat Immunol. 2004;5:1017–1027. doi: 10.1038/ni1115. [DOI] [PubMed] [Google Scholar]
- Stavnezer J. Molecular processes that regulate class switching. Curr Top Microbiol Immunol. 2000;245:127–168. doi: 10.1007/978-3-642-59641-4_6. [DOI] [PubMed] [Google Scholar]
- Ta VT, Nagaoka H, Catalan N, Durandy A, Fischer A, Imai K, Nonoyama S, Tashiro J, Ikegawa M, Ito S, et al. AID mutant analyses indicate requirement for class-switch-specific cofactors. Nat Immunol. 2003;4:843–848. doi: 10.1038/ni964. [DOI] [PubMed] [Google Scholar]
- Tolhuis B, Palstra RJ, Splinter E, Grosveld F, de Laat W. Looping and interaction between hypersensitive sites in the active beta-globin locus. Mol Cell. 2002;10:1453–1465. doi: 10.1016/s1097-2765(02)00781-5. [DOI] [PubMed] [Google Scholar]
- Wang L, Whang N, Wuerffel R, Kenter AL. AID dependent histone acetylation is detected in immunoglobulin S regions. J Exp Med. 2006;203:215–226. doi: 10.1084/jem.20051774. [DOI] [PMC free article] [PubMed] [Google Scholar]
- Wuerffel RA, Du J, Thompson RJ, Kenter AL. Ig Sgamma3 DNA-specifc double strand breaks are induced in mitogen-activated B cells and are implicated in switch recombination. J Immunol. 1997;159:4139–4144. [PubMed] [Google Scholar]
- Zarrin AA, Del Vecchio C, Tseng E, Gleason M, Zarin P, Tian M, Alt FW. Antibody class switching mediated by yeast rndonuclease-generated DNA breaks. Science. 2006;315:377–381. doi: 10.1126/science.1136386. [DOI] [PubMed] [Google Scholar]
- Zhou J, Ashouian N, Delepine M, Matsuda F, Chevillard C, Riblet R, Schildkraut CL, Birshtein BK. The origin of a developmentally regulated Igh replicon is located near the border of regulatory domains for Igh replication and expression. Proc Natl Acad Sci USA. 2002;99:13693–13698. doi: 10.1073/pnas.212392399. [DOI] [PMC free article] [PubMed] [Google Scholar]
Associated Data
This section collects any data citations, data availability statements, or supplementary materials included in this article.
Supplementary Materials
Wuerffel et al Suppl. Materils and Figures