Cross-Regulation among the Polycomb Group Genes in Drosophila melanogaster (original) (raw)
Abstract
Genes of the Polycomb group in Drosophila melanogaster function as long-term transcriptional repressors. A few members of the group encode proteins found in two evolutionarily conserved chromatin complexes, Polycomb repressive complex 1 (PRC1) and the ESC-E(Z) complex. The majority of the group, lacking clear biochemical functions, might be indirect regulators. The transcript levels of seven Polycomb group genes were assayed in embryos mutant for various other genes in the family. Three Polycomb group genes were identified as upstream positive regulators of the core components of PRC1. There is also negative feedback regulation of some PRC1 core components by other PRC1 genes. Finally, there is positive regulation of PRC1 components by the ESC-E(Z) complex. These multiple pathways of cross-regulation help to explain the large size of the Polycomb group family of genes, but they complicate the genetic analysis of any single member.
In early Drosophila melanogaster embryos, the initial patterns of homeotic gene expression are established by a transiently expressed group of activators and repressors, the gap-and-pair rule gene products. When these products decay during mid-embryogenesis, the Polycomb group (PcG) proteins repress homeotic transcription outside normal expression domains. PcG proteins maintain this repression throughout the remainder of development. In PcG mutants, by ∼8 h of development the homeotics are derepressed and are transcribed in all segments of the embryo (55, 66). While it is still unclear how PcG proteins are able to maintain repression, it seems likely that they function in modulating the chromatin structure of target genes.
The definition of the PcG is a genetic one. Loss-of-function PcG phenotypes are mostly posterior transformations; in Pc mutant embryos, all segments are transformed towards the character of the eighth abdominal segment (44). Twenty-two PcG members have been cloned to date. Some members are included in the group because their mutant phenotypes suggest their involvement in repression of the homeotics. These are Polycomb (Pc) (44), polyhomeotic proximal (ph-p), polyhomeotic distal (ph-d), Posterior sex combs (Psc), Sex combs on midleg (Scm), Sex combs extra (Sce), super sex combs (sxc) (35), multi sex combs (mxc) (59), pleiohomeotic (pho), Enhancer of zeste [E(z)], extra sex combs (esc), Additional sex combs (Asx) (53), cramped (crm) (78), and Suppressor of zeste 12 [_Su(z)_12] (1). Others are included in the group because their mutations cause homeotic phenotypes when in combination with other PcG mutations. These include dMi-2 (37), Enhancer of Polycomb [_E(Pc)_] (70), effete, Suppressor 2 of zeste [_Su(z)_2], domino (dom) (58), batman/lola like (lolal) (25), Polycomblike (Pcl) (20), and heat shock cognate 4 (hsc4) (48).
To date there are two known multiprotein PcG complexes in Drosophila embryos, both of which have been implicated in chromatin-related functions. One, Polycomb repressive complex 1 (PRC1), is a >1-MDa complex whose core contains the PcG proteins PC, PSC, and PH, as well as RING1 (63, 64). A smaller complex, reconstituted with only these four components, has been shown to inhibit SWI/SNF remodeling of nucleosomal templates in vitro (28). Curiously, PSC alone retains this activity (28). The second complex, approximately 600 kDa in size, contains the PcG proteins ESC, E(Z), and SU(Z)12 in addition to a histone binding protein, NURF-55 (10, 16, 41, 49). There is also a larger form of the ESC/E(Z) complex which includes PCL and the histone deacetylase RPD3 (75). The ESC/E(Z) complex has been shown to methylate histone H3 in vitro (10, 16, 41, 49), creating an epigenetic mark that has been associated with heterochromatic silencing. This methyltransferase activity has been mapped to the SET domain of E(Z) (16, 41, 49). While PRC1 and the ESC-E(Z) complex account for only a fraction of the group's members, other PcG chromatin complexes are presumed to exist but have not yet been isolated (29).
Aside from the PcG members of PRC1 and the ESC-E(Z) complex, three other PcG proteins are likely involved in chromatin-related functions. One of these, MI-2, has two chromodomains (37), protein motifs shared with heterochromatin-associated factor HP-1 and with PC itself (54). The chromodomain of HP-1 has been shown to recognize and bind directly to a methylated histone (52). Another PcG member with a potential chromatin function is SCM, which bears an SPM motif. The SPM domain of the PcG protein, PH, polymerizes in vitro to form a helical structure, making more plausible the possibility that PcG complexes might spread along the chromosome and create a higher-order chromatin structure (39). A third PcG member, E(PC), has a novel protein sequence (70), but its yeast homolog is a subunit of a histone acetyltransferase complex (5). The remaining group members encode a diverse set of proteins with no obvious relation to each other or to chromatin-related activities. It is not yet known how these other PcG members might function in mediating silencing of the homeotic genes.
We set out to look for regulation of PcG genes by other PcG genes. We suspected that some of the PcG genes might regulate the core members of the known biochemical complexes. We reasoned that if a mutation were able to reduce expression of one of the core PcG genes, it might have been recovered in a screen looking for phenotypes which resemble or enhance those of the PcG. The gene marked by such a mutation would have been classified as part of the group, even though its biochemical role might be quite different.
Several PcG proteins bind many PcG loci on polytene chromosomes, lending credence to the idea that some members of the group may control one another (18, 56, 79). The cytological regions corresponding to Pc, Psc, Su(z) 2, ph, Scm, Asx, E(Pc), sxc, and Mi-2 are binding sites for PCL (45). Likewise, the ph, Scm, Asx, E(Pc), and sxc loci serve as binding sites for ASX (68). Curiously, Pc, Psc, ph, Su(z) 2, Asx, E(Pc), and Mi-2 loci are all binding sites for PRC1 core proteins PC, PSC, and PH (18, 56, 79), an indication that at least some of the PcG members themselves could be subjected to _Polycomb_-mediated repression. Psc, ph, Su(z) 2, and Asx comprise a subset of these PcG loci where PRC1 core members colocalize with E(Z) and possibly ESC (11, 18, 74, 79), suggesting similarities in the mechanisms by which they control each other and the homeotics. In the ph locus, the binding sites for PC, PSC, and PH have been mapped to small DNA regions at or near the ph-p and the ph-d promoters (2).
Here we report on a survey looking at the effects of mutations in 10 PcG loci on the levels of seven PcG transcripts. We find that Psc and Su(z) 2 are negatively regulated by PRC1 members PC, PH, and PSC. We describe two new kinds of PcG regulation, positive regulation of Pc by ESC and E(Z) and positive regulation of Psc by PCL, ASX, and E(PC). These results provide direct evidence for cross-regulation among the PcG members, and they begin to reveal a network of PcG regulation.
MATERIALS AND METHODS
Mutant alleles and crosses.
rosy+5 was the primary wild-type strain used in this study (32). Df(2R)enX31 removes E(Pc) and en (61, 62). Note that E(Pc) at cytological position 48A is distinct from the E(Pc) 88D (now called effete) and E(Pc) a (mapping near Delta) loci. No molecular information is available for E(Pc) 1 (61). Pc3 and PcXT109 are protein-null mutations for Pc (30). ScmD1 is a frameshift mutation that behaves genetically as a null allele (4, 6). Pcl1 and PclD5 are apparent nulls (6, 20). Genetic and molecular studies are consistent with Psce24, Psce25, and Psch27 being loss-of-function alleles of the Psc gene (R. B. Emmons, I. F. King, N. J. Francis, R. E. Kingston, and C.-T. Wu, personal communication). Su(z) 21.b8 and Su(z) 31.jtg are deletions of both Psc and Su(z) 2 (77). Su(z) 21.b7 is a 2-kb deletion at the 5′ end of the Su(z) 2 promoter (7, 8); it is a loss-of-function allele for Su(z) 2 (7, 8, 77). Df(2R)trix is a deletion of Asx (6). AsxXT129 is a 1.3-kb deletion which retains the first 800 amino acids of the native protein (47); it does not behave like a null (67). AsxIIF51 and Asx γ13 are gain-of-function alleles (13, 47, 67). ph-p410 is an inversion with a breakpoint in the proximal repeat, and it is an RNA null for ph-p (34). ph-d401 is a small deletion within the ph-d locus (24); it also is an RNA null (34). ph602 is a complex rearrangement in ph-p (3) induced on ph-d401. ph503 is a null allele for both ph products (24). ph-dVA174 is a mutation in polyhomeotic distal (24). The molecular nature of the allele is unknown. esc2 is an apparent null associated with a frameshift mutation in the protein-coding region (60); esc10 is a deficiency for the esc locus (31). Embryos lacking both maternal and zygotic esc were generated by first crossing Dp GYL/esc 2 CyO females to esc10 /CyO males and then mating progeny esc 10 /esc2 males and females. E(z)63 [originally named _E(z)s4_] appears to be null for E(z) function (36) and has a point mutation in the translation initiation codon (11). E(z)61 [originally named _E(z)s2_] is a temperature-sensitive allele associated with a missense mutation (11), viable at 18°C but lethal at 29°C. Its transformation phenotypes at 29°C are not as severe as those of E(z) null alleles (36). For the experiments with E(z)61, homozygous males and females raised at 18°C were shifted to 29°C. Eggs were then collected for 1-h intervals over the next 3 h, and each collection was aged for 9 h more at 29°C.
The green fluorescent protein (GFP) balancer chromosomes (12) used were as follows: for the X chromosome, FM7c, P{w+mc = GAL4-Kr.C}DC1, P{w+mc = UAS-GFP.S65T}DC5; for chromosome II, CyO, P{w+mc = GAL4-Kr.C}DC3, P{w+mc = UAS-GFP.S65T}DC7; and for chromosome III, TM3, P{w+mc = GAL4-Kr.C}DC2, P{w+mc = UAS-GFP.S65T}DC10, Sb1.
RNA isolation.
Embryo collections were from laying cages that used standard apple juice agar medium (76). One-hour layings were aged at 25°C for 9 h. Eggs were then dechorionated in 50% bleach for 90 s. Embryos were sorted by GFP fluorescence after dechorionation, and in each experiment 30 homozygous mutant embryos were collected for each allele. Embryos were stored at −80°C until a sufficient number of collections was obtained. Embryos were thawed in a solution of 4 M guanidine thiocyanate, 25 mM sodium citrate, 0.5% Sarkosyl, and 1.5% β-mercaptoethanol. Total RNA was then isolated by guanidine-acid phenol extraction as previously described (14). Twenty micrograms of glycogen (Roche) was added as a carrier to each sample prior to precipitation. RNA was resuspended in 5 μl of distilled H2O (treated with diethyl pyrocarbonate) and was quantitated by using RiboGreen (Molecular Probes) on a spectrofluorimeter (RF-1501; Shimadzu). Thirty embryos yielded between 500 ng and 1 μg of total RNA. To rid the preparation of contaminating genomic DNA, all samples were treated with RQ1 RNase-Free DNase at RNA concentrations of 100 ng/μl (Promega) for 1 h according to the supplier's instructions. DNase reactions were terminated by the addition of 1/10 volume of 20 mM EGTA (pH 8.0) and then by heating samples at 65°C for 10 min.
Reverse transcription.
cDNA synthesis was carried out by using an M-MLV reverse transcriptase (Promega) according to the supplier's instructions. cDNA syntheses for RpL23a, Pc, esc, Psc, Su(z) 2, ph-p, ph-d, and RING1 RNAs were carried out simultaneously within the same reaction tube. One-hundred seventy nanograms of oligo(dT)15 (Promega) plus 2 pmol of a reverse primer for ph-p (5′-GTCCACTGCTCGGTTAGGAG-3′) were annealed to 475 ng of DNase-treated RNA at 70°C for 5 min in a total volume of 6 μl. Reaction mixtures were put on ice, and then a mixture containing 66 U of reverse transcriptase, 8 U of RNasin RNase inhibitor (Promega), 4.25 nmol of deoxynucleoside triphosphates, and 5× buffer (Promega) were added to a final reaction volume of 8.5 μl. Reaction mixtures were incubated at 37°C for 1 h. Reaction mixtures were then placed at 85°C for 5 min to inactivate the reverse transcriptase. One microliter of this reverse transcription mix was used in each subsequent 25-μl PCR. One PCR for each gene to be assayed was done from each cDNA synthesis reaction.
Primer design and sequences.
All PCR primers were designed by using Primer3 software (http://www-genome.wi.mit.edu/cgi-bin/primer/primer3_www.cgi/). All primers were chosen to yield melting temperatures of 60°C. Pairs of primers were selected to produce approximately 200-bp amplicons in each reaction. Because most of the cDNA synthesis reactions were oligo(dT) primed, PCR primers were positioned near the 3′ ends of each cDNA. Primer sequences for RpL23a were 5′-CCTGGACATTGCCAACAAG-3′ and 5′-CGCTCTACCGTGTCAGCTTAG-3′. Primer sequences for Pc were 5′-AATCGGGCAAGATTGGAG-3′ and 5′-GGCGTTGTGTTTATGGCTTC-3′. Primer sequences for esc were 5′-CAGGGCAAGGTGTATGTGTG-3′ and 5′-AGTTGTTTGTCTGCGGTTCC-3′. Primer sequences for Psc were 5′-GCAACAACGGAGCAACAG-3′ and 5′-AGGAATTGGTTCTGGTCGTG-3′. Primer sequences for Su(z)2 were 5′-TGGTACATGGTGGCAGATCC-3′ and 5′-ATCAGGAGTCGGAGCCAAAG-3′. Primer sequences for ph-p were 5′-GCTCAAGGAGAAGCATTTGG-3′ and 5′-GTCCACTGCTCGGTTAGGAG-3′. Primer sequences for ph-d were 5′-CGCACATGACGAAAGCAAG-3′ and 5′-GATACTGCCCGCTCCTATCC-3′. Primer sequences for RING1 were 5′-GTGTGCGCTACATCAAGACC-3′ and 5′-GAATTTGTCGTTGACCTGGTG-3′.
PCR.
Amplification reactions were carried out in a Smart Cycler using 25-μl tubes (Cepheid). Reaction mixtures were set up on ice and contained 20 mM Tris-HCl (pH 8.4), 50 mM KCl, 1.5 U of Platinum Taq DNA Polymerase (Invitrogen), 2.0 mM MgCl2, 0.2 mM deoxynucleoside triphosphates, 0.2 mg of bovine serum albumin/ml, 150 mM trehalose, 0.2% Tween 20, and 1:40,000 SYBR Green (Molecular Probes) in a 25-μl reaction volume. Large batches of the reaction mixture were made to avoid variations in the reagent concentrations. To control for pipetting errors, an 8.5-fold-volume reaction cocktail was added to the entire volume of one 8.5-μl cDNA synthesis reaction and was mixed. The mixture was aliquoted into individual reaction tubes containing 3 pmol of each primer. Reactions were initially held at 95°C for 60 s. Samples were then subjected to 35 cycles of the following parameters: 95°C for 15 s, 55°C for 15 s, and 72°C for 15 s. Fluorescence readings were taken once per cycle after the 72°C extension reaction. Following amplification, product melting curves were done with the Cepheid Smart Cycler software. In early experiments, the reaction products were reannealed by running each reaction through an additional amplification cycle. Agarose gels were then run to ensure that PCRs yielded single products that corresponded to their predicted sizes. Once individual products were correlated with their characteristic melting temperatures, subsequent experiments were done with only product melts. Cycle threshold (Ct) values were calculated with Cepheid software's second derivative analysis. Data for each PCR were normalized to the control RpL23a reaction run in parallel on the same cDNA preparation; the Ct value for RpL23a was subtracted from each individual Ct value. Each experiment was done at least in duplicate and at least in triplicate for cases where differences are reported, from which the mean and sample standard deviation were calculated. Different data sets are derived from separate batches of embryos collected on different days, because we found most of the variation in quantitation arose from the condition of the embryos.
RNA in situ analysis.
RNA in situ analysis was performed as previously described (43). Digoxigenin-labeled RNA probes were prepared according to the DIG RNA labeling kit protocol (Roche). All probe hybridizations were done overnight at 58°C. Antidigoxigenin antibody was obtained from Roche. Templates for in vitro transcription were PCR amplified from genomic fly DNA and were cloned into the plasmid BS-KS+ (Stratagene). Plasmids were purified on CsCl gradients prior to in vitro transcription. A 3,539-nucleotide (nt) fragment representing Psc cDNA sequence coordinates 2167 to 5707 (Flybase accession no. CT12953), containing sequences within the last exon, was used as a probe for transcription from Psc. A 2,667-nt fragment representing Pc genomic sequence coordinates 123 to 2788 (Flybase accession no. CG7618), encompassing all intron and exon sequences of the gene except for the first 122 nt of exon 1 and last 182 nt of exon 3, was used as a probe for Pc transcription. A 1,620-nt fragment representing ph-d genomic sequence coordinates 18081 to 19700 (GenBank accession no. M64750), containing part of the first exon, the entire first intron, and part of the second exon, was used as a probe for ph-d transcription. A 2,009-nt fragment representing ph-p genomic sequence coordinates 6228 to 8236 (GenBank accession no. M64750), containing most of the first exon and part of first intron for ph-p, was used as a probe for ph-p transcription. A 2,512-nt fragment representing Su(z) 2 genomic sequence coordinates 8117 to 10630 (GenBank accession no. X56798), containing part of the last intron and most of the last exon, was used as a probe for Su(z) 2 transcription. A 1,290-nt fragment representing RING1 genomic sequence coordinates 4491 to 5780 (GenBank accession no. NG_000825), containing most of the first exon and a few nucleotides of the first intron, was used as a probe for RING1 transcription.
RESULTS
Experimental design.
To look for upstream regulators of the PcG, we examined PcG transcript levels in several PcG mutant backgrounds. We developed a real-time PCR assay for quantitating relative transcript levels in homozygous PcG mutant embryos. Most stocks were maintained as heterozygotes by using GFP balancer chromosomes (12). Embryos were collected from laying cages of heterozygous adults, and homozygous mutant embryos were selected by their lack of GFP expression. For those genotypes which did not adversely affect viability (esc 2 /esc10, ph-p410 homozygotes, and ph-d401 homozygotes), embryos were collected from laying cages of homozygous adults. In each experiment, embryos were collected for an hour and then aged for 9 h at 25°C. We chose to isolate RNA at 9 to 10 h because we found that PcG transcript levels were highest around this time (data not shown). In addition, green fluorescence from the balancer chromosomes was bright enough at 9 to 10 h for unambiguous identification of the PcG homozygotes. Total RNA was isolated from dechorionated embryos, DNase treated to destroy contaminating genomic sequences, and then reverse transcribed (see Materials and Methods).
We measured RNA levels of seven different PcG genes, Pc, esc, Psc, Su(z) 2, ph-p, ph-d, and RING1. Quantitation of cDNA samples was achieved with real-time PCRs in the presence of SYBR Green dye. Quantitation of a ribosomal gene, RpL23a, was carried out in parallel for each PCR run to normalize for the amount of total cDNA within each reaction. Average Ct values from wild-type embryos for all eight transcripts measured are shown in Table 1. For a negative control, cDNA synthesis reactions were done without reverse transcriptase and samples were added to PCRs. Even though the RNA samples had been treated with DNase, most PCR primer sets did prime residual genomic sequences and did give low-level product yields. Presumably, the DNase treatments never went to absolute completion. These negative control reactions set the lower limits of detection in our assay (Table 1). Background limits of detection varied for each PCR primer pair, so our ability to measure reductions in mRNA levels varied from gene to gene.
TABLE 1.
Real-time PCR parametersa
| PCR amplicon | Efficiency of PCRb | _R_2 | Average wild-type Ctc | Sample standard deviation for wild-type Ct (σ_n_ − 1) | Background Ctd |
|---|---|---|---|---|---|
| RpL23a | 1.41 | 0.996 | 17.25 | 0.73 | >32.5 |
| Pc | 1.38 | 0.964 | 25.42 | 0.37 | 30.87 |
| esc | 1.32 | 0.900 | 28.07 | 0.35 | >32.5 |
| Psc | 1.41 | 0.997 | 28.12 | 0.81 | >32.5 |
| Su(z)2 | 2.00 | 1.00 | 29.71 | 0.68 | 32.5 |
| ph-p | 1.36 | 1.00 | 22.39 | 0.64 | >32.5 |
| ph-d | 1.70 | 0.999 | 25.36 | 0.66 | 31.78 |
| RING1 | 1.61 | 0.821 | 27.15 | 0.68 | 29.3 |
To test for sensitivity in our PCR assay, amounts of cDNA were titrated twofold in either direction from wild-type levels. For every PCR primer set, twofold changes were within the detection limits and quantitation was linear over this range (Table 1). We also used plasmid DNA as templates for PCR. In these assays, we found that reactions were linear over a 5 × 10⁻¹⁷ to 5 × 10⁻¹¹ M range. These concentrations corresponded to Ct values 37.83 and 9.83, respectively, and encompass a range over which all data were collected in these experiments. Efficiencies of reactions varied (Table 1) but were reproducible for each primer set and did not depend on whether plasmid DNA or cDNA was used as a template for PCR. These efficiencies were used to convert the changes in Ct values to changes in RNA abundance. Standard deviations were quite small in the wild type and in some of the mutants. The larger standard deviations seen in other mutants may reflect greater variation in the condition of embryos.
We used rosy+5 as our standard wild type for comparison with all of the mutant genotypes. We also compared the Oregon R wild type to rosy+5; the average Ct values were all within one standard deviation of each other and typically matched within 0.5 amplification cycles (data not shown). We note also that the RNA levels in two viable genotypes (ph-p410 and ph-d401) matched those of rosy+5, except for the genes that were mutated (see below).
We illustrate in Fig. 1 to 3 the changes in RNA abundance relative to the wild type. In the text below we highlight the changes we believe are noteworthy and statistically significant, giving the fractional percentage or fold amplification relative to wild type.
FIG. 1.

Psc is positively regulated by E(Pc), Pcl, and Asx. The graphs show the differences in mRNA levels between mutant and wild-type embryos, plotted on a log2 scale. The RNA abundance levels for each preparation of embryonic RNA were normalized by comparison to mRNA levels of a ribosomal protein gene. Psc RNA levels are decreased in embryos mutant for E(Pc) (A), Pcl (B), and Asx (C). Pc and ph-d RNA levels also tended to fall below wild-type levels.
FIG. 3.

Pc is positively regulated by esc and E(z). Pc RNA levels are decreased in embryos mutant for esc (A) and E(z) (B). Psc and ph-d RNA levels are also reduced in esc mutant embryos. Data are presented as in Fig. 1.
Psc is positively regulated by E(Pc), Pcl, and Asx.
We initially set out to determine whether PcG genes that are not reported to have any chromatin-related functions regulate some of the PcG genes found in the two defined chromatin complexes. We quantitated relative transcript levels of our seven target PcG genes for multiple E(Pc), Pcl, and Asx alleles, and, indeed, we found that these three genes appear to regulate the Psc locus. E(Pc) mutations E(Pc) 1 and Df(2R)enX31 showed consistent decreases in Psc transcript levels (Fig. 1A). Both mutations showed similar effects; Psc RNA levels dropped to 47 or 44% of wild-type levels for E(Pc) 1 or Df(2R)enX31, respectively. PclD5 (Fig. 1B) showed a comparable decrease in Psc transcript levels, to 49%. A second Pcl allele, Pcl1, gave a less significant reduction in Psc RNA (to 68%) (Fig. 1B). Pcl1 appears to be a weaker allele than PclD5; the cuticles of Pcl1 homozygous embryos resemble that of the wild type, while cuticles of PclD5 embryos show weak posteriorly directed transformations (6, 20). Three out of four Asx alleles tested also showed decreased transcript levels for Psc (Fig. 1C). The greatest drop in Psc RNA was observed for Df Trix (to 22%), followed by AsxIIF51 (to 25%) and then _Asx γ_13 (to 36%). The decreases observed for Df Trix and AsxIIF51 are minimum estimates, because the measured Ct values border the lower limit of detection for Psc transcripts in our assay (Table 1). No significant change in Psc levels was observed for AsxXT129 (Fig. 1C). Our stock of AsxXT129 did prove to be lethal over other Asx alleles, but AsxXT129 is not a null allele (see Materials and Methods).
Pc and ph-d RNA levels also dropped in embryos mutant for E(Pc), Pcl, or Asx, although the changes were not significant in all cases. The largest changes were seen for E(Pc) 1 (Pc at 65%, ph-d at 46%) (Fig. 1A), PclD5 (Pc at 71%, ph-d at 63%) (Fig. 1B), and Df Trix (Pc at 51%, ph-d at 35%) (Fig. 1C). There were no significant differences in esc, Su(z) 2, ph-p, and RING1 transcript levels for embryos mutant for E(Pc), Pcl, or Asx (Fig. 1).
Psc and Su(z) 2 are negatively regulated by Psc, Pc, and ph.
We next sought to characterize the role of PRC1 core proteins in regulating PcG loci, to which they appear to bind on polytene chromosomes. We found that Psc and Su(z) RNA levels increased with a mutation in any one of Pc, ph, or Psc (Fig. 2). Su(z)2 transcript levels were dramatically elevated in embryos homozygous for Psce24, Psce25, or Psch27 (15-, 12-, and 7.6-fold over wild type, respectively) (Fig. 2A). Psc also appeared to regulate itself, in that all Psc alleles assayed showed higher levels of Psc transcripts than wild type (Fig. 2A) (1.7-, 2.5-, and 2.7-fold increases for Psce24, Psce25, and Psch27, respectively). Obviously, none of these alleles can be RNA nulls. The Psc and Su(z)2 genes have head-to-head adjacent transcription units, which could potentially be coordinately regulated, but we note that Su(z)2 transcripts were consistently elevated much more than the Psc transcripts. Two of three mutations in Psc tested were correlated with slight increases in RING1 transcription (2.2- and 1.6-fold increases for Psce25 and Psch27, respectively) (Fig. 2A). Quantities of Pc, esc, ph-p, and ph-d RNAs resembled those of the wild type in Psc mutant embryos (Fig. 2A). Su(z) 21.b8 and Su(z) 31.jtg, which are deletions of both the Psc and Su(z) 2 genes, did not alter levels of Pc, esc, ph-p, ph-d, and RING1 RNAs significantly (data not shown).
FIG. 2.

Psc and Su(z) 2 are negatively regulated by PRC1 core members Psc, Pc, and ph. Psc and Su(z) 2 RNA levels are increased in embryos mutant for Psc (A), Pc (B), and ph (C). Su(z) 2 RNA levels were similarly increased in an Scm mutant (D). Data are presented as in Fig. 1.
Genetic analyses have suggested that Su(z) 2 plays only a minor role, if any, in repression of the homeotics. While not a member of the PRC1 complex, Su(z) 2 has been hypothesized to work in conjunction with Psc (77). We therefore tested embryos mutant for Su(z) 21.b7, an allele thought to be wild type for Psc but mutant for Su(z) 2, associated with a small deletion near the Su(z) 2 promoter. Only Psc RNA was altered significantly from wild type (decreased to 51%) (Fig. 2A). Surprisingly, the Su(z) 21.b7 promoter deletion had no apparent effect on the transcript levels of Su(z) 2 itself (see Discussion).
Pc alleles gave results similar to those of Psc alleles. Pc3 and PcXT109 homozygous embryos showed increases in Su(z) 2 RNA (9.8- and 7.4-fold increases, respectively), which were quantitatively similar to those listed above for Psc mutations (Fig. 2B). Pc3 embryos also showed elevated levels of Psc transcripts relative to wild type (2.2-fold increase) (Fig. 2B). Psc RNA was not significantly altered in PcXT109 embryos. PcXT109 appears to be an RNA null, because the Pc transcript is reduced to near the background level in our assay (14% of wild type) (Table 1, Fig. 2B). In contrast, the Pc3 mutation does not significantly affect Pc RNA levels. For both alleles, levels of esc, ph-p, ph-d, and RING1 were not significantly changed compared to those of the wild type (Fig. 2B).
Similar increases in Psc and Su(z) 2 were obtained with certain ph alleles. ph is a tandemly duplicated gene with two functional units that lie adjacent to each other on the X chromosome (17). Because the units are genetically separate but largely redundant in function (24, 34), we analyzed the effect of mutations in both the proximal (ph-p) and/or distal (ph-d) ph transcription units. Homozygous ph-p410 and ph-d401 embryos were derived from homozygous mothers, while homozygous embryos for all other ph alleles tested were from heterozygous mothers. ph-d 401 ph-p602 embryos, mutant for both the proximal and distal units, showed an 18-fold increase in Su(z) 2 RNA and a smaller 2-fold increase in Psc RNA (Fig. 2C). ph503, also doubly mutant for both units, exhibited a significant increase in Su(z) 2 RNA (6.5-fold) but not Psc RNA (Fig. 2C). We observed slight increases in Su(z) 2 transcript levels for two alleles singly mutant for the distal unit, ph-dVA174 (3.1-fold) and ph-d401 (2.1-fold) (Fig. 2C). Of these, only ph-dVA174 showed an elevated level of Psc transcripts (2.1-fold). ph-p410 embryos, mutant only for the proximal unit, showed wild-type RNA levels for both Psc and Su(z) 2 (Fig. 2C). Mean values for RING1 were slightly increased with ph-dVA174 and ph-d 401 ph-p602 mutations (2.9- and 2.0-fold, respectively) (Fig. 2C).
These measurements shown in Fig. 2C also revealed aspects of the regulation of the ph locus. ph-d401 appears to be an RNA null, because embryos lacking both maternal and zygotic contributions have only 2% of the wild-type transcript level, which is at our limit of detection (Table 1). The ph-p410 allele must also affect RNA production or stability, because ph-p RNA levels were reduced to 24% in embryos lacking maternal and zygotic contributions. Embryos lacking only the zygotic contribution of ph-d (in the ph-d 401 ph-p602 genotype) show only a slight decrease in ph-d RNA (to 76%). This confirms that there is a large maternal contribution of ph products, which was inferred from the phenotypic analysis (23). Surprisingly, embryos lacking only the zygotic contributions with the ph-dVA174 or ph503 genotypes showed slight increases in both ph-p and ph-d RNA levels (Fig. 2C). Loss of maternal and zygotic ph-p did not have an effect on levels of ph-d transcripts, nor did loss of maternal and zygotic ph-d affect the level of ph-p transcripts (Fig. 2C).
Su(z) 2 is negatively regulated by Scm.
Scm, while not a core member of PRC1, has been reported to be present in the complex in substoichiometric amounts (63, 64). We quantitated relative transcript levels of our assay group for a single Scm allele. A mutation in Scm caused a 3.9-fold increase in Su(z) 2 RNA (Fig. 2D). While significant, the increase in Su(z) 2 RNA was smaller than that observed for Pc, Psc, or ph mutation. The Scm mutation had little or no effect on the RNA levels of Pc, esc, Psc, ph-p, ph-d, or RING1 (Fig. 2D).
Distinct function for esc and E(z).
Loss-of-function esc mutations cause severe posterior transformations (71, 72), stronger than those seen in embryos mutant for most other PcG genes. The esc protein is in a biochemical complex with E(z) and other proteins; E(z) is a histone methyl transferase that may provide a mark to recruit Pc and the other members of the PRC1 complex. Surprisingly, esc and E(z) mutant embryos showed changes in RNA levels that were quite different from those caused by Pc, ph, and Psc mutations. In esc 2 /esc10 transheterozygotes (lacking maternal and zygotic contributions), Pc RNA levels were strongly decreased to 25% of wild-type levels (Fig. 3A). Psc and ph-d transcript levels were somewhat reduced (to 55 and 35%, respectively) (Fig. 3A). Quantities of Su(z) 2, ph-p, and RING1 transcripts remained unchanged compared to those of the wild type (Fig. 3A). The drop in esc RNA levels in esc 2 /esc10 embryos (to 41% of wild type) is presumably due to the lack of transcripts from the esc10 chromosome, which is known to be a deletion for the esc locus (31).
E(z) mutations likewise reduce Pc RNA levels. We tested a null E(z) allele, E(z)63, in embryos lacking zygotic product but retaining the maternal contribution. We also assayed embryos homozygous for a temperature-sensitive allele, E(z)61, in which both maternal and zygotic products should be partially inactivated at the restrictive temperature. Pc RNA levels were reduced to 51 and 45% in E(z)63 and E(z)61, respectively (Fig. 3B). In neither case was the effect on Pc RNA as dramatic as in the embryos lacking esc, but neither of the E(z) genotypes was completely null for E(z) function. E(z)61 also gave a modest drop in Psc levels (to 55%), which parallels the effect of esc mutations, and a similar drop in Su(z) 2 (to 35%), which was not seen in esc mutants (Fig. 3B).
Regulation of Psc and Su(z) 2 is not tissue specific.
We performed RNA in situ analysis on whole embryos to confirm some of the changes in RNA levels we observed in our reverse transcription-PCR assay. This technique allowed us the additional possibility of identifying tissue-specific differences in regulation, which could not be revealed by our reverse transcription-PCR assay. In wild-type embryos, we determined that Pc, Psc, Su(z) 2, ph-p, ph-d, and RING1 transcripts were all found evenly distributed throughout the embryo until approximately 9 h (data not shown). After 9 h, transcript levels progressively increased in the central nervous system and decreased in other tissues (data not shown). After roughly 12 h, transcripts were found primarily in the central nervous system and only minimally in the epidermis and gut (Fig. 4A and data not shown). To confirm increases in Su(z) 2 transcript levels, we presorted embryos for GFP prior to staining to ensure unambiguous identification of the homozygous mutant embryos. Increases in Su(z) 2 RNA for Pc, ph, and Psc homozygous mutant embryos were obvious (Fig. 4B to D). The temporal and spatial distribution of transcripts mimicked the wild-type pattern in each case, while only the levels were increased. In each case the increases in RNA levels observed were at all embryonic stages. Similar results were obtained for Psc transcripts in PcXT109 and ph503 homozygous mutant embryos (data not shown).
FIG. 4.

Increases in Su(z) 2 RNA were not tissue specific. RNA in situ hybridizations show Su(z) 2 transcripts in germ band-retracted embryos. All embryos were stained for the same amount of time. The embryos were cut along the dorsal midline and were flattened to display all of the epidermis in one focal plane. (A) Wild-type embryo (w.t.); (B) PcXT109 homozygote (Pc); (C) ph503 homozygote (ph); (D) Psce24 homozygote (Psc).
While increases in RNA levels were easily detected by in situ hybridization, decreases observed in our reverse transcription-PCR assay were difficult to confirm. We stained both wild-type and esc 2 /esc10 embryos for Pc RNA. esc 2 /esc10 embryos showed slightly weaker staining compared to that of the wild type, but this difference did not reflect the fourfold decrease observed in our reverse transcription-PCR assay. We believe that Pc RNA staining over background was too low to discern the difference.
We also looked for tissue-specific differences for other genotypes which did not show significant changes in transcript levels in our reverse transcription-PCR assay. In these cases, we did not presort embryos by GFP. Instead, we expected that one quarter of the embryos in each collection would be homozygous for a particular PcG mutation. We hoped that differences in staining patterns and/or intensities might be clear in a subset of the embryos. We analyzed the distribution of Pc, Psc, Su(z) 2, ph-p, ph-d, and RING1 transcripts in embryos homozygous for PclD5, _Su(z)_21.b8, AsxIIF51, PcXT109, or ph503. Each transcript in each mutant resembled the wild type in both its spatial and temporal distribution for all of the embryos within a collection. Thus, no pattern differences were discernible when such mutations were homozygous (data not shown). Staining was inherently variable in each case, so that the expected slight differences in total RNA levels could not be reliably confirmed.
DISCUSSION
These studies show that there are several forms of cross-regulation among members of the PcG. The changes we report probably understate the level of cross-regulation in many cases. For most of our experiments, the embryos had no zygotic expression from a wild-type gene copy, but any contributions from the heterozygous mother to the egg would have been retained. (The esc mutant embryos lacked both maternal and zygotic contributions, as did the embryos mutant for either ph-p410 or ph-d401). The maternal contributions for E(Pc), Asx, Pcl, and Pc appear to be minor, in that embryos lacking both maternal and zygotic contributions are not much more transformed than embryos lacking only the zygotic expression (6, 33, 42, 69). The maternal contributions of Psc and ph (in the ph-p, ph-d double mutant case) are much more important for embryonic development (6, 23).
It is not possible from these studies to know if the cross-regulation is direct. The embryos used for most of these experiments were 9 to 10 h old. Many changes in cell fate or physiology could have happened before we collected RNA samples. In the case of PcXT109 mutants, embryos were also collected at 5 to 6 h and 15 to 16 h; the changes in target RNAs were similar to those seen at 9 to 10 h (data not shown). Regardless of the number of biochemical events involved, the cross-regulation affects our interpretations of mutant phenotypes and gene functions.
These studies suggest that the PcG can be subdivided into at least three functional categories, as diagramed in Fig. 5. There are the core genes, including Pc, Psc, and ph, whose products are found in the PRC1 biochemical complex. These products are likely to impose repression directly on the homeotics, in part because their protein products are localized to the chromosomal sites of the homeotics. We report here that they also show feedback repression on at least the Psc gene. The second category of PcG genes appears to be upstream positive regulators of the core genes; this group includes E(Pc), Asx, and Pcl. The esc and E(z) genes fall in a third category: they can also be considered upstream positive regulators, but they most strongly regulate the Pc locus. The three categories will be discussed below in more detail.
FIG. 5.
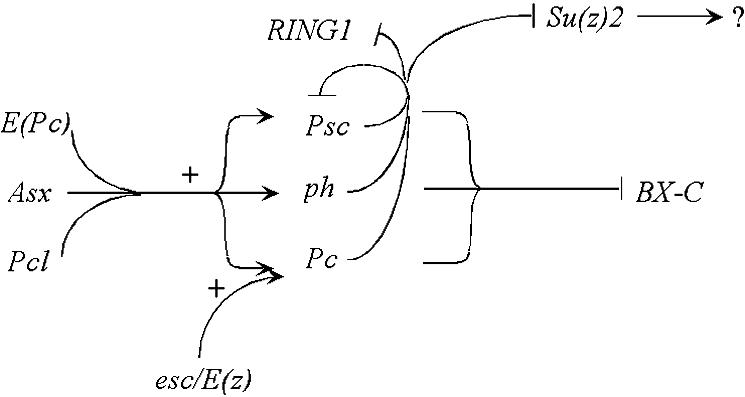
Model for PcG interactions. PRC1 core members repress the homeotic genes, including the bithorax complex (BX-C). E(Pc), Pcl, and Asx act as upstream positive regulators of PRC1 core members. A second level of regulation is the negative feedback by PRC1 core members on Psc and RING1. There is also repression of Su(z) 2, whose downstream targets are unclear. A third level of regulation is that the ESC-E(Z) complex acts as a positive regulator of Pc transcription.
Feedback regulation by PRC1 core members.
Figure 2 shows that ph, Pc, and Psc negatively regulate transcript levels of Psc, Su(z) 2, and perhaps RING1. The effects were quantitatively similar, suggesting that ph, Pc, and Psc regulate transcription via the same mechanism. The repression is likely mediated by PRC1 or by a related biochemical complex. The negative regulation of Su(z) 2 and RING1 by Scm in our study could also be due to its association with PRC1. We observed a smaller increase in Su(z) 2 RNA levels in ScmD1 mutants than with ph, Pc, and Psc mutants, but we saw no effect on Psc RNA levels. It is possible that the reduced effect is because SCM associates with PRC1 in only substoichiometric amounts. SCM may be needed only for specific gene targets or may be used only in specific cell types. Regulation by PRC1 would likely be direct, given that PRC1 core components PH, PC, and PSC colocalize at the locus of Psc and Su(z) 2 on polytene chromosomes (18, 46, 56, 79). Regulation of PcG genes by PRC1 must reduce but not completely silence PcG loci. PcG repression of the homeotic genes, in contrast, appears to be all or none, in anterior and posterior segments, respectively.
Why would a PcG multiprotein complex regulate itself? This feedback could buffer the level of functional PRC1. It is striking that so many mutations in PcG genes give haploinsufficiency phenotypes. Although extra doses of Pc don't noticeably affect the appearance of wild-type flies (21), a duplication of the Pc locus can suppress a gain-of-function homeotic phenotype (38). Thus, the fly is quite sensitive to the dosage of PcG genes, even with the feedback pathways in place. Perhaps the level of functional PRC1 might determine the extent of the chromosome that becomes repressed. By analogy, the extent of telomeric silencing in S. cerevisiae depends of the level of the SIR proteins (57). Curiously, Pc and ph transcripts are not affected by this feedback, although the PRC1 complex is also bound at or near their chromosomal sites (56). PSC may be the central player in PRC1. PSC by itself can inhibit nucleosomal remodeling of templates in vitro, and it can repress transcription in vitro (28, 40).
Cross-regulation within PcG gene clusters.
The ph locus includes two related transcription units, ph-d and ph-p, in a head-to-tail orientation 4.5 kb apart (GenBank accession no. AE003423). There have been several reports that the ph-p promoter region contains a PRE and is negatively regulated by genes of the PcG (2, 26, 27). Fauvarque et al. (27) reported that ph-p RNA levels increased in early embryos mutant for either ph-p or ph-d. Our studies did not confirm this case of feedback. In some ph mutants we observed slight increases in transcript levels of both ph-p and ph-d, but other alleles showed no change. None of the mutations showed compensation for lack of one product with overproduction of the other. It is possible that there are weak effects that we cannot reliably score or that the effects change with the time of development. Fauvarque et al. (27) report effects on ph at an earlier time point than that employed in this study.
Psc and Su(z)2 lie adjacent to each other on the chromosome, oriented head to head with their coding regions 21 kb apart (GenBank accession no. AE003820). The transcriptional regulation of the two genes might be coordinate, because they share the intergenic region between their promoters. We observed strong increases in both Psc and Su(z)2 RNAs in all embryos mutant for Psc (excepting the _Su(z)_21.b8 and Su(z) 21.jtg alleles, which are deleted for both transcription units). These increases were quantitatively similar to those seen in embryos mutant for Pc or for both ph genes (Fig. 2). Su(z) 2 is even more sensitive than Psc to this feedback, although its role in PcG regulation is unclear. The Psc and Su(z) 2 protein products are related, but the homology across the total protein is only ∼6% (8). There is phenotypic evidence for interaction between Psc and Su(z) 2, perhaps between their protein products (77). However, interpretations based on phenotypic analyses are difficult, because the molecular lesions of most Psc and Su(z) 2 alleles are not known. The overproduction of Su(z) 2 RNA in Psc mutants may explain peculiar Psc phenotypes (69), especially if Su(z) 2 protein is antimorphic for the normal Psc protein function. Su(z) 21.b7 is the only allele we tested that might be specific for Su(z) 2, although it is a ∼2-kb deletion in the intergenic region, starting at or near the Su(z) 2 promoter (7). Surprisingly, it shows no change in Su(z) 2 RNA levels but a decrease in Psc RNA. It will be important to test other alleles of Su(z) 2 when they are defined molecularly. The analysis is further complicated by the significant maternal contribution of at least the Psc gene product (46). Germ line clones of defined alleles will be required for a definitive analysis.
Upstream regulators.
Figure 1 shows that E(Pc), Pcl, and Asx positively regulate Psc, Pc, and perhaps ph-d. E(Pc) and Pcl were originally isolated in genetic screens as enhancers of the dominant phenotypes of Pc/+ heterozygotes (20, 61). Asx was identified for its effect on head formation in homozygous embryos (53) and was also picked up in a screen for Polycomb enhancement (22). The reductions of Psc RNA levels seen in E(Pc), Pcl, and Asx embryos could easily explain their enhancement phenotypes. Psc/+ heterozygotes, expressing 50% of wild-type PSC product (or more, assuming Psc negative feedback on itself), show strong enhancement of the sex comb phenotype of Pc/+ (9). Some of the other PcG members that we have not yet tested may also be upstream regulators. Likely candidates include mutants which enhance PcG phenotypes but which themselves show little or no segmental transformations when homozygous (like cramped [78], hsc4 [48], and batman [25]).
It is not surprising to recover a cascade of regulatory genes from a genetic screen for a single phenotype. For example, in Saccharomyces cerevisiae, mutations in the SPT10 and SPT21 genes were originally isolated as suppressors of Ty and LTR (δ) insertion mutations (51). SPT10 and SPT21 were later found to control transcription of Ty elements indirectly by controlling transcription at histone loci HTA2-HTB2 and HHF2-HHT2 (19). Likewise, screens for genes involved in mating-type switching identified the HO gene, which codes for an endonuclease that initiates switching at the MAT locus, but they also yielded SWI4 and SWI6, activators of HO (50). Screens for sexual transformation in adult worms and flies have also yielded multistep regulatory cascades (15).
The role of esc and E(z).
esc and E(z) are also upstream positive regulators of core PcG loci. We consider them separately from E(Pc), Pcl, and Asx for several reasons. ESC and E(Z) are in a biochemical complex thought to act directly at loci repressed by the PcG (10). The embryonic null phenotypes of esc or E(z) are much more severe than those of E(Pc), Pcl, and Asx (6, 36, 62, 69, 71). The changes in RNA levels in esc and E(z) mutants (affecting Pc the most; Fig. 3) are different from those of E(Pc), Pcl, or Asx mutants (affecting Psc the most; Fig. 1). The distinction is less certain for Pcl, because it is sometimes associated with a high-molecular-weight form of the ESC/E(Z) complex (75), but it seems best grouped with E(Pc) and Asx.
The ESC-E(Z) complex has been surmised to recruit PRC1 to genes destined for repression, and it might create an epigenetic mark, a methylated histone, to attract PRC1. This hypothesis is based on several observations: (i) esc, unlike other PcG genes, is required very early in embryogenesis and hardly at all in later life (65, 73), (ii) an ESC-E(Z) complex has been shown to methylate histone H3 in vitro at the K27 residue (10, 49), (iii) _E(z)_-dependent H3-K27 methylation has been shown to occur at a Polycomb response element in the homeotic gene cluster (10), and (iv) PC protein has been shown to bind to methylated histone H3 (16). Our results (Fig. 3) show that esc positively regulates Pc, Psc, and ph-d transcript levels. Its effect on Pc is particularly dramatic; Pc RNA is reduced nearly to background levels in embryos lacking ESC. It is possible the ESC-E(Z) complex methylates the histones at the Pc locus and that this is the major reason for the esc effect on the homeotics. This might explain why the esc null phenotype so closely resembles the Pc null phenotype (42). It is also possible that the histone methyltransferase activity is used to regulate both Pc and downstream genes like the homeotics.
Acknowledgments
We thank Jacob Hodgson for sharing unpublished ph-d cDNA sequence. We are grateful to Richard Emmons and Ting Wu for sharing their molecular analysis of Psc alleles. Rick Jones generously provided E(z) alleles. We also thank Jean Pesola, Stan Tabor, and Michael Keogh for technical advice, J. Alex Becker for help with the figures, and Steve Buratowski and Hugh Brock for helpful comments.
This work was supported by a grant from the National Institutes of Health to W.B.
REFERENCES
- 1.Birve, A., A. K. Sengupta, D. Beuchle, J. Larsson, J. A. Kennison, A. Rasmuson-Lestander, and J. Muller. 2001. Su(z)12, a novel Drosophila Polycomb group gene that is conserved in vertebrates and plants. Development 128**:**3371-3379. [DOI] [PubMed] [Google Scholar]
- 2.Bloyer, S., G. Cavalli, H. W. Brock, and J.-M. Dura. 2003. Identification and characterization of polyhomeotic PREs and TREs. Dev. Biol. 261**:**426-442. [DOI] [PubMed] [Google Scholar]
- 3.Boivin, A., M. O. Fauvarque, and J. M. Dura. 1999. One-to-one correspondence between the two genetic units and the tandemly duplicated transcriptional units of the polyhomeotic locus of Drosophila. Mol. Gen. Genet. 261**:**196-200. [DOI] [PubMed] [Google Scholar]
- 4.Bornemann, D., E. Miller, and J. Simon. 1998. Expression and properties of wild-type and mutant forms of the Drosophila sex comb on midleg (SCM) repressor protein. Genetics 150**:**675-686. [DOI] [PMC free article] [PubMed] [Google Scholar]
- 5.Boudreault, A. A., D. Cronier, W. Selleck, N. Lacoste, R. T. Utley, S. Allard, J. Savard, W. S. Lane, S. Tan, and J. Cote. 2003. Yeast Enhancer of Polycomb defines global ESA1-dependent acetylation of chromatin. Genes Dev. 17**:**1415-1428. [DOI] [PMC free article] [PubMed] [Google Scholar]
- 6.Breen, T. R., and I. M. Duncan. 1986. Maternal expression of genes that regulate the bithorax complex of Drosophila melanogaster. Dev. Biol. 118**:**442-456. [DOI] [PubMed] [Google Scholar]
- 7.Brunk, B. P., E. C. Martin, and P. N. Adler. 1991. Molecular genetics of the Posterior sex combs/Suppressor 2 of zeste region of Drosophila: aberrant expression of the Suppressor 2 of zeste gene results in abnormal bristle development. Genetics 128**:**119-132. [DOI] [PMC free article] [PubMed] [Google Scholar]
- 8.Brunk, B. P., E. C. Martin, and P. N. Adler. 1991. Drosophila genes Posterior Sex Combs and Suppressor two of zeste encode proteins with homology to the murine bmi-1 oncogene. Nature 353**:**351-353. [DOI] [PubMed] [Google Scholar]
- 9.Campbell, R. B., D. A. Sinclair, M. Couling, and H. W. Brock. 1995. Genetic interactions and dosage effects of Polycomb group genes of Drosophila. Mol. Gen. Genet. 246**:**291-300. [DOI] [PubMed] [Google Scholar]
- 10.Cao, R., L. Wang, H. Wang, L. Xia, H. Erdjument-Bromage, P. Tempst, R. S. Jones, and Y. Zhang. 2002. Role of histone H3 lysine 27 methylation in Polycomb-group silencing. Science 298**:**1039-1043. [DOI] [PubMed] [Google Scholar]
- 11.Carrington, E. A., and R. S. Jones. 1996. The Drosophila Enhancer of zeste gene encodes a chromosomal protein: examination of wild-type and mutant protein distribution. Development 122**:**4073-4083. [DOI] [PubMed] [Google Scholar]
- 12.Casso, D., F. Ramirez-Weber, and T. B. Kornberg. 2000. GFP-tagged balancer chromosomes for Drosophila melanogaster. Mech. Dev. 91**:**451-454. [DOI] [PubMed] [Google Scholar]
- 13.Cheng, N. N., D. A. Sinclair, R. B. Campbell, and H. W. Brock. 1994. Interactions of polyhomeotic with Polycomb group genes of Drosophila melanogaster. Genetics 138**:**1151-1162. [DOI] [PMC free article] [PubMed] [Google Scholar]
- 14.Chomczynski, P., and N. Sacchi. 1987. Single-step method of RNA isolation by acid guanidinium thiocyanate-phenol-chloroform extraction. Anal. Biochem. 162**:**156-159. [DOI] [PubMed] [Google Scholar]
- 15.Cline, T. W., and B. J. Meyer. 1996. Vive la difference: males vs females in flies vs worms. Annu. Rev. Genet. 30**:**637-702. [DOI] [PubMed] [Google Scholar]
- 16.Czermin, B., R. Melfi, D. McCabe, V. Seitz, A. Imhof, and V. Pirrotta. 2002. Drosophila enhancer of Zeste/ESC complexes have a histone H3 methyltransferase activity that marks chromosomal Polycomb sites. Cell 111**:**185-196. [DOI] [PubMed] [Google Scholar]
- 17.Deatrick, J., M. Daly, N. B. Randsholt, and H. W. Brock. 1991. The complex genetic locus polyhomeotic in Drosophila melanogaster potentially encodes two homologous zinc-finger proteins. Gene 105**:**185-195. [DOI] [PubMed] [Google Scholar]
- 18.DeCamillis, M., N. S. Cheng, D. Pierre, and H. W. Brock. 1992. The polyhomeotic gene of Drosophila encodes a chromatin protein that shares polytene chromosome-binding sites with Polycomb. Genes Dev. 6**:**223-232. [DOI] [PubMed] [Google Scholar]
- 19.Dollard, C., S. L. Ricupero-Hovasse, G. Natsoulis, J. D. Boeke, and F. Winston. 1994. SPT10 and SPT21 are required for transcription of particular histone genes in Saccharomyces cerevisiae. Mol. Cell. Biol. 14**:**5223-5228. [DOI] [PMC free article] [PubMed] [Google Scholar]
- 20.Duncan, I. M. 1982. Polycomblike: a gene that appears to be required for the normal expression of the bithorax and antennapedia gene complexes of Drosophila melanogaster. Genetics 102**:**49-70. [DOI] [PMC free article] [PubMed] [Google Scholar]
- 21.Duncan, I. W., and E. B. Lewis. 1982. Genetic control of body segment differentiation in Drosophila, p. 533-554. In S. Subtelny and P. B. Green (ed.), Developmental order: its origin and regulation, the 40th symposium of the Society for Developmental Biology. ed. Alan Liss, Inc., New York, N.Y.
- 22.Dura, J. M., H. W. Brock, and P. Santamaria. 1985. Polyhomeotic: a gene of Drosophila melanogaster required for correct expression of segmental identity. Mol. Gen. Genet. 198**:**213-220. [DOI] [PubMed] [Google Scholar]
- 23.Dura, J. M., and P. Ingham. 1988. Tissue- and stage-specific control of homeotic and segmentation gene expression in Drosophila embryos by the polyhomeotic gene. Development 103**:**733-741. [DOI] [PubMed] [Google Scholar]
- 24.Dura, J. M., N. B. Randsholt, J. Deatrick, I. Erk, P. Santamaria, J. D. Freeman, S. J. Freeman, D. Weddell, and H. W. Brock. 1987. A complex genetic locus, polyhomeotic, is required for segmental specification and epidermal development in D. melanogaster. Cell 51**:**829-839. [DOI] [PubMed] [Google Scholar]
- 25.Faucheux, M., S. Netter, S. Bloyer, M. Moussa, E. Boissonneau, F. Lemeunier, M. Wegnez, and L. Thoedore. 2001. Advantages of a P-element construct containing MtnA sequences for the identification of patterning and cell determination genes in Drosophila melanogaster. Mol. Genet. Genomics 265**:**14-22. [DOI] [PubMed] [Google Scholar]
- 26.Fauvarque, M. O., and J. M. Dura. 1993. Polyhomeotic regulatory sequences induce developmental regulator-dependent variegation and targeted P-element insertions in Drosophila. Genes Dev. 7**:**1508-1520. [DOI] [PubMed] [Google Scholar]
- 27.Fauvarque, M. O., V. Zuber, and J. M. Dura. 1995. Regulation of polyhomeotic transcription may involve local changes in chromatin activity in Drosophila. Mech. Dev. 52**:**343-355. [DOI] [PubMed] [Google Scholar]
- 28.Francis, N. J., A. J. Saurin, Z. Shao, and R. E. Kingston. 2001. Reconstitution of a functional core polycomb repressive complex. Mol. Cell. 8**:**545-556. [DOI] [PubMed] [Google Scholar]
- 29.Francis, N. J., and R. E. Kingston. 2001. Mechanisms of transcriptional memory. Nat. Rev. Mol. Cell Biol. 2**:**409-421. [DOI] [PubMed] [Google Scholar]
- 30.Franke, A., S. Messmer, and R. Paro. 1995. Mapping functional domains of the polycomb protein of Drosophila melanogaster. Chromosome Res. 3**:**351-360. [DOI] [PubMed] [Google Scholar]
- 31.Frei, E., D. Bopp, M. Burri, S. Baumgartner, J. E. Edstrom, and M. Noll. 1995. Isolation and structural analysis of the extra sex combs gene of Drosophila. Cold Spring Harb. Symp. Quant. Biol. 50**:**127-134. [DOI] [PubMed] [Google Scholar]
- 32.Gelbart, W. M., M. McCarron, J. Pandey, and A. Chovnick. 1974. Genetic limits of the xanthine dehydrogenase structural element within the rosy locus in Drosophila melanogaster. Genetics 78**:**869-886. [DOI] [PMC free article] [PubMed] [Google Scholar]
- 33.Haynie, J. L. 1983. The maternal and zygotic roles of the gene Polycomb in embryonic determination in Drosophila melanogaster. Dev. Biol. 100**:**399-411. [DOI] [PubMed] [Google Scholar]
- 34.Hodgson, J. W., N. N. Cheng, D. A. Sinclair, M. Kyba, N. B. Randsholt, and H. W. Brock. 1997. The polyhomeotic locus of Drosophila melanogaster is transcriptionally and post-transcriptionally regulated during embryogenesis. Mech. Dev. 66**:**69-81. [DOI] [PubMed] [Google Scholar]
- 35.Ingham, P. W. 1984. A gene that regulates the bithorax complex differentially in larval and adult cells of Drosophila. Cell 37**:**815-823. [DOI] [PubMed] [Google Scholar]
- 36.Jones, R. S., and W. M. Gelbart. 1990. Genetic analysis of the enhancer of zeste locus and its role in gene regulation in Drosophila melanogaster. Genetics 126**:**185-199. [DOI] [PMC free article] [PubMed] [Google Scholar]
- 37.Kehle, J., D. Beuchle, S. Treuheit, B. Christen, J. A. Kennison, M. Bienz, and J. Müller. 1998. dMi-2, a hunchback-interacting protein that functions in polycomb repression. Science 282**:**1897-1900. [DOI] [PubMed] [Google Scholar]
- 38.Kennison, J. A., and J. W. Tamkun. 1988. Dosage-dependent modifiers of Polycomb and Antennapedia mutations in Drosophila. Proc. Natl. Acad. Sci. USA 85**:**8136-8140. [DOI] [PMC free article] [PubMed] [Google Scholar]
- 39.Kim, C. A., M. Gingery, R. M. Pilpa, and J. U. Bowie. 2002. The SAM domain of polyhomeotic forms a helical polymer. Nat. Struct. Biol. 9**:**453-457. [DOI] [PubMed] [Google Scholar]
- 40.King, I. F., N. J. Francis, and R. E. Kingston. 2002. Native and recombinant Polycomb group complexes establish a selective block to template accessibility to repress transcription in vitro. Mol. Cell. Biol. 22**:**7919-7928. [DOI] [PMC free article] [PubMed] [Google Scholar]
- 41.Kuzmichev, A., K. Nishioka, H. Erdjument-Bromage, P. Tempst, and D. Reinberg. 2002. Histone methyltransferase activity associated with a human multiprotein complex containing the Enhancer of Zeste protein. Genes Dev. 16**:**2893-2905. [DOI] [PMC free article] [PubMed] [Google Scholar]
- 42.Lawrence, P. A., P. Johnston, and G. Struhl. 1983. Different requirements for homeotic genes in the soma and germ line of Drosophila. Cell 35**:**27-34. [DOI] [PubMed] [Google Scholar]
- 43.Lehmann, R., and D. Tautz. 1994. In situ hybridization to RNA, p. 575-598. In L. S. B. Goldstein and E. A. Fyrberg (ed.), Methods in cell biology, vol. 4. Academic Press, Inc., San Diego, Calif. [DOI] [PubMed] [Google Scholar]
- 44.Lewis, E. B. 1978. A gene complex controlling segmentation in Drosophila. Nature 276**:**565-570. [DOI] [PubMed] [Google Scholar]
- 45.Lonie, A., R. D'Andrea, R. Paro, and R. Saint. 1994. Molecular characterisation of the polycomblike gene of Drosophila melanogaster, a trans-acting negative regulator of homeotic gene expression. Development 120**:**2629-2636. [DOI] [PubMed] [Google Scholar]
- 46.Martin, E. C., and P. N. Adler. 1993. The Polycomb group gene Posterior Sex Combs encodes a chromosomal protein. Development 117**:**641-655. [DOI] [PubMed] [Google Scholar]
- 47.Milne, T. A., D. A. Sinclair, and H. W. Brock. 1999. The Additional sex combs gene of Drosophila is required for activation and repression of homeotic loci, and interacts specifically with Polycomb and super sex combs. Mol. Gen. Genet. 261**:**753-761. [DOI] [PubMed] [Google Scholar]
- 48.Mollaaghababa, R. L. Sipos, S. Y. Tiong, O. Papoulas, J. A. Armstrong, J. W. Tamkun, and W. Bender. 2001. Mutations in Drosophila heat shock cognate 4 are enhancers of Polycomb. Proc. Natl. Acad. Sci. USA 98**:**3958-3963. [DOI] [PMC free article] [PubMed] [Google Scholar]
- 49.Müller, J., C. M. Hart, N. J. Francis, M. L. Vargas, A. Sengupta, B. Wild, E. L. Miller, M. B. O'Connor, R. E. Kingston, and J. A. Simon. 2002. Histone methyltransferase activity of a Drosophila Polycomb group repressor complex. Cell 111**:**197-208. [DOI] [PubMed] [Google Scholar]
- 50.Nasmyth, K. 1993. Regulating the HO endonuclease in yeast. Curr. Opin. Genet. Dev. 3**:**286-294. [DOI] [PubMed] [Google Scholar]
- 51.Natsoulis, G., C. Dollard, F. Winston, and J. D. Boeke. 1991. The products of the SPT10 and SPT21 genes of Saccharomyces cerevisiae increase the amplitude of transcriptional regulation at a large number of unlinked loci. New Biol. 3**:**1249-1259. [PubMed] [Google Scholar]
- 52.Nielsen, P. R., D. Nietlispach, H. R. Mott, J. Callaghan, A. Bannister, T. Kouzarides, A. G. Murzin, N. V. Murzina, and E. D. Laue. 2002. Structure of the HP1 chromodomain bound to histone H3 methylated at lysine 9. Nature 416**:**103-107. [DOI] [PubMed] [Google Scholar]
- 53.Nüsslein-Volhard, C., E. Weischaus, and H. Klüding. 1984. Mutations affecting the pattern of the larval cuticle in Drosophila melanogaster. Wilhelm Roux's Arch. Dev. Biol. 193**:**267-282. [DOI] [PubMed] [Google Scholar]
- 54.Paro, R., and D. S. Hogness. 1991. The Polycomb protein shares a homologous domain with a heterochromatin-associated protein of Drosophila. Proc. Natl. Acad. Sci. USA 88**:**263-267. [DOI] [PMC free article] [PubMed] [Google Scholar]
- 55.Pirrotta, V. 1998. Polycombing the genome: PcG, trxG, and chromatin silencing. Cell 93**:**333-336. [DOI] [PubMed] [Google Scholar]
- 56.Rastelli, L., C. S. Chan, and V. Pirrotta. 1993. Related chromosome binding sites for zeste, suppressors of zeste and Polycomb group proteins in Drosophila and their dependence on Enhancer of zeste function. EMBO J. 12**:**1513-1522. [DOI] [PMC free article] [PubMed] [Google Scholar]
- 57.Renauld, H., O. M. Aparicio, P. D. Zierath, B. L. Billington, S. K. Chhablani, and D. E. Gottschling. 1993. Silent domains are assembled continuously from the telomere and are defined by promoter distance and strength, and by SIR3 dosage. Genes Dev. 7**:**1133-1145. [DOI] [PubMed] [Google Scholar]
- 58.Ruhf, M. L., A. Braun, O. Papoulas, J. W. Tamkun, N. Randsholt, and M. Meister. 2001. The domino gene of Drosophila encodes novel members of the SWI2/SNF2 family of DNA-dependent ATPases, which contribute to the silencing of homeotic genes. Development 128**:**1429-1441. [DOI] [PubMed] [Google Scholar]
- 59.Santamaria, P., and N. Randsholt. 1995. Characterization of a region of the X chromosome of Drosophila including multi sex combs (mxc), a Polycomb group gene which also functions as a tumour suppressor. Mol. Gen. Genet. 246**:**282-290. [DOI] [PubMed] [Google Scholar]
- 60.Sathe, S. S., and P. J. Harte. 1995. The Drosophila extra sex combs protein contains WD motifs essential for its function as a repressor of homeotic genes. Mech. Dev. 52**:**77-87. [DOI] [PubMed] [Google Scholar]
- 61.Sato, T., M. A. Russell, and R. E. Denell. 1983. Homoeosis in Drosophila melanogaster: a new enhancer of Polycomb and related homoeotic mutations. Genetics 105**:**357-370. [DOI] [PMC free article] [PubMed] [Google Scholar]
- 62.Sato, T., P. H. Hayes, and R. E. Denell. 1984. Homoeosis in Drosophila melanogaster: maternal effect of the enhancer of Polycomb locus in its interaction with Polycomb and related loci. Dev. Genet. 4**:**185-198. [Google Scholar]
- 63.Saurin, A. J., Z. Shao, H. Erdjument-Bromage, P. Tempst, and R. E. Kingston. 2001. A Drosophila Polycomb group complex includes Zeste and dTAFII proteins. Nature 412**:**655-660. [DOI] [PubMed] [Google Scholar]
- 64.Shao, Z., F. Raible, R. Mollaaghababa, J. R. Guyon, C.-t. Wu, W. Bender, and R. E. Kingston. 1999. Stabilization of chromatin structure by PRC1, a Polycomb complex. Cell 98**:**37-46. [DOI] [PubMed] [Google Scholar]
- 65.Simon, J., D. Bornemann, K. Lunde, and C. Schwartz. 1995. The extra sex combs product contains WD40 repeats and its time of action implies a role distinct from other Polycomb group products. Mech. Dev. 53**:**197-208. [DOI] [PubMed] [Google Scholar]
- 66.Simon, J. 1995. Locking in stable states of gene expression: transcriptional control during Drosophila development. Curr. Opin. Cell Biol. 7**:**376-385. [DOI] [PubMed] [Google Scholar]
- 67.Sinclair, D. A., R. B. Campbell, F. Nicholls, E. Slade, and H. W. Brock. 1992. Genetic analysis of the additional sex combs locus of Drosophila melanogaster. Genetics 130**:**817-825. [DOI] [PMC free article] [PubMed] [Google Scholar]
- 68.Sinclair, D. A., T. A. Milne, J. W. Hodgson, J. Shellard, C. A. Salinas, M. Kyba, F. Randazzo, and H. W. Brock. 1998. The Additional sex combs gene of Drosophila encodes a chromatin protein that binds to shared and unique Polycomb group sites on polytene chromosomes. Development 125**:**1207-1216. [DOI] [PubMed] [Google Scholar]
- 69.Soto, M. C., T. B. Chou, and W. Bender. 1995. Comparison of germline mosaics of genes in the Polycomb group of Drosophila melanogaster. Genetics 140**:**231-243. [DOI] [PMC free article] [PubMed] [Google Scholar]
- 70.Stankunas, K., J. Berger, C. Ruse, D. A. R. Sinclair, F. Randazzo, and H. W. Brock. 1998. The Enhancer of Polycomb gene of Drosophila encodes a chromatin protein conserved in yeast and mammals. Development 125**:**4055-4066. [DOI] [PubMed] [Google Scholar]
- 71.Struhl, G. 1981. A gene product required for correct initiation of segmental determination in Drosophila. Nature 293**:**36-41. [DOI] [PubMed] [Google Scholar]
- 72.Struhl, G. 1983. Role of the esc+ gene product in ensuring the selective expression of segment-specific homeotic genes in Drosophila. J. Embryol. Exp. Morphol. 76**:**297-331. [PubMed] [Google Scholar]
- 73.Struhl, G., and D. Brower. 1982. Early role of the esc+ gene product in the determination of segments in Drosophila. Cell 31**:**285-292. [DOI] [PubMed] [Google Scholar]
- 74.Tie, F., T. Furuyama, and P. J. Harte. 1998. The Drosophila Polycomb group proteins ESC and E(Z) bind directly to each other and co-localize at multiple chromosomal sites. Development 125**:**3483-3496. [DOI] [PubMed] [Google Scholar]
- 75.Tie, F., J. Prasad-Sinha, A. Birve, A. Rasmuson-Lestander, and P. J. Harte. 2003. A 1-megadalton ESC/E(Z) complex from Drosophila that contains Polycomblike and RPD3. Mol. Cell. Biol. 23**:**3352-3362. [DOI] [PMC free article] [PubMed] [Google Scholar]
- 76.Wieschaus, E., and C. Nüsslein-Volhard. 1986. Looking at embryos, p. 199-227. In D. B. Roberts (ed.), Drosophila: a practical approach. Oxford University Press, Oxford, United Kingdom.
- 77.Wu, C.-t., and M. Howe. 1995. A genetic analysis of the Suppressor 2 of zeste complex of Drosophila melanogaster. Genetics 140**:**139-181. [DOI] [PMC free article] [PubMed] [Google Scholar]
- 78.Yamamoto, Y., F. Girard, B. Bello, M. Affolter, and W. J. Gehring. 1997. The cramped gene of Drosophila is a member of the Polycomb-group, and interacts with mus209, the gene encoding proliferating cell nuclear antigen. Development 124**:**3385-3394. [DOI] [PubMed] [Google Scholar]
- 79.Zink, B., and R. Paro. 1989. In vivo binding pattern of a trans-regulator of homoeotic genes in Drosophila melanogaster. Nature 337**:**468-471. [DOI] [PubMed] [Google Scholar]