Quantitative proteomics identify Tenascin-C as a promoter of lung cancer progression and contributor to a signature prognostic of patient survival (original) (raw)
Significance
Quantitative mass spectrometric profiling of the extracellular matrix composition of normal lung, fibrotic lung, primary lung tumors, and lung metastases to the lymph nodes uncovered specific signatures distinguishing these tissues. CRISPR/Cas9-mediated gene activation of one of the identified factors, Tenascin-C (Tnc), showed that this protein plays a role in mediating lung adenocarcinoma metastasis. Tnc expression is repressed, directly or indirectly, by the transcription factor Nkx2-1. Bioinformatic analysis shows that expression of three matrisome factors (TNC, S100A10, and S100A11) can predict survival in patients with lung adenocarcinoma. These factors could serve as disease markers that could be exploited for better diagnosis of lung cancer, and their future study could be used to inform the design of more potent treatments for patients.
Keywords: extracellular matrix, Tenascin-C, lung cancer, quantitative proteomics, tumor microenvironment
Abstract
The extracellular microenvironment is an integral component of normal and diseased tissues that is poorly understood owing to its complexity. To investigate the contribution of the microenvironment to lung fibrosis and adenocarcinoma progression, two pathologies characterized by excessive stromal expansion, we used mouse models to characterize the extracellular matrix (ECM) composition of normal lung, fibrotic lung, lung tumors, and metastases. Using quantitative proteomics, we identified and assayed the abundance of 113 ECM proteins, which revealed robust ECM protein signatures unique to fibrosis, primary tumors, or metastases. These analyses indicated significantly increased abundance of several S100 proteins, including Fibronectin and Tenascin-C (Tnc), in primary lung tumors and associated lymph node metastases compared with normal tissue. We further showed that Tnc expression is repressed by the transcription factor Nkx2-1, a well-established suppressor of metastatic progression. We found that increasing the levels of Tnc, via CRISPR-mediated transcriptional activation of the endogenous gene, enhanced the metastatic dissemination of lung adenocarcinoma cells. Interrogation of human cancer gene expression data revealed that high TNC expression correlates with worse prognosis for lung adenocarcinoma, and that a three-gene expression signature comprising TNC, S100A10, and S100A11 is a robust predictor of patient survival independent of age, sex, smoking history, and mutational load. Our findings suggest that the poorly understood ECM composition of the fibrotic and tumor microenvironment is an underexplored source of diagnostic markers and potential therapeutic targets for cancer patients.
Tumor progression is a function of the combined effects of genetic and epigenetic changes in cancer cells, as well as the influence of the tumor microenvironment. Both cellular and noncellular stromal components in the tumor microenvironment have been shown to affect growth of the primary tumor, progression to metastasis, and response to various anticancer agents (1).
Characterization of the tumor-associated stroma in many different cancer types has revealed an extensive array of cell types and structural components that directly affect tumorigenesis (1). In particular, the noncellular component of the tumor microenvironment, the extracellular matrix (ECM), has emerged as an important regulator of cancer development (2). The ECM is a complex network of secreted macromolecules that surrounds most cells within tissues and contributes to the establishment and maintenance of tissue architecture (3). Along with providing the structural foundation for tissue function and mechanical integrity, the ECM has various other roles that make it relevant to the pathology of cancer. The ECM serves as a substrate for cell attachment and guides the migration of cells along its fibers. Moreover, the ECM affects proliferation by acting as a reservoir for growth factors and chemokines, and regulates the presentation of these molecules to their corresponding receptors (3). Thus, it is not surprising that the ECM plays a critical role during tumor cell invasion and metastasis (4, 5). In fact, different adhesive characteristics of the ECM have been suggested to control key steps of the metastatic process, including tumor cell intravasation, extravasation, and metastatic colonization (2).
Although the ECM is a major component of the tumor microenvironment, our understanding of the changes in ECM composition during cancer progression remains incomplete, largely due to technical challenges in comprehensively assaying the ECM in a sensitive and unbiased manner. In this study, we focused on analyzing the ECM changes associated with lung cancer, the most prevalent and deadly cancer type worldwide. Non–small-cell lung cancers account for 83% of all lung cancers, with lung adenocarcinomas the most common subtype. Lung cancer accounts for more deaths than any other cancer in both men and women (6). Several clinical studies have noted that increased expression of certain ECM components, such as versican and hyaluronic acid, correlate with higher tumor recurrence rates and more advanced disease (7), yet their contributions to disease progression or utility as biomarkers remain unknown.
Because the complexity of the tumor microenvironment cannot be faithfully recapitulated in cell culture, genetically engineered mouse models of cancer are well suited to answer questions about the role of ECM components in tumor development and progression. In this study, we investigated the role of the ECM in the underlying biology of lung adenocarcinoma in the context of an autochthonous mouse model that recapitulates the in vivo complexity of cancer initiation and progression. This model is based on infection of a subset of adult lung epithelial cells with viral vectors expressing Cre recombinase in mice harboring a LoxP-Stop-LoxP _Kras_G12D knock-in allele (_Kras_LSL-G12D) (8). Cre-mediated recombination of the transcriptional/translational “stop” element leads to activation of oncogenic Kras expression under control of its endogenous promoter, initiating the development of lung adenomas (8). Concomitant deletion of Trp53 in _Kras_LSL-G12D/+;_Trp53_Flox/Flox (KP) mice significantly promotes tumor progression to malignancy, leading to the development of lung adenocarcinomas that closely recapitulate the pathophysiologic features of the human disease. In the present study, we implemented a label-based, quantitative mass spectrometry (MS) approach to elucidate the compositional changes in the ECM accompanying lung cancer progression by profiling the matrisome of normal lung, primary lung tumors, and lung tumor metastases to the lymph nodes. The matrisome is defined as the ensemble of core ECM proteins (e.g., collagens, proteoglycans) and ECM-associated proteins, which include ECM-affiliated proteins (e.g., annexins, lectins), ECM regulators (proteases, their inhibitors, and cross-linking enzymes) and secreted factors (e.g., chemokines, growth factors, S100 proteins) (9).
To compare ECM changes in lung cancer with other pathological conditions, we examined the changes associated with pulmonary fibrosis, a common and devastating condition characterized by the excessive and disordered deposition of ECM that destroys the normal alveolar structures and thus impairs lung function (10). There is an urgent need to better understand this condition, because idiopathic pulmonary fibrosis (IPF) is a fatal disease with a prognosis worse than the majority of cancers (11). Between 30,000 and 40,000 new cases of IPF are diagnosed each year in the United States, and the median survival is only 2.5–3.5 y (11). There are a number of similarities in the biology of IPF and lung cancer, including common alterations in signal transduction pathways, as well as in the underlying genetic and epigenetic changes (11). Moreover, increased abundance of ECM deposition is a key feature of both diseases, and chronic fibrosis may confer increased risk of later tumor development (11). Therefore, we reasoned that comparing the ECM changes between these conditions would provide insight into this disease. To this end, we used a mouse model of pulmonary fibrosis, based on bleomycin administration (12).
This study provides a comprehensive analysis of the matrisome in in vivo mouse models of fibrosis and metastatic lung cancer. Our work identifies common and unique components of fibrosis and lung cancer, and distinguishes changes in the ECM composition attributable to fibrosis vs. those related to tumorigenesis. We reveal enrichment of previously uncharacterized proteins in advanced tumors and provide evidence for the functional involvement of the ECM component Tenascin-C (Tnc) in driving tumor progression and metastasis. Importantly, we further demonstrate that expression of TNC together with two other matrisome factors, S100A10 and S100A11, holds prognostic information for lung adenocarcinoma patients.
Results
Quantitative Proteomic Profiling of the ECM of Normal and Diseased Lung Tissues.
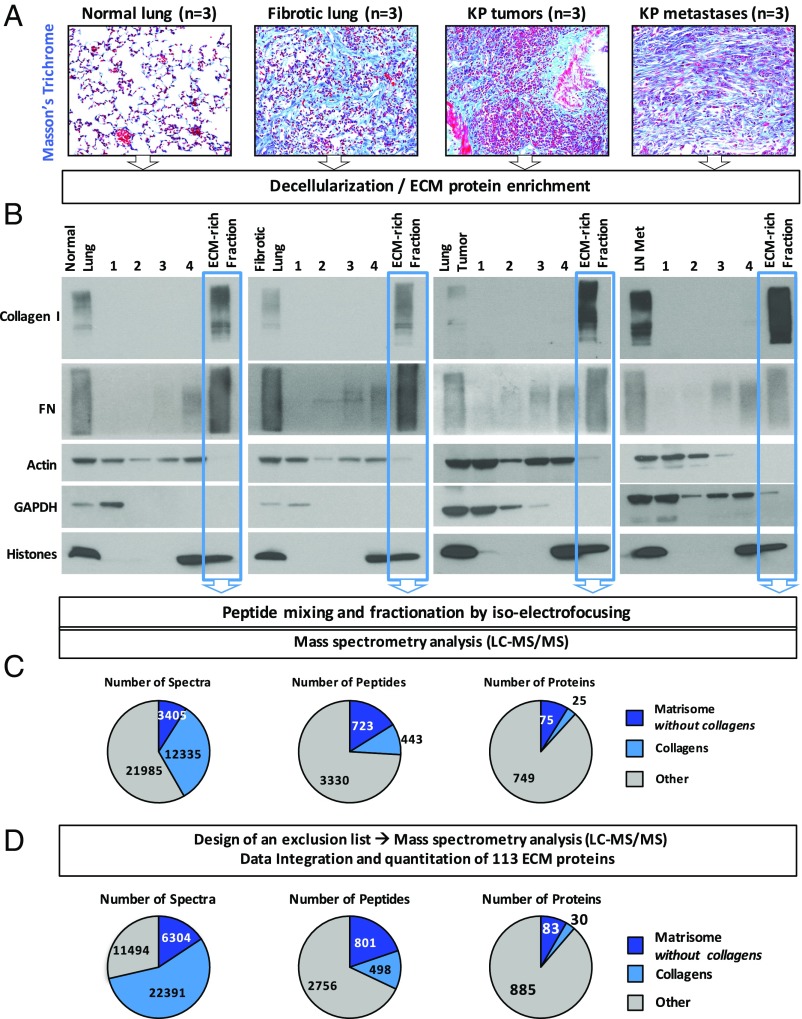
To study the ECM changes associated with lung cancer, we isolated normal, healthy lung tissues from wild-type (WT) mice and microdissected primary lung tumors (hereinafter referred to as KP tumors) and associated metastases to the mediastinal lymph node (Fig. 1_A_). We analyzed only advanced primary tumors (grades 3 and 4) as confirmed by a pathologist (R. Bronson). To compare the ECM changes associated with tumor development and those associated with fibrosis and inflammation, we further isolated whole lungs from mice treated with bleomycin, a commonly used animal model of pulmonary fibrosis (12).
Fig. 1.
Enrichment of ECM from lung tissues and tumors and quantitative proteomic analysis of ECM-enriched samples. (A) Masson's trichrome staining of sections of normal murine lung, fibrotic lung, lung tumor, and lung tumor metastasis to the lymph node shows increased deposition of collagen (blue) in diseased lung samples compared with normal lung. (B) The sequential removal of intracellular components (steps 1–4) and resulting ECM protein enrichment were monitored in each sample (normal lung, fibrotic lung, primary lung tumor, and lung metastasis) by immunoblotting for collagen I and Fn (ECM markers), actin (cytoskeletal marker), GAPDH (cytosolic marker), and histones (nuclear marker). The insoluble fraction remaining after serial extraction (highlighted in blue) was enriched for ECM proteins and largely depleted for intracellular components. (C) Pie charts represent the relative distribution of ECM and non-ECM components in terms of number of spectra (Left), number of peptides (Middle), and proteins (Right) identified in the TMT mix composed of peptides from all 12 samples in two technical replicates. (D) Pie charts represent the relative distribution of ECM and non-ECM components in terms of number of spectra (Left), number of peptides (Middle), and proteins (Right) identified in the TMT mix composed of peptides from all 12 samples after integrating data from two additional technical replicates conducted after implementing a spectral exclusion list (Materials and Methods).
Masson’s trichrome staining of paraffin-embedded tissues revealed that fibrotic lungs, advanced primary tumors, and metastases have a dramatic accumulation of collagen, the most abundant ECM component, compared with normal lungs (Fig. 1_A_). To systematically characterize the matrisome of normal lung, fibrotic lung, primary lung adenocarcinoma, and associated lymph node metastases, we used a recently developed proteomics-based approach (9, 13). The four sample types—normal lungs, fibrotic lungs, primary tumors, and metastatic tumors—were first subjected to a decellularization procedure to remove the soluble intracellular proteins and to enrich for ECM proteins (Fig. 1_B_). The quality of the ECM-enriched fraction was then verified by conducting MS analysis of each of the 12 prepared samples (Dataset S1). To evaluate the relative abundance of each ECM protein across the different sample types, we introduced label-based quantification to our proteomics pipeline (14). Each peptide sample was labeled with a unique isobaric tandem mass tag (TMT) (Dataset S2A) before MS analysis, which allowed us to obtain precise quantitative information from the samples. Because only 10 TMT tags exist at present, and because the MS analysis revealed similar ECM composition in the three normal lung samples (Dataset S1), we subsequently pooled these control samples and used this pool as a reference for quantitation in later analyses.
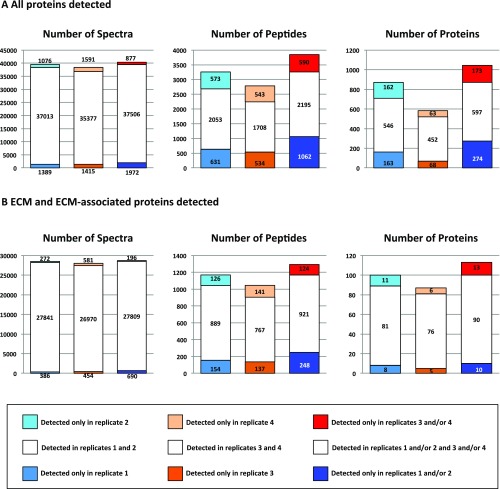
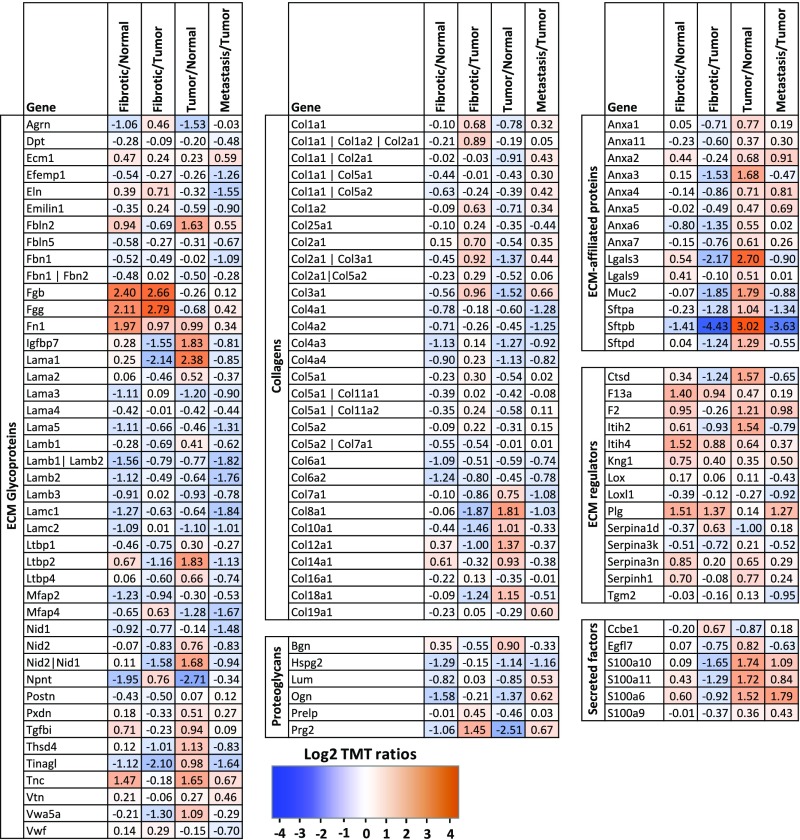
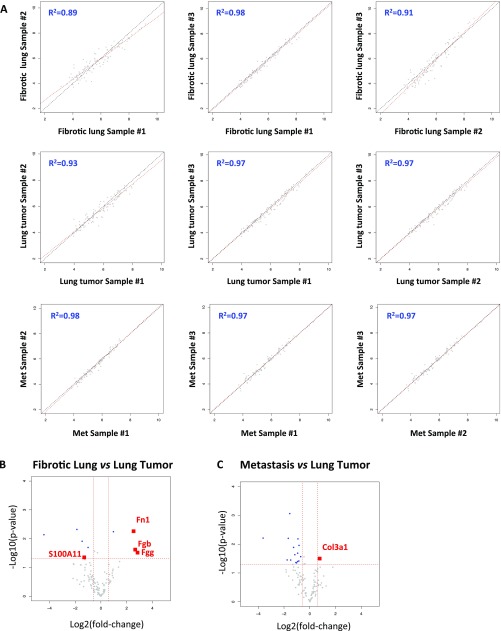
Because the mass spectrometer was operated in a data-independent manner, we performed two technical replicates (replicates 1 and 2); the overlap between the two replicates was 63%, which is satisfactory for this type of analysis (Fig. S1 A and B). In both replicates, >40% of the ∼35,000 identified spectra belonged to ECM proteins, and resulted in the detection of 25 collagens and 75 additional ECM and ECM-associated proteins (Fig. 1_C_). To decrease the frequency of selecting collagen peptides and other abundant peptides for fragmentation, and thus increase the likelihood of selecting previously unidentified peptides, we constructed an exclusion list and performed two additional technical replicates (replicates 3 and 4; Fig. S1 A and B). This analysis revealed an additional 590 unique peptides (Fig. S1_A_), 124 of which corresponded to known ECM proteins (Fig. S1_B_). Although we observed a 22% decrease in the number of spectra that were on the exclusion list, it is worth noting that the number of additional unique peptides identified was similar to that identified in a technical replicate performed without using the exclusion list. The union of all four replicates allowed us to quantify the level of detection of 113 ECM and ECM-associated proteins in all 10 samples (Figs. 1_D_ and 2 and Dataset S2). Annotation of these results using existing in silico murine matrisome data (9, 15) revealed the presence of 79 core matrisome proteins (43 ECM glycoproteins, 30 collagens, and 6 proteoglycans) and 34 ECM-associated proteins (14 ECM-affiliated proteins, 14 ECM regulators, and 6 secreted factors) (Fig. 2 and Dataset S2C). Pairwise comparisons of the level of detection of the 113 ECM proteins across all three biological replicates within each tissue type revealed significant intersample reproducibility (Fig. S2_A_).
Fig. S1.
Detailed quantitative proteomic analysis of ECM-enriched samples. (A) Bar charts represent the number of spectra, unique peptides, and proteins identified in two technical replicates before (replicates 1 and 2) and after (replicates 3 and 4) implementing an exclusion list aimed at ignoring peptides already detected in replicates 1 and 2 to identify peptides of lower abundance. (B) Bar charts represent the number of spectra and unique peptides corresponding to ECM and ECM-associated proteins, and the number of ECM and ECM-associated proteins identified in two technical replicates before (replicates 1 and 2) and after implementation of a peptide exclusion list (replicates 3 and 4).
Fig. 2.
List of 113 quantified ECM proteins in normal and diseased lung samples. For each protein, the average log2 TMT ratio was calculated for the following comparisons: fibrotic lung samples/normal lung sample, fibrotic lung samples/lung tumor samples, lung tumor samples/normal lung sample, and lymph node metastasis samples/lung tumor samples. The proteins are divided into categories constituting the matrisome: ECM glycoproteins (Left), collagens and proteoglycans (Middle), and ECM-associated proteins including ECM regulators, ECM-affiliated proteins, and ECM-associated secreted factors (Right).
Fig. S2.
Reproducibility of the proteomic data between biological replicates. (A) The median-centered reporter ion intensities (log10) are plotted pairwise to assess reproducibility between biological replicates within each condition. The correlation coefficient. _R_2, is indicated for each comparison. (B and C) Volcano plots illustrate pairwise differential expression changes (using log2 median-centered expression values) between fibrotic lung and lung tumors (B) and between metastases and primary lung tumors (C). Each dot represents a protein. The _x_-axis indicates the log2 fold change over the normal sample (positive values represent up-regulation compared with the normal sample). The _y_-axis is −log10 of the two-sided t test P value indicating the significance of differential gene expression compared with the normal sample. The horizontal red dashed line represents P < 0.05 significance threshold. The vertical dashed red lines represent up and down fold change thresholds of 1.5×. Blue dots represent significant differentially expressed genes (_P_ < 0.05) and antibodies (FC > 1.5×). Genes of interest are highlighted in red.
Independent Component Analysis Identifies ECM Signatures of Fibrotic Lung, Primary Lung Tumor, and Metastasis.
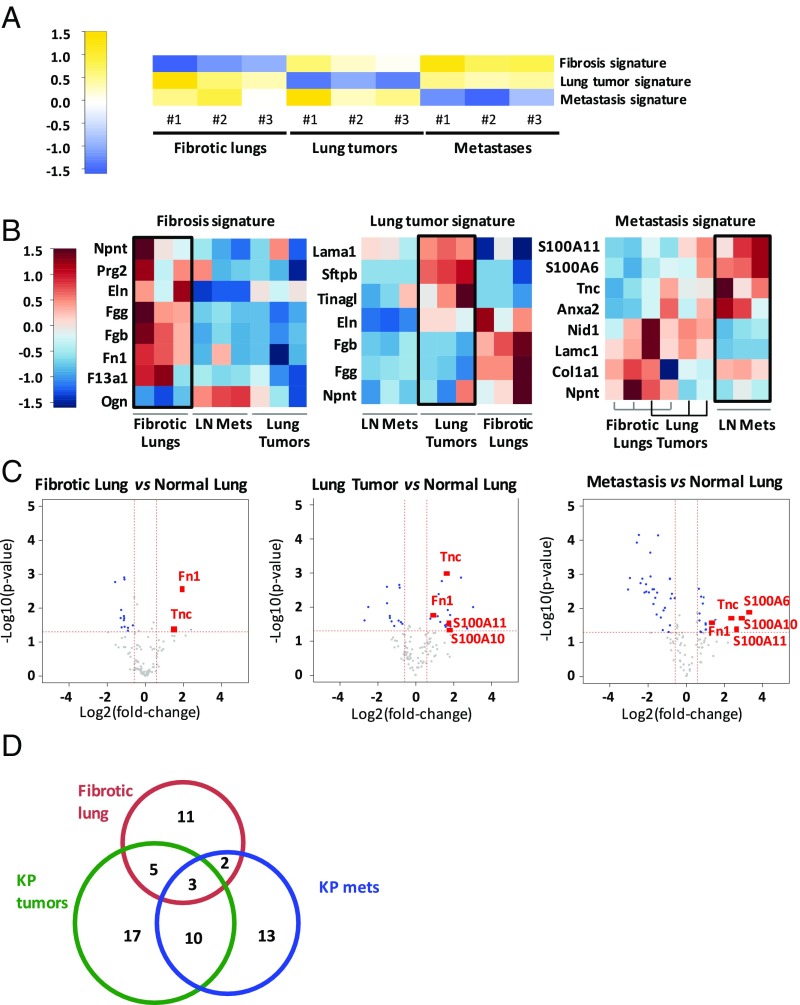
Unsupervised independent component analysis (ICA) identified three statistically significant ECM signatures within the dataset, which differentiated between the three disease states: fibrosis, primary tumor, and metastasis (Fig. 3_A_). This approach allowed us to identify the ECM proteins that were specific to each state (Fig. 3_B_). We observed increases in fibronectin (Fn) and the fibrinogen γ and β chains, but a decrease in osteoglycin, in fibrotic tumors compared with lung tumors. Similar changes were consistent among independent samples from different animals, suggesting that these are changes that reflect consistent alterations of likely functional relevance. Primary lung tumors and lymph node metastases were characterized by decreased levels of nephronectin and fibrinogens, but only primary lung tumors contained increased laminin and elastin. Finally, the metastatic samples showed significant and specific elevations in the expression of S100A6, S100A11, Tnc, and annexin A2 and decreased expression of nidogen and laminin gamma 1. Collectively, these data demonstrate that unique changes in the ECM composition can be used to differentiate between different disease states of the lung.
Fig. 3.
ECM signatures distinguish fibrotic, primary tumor, and metastatic states. (A) Analysis of proteomic data reveals three distinct statistically significant signatures (P < 0.01) characterizing fibrosis, primary lung tumor, and metastatic samples. Although each signature in the row-normalized heatmap is characterized by low protein levels (blue), each signature is two-sided, allowing for identification of proteins with high levels that characterize each of the states. Blue indicates lower protein levels compared with yellow (higher levels). (_B_) Heat maps for each of the three signatures show representation of enriched or depleted proteins (|_z_| > 1.75). Rows represent standardized median-centered values for a given protein, where blue indicates relatively lower levels than red. (C) Volcano plots illustrate pairwise differential expression changes (using log2 median-centered values) between each of fibrotic, lung tumor, and metastatic samples compared with the normal lung. Each dot represents a protein. The x axis indicates a log2-fold change over the normal sample (positive values represent up-regulation compared with the normal sample). The y axis is −log10 of the two-sided t test P value indicating the significance of differential gene expression compared with the normal sample. The horizontal red dashed line represents the P < 0.05 significance threshold. The vertical dashed red lines represent up and down fold change thresholds of 1.5× . Blue dots represent significant differentially expressed genes (_P_ < 0.05 and FC > 1.5×). Several proteins of interest (all significant) are highlighted in red; a complete list is provided in Dataset S3. (D) Venn diagram represents the overlap between ECM and ECM-associated proteins found in significantly altered abundance in lung fibrosis, lung tumor, and metastasis. The three proteins found in significantly different abundance in all three conditions are Fn, Tnc, and S100A11 (a complete list is provided in Dataset S3F).
We used volcano plots to highlight ECM proteins that were detected in significantly altered abundance in pairwise comparisons of diseased and normal lungs (Fig. 3_C_ and Dataset S3). Tnc was present in very low amounts in normal lungs, but was markedly increased levels in fibrotic and tumor samples (Figs. 2 and 3_C_). Fibronectin 1 (Fn), a binding partner of Tnc, was also significantly more abundant in the disease samples. In addition, three members of the S100 family of proteins—S100A6, S100A10, and S100A11—were detected in greater abundance in advanced KP tumors (approximately fourfold) and metastases (7.5- to 11-fold) compared with normal lung, but were not enriched in fibrotic lung (Fig. 2). Interestingly, a comparison of the matrisomes of primary lung tumors and fibrotic lungs revealed only few proteins detected in significantly different proportions, suggesting that most changes in the abundance of ECM proteins in tumor samples are similar to and of the same magnitude as those occurring during fibrosis (Fig. S2_B_). Similarly, a comparison of the matrisomes of primary lung tumors and metastases to lymph nodes identified only the α1 chain of collagen 3 as expressed in significantly higher amounts in metastases and fibrotic lungs (Fig. S2_C_). Moreover, analysis of the overlap between the ECM and ECM-associated proteins identified in significantly altered abundance in all three conditions revealed three proteins: Fn, Tnc, and S100A11 (Fig. 2_D_). There were also 13 proteins with similar changes between KP tumors and metastases, and 8 between fibrosis and tumors (Fig. 2_D_ and Dataset S3F). In summary, analysis of the MS data revealed common and unique changes in specific ECM components that characterize the three disease states.
Validation of MS Data by Immunohistochemistry.
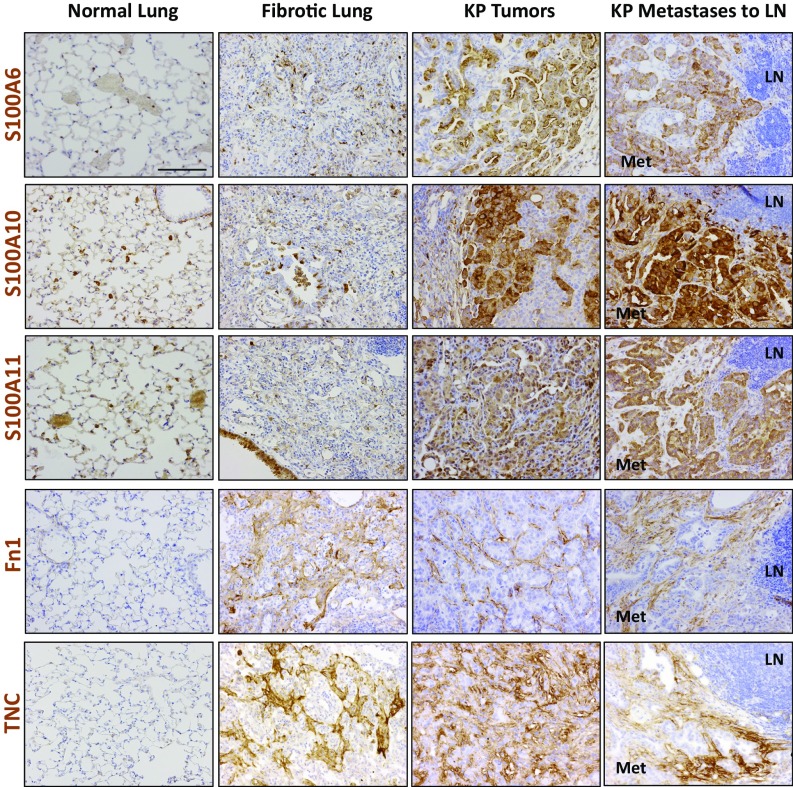
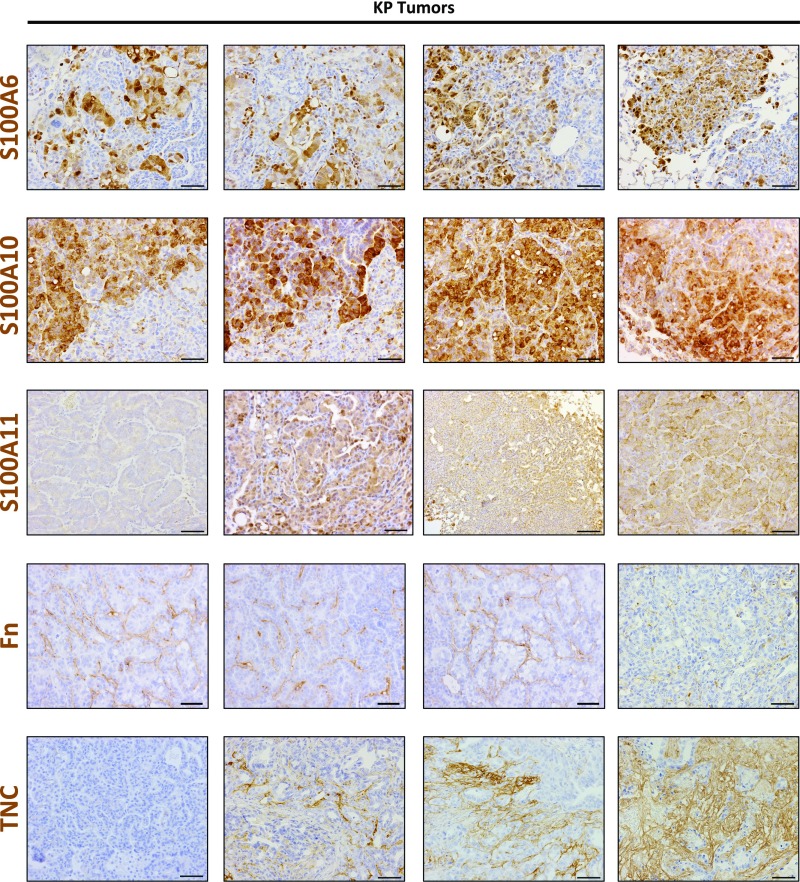
To confirm the MS data, we performed immunohistochemistry (IHC) for a subset of the identified ECM proteins to determine whether their expression was altered in fibrotic lungs, tumors, and metastases compared with normal lungs. Analysis of S100 protein expression patterns in normal lungs showed that these proteins were largely absent from the extracellular space. In the fibrotic lung samples, the overall expression for the three S100 proteins was relatively low, which is consistent with the MS analysis (Fig. 3_C_). In contrast, primary tumors had a marked increase of all three proteins in the tumor cells and in the extracellular spaces (Fig. 4 and Fig. S3). Some tumors were uniformly positive for the S100 factors, whereas others exhibited patchy expression (Fig. S3), but higher-grade tumors and aggressive areas were overall positive. Similarly, S100A6, S100A10, and S100A11 were more abundant in KP lung metastases to the mediastinal lymph nodes (Fig. 4, Right), whereas there was no or very little detectable expression in the normal lymph nodes. These data support the results of our MS analysis, and raise the possibility that these proteins can serve as biomarkers of disease development.
Fig. 4.
Validation of significantly up-regulated ECM proteins by IHC. Representative images of IHC for the indicated proteins in normal lung, primary lung tumor, and lung metastases to the lymph node, stained under identical conditions. Positive signals are shown in brown; hematoxylin (blue) was used as a counterstain. LN indicates the normal lymph node region, and Met is the area occupied by lung metastasis. All pictures were taken under the same magnification. (Scale bar: 50 μm.)
Fig. S3.
Additional examples of IHC staining of S100A6, S100A10, S100A11, Fn, and Tnc in KP lung tumors, showing the heterogeneity of expression of the indicated factors in primary KP tumors. Positive signals are shown in brown; hematoxylin (blue) was used as a counterstain. (Scale bar: 50 μm.)
We next examined the expression of Fn, an ECM glycoprotein commonly bound to integrins, which are known proproliferation factors (16). IHC analysis revealed that compared with normal lungs, Fn levels were increased in fibrotic lungs as well as in lung tumors and their associated metastases (Fig. 4). In the normal lung, Fn staining was less pronounced, with some expression found closely associated with blood vessels. In the fibrotic samples, Fn expression was significantly increased and in a stromal pattern. The tumor and metastatic samples also showed increased staining that was associated primarily with the stroma and showed distinct fibrillar networks (Fig. 4 and Fig. S3).
Finally, we examined the expression of Tnc, an ECM protein that is highly expressed in the developing embryo but absent in most adult tissues. Numerous studies have shown reexpression of Tnc at sites of wound healing or inflammation, as well as in malignant tumors of diverse origins (17). In agreement with those reports and with our MS data, there was minimal Tnc staining in the normal lung, but Tnc expression was dramatically increased at sites of fibrosis as well as in tumors and metastases (Fig. 4 and Fig. S3).
In summary, the unique changes identified in each condition suggest that these ECM proteins might have specific roles in mediating the phenotypes associated with the disease state with which they are associated. Furthermore, the differential staining patterns raise the possibility that ECM proteins can serve as faithful biomarkers for each of these disease states.
Regulation of Tnc During Lung Cancer Progression.
We focused our efforts on investigating the ECM protein Tnc, because its IHC pattern suggested that it may have a role in driving the pathology of lung fibrosis, as well as during tumor progression and the development of metastases. A functional role for Tnc in mice with bleomycin-induced fibrosis has already been demonstrated; Carey et al. (18) showed that _Tnc_-knockout animals are protected against fibrosis and exhibit significantly lower accumulation of collagen in the lungs. Thus, we chose to focus on the role of Tnc in lung adenocarcinomas using the KP model.
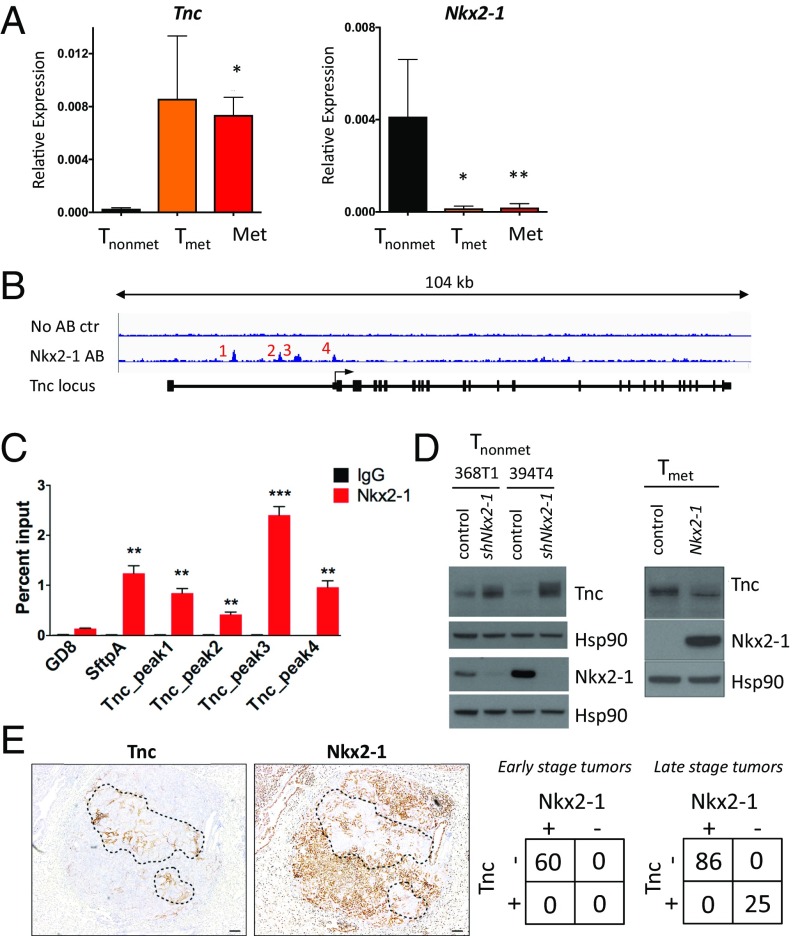
To dissect some of the molecular details of the regulatory networks that are affected during cancer progression and lead to up-regulation of expression of Tnc, we used a collection of cell lines isolated from KP mice that are representative of different stages of tumor progression. Tnonmet cells were isolated from nonmetastatic primary KP tumors, whereas Tmet and Met cell lines were harvested from metastatic primary tumors and their metastases to the lymph nodes or liver, respectively (19). Analysis of existing gene expression array data from these cell lines identified that, among other changes, Tnc was significantly up-regulated in Tmet and Met cells, but not in the nonmetastatic Tnonmet lines (P = 0.0001) (19). To confirm this observation, we isolated mRNA from these cell lines and performed quantitative RT-PCR (qPCR) analysis for Tnc expression. Although there was almost no Tnc expression in cell lines isolated from lower-grade Tnonmet cells, Tnc transcript levels were markedly up-regulated in both the Tmet and Met lines (Fig. 5_A_). These observations suggest a possible role for Tnc in tumor progression to metastasis.
Fig. 5.
Nkx2-1 represses Tnc expression. (A) qRT-PCR analysis of Tnonmet (n = 3), Tmet (n = 4), and Met (n = 6) cell lines for Tnc (Left) and Nkx2-1 (Right) expression relative to GAPDH used as control. *P < 0.05, **_P_ < 0.01, unpaired _t_ test. (_B_) Analysis of ChIP-Seq data (20) reveals binding of Nkx2-1 in the _Tnc_ genomic locus at four distinct areas near the transcription start site. (_C_) ChIP-qPCR analysis of the enrichment of Nkx2-1 binding at the _Tnc_ genomic locus. Data represent mean ± SEM of three independent experiments. _Sftpa_ serves as a positive control. Negative control mapping to a gene desert region on murine chromosome 8 (GD8). The Tnc peak numbers correspond to those in _B_. **_P_ < 0.01, ***_P_ < 0.001, unpaired _t_ test. (_D_) Western blots showing that Nkx2-1 knockdown in two different Tnonmet cell lines allows Tnc expression, while Nkx2-1 overexpression in Tmet cells represses Tnc. Hsp90 was used as a loading control. (_E_) Nkx2-1 and Tnc IHC of KP lung adenocarcinomas shows reciprocal staining. Quantitation of Nkx2-1 and Tnc expression in early-stage (4–6 wk after initiation) and late-stage KP tumors (>12 wk after initiation).
The transcription factor Nkx2-1 has been shown to inhibit tumor progression by repressing genes involved in metastasis (19). Given our observed anticorrelation between the patterns of expression of Nkx2-1 and Tnc in the cell lines (Fig. 5_A_), we hypothesized that Tnc also might be subject to Nkx2-1 repression. To examine this possibility, we analyzed Nkx2-1 chromatin immunoprecipitation sequencing (ChIP-seq) data (20) that identified Nkx2-1 binding sites in _Kras_-driven lung tumors, and discovered that Nkx2-1 binds the murine Tnc locus at four distinct regions near the transcription start site (Fig. 5_B_). We confirmed these data by ChIP and quantitative PCR (ChIP-qPCR) with primers specific to the four putative binding regions in the Tnc locus, and observed that Nkx2-1 bound to these regions with a strength comparable to that of a canonical Nkx2-1 target gene, SftpA (Fig. 5_C_). These results suggest that Nkx2-1 represses Tnc in KP tumor cells.
To determine whether Nkx2-1 is necessary and sufficient to control Tnc expression, we performed loss-of-function and complementary gain-of-function experiments. We observed that shRNA-mediated silencing of Nkx2-1 in two different Tnonmet cell lines indeed led to the derepression of Tnc (Fig. 5_D_). Analysis of previously published gene expression data on Tnonmet cell lines expressing shRNA for Nkx2-1 showed that Tnc levels increase following Nkx2-1 knockdown in three independent Tnonmet cell lines (19). Conversely, Tnc levels were strongly down-regulated in a TMet cell line following exogenous expression of Nkx2-1 cDNA (Fig. 5_D_).
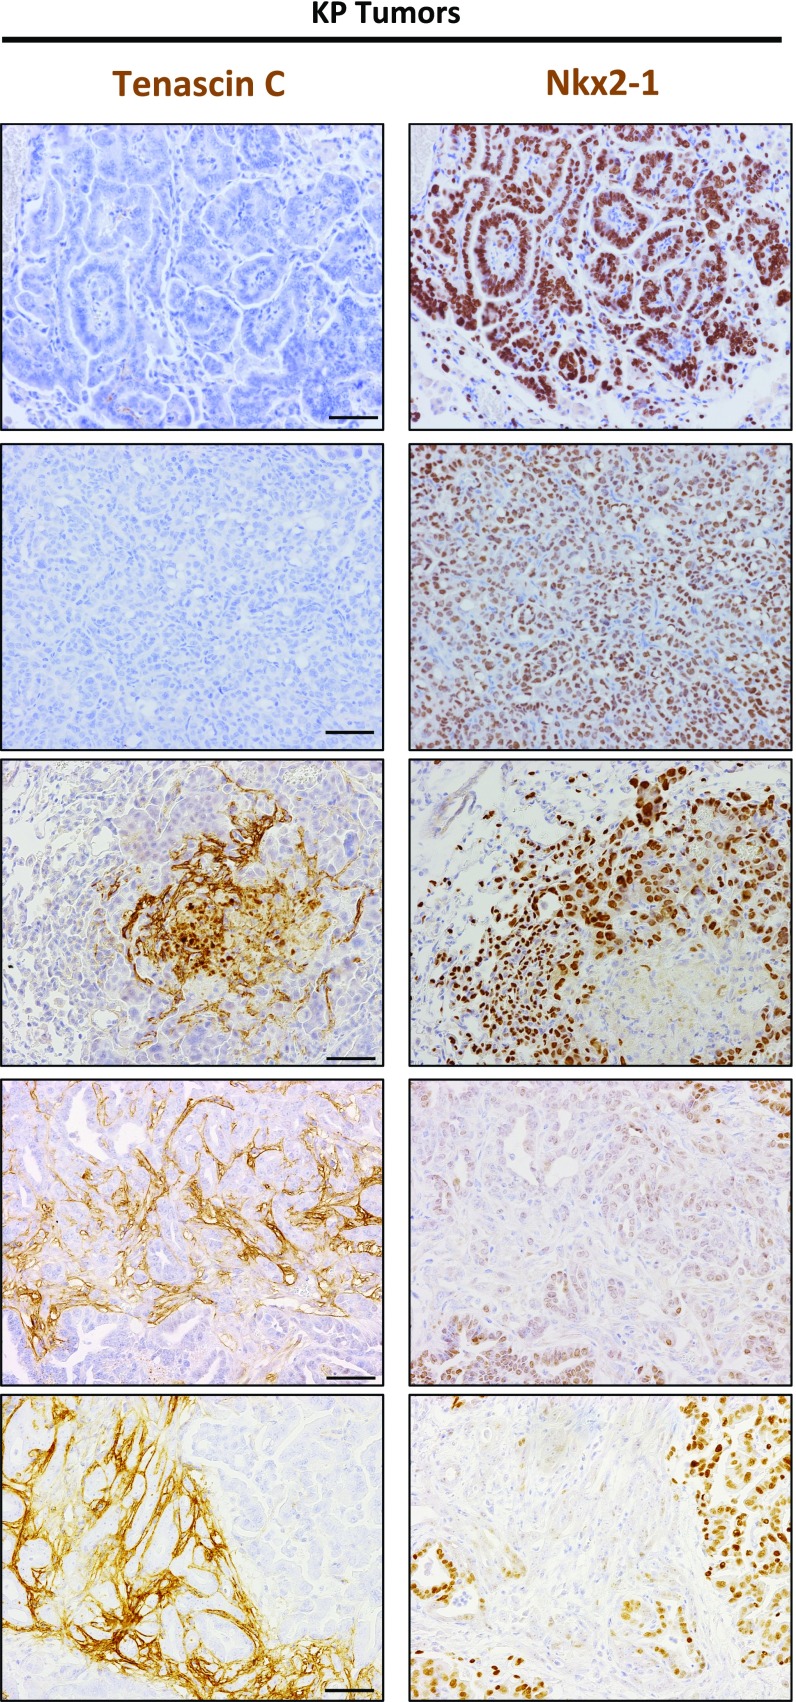
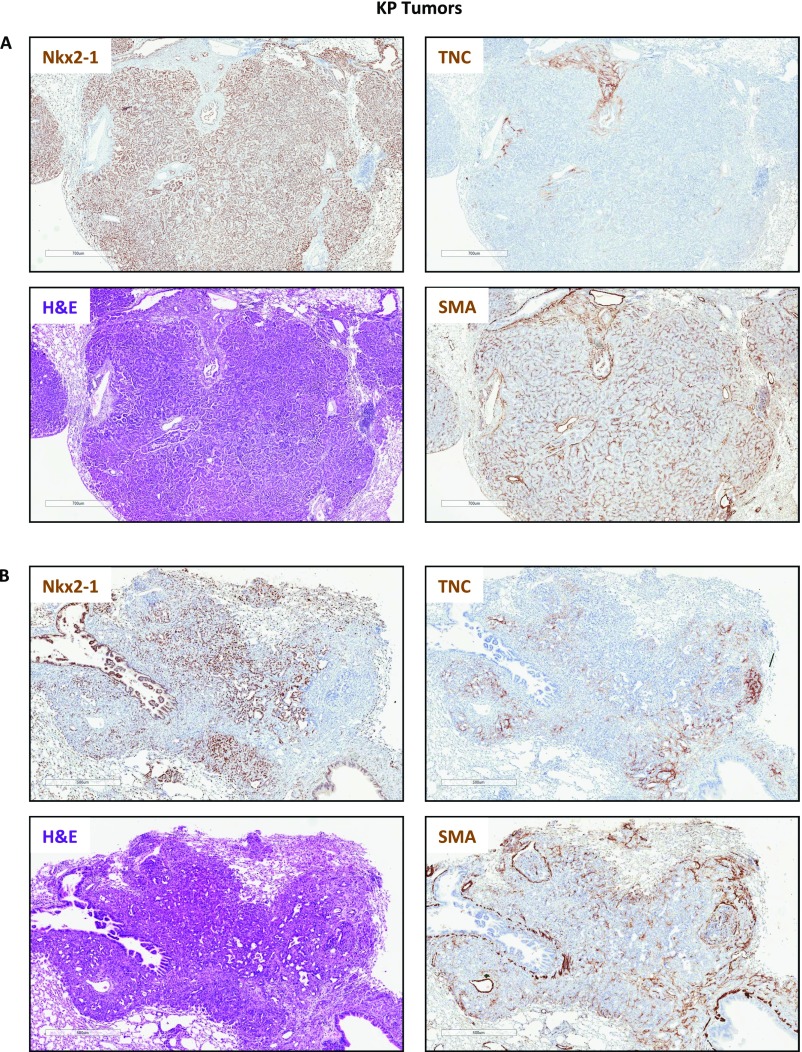
Consistent with a repressive effect of Nxk2-1 on Tnc, we observed a strong anticorrelation expression pattern in KP tumors in vivo. We stained and analyzed more than 100 KP primary tumors and consistently observed that regions lacking Nkx2-1 expression were Tnc-positive (Tncpos) (Fig. 5_E_ and Fig. S4). Both high-grade tumors and high-grade areas within otherwise lower-grade tumors that were Nkx2-1–negative (Nkx2-1neg) were strongly Tncpos (Fig. 5_E_). In contrast, early-stage tumors that expressed high levels of Nkx2-1 were uniformly Tnc-negative (Tncneg). Importantly, we did not observe any Nkx2-1pos/Tncpos and Nkx2-1neg/Tncneg tumors. Staining of serial sections of high-grade KP tumors for Tnc and smooth muscle actin revealed that despite the widespread presence of fibroblasts in these high-grade tumors, the presence of Tnc was restricted to the Nkx2-1neg areas (Fig. S5). We conclude that the progressive loss of Nkx2-1 during lung adenocarcinoma progression is responsible for the derepression of Tnc observed in late-stage tumors.
Fig. S4.
Additional examples of the reciprocal expression of Tnc and Nkx2-1 in KP lung tumors. Positive signals areshown in brown; hematoxylin (blue) was used as a counterstain. All pictures were taken under the same magnification. (Scale bar: 50 μm.)
Fig. S5.
H&E and IHC staining for Tnc, Nkx2-1, and smooth muscle actin in KP lung tumors. Positive signals are shown in brown; hematoxylin (blue) was used as a counterstain. (Scale bars: 700 μm in A; 500 μm in B.)
Tnc Enhances the Metastatic Potential of Lung Tumor Cells.
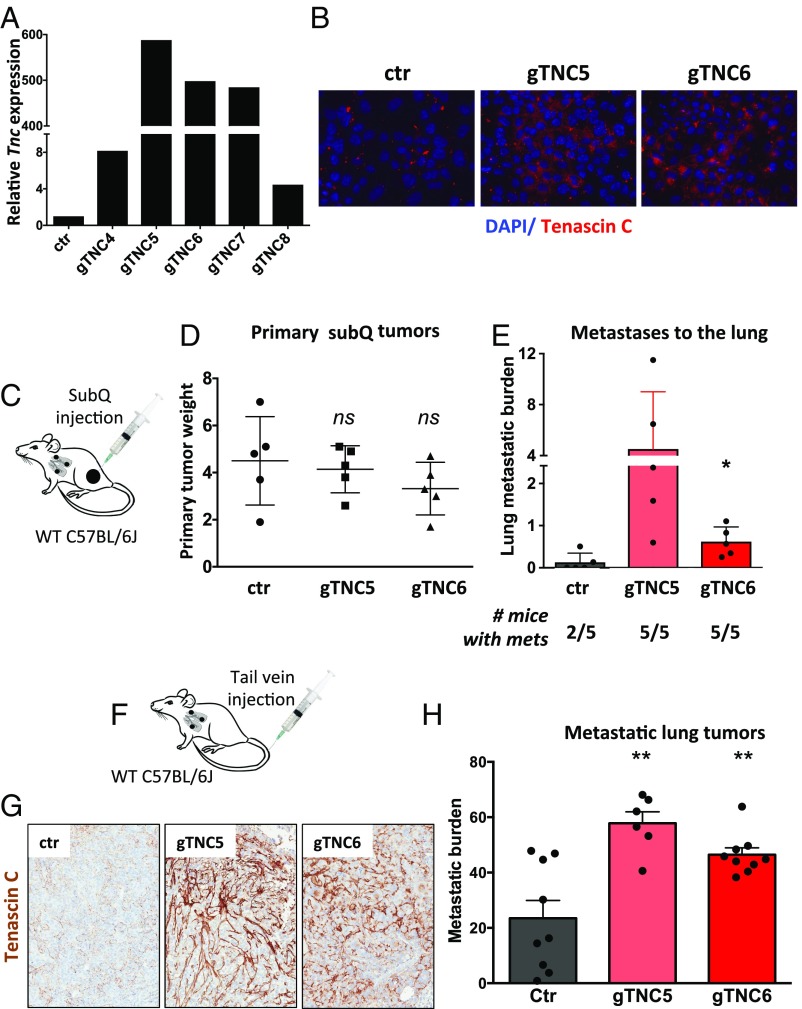
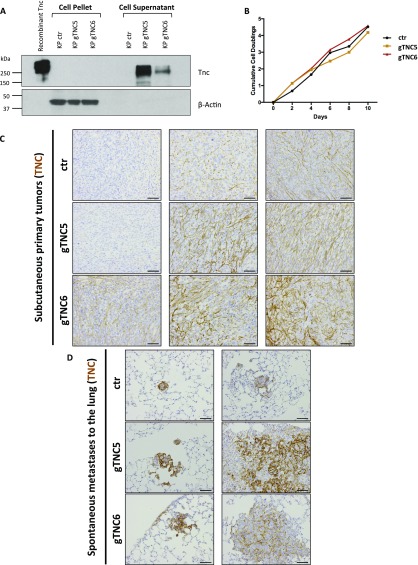
To determine whether up-regulation of Tnc is causal to the more aggressive and metastatic phenotype observed in late-stage tumors, we used the synergistic activation mediator (SAM) CRISPR/Cas9 system to induce Tnc expression in tumor cells (21). This three-component system comprises a catalytically inactive dCas9 fused to the transcriptional activator VP64 and a modified guide RNA (gRNA) scaffold containing two MS2 RNA aptamers, which recruit the MS2-P65-HSF1 tripartite synthetic transcriptional activator (21). It is important to note that the SAM system offers an unprecedented approach to gain-of-function studies, because Tnc is >7.5 kb long, making exogenous expression of this gene using traditional overexpression viral constructs challenging. To transcriptionally activate Tnc from its endogenous locus, we designed and cloned five independent gRNA sequences specific to the Tnc promoter. Expression of Tnc-specific gRNAs in KP cells expressing the SAM components resulted in 5- to 500-fold activation of Tnc expression as assessed by qPCR (Fig. 6_A_). We chose the two gRNAs (gTNC5 and 6) that induced the greatest Tnc expression, and validated Tnc protein induction by immunofluorescence (Fig. 6_B_) and Western blot analysis (Fig. S6_A_). Although Tnc expression was mostly intracellular shortly after cell seeding (Fig. 6_B_), over time the majority became secreted (Fig. S6_A_). Overexpression of Tnc did not affect the proliferation rate of cells in culture (Fig. S6_B_).
Fig. 6.
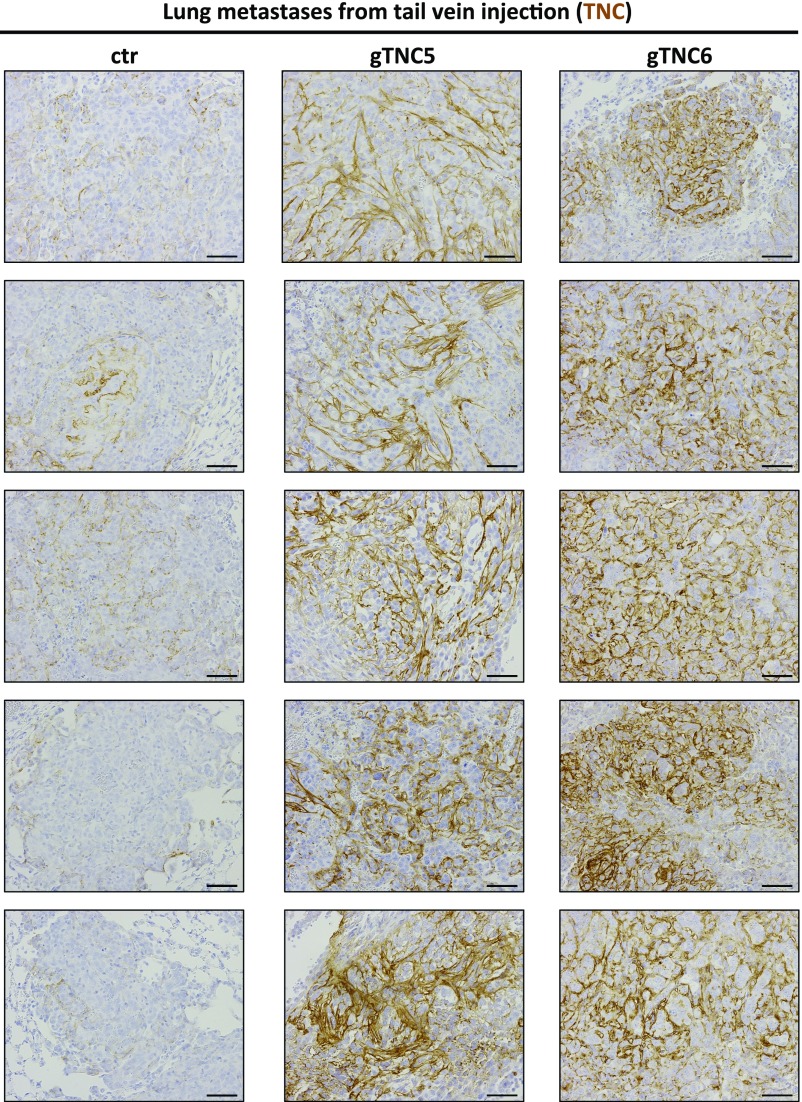
Overexpression of Tnc in lung adenocarcinoma cells promotes metastasis in vivo. (A) Expression of Tnc mRNA in 1233 KP cells using the SAM system. (B) Immunofluorescence analysis of Tnc in control KP cells compared with cells overexpressing Tnc. Tnc protein is shown in red; DAPI (blue) staining highlights the nuclei. (C) Experimental schematic: 1233 control or Tnc-overexpressing KP cells were injected s.c. into the flanks of WT C57BL/6J mice. (D) At 4 wk after injections, primary tumors were excised and weighed. (E) The lung metastatic burden was quantified as the ratio of the metastases area/ total lung area and the number below the graph show the number of mice that developed lung metastases. Each dot represents a mouse (n = 5 for each group). Data represent mean ± SEM. *P < 0.05, unpaired t test. (F) Experimental schematic: 1233 control or Tnc-overexpressing KP cells were injected via the lateral tail vein into WT C57BL/6J mice. (G) Representative IHC images of Tnc in the lung metastases. Positive signals are shown in brown; hematoxylin (blue) was used as a counterstain. (H) The area covered by metastases was quantified and divided over total lung area. Data represent mean ± SEM. **P < 0.01.
Fig. S6.
Further analysis of control or Tnc-overexpressing KP cells and implanted tumors. (A) Western blot analysis for TNC expression in 1233 KP control and TNC-overexpressing cell lines. Equal numbers of cells were seeded into six-well plates and grown for 5 d. The supernatant and lysates were then collected. Recombinant TNC was included as a positive control. Actin served as a loading control. (B) Growth curve analysis of control or Tnc-overexpressing 1233 KP cells, used in Fig. 5. (C) Representative images of Tnc IHC in the primary s.c. tumors from Fig. 5 C and D. Positive signals are shown in brown; hematoxylin (blue) was used as a counterstain. (Scale bar: 50 μm.) (D) Representative images of Tnc IHC in the spontaneous lung metastases arising from the primary s.c. tumors. Positive signals are shown in brown; hematoxylin (blue) was used as a counterstain. (Scale bar: 50 μm.)
We next used the Tnc-overexpressing cell lines to test whether increased Tnc levels could promote tumor progression in a mouse model of metastasis that assays for the ability of cells to disseminate to distant organs (Fig. 6_C_). Whereas Tnc overexpression had no effect on primary tumor growth after subcutaneous transplantation (Fig. 6_D_), it had a significant effect on promoting the metastatic colonization of the lungs (Fig. 6_E_). Increased tumor burden in the lungs was observed with both Tnc-specific gRNAs (5- to 35-fold increase), and all inoculated animals developed metastases. TNC staining in the primary tumors and lung metastases was fibrillar (Fig. S6 C and D).
To further investigate the role of Tnc during the metastatic process, we performed tail vein metastasis assays, which test for the ability of tumor cells to extravasate, colonize, and grow in secondary sites (Fig. 6_F_). Tnc overexpression led to high levels of the protein as shown by IHC (Fig. 6_G_ and Fig. S7), along with a significant increase in metastasis to the lungs (Fig. 6_H_). This set of experiments establish a direct role for Tnc in promoting metastasis in lung adenocarcinoma and provide further evidence that the overexpression of Tnc observed in advanced and metastatic tumor cells play an important role in the aggressive phenotype of these tumors.
Fig. S7.
Further analysis of control or Tnc-overexpressing tail vein-injected metastases. Positive signals are shown in brown; hematoxylin (blue) was used as a counterstain. (Scale bar: 50 μm.)
Gene Expression of Specific Matrisome Factors Is Associated with Poor Prognosis for Lung Adenocarcinoma Patients.
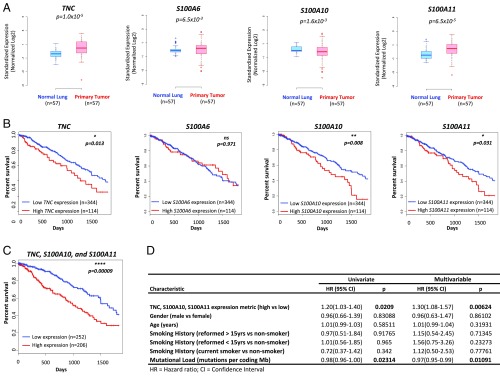
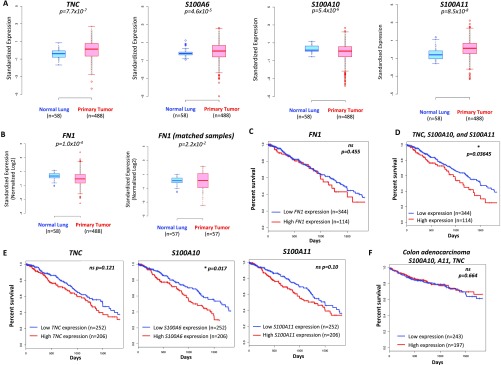
We next addressed how the findings from the mouse models relate to human lung cancer. We first investigated whether similar changes in the expression levels of TNC, as well as the other four factors identified and validated through our analysis, were found in patients with lung adenocarcinoma. To this end, we analyzed RNA-seq gene expression profiles of primary tumors, matched normal samples, and relevant clinical data obtained from The Cancer Genome Atlas (TCGA) lung adenocarcinoma (LUAD) cohort. TNC levels were significantly higher in tumors compared with normal lungs across the entire dataset as well as in matched tumors compared with normal tissue from the same patient (Fig. 7_A_ and Fig. S8_A_). Similarly, expression of S100A6 and S100A11, two other factors found to be increased in the KP mouse model, was also significantly higher (Fig. 7_A_ and Fig. S8_A_). In contrast, expression of S100A10 was significantly lower in matched tumor samples compared with normal lungs. FN1 expression was lower across the entire dataset, although matched tissues from the same patient exhibited a significant up-regulation (Fig. S8_A_).
Fig. 7.
Prognostic value of matrisome factors within the LUAD patient cohort. (A) Gene expression values (RNA-seq normalized counts standardized for mean = 0, SD = 1) for a subset of the validated matrisome factors in matched normal lung tissue and primary lung tumors of patients with lung adenocarcinoma (n = 57). Two-sided P values (Kolmogorov–Smirnov test) are shown. (B) Kaplan–Meier 5-y survival analysis comparing patients in the top 25th percentile of expression for each gene (n = 114; red) and those in the bottom 75th percentile (n = 344; blue). Log-rank test P values are shown. (C) Kaplan-Meier 5-y survival analysis in TCGA LUAD using an expression metric to quantify the combined expression levels of S100A10, S100A11, and TNC (three-gene signature). Specifically, the geometric mean of the expression levels was used to score and rank patients. Shown are the top 45% scoring patients (n = 206) vs. the rest (n = 252). Log-rank test P value is shown (median survival, 1,043 d for the high-scoring patient subpopulation and 1,725 d for the remainder of the cohort). (D) Results of univariate and multivariable Cox proportional hazards model on overall survival in the LUAD cohort (all patients). Increasing three-gene signature score shows a significant association with poorer survival after controlling for other characteristics.
Fig. S8.
Prognostic value of matrisome factors within the TCGA LUAD cohort. (A) Expression of TNC, S100A6, S100A10 and S100A11 in normal lung tissue (n = 58) and primary lung adenocarcinomas (n = 488) within the TCGA lung adenocarcinoma cohort. Two-sided P values (Kolmogorov–Smirnov test) are shown. (B) Expression of FN1 in normal lung and primary lung tumors across the entire lung adenocarcinoma cohort in the TCGA cohort (Left) or in matched tissue from the same patient (n = 57; Right). Two-sided P values (Kolmogorov–Smirnov test) are shown. (C) Kaplan–Meier 5-y survival analysis comparing patients with lung adenocarcinoma in the top 25th percentile of FN1 expression (n = 114, shown in red) and those in the bottom 75th percentile (n = 344; blue). Log-rank test P values are shown. (D) Kaplan–Meier 5-y survival analysis in the TCGA LUAD cohort using an expression metric to quantify the combined expression levels of S100A10, S100A11, and TNC (three-gene signature). Specifically, the geometric mean of the expression levels was used to score and rank patients. Shown are the top 25% scoring patients (n = 114) vs. the rest (n = 344). Log-rank test P values are shown. (E) Kaplan–Meier 5-y survival analysis comparing patients with lung adenocarcinoma in the top 45th percentile of TNC, S100A10, or S100A11 expression (n = 206; in red) and those in the bottom 55th percentile (n = 252; blue). Log-rank test P values are shown. (F) Kaplan–Meier 5-y survival analysis comparing patients with colon adenocarcinoma in the top 45th percentile of the three-gene signature score (TNC, S100A10, and S100A11 expression) (n = 197; red) and those in to the bottom 55th percentile (n = 243; blue). Log-rank test P values are shown.
We next explored whether the increased levels of any of these factors carries prognostic information. Kaplan–Meier 5-y survival analyses revealed a significantly poorer prognosis in patients with high TNC expression (top 25%) compared with those with low TNC expression (Fig. 7_B_). Similarly, high expression of S100A10 and S100A11 were correlated with significantly poorer patient prognosis, whereas high expression of S100A6 or FN1 did not (Fig. 7_B_ and Fig. S8_C_). We next investigated whether a combined metric based on the expression values of the three genes, for which high expression is correlated with poorer prognosis, would have prognostic value. We used the geometric mean of the expression values of TNC, S100A10, and S100A11 (three-gene signature) to score and rank patients. Higher signature scores were indeed significantly associated with worse patient outcome (Fig. 7_C_ and Fig. S8_D_) and exhibited stronger statistical significance (P = 0.00009) than either of the Kaplan-Meier analyses based on expression of individual genes (Fig. 7_B_ and Fig. S8_E_). Interestingly, there was no association between the three-gene signature and survival in patients with colorectal cancer, suggesting potential organ and tumor-specific differences in ECM composition and function (Fig. S8_F_).
To further evaluate the prognostic value of the three-gene signature in predicting patient survival, in the context of other clinical covariates, we used the Cox proportional hazards model to perform univariate and multivariable survival analyses on the TCGA lung adenocarcinoma patient cohort (Fig. 7_D_). Univariate analysis indicated that an increasing three-gene signature score was significantly associated with poor patient survival (P = 0.0209). Multivariable analysis, controlling for other covariates (age, sex, smoking history, and mutational load), also showed a significant correlation between the three-gene signature and worse survival (hazard ratio, 1.30; P = 0.00624). Taken together, our findings provide important information for the prognosis of patients with lung adenocarcinoma, and suggest that this TNC expression-based gene signature could serve as a useful biomarker.
Discussion
Although previous studies have examined the changes in individual components of the ECM in lung cancer and fibrosis, a comprehensive approach to characterizing the composition of the ECM in these disease states has been lacking. In the present study, we used quantitative proteomics to characterize the global changes in ECM protein abundance that occur in fibrosis and during lung cancer development. This analysis was performed in the context of well-established mouse models that recapitulate the complexity of the in situ changes that accompany fibrosis and cancer progression. We compared the ECM changes that occur during tumorigenesis with those that occur in a mouse model of pulmonary fibrosis to delineate the similarities and differences between these conditions.
Changes in ECM in Lung Fibrosis.
Two recent studies have used proteomics to report changes occurring in bleomycin-induced fibrosis (22, 23). Along with some overlapping findings, our study of the insoluble ECM has uncovered and quantified additional proteins. This can be attributed in part to our use of different proteomics technologies. Collectively, those studies, together with our study, provide a more complete understanding of the ECM changes that occur in this model, and the findings possibly could lead to the identification of novel antifibrotic agents and strategies.
We identified and validated two ECM proteins, Fn and Tnc, as highly abundant in fibrosis. These findings are consistent with previous reports in which both proteins were found to be up-regulated in mouse and rat models of bleomycin-induced pulmonary fibrosis (22–24). Schiller et al. (23) showed that Tnc is increased at both the protein and mRNA levels in the lungs of mice treated with bleomycin, and demonstrated that higher Tnc expression is associated with stiffer lung tissue, a feature of fibrosis. Furthermore, Tnc not only is a marker of pulmonary fibrosis, but also has been implicated in the pathogenesis of the disease. _Tnc_-knockout animals are protected against bleomycin-induced fibrosis and have lower accumulation of collagen, reduced fibroblast infiltration, and reduced activity of TGF-β in the lungs (18). Importantly, patients with pulmonary fibrosis show increased levels of Tnc, suggesting that the role of Tnc in pulmonary fibrosis is not limited to animal models of the disease (25, 26). Whether Tnc contributes to the development and severity of the disease in humans, and what factors cause its up-regulation in that setting, remain open questions.
ECM Changes in Cancer.
Through delineating the changes that occur during pulmonary fibrosis and cancer progression, we have identified unique protein signatures that independently set apart each condition. Because changes in the composition of the ECM can have a regulatory role during cancer development and metastasis formation, we compared primary tumors and metastases both to normal lung and to each other. Although many factors were significantly altered in the tumorigenic state compared with healthy tissue, there were few statistically significant differences in ECM between the primary lesions and their associated lymph node metastases. Thus, the ECM at these local metastases closely resembled that of the primary tumors.
Interestingly of the 20 proteins that we found in higher abundance in the ECM signature of KP lung tumors (compared with normal lung), nine (Col12a1, Col14a1, Col18a1, Col8a1, Fbln2, Fn1, Ltbp2, Nid1, and Tnc) were encoded by genes that are part of the AngioMatrix signature, an ensemble of matrisome genes whose up-regulation at the mRNA has been associated with the induction of angiogenesis in the RIP1-Tag2 mouse model of pancreatic neuroendocrine cancer (27). Tnc was identified as an important component of the AngioMatrix in driving the angiogenesis in the neuroendocrine tumor model; the AngioMatrix also has negative predictive value in patients with glioma and colorectal carcinoma (27). The partial overlap between the lung tumor matrisome factors we have identified and the AngioMatrix raises the possibility of an angiogenic component to our ECM signature in lung tumors, which warrants further investigation.
Role of S100 Proteins in Lung Adenocarcinoma.
In our present analysis, three members of the S100 protein family—S100A6, S100A10, and S100A11—were detected in significantly higher abundance in the ECM of primary lung tumors and associated metastases. S100 proteins are regulated by binding of calcium ions, which allows them to act as calcium sensors and thus translate fluctuations in intracellular calcium levels into the appropriate cellular responses (28). The S100 proteins can act as extracellular factors as well. This family of proteins comprises 21 members, each with distinct functional properties. Although their precise roles are not well understood, multiple S100 family members exhibit deregulated expression in various cancer types.
Our analysis of patient data revealed that some of the S100 factors that we have identified in this study are highly expressed in lung adenocarcinoma tissue, and that this higher expression is correlated with poor patient prognosis. Several other studies have reported similar observations, supporting the idea that our findings may be clinically relevant (29–31). S100A10 expression has been significantly correlated with higher TNM stage, more frequent vascular invasion, and a poorer overall prognosis (30). Similarly, in a study of S100A11 expression in 179 tumor samples from patients with lung adenocarcinoma, Woo et al. (31) found significantly higher S100A11 levels in adenocarcinomas with KRAS mutations, as well as in poorly differentiated tumors. Moreover, strong S100A11 expression was correlated with shorter disease-free survival. Those results suggest that this protein might be involved in the tumorigenic process specifically in _KRAS_-mutant lung adenocarcinomas, the subset of human tumors that the KP model is designed to represent. Previous work using RNAi to knock down S100A11 has established that this factor promotes proliferation of human lung adenocarcinoma cell lines in vitro and s.c. growth in vivo using xenografts (32). Moreover, several studies also have suggested that this protein contributes to metastasis and invasion, and in fact up-regulation of S100A11 in patients with non–small-cell lung cancer is significantly associated with the presence of lymph node metastasis (33). Although the precise biological role of S100A11 in cancer remains unclear, the autochthonous KP model of lung adenocarcinoma represents an ideal setting for studying whether S100A11 has a functional role in the pathogenesis of lung cancer.
Role of Tnc in Tumorigenesis.
Along with the S100 proteins, we also identified up-regulation of Tnc in high-grade KP tumors and metastases. In the developing embryo, Tnc expression is restricted to areas of active migration and epithelial-to-mesenchymal transition, whereas after birth its levels are down-regulated in all tissues (34). However, in adults, Tnc expression is increased at sites of inflammation and wound healing, as well as in cancers. Numerous clinical reports have shown up-regulation of Tnc in patients with diverse cancer types. Consistent with our results, high Tnc expression also has been observed in patients with lung cancer (35).
Whereas the roles of Tnc in tumor cell lines have been studied extensively, the results have led to sometimes conflicting findings, and relatively few studies have used mouse cancer models. To better understand the contribution of Tnc to breast cancer, Talts et al. (36) crossed _Tnc_-knockout mice to the MMTV-PyMT model, and reported that a lack of Tnc had no effect on primary tumor growth or metastatic dissemination to the lungs. Similarly, knockdown of Tnc in a human breast cancer cell line implanted into the mammary fat pad of immunodeficient mice had no effect on primary tumor growth, but did reduce metastasis to the lungs (37). In this context, tumor-derived Tnc has been found to promote the outgrowth of pulmonary lesions by enhancing Wnt and Notch signaling, thereby promoting the viability of cancer cells. Similar results were reported in a mouse model of pancreatic neuroendocrine cancer, in which Tnc was found to promote tumorigenesis and lung metastasis (38). These differing effects of Tnc on cancer may reflect the tumor type-specific or oncogene-specific roles of Tnc in cancer progression.
Here, using the CRISPR/Cas9 SAM system to overexpress Tnc from its endogenous promoter in tumor cells, we have shown that Tnc can promote the spread of lung adenocarcinoma cells without affecting primary tumor growth. Previous studies have identified cancer-associated fibroblasts as a major source of Tnc in tumors (39), but whether stroma-derived Tnc has a role in tumor progression in this model is unclear. Although the precise mechanism of action remains to be elucidated, we have shown that Tnc is a target of the transcription factor Nkx2-1, which has been shown to suppress lung cancer progression and metastasis through the suppression of embryonic genes (19). Thus, Nkx2-1 appears to exert its effects through various factors, including the ECM protein Tnc. Whereas the effect of Nkx2-1 on Tnc is likely direct, this possibility requires further investigation using promoter luciferase assays. Whether the same relationship is true in humans remains to be proven, although it is likely, given that the human and mouse Nkx2-1 proteins share 98% identity, and that two of the Nkx2-1 binding sites that we identified in the murine Tnc promoter are conserved in the human Tnc promoter (peak 2, 75% identify; peak 3, 80% identify). Moreover, Tnc might not be the sole ECM factor regulated by Nkx2-1; analysis of existing Nkx2-1 ChIP-Seq data (20) identified potential Nkx2-1 binding sites within 4 kb of the transcriptional start sites of 14 of the 36 matrisomal proteins detected in differential abundance in KP lung tumors (Agrn, Col12a1, Col16a1, Ctsd, Fbln5, Hspg2, Lgals3, Ltbp2, Nid1, Nid2, Npnt, S100a11, Sftpb, Sftpd, Tnc). Further work is needed to confirm whether these genes are also transcriptionally regulated by Nkx2-1, and whether they affect metastasis.
Because Tnc expression is absent in normal adult tissues but highly up-regulated in many solid cancers, it represents an ideal diagnostic marker and therapeutic target in cancers (40). In several compounds currently in clinical trials, antibodies against Tnc have been conjugated to either radioactive compounds that can inhibit tumor growth or IL-2, aimed at improving the efficacy of chemotherapy. Another area showing promise is the development of therapeutic or preventive cancer vaccines in which Tnc could be targeted alone or in combination with other factors (41).
Materials and Methods
Mouse Strains and Treatments.
The Massachusetts Institute of Technology’s Institutional Animal Care and Use Committee approved all animal studies and procedures. C57BL/6J mice were purchased from Jackson Laboratories. To induce pulmonary fibrosis, 6- to 8-wk-old C57BL/6 mice were treated with a single dose of 0.035 U of bleomycin sulfate (Selleck Chemicals; S1214) or PBS intratracheally. The mice were killed 2 wk later, and the lungs were harvested. For the lung tumor model, we used KP mice, in which tumor development was initiated by intratracheal infection with Cre-expressing adenoviruses (University of Iowa Gene Transfer Core). Primary tumors and associated metastases to the mediastinal lymph nodes were harvested from the same mouse. One-half of the lung tissues and one-half of the tumors were flash-frozen and stored at −80 °C before MS analysis; the other halves were fixed in 4% zinc formalin overnight and then embedded in paraffin. Primary tumors were graded by a pathologist (R. Bronson) following established criteria (42), and only advanced (grades 3 and 4) tumors were used for the analysis. For the transplantation studies, 105 KP tumor cells (1233 line) (43) were injected via the lateral tail vein into mice or 5 × 10⁵ KP tumor cells were injected s.c.
Tissue Decellularization and ECM Protein Enrichment.
Decellularization of samples ranging from 50 to 100 mg was performed using the CNMCS compartmental protein extraction kit (EMD Millipore), as described previously (9, 13). In brief, frozen samples were homogenized with a Bullet Blender (Next Advance) according to the manufacturer’s instructions and then incubated in a series of buffers to remove, sequentially, cytosolic proteins, nuclear proteins, membrane proteins, and cytoskeletal proteins. The remaining insoluble pellet is enriched for ECM proteins. Three independent samples of each tissue type—normal lung, fibrotic lung, advanced stage lung adenocarcinoma, and derived lymph-node metastasis—were processed. The effectiveness of the decellularization and concomitant ECM protein enrichment was monitored by immunoblotting using the following antibodies: GAPDH (EMD Millipore; MAB374), pan-histones (Upstate Biotechnology; 05-858), collagen I (EMD Millipore; AB765P), collagen IV (Abcam; ab6586), actin (clone 14-1, generated by the R.O.H. laboratory), and Fn (rabbit 297-1, generated by the R.O.H. laboratory).
MS Analysis.
The procedure for digesting proteins into peptides and proteomic analysis are descriced in detail in SI Materials and Methods. The raw MS data have been deposited at the ProteomeXchange Consortium via the PRIDE partner repository (dataset identifier PXD003517).
IHC.
Mice were killed by CO2 asphyxiation, and lungs were inflated with 10% zinc/formalin (Polysciences), fixed overnight in zinc/formalin at room temperature, and then transferred to 70% ethanol and embedded in paraffin. Masson's trichrome staining was performed following standard procedures. IHC was performed on 5-μm-thick sections using the ABC Vectastain Kit (Vector Laboratories) with antibodies to Tnc (1:400; EMD Millipore; AB19011), Nkx2-1 (1:400; Abcam, ab76013), S100A6 (1:500, Abcam ab181975), S100A10 (1:100, Abcam, ab76472), S100A11 (1:300, Abcam; ab180593), and Fn (1:500; Abcam; ab2413). The staining was visualized with DAB (Vector Laboratories; SK-4100), and the slides were counterstained with hematoxylin. Table S1 shows the number of samples (each sample is an individual mouse) that were stained.
Table S1.
| Sample type | S100A6 | S100A10 | S100A11 | Fn1 | Tnc |
|---|---|---|---|---|---|
| Normal lung | 3 mice | 4 mice | 4 mice | 5 mice | 10 mice |
| Fibrotic lung | 3 mice | 3 mice | 3 mice | 3 mice | 3 mice |
| KP lung | 10 mice | 9 mice | 8 mice | 7 mice | >10 mice |
CRISPR Activation.
Nonclonal 1233 KP cells (43) stably expressing dCas9-VP64-Blast (Addgene; 61425) and MS2-P65-HSF1-Hygro (Addgene; 61426) were generated via sequential lentiviral transduction and selection with blasticidin and hygromicin, respectively. To overexpress Tnc, we designed and cloned five independent gRNA sequences targeting the Tnc promoter into a lentiviral vector (Lenti-sgRNA-MS2-Zeocin; Addgene; 61427) and subsequently transduced and zeocin-selected the aforementioned cell lines to generate KP cell lines stably expressing all three components. The target gRNA sequences were designed using the SAM algorithm (sam.genome-engineering.org/database/); PAM sites are in bold: gTNC4 CCGTTAGCTGGCGGCGCGCCTGG, gTNC5 CACAGCCCTCCCAGCGGAACAGG, gTNC6 ATGAAAGACGCACTCACTCCAGG, gTNC7 AACTACTCTGCGGGGGCGGAGGG, and gTNC8 TTTTTCAGTTGGTGAGTTAAAGG. For analysis of the population doublings, the cells were grown under standard tissue culture condition, and the number of cells for each sample was counted every 2 d (in triplicate for each condition).
Clinical Data Analyses.
RNA-seq gene expression profiles of primary tumors, matched normal samples, and relevant clinical data of 488 patients with lung adenocarcinoma with primary tumor samples were obtained from TCGA (https://cancergenome.nih.gov/). Details of the bioinformatics analyses are provided in SI Materials and Methods.
SI Materials and Methods
Protein Digestion into Peptides.
ECM-enriched samples were solubilized and reduced in a solution containing 8 M urea and 10 mM DTT. The samples were alkylated with 25 mM iodoacetamide (Sigma-Aldrich), deglycosylated with PNGaseF (New England BioLabs), and digested with endopeptidase Lys-C (Wako) and trypsin (Promega) as described previously (9, 13). The peptide solution was desalted, and the peptide concentration was determined by measuring the absorbance of the peptide solution at 280 nm using a NanoDrop spectrophotometer.
Peptide Labeling, Fractionation, and Analysis by MS.
Peptide labeling with TMT 10-plex reagents (Thermo Fisher Scientific) was performed according to the manufacturer’s instructions. Lyophilized samples were dissolved in 70 μL of ethanol and 30 μL of 500 mM triethylammonium bicarbonate, pH 8.5, and the TMT reagent was dissolved in 30 μL of anhydrous acetonitrile. The solution containing peptides and TMT reagent was vortexed and then incubated at room temperature for 1 h. Samples labeled with the 10 different isotopic TMT reagents were combined and concentrated to completion in a vacuum centrifuge.
Samples were labeled with the following tags: 126, pool of three normal lung samples; 127N, fibrotic lung#1; 127C, fibrotic lung#2; 128N, fibrotic lung#3; 128C, lung tumor#1; 129N, lung tumor#2; 129C, lung tumor# 3; 130N, metastasis#1; 130C, metastasis#2; and 131, metastasis#3 (Dataset S2_A_).
Peptide Fractionation by Isoelectric Focusing.
TMT-labeled peptides were fractioned into five fractions using the ZOOM isoelectric fractionation (IEF) fractionator (Invitrogen) with a set of six ZOOM disks (pH 3.0, 4.6, 5.4, 6.2, 7.0, and 10). The anode buffer (7 M urea, 2 M thiourea, and Novex IEF anode buffer, pH 3.0) and the cathode buffer (7 M urea, 2 M thiourea, and Novex IEF cathode buffer, pH 10.4) were generated in accordance with the manufacturer's instructions. The TMT-labeled sample was dissolved in 400 μL 100 mM Tris and 100 mM NaCl, pH 7.4, after which MilliQ water was added to a final volume of 3.35 mL. ZOOM carrier ampholytes were added to the diluted sample at 1:100 dilution, and DTT was added to a final concentration of 20 mM. Fractionation was performed using the following conditions: 2 mA current limit, 2W power limit, with 100V for 20 min, 200V for 80 min, and 600V for 80 min. Following fractionation, each chamber was rinsed with 500 μL of water, and the wash was added to the appropriate fraction. Each fraction was acidified with formic acid and desalted using Sep-Pak C18 Plus Light Cartridges (Waters). Peptides were eluted using 90% acetronitrile in 0.1% acetic acid, and the samples were reduced in volume to near dryness in a Savant SpeedVac concentrator (Thermo Fisher Scientific). Each fraction was resuspended in 100 μL of 0.1% formic acid, diluted 1:20 with 0.1% formic acid, and then 4 μL was analyzed via LC-MS/MS.
LC-MS/MS Analysis.
The parameters for the full-scan MS were a resolution of 70,000 across 350–2,000 m/z, an automatic gain control target of 3e6, and a maximum injection time of 50 ms. The full MS scan was followed by MS/MS for the top-10 precursor ions in each cycle with a normalized collision energy of 32 and dynamic exclusion of 30 s. Raw mass spectral data files (.raw) were searched using Proteome Discoverer (Thermo Fisher Scientific) and Mascot version 2.4.1 (Matrix Science) using the SwissProt Mus musculus database containing 16,678 entries. Mascot search parameters were 10 ppm mass tolerance for precursor ions, 0.8 Da for fragment ion mass tolerance, and two missed cleavages of trypsin. Fixed modifications were carbamidomethylation of cysteine and TMT 10-plex modification of lysines and peptide N termini. Variable modifications were oxidation of methionine, deamidation of asparagine, pyroglutamic acid modification at N-terminal glutamine, and hydroxylation of proline and lysine. Only peptides with a Mascot score ≥25 and an isolation interference ≤30 were included in the quantitative data analysis. The average false-discovery rate was 0.0054 (range, 0.0015–0.0132). TMT quantification was obtained using Proteome Discoverer and isotopically corrected according to the manufacturer’s instructions, and the values were normalized to the median of each channel. Proteins were annotated as being ECM-derived or not, as described previously (9, 15). Initially each fraction was analyzed twice (replicates 1 and 2), as described above, and an exclusion list was generated using the data from these analyses. A list of 2,332 unique peptides was constructed using the following criteria: all identified peptides from collagen alpha-1(I) chain (UniProt P11087), collagen alpha-1(III) chain (UniProt P08121), collagen alpha-2(IV) chain (UniProt P08122), and collagen alpha-2(I) chain (UniProt Q01149); all identified peptides from vimentin (UniProt P20152), myosin-9 (UniProt Q8VDD5), and filamin-A (UniProt Q8BTM8); and all peptides that were identified five or more times. The peptide mass, charge, and average elution time (with a 15-min window) were used to generate the exclusion list. Each fraction was then analyzed two more times (replicates 3 and 4) using the exclusion list. The data from all four technical replicates of each fraction were combined for the data analysis. The raw MS data have been deposited to the ProteomeXchange Consortium via the PRIDE partner repository (dataset identifier PXD003517).
Statistical Analysis of Proteomics Data.
Median-centered reporter ion intensities (log10) were plotted pairwise to assess reproducibility between biological replicates within each condition, and the coefficient of determination, _R_2, was calculated for each comparison. Median-centered TMT ratios were log2-transformed, and fold change values were derived for pairwise comparisons between conditions. Two-sided P values to assess differential representation between conditions were computed using Student’s t test, and the false-discovery rate (FDR) was controlled using the Benjamini–Hochberg (BH) procedure. The significance of differential representation compared with the normal sample or a reference sample was assessed using a two-sided single-sample t test, with the value of the normal sample or of the reference sample as the true value of the mean. All statistical analyses were conducted in R (www.r-project.org/).
ChIP-qPCR.
Adherent Tmet cells (393T5) (19) overexpressing Nkx2-1 were washed once in PBS and then cross-linked in 1% formaldehyde diluted in PBS for 10 min at room temperature. The reaction was stopped by the addition of 100 mM glycine, followed by 5 mg/mL BSA in PBS and then two washing in cold PBS. Cells were harvested and resuspended in lysis buffer [50 mM Tris⋅HCl, pH 8.1, 10 mM EDTA, 1% SDS, 1× Complete Protease Inhibitor (Roche)], and then sonicated with a Diagenode Bioruptor to obtain a fragment size of 300–500 bp. Fragmented chromatin was diluted in IP buffer (20 mM Tris⋅HCl, pH 8.1, 150 mM NaCl, 2 mM EDTA, and 1% Triton X-100) and incubated overnight at 4 °C with Protein G magnetic beads (Dynabeads; Invitrogen) that had been preincubated with antibody against Nkx2-1 (Bethyl; A300-BL4000) or isotype controls (rabbit IgG; Abcam). Immunoprecipitates were washed six times with wash buffer (50 mM Hepes, pH 7.6, 0.5 M LiCl, 1 mM EDTA, 0.7% Na deoxycholate, and 1% Nonidet P-40) and twice with TE buffer. Immunoprecipitated (or no IP input) DNA was recovered in 100 μL of 1× Elution Buffer (1% SDS and 0.1 M NaHCO3) over 6 h at 65 °C, and then column-purified with QiaQuick columns (Qiagen). qRT-PCR was performed using Fast SYBR Green Master Mix on a StepOne Plus Real Time PCR system (Applied Biosystems). The following qPCR primers were used for the ChIP-qPCR analysis: CD8: F, GGGCACTGCTAAACTCTTGC; R, GATGTGGGAGACTGGAGGAA; SftpA: F, TTGCCTTCTGTGGTTCTGTG; R, TACACAGCTCAGGTTCCTTCAG; TNC-peak1: F, GGCTGGGTTTGTATGCATTT; R, CCCAATAAGAAGCCTCACCA; TNC-peak2: F, TTGGCTTTAAAAATAGCCTTCTCCA; R, TTCCTAATGTGTAGTCTGTGGCA; TNC-peak3: F, TCAAGAATTGTAGAAAGCTCTTAGC; R, CCATTAATGCTTAACTTGAGTCCAT; and TNC-peak4: F, TCATCGGGTCAGCCTTCTAAC; R, TTCGGATCTGAGCACTTAGGG.
RNA Isolation and qRT-PCR.
The following cell lines were used for qRT-PCR analysis: Tnonmet 393T4, 802T4, and 368T1; Tmet, 373T1, 393T3, 393T5, and 482T1; Met, 482M1, 482N1, 238N1, 373N1, 393N1, and 393M1 (19); and KP, 1233 (43). RNA was isolated with the RNeasy Mini Kit (Qiagen), reverse-transcribed using the High-Capacity cDNA Reverse Transcription Kit (Applied Biosystems), and used for qRT-PCR with KAPA SYBR Fast Master Mix (Kapa Biosystems; KK4604). The following primers were used: GAPDH: F, AGCTTGTCATCAACGGGAAG; R, TTTGATGTTAGTGGGGTCTCG; TNC: F, CCATCAGTACCACGGCTACC; R, CCCTTCATCAGCAGTCCAGG; and Nkx2-1: F, GCTGTCCTGCTGCAGTTGTTG; R, AGCTCGAGCGACGTTTCAAG. Expression levels were calculated relative to GAPDH and normalized to control samples.
Immunofluorescence Analysis.
For immunofluorescence analysis, 0.4 × 10⁵ cells were seeded on round coverslips placed in 12-well plates. The next day, the cells were fixed with acetone and methanol (1:1 mixture) for 10 min at −20 °C, then washed extensively in 1× PBS. Cells were blocked with blocking reagent (PerkinElmer; FP1012) for 1 h at room temperature, then incubated overnight at 4 °C with an anti-Tnc antibody (1:100; Millipore), followed by 1-h incubation at room temperature with Alexa dye-tagged secondary antibodies (Life Technologies). DAPI (1:2,500; Invitrogen) was used to label the nuclei. Slides were mounted in ProLong Gold Mounting Medium (Invitrogen). Images were visualized under a Nikon microscope.
ICA.
For the analysis of MS data generated in this study and the comparative analysis with the TCGA dataset, an unsupervised blind-source separation strategy using ICA was applied to elucidate statistically independent protein representation or gene expression signatures (44, 45). ICA is a general-purpose signal processing and multivariate data analysis technique in the category of unsupervised matrix factorization methods. Based on input data consisting of a genes-samples matrix, ICA uses higher-order moments to characterize the dataset as a linear combination of statistically independent latent variables. These latent variables represent independent components based on maximizing non-Gaussianity, and can be interpreted as independent source signals that have been mixed together to form the dataset under consideration. Each component includes a weight assignment to each gene that quantifies its contribution to that component. In addition, ICA derives a mixing matrix that describes the contribution of each sample to the signal embodied in each component. This mixing matrix can be used to select signatures among components with distinct gene expression profiles across the set of samples. For subpopulation identification in the TCGA LUAD expression dataset, the procedure was implemented using gene expression levels of the genes of interest across all patients. All computations were done in R. The R implementation of the core JADE (joint approximate diagonalization of eigenmatrices) algorithm was used, along with other packages and custom R utilities (46–48). Heat maps were generated using the Heatplus package in R.
Analysis of Tnc Expression by Immunoblotting.
For the analysis of Tnc expression, 1233 control or Tnc-overexpressing cells were seeded at 0.15 × 10⁶ cells per well in a six-well plate in equal volumes of DMEM (HyClone) supplemented with 10% FBS. The cells were allowed to grow until confluence (∼3 d), and were maintained for another 2 d to allow for ECM deposition. At 5 d postseeding, the cell supernatant was collected, and the cells were harvested and lysed in equal volumes of 2× Laemmli buffer containing 100 mM DTT. Equal volumes of the cell supernatant and equal volumes of cell lysates were loaded on 4–20% SDS/polyacrylamide gradient gel (Thermo Fisher Scientific). Recombinant full-length human Tnc (Sigma-Aldrich; CC065) served as a positive control. Proteins were separated by SDS/PAGE and then transferred onto a nitrocellulose membrane (Millipore). The membranes were incubated with the following primary antibodies, each diluted in 5% (wt/vol) nonfat dry milk/PBS-T overnight at 4 °C: rabbit anti-actin antibody (generated in the R.O.H. laboratory) and rabbit anti-Tnc antibody (Abcam). After primary antibody treatment, the membranes were washed and incubated in the presence of HRP-conjugated goat anti-rabbit secondary antibody (Jackson ImmunoResearch). The membranes were washed and treated with Western Lightning Plus-ECL Chemiluminescence Reagent (PerkinElmer).
Clinical Data Analyses.
RNA-seq gene expression profiles of primary tumors, matched normal samples, and relevant clinical data of 488 patients with lung adenocarcinoma and 440 patients with colon adenocarcinoma were obtained from TCGA (https://cancergenome.nih.gov/). Single gene expression values were standardized (z-scores) to compare expression levels between normal and tumor samples. Significance was assessed using the Kolmogorov–Smirnov test. Kaplan–Meier survival analyses were conducted to compare patients with high gene expression (top 25th or 45th percentile) and those in the remainder of the cohort; details are provided in the figure legends).
For the three-gene signature, the geometric mean of the expression levels of TNC, S100A10, and S100A11 was used to score and rank patients. Kaplan–Meier survival analysis was conducted to compare patients with a high three-gene signature score (top 45%) with the remainder of the cohort. Significance was assessed using the log-rank test. Cox proportional hazards analysis was conducted across all patients in the TCGA LUAD cohort to assess the prognostic significance of the three-gene signature while controlling for various clinical covariates. All survival analyses were conducted in R (www.r-project.org) using the survival package.
Hazard Ratio Estimation.
The Cox proportional hazards model was used to analyze the impact of various covariates on survival time across all patients within the TCGA LUAD cohort. All analyses were conducted within a 5-y survival time frame. The following characteristics were used: three-gene signature score (expression metric for TNC, S100A10, and S100A11; continuous), sex (male vs. female), age (y, continuous), smoking history (reformed >15 y vs. nonsmoker, reformed <15 y vs. nonsmoker, current smoker vs. nonsmoker), and mutational load (derived as the number of nonsilent mutations per 30 Mb of coding sequence, continuous). Univariate Cox regression analysis for individual characteristics was performed to benchmark single variable hazard ratios. A multivariable model was also implemented to estimate the prognostic value of the three-gene signature while controlling for other patient characteristics (age, sex, smoking history, mutational load). Hazard ratio proportionality assumptions for the Cox regression model were validated by testing for all interactions simultaneously (P = 0.422).
Supplementary Material
Supplementary File
Supplementary File
Supplementary File
Acknowledgments
We thank Nadya Dimitrova for a critical review of the manuscript; the Koch Institute Swanson Biotechnology Center for technical support, specifically Kathleen Cormier at the Hope Babette Tang (1983) Histology Facility; and Roderick Bronson for pathological analysis. This work was supported by the National Cancer Institute’s Tumor Microenvironment Network (Grants U54 CA126515 and U54 CA163109), by the Howard Hughes Medical Institute (at which R.O.H. and T.J. are investigators), the Ludwig Center for Molecular Oncology at MIT, and the National Cancer Institute (Koch Institute Cancer Center Support Grant P30-CA14051). V.G. was supported by a Jane Coffin Childs Memorial Fund Postdoctoral Fellowship. N.J. is supported by a Mazumdar-Shaw International Oncology Fellowship. R.O.H. is a Daniel K. Ludwig Professor for Cancer Research. T.J. is a David H. Koch Professor of Biology and a Daniel K. Ludwig Scholar at MIT.
Footnotes
The authors declare no conflict of interest.
Data deposition: The raw mass spectrometry data have been deposited to the Proteome Xchange Consortium via the PRIDE partner repository (dataset PXD003517).
References
- 1.Quail DF, Joyce JA. Microenvironmental regulation of tumor progression and metastasis. Nat Med. 2013;19:1423–1437. doi: 10.1038/nm.3394. [DOI] [PMC free article] [PubMed] [Google Scholar]
- 2.Pickup MW, Mouw JK, Weaver VM. The extracellular matrix modulates the hallmarks of cancer. EMBO Rep. 2014;15:1243–1253. doi: 10.15252/embr.201439246. [DOI] [PMC free article] [PubMed] [Google Scholar]
- 3.Hynes RO. The extracellular matrix: Not just pretty fibrils. Science. 2009;326:1216–1219. doi: 10.1126/science.1176009. [DOI] [PMC free article] [PubMed] [Google Scholar]
- 4.Lu P, Weaver VM, Werb Z. The extracellular matrix: A dynamic niche in cancer progression. J Cell Biol. 2012;196:395–406. doi: 10.1083/jcb.201102147. [DOI] [PMC free article] [PubMed] [Google Scholar]
- 5.Malik R, Lelkes PI, Cukierman E. Biomechanical and biochemical remodeling of stromal extracellular matrix in cancer. Trends Biotechnol. 2015;33:230–236. doi: 10.1016/j.tibtech.2015.01.004. [DOI] [PMC free article] [PubMed] [Google Scholar]
- 6.American Cancer Society . Cancer Facts & Figures 2016. American Cancer Society; Atlanta, GA: 2016. [Google Scholar]
- 7.Pirinen R, et al. Versican in nonsmall cell lung cancer: Relation to hyaluronan, clinicopathologic factors, and prognosis. Hum Pathol. 2005;36:44–50. doi: 10.1016/j.humpath.2004.10.010. [DOI] [PubMed] [Google Scholar]
- 8.Jackson EL, et al. Analysis of lung tumor initiation and progression using conditional expression of oncogenic K-ras. Genes Dev. 2001;15:3243–3248. doi: 10.1101/gad.943001. [DOI] [PMC free article] [PubMed] [Google Scholar]
- 9.Naba A, et al. The matrisome: In silico definition and in vivo characterization by proteomics of normal and tumor extracellular matrices. Mol Cell Proteomics. 2012;11:M111.014647. doi: 10.1074/mcp.M111.014647. [DOI] [PMC free article] [PubMed] [Google Scholar]
- 10.Thannickal VJ, et al. Matrix biology of idiopathic pulmonary fibrosis: A workshop report of the National Heart, Lung, and Blood Institute. Am J Pathol. 2014;184:1643–1651. doi: 10.1016/j.ajpath.2014.02.003. [DOI] [PMC free article] [PubMed] [Google Scholar]
- 11.Vancheri C. Idiopathic pulmonary fibrosis and cancer: Do they really look similar? BMC Med. 2015;13:220. doi: 10.1186/s12916-015-0478-1. [DOI] [PMC free article] [PubMed] [Google Scholar]
- 12.Walters DM, Kleeberger SR. Mouse models of bleomycin-induced pulmonary fibrosis. Curr Protoc Pharmacol. 2008;40:5.46.1–5.46.17. doi: 10.1002/0471141755.ph0546s40. [DOI] [PubMed] [Google Scholar]
- 13.Naba A, Clauser KR, Hynes RO. Enrichment of extracellular matrix proteins from tissues and digestion into peptides for mass spectrometry analysis. J Vis Exp. 2015;(101):e53057. doi: 10.3791/53057. [DOI] [PMC free article] [PubMed] [Google Scholar]
- 14.Bakalarski CE, Kirkpatrick DS. A biologist’s field guide to multiplexed quantitative proteomics. Mol Cell Proteomics. 2016;15:1489–1497. doi: 10.1074/mcp.O115.056986. [DOI] [PMC free article] [PubMed] [Google Scholar]
- 15.Naba A, et al. The extracellular matrix: Tools and insights for the “omics” era. Matrix Biol. 2016;49:10–24. doi: 10.1016/j.matbio.2015.06.003. [DOI] [PMC free article] [PubMed] [Google Scholar]
- 16.Schwarzbauer JE, DeSimone DW. Fibronectins, their fibrillogenesis, and in vivo functions. Cold Spring Harb Perspect Biol. 2011;3:a005041. doi: 10.1101/cshperspect.a005041. [DOI] [PMC free article] [PubMed] [Google Scholar]
- 17.Midwood KS, Orend G. The role of tenascin-C in tissue injury and tumorigenesis. J Cell Commun Signal. 2009;3:287–310. doi: 10.1007/s12079-009-0075-1. [DOI] [PMC free article] [PubMed] [Google Scholar]
- 18.Carey WA, Taylor GD, Dean WB, Bristow JD. Tenascin-C deficiency attenuates TGF-ß-mediated fibrosis following murine lung injury. Am J Physiol Lung Cell Mol Physiol. 2010;299:L785–L793. doi: 10.1152/ajplung.00385.2009. [DOI] [PMC free article] [PubMed] [Google Scholar]
- 19.Winslow MM, et al. Suppression of lung adenocarcinoma progression by Nkx2-1. Nature. 2011;473:101–104. doi: 10.1038/nature09881. [DOI] [PMC free article] [PubMed] [Google Scholar]
- 20.Snyder EL, et al. Nkx2-1 represses a latent gastric differentiation program in lung adenocarcinoma. Mol Cell. 2013;50:185–199. doi: 10.1016/j.molcel.2013.02.018. [DOI] [PMC free article] [PubMed] [Google Scholar]
- 21.Konermann S, et al. Genome-scale transcriptional activation by an engineered CRISPR-Cas9 complex. Nature. 2015;517:583–588. doi: 10.1038/nature14136. [DOI] [PMC free article] [PubMed] [Google Scholar]
- 22.Decaris ML, et al. Proteomic analysis of altered extracellular matrix turnover in bleomycin-induced pulmonary fibrosis. Mol Cell Proteomics. 2014;13:1741–1752. doi: 10.1074/mcp.M113.037267. [DOI] [PMC free article] [PubMed] [Google Scholar]
- 23.Schiller HB, et al. Time- and compartment-resolved proteome profiling of the extracellular niche in lung injury and repair. Mol Syst Biol. 2015;11:819. doi: 10.15252/msb.20156123. [DOI] [PMC free article] [PubMed] [Google Scholar]
- 24.Hernnäs J, et al. Alveolar accumulation of fibronectin and hyaluronan precedes bleomycin-induced pulmonary fibrosis in the rat. Eur Respir J. 1992;5:404–410. [PubMed] [Google Scholar]
- 25.Estany S, et al. Lung fibrotic tenascin-C up-regulation is associated with other extracellular matrix proteins and induced by TGFβ1. BMC Pulm Med. 2014;14:120. doi: 10.1186/1471-2466-14-120. [DOI] [PMC free article] [PubMed] [Google Scholar]
- 26.Kuhn C, Mason RJ. Immunolocalization of SPARC, tenascin, and thrombospondin in pulmonary fibrosis. Am J Pathol. 1995;147:1759–1769. [PMC free article] [PubMed] [Google Scholar]
- 27.Langlois B, et al. AngioMatrix, a signature of the tumor angiogenic switch-specific matrisome, correlates with poor prognosis for glioma and colorectal cancer patients. Oncotarget. 2014;5:10529–10545. doi: 10.18632/oncotarget.2470. [DOI] [PMC free article] [PubMed] [Google Scholar]
- 28.Bresnick AR, Weber DJ, Zimmer DB. S100 proteins in cancer. Nat Rev Cancer. 2015;15:96–109. doi: 10.1038/nrc3893. [DOI] [PMC free article] [PubMed] [Google Scholar]
- 29.Ishii A, et al. Increased cytoplasmic S100A6 expression is associated with pulmonary adenocarcinoma progression. Pathol Int. 2009;59:623–630. doi: 10.1111/j.1440-1827.2009.02417.x. [DOI] [PubMed] [Google Scholar]
- 30.Katono K, et al. Clinicopathological significance of S100A10 expression in lung adenocarcinomas. Asian Pac J Cancer Prev. 2016;17:289–294. doi: 10.7314/apjcp.2016.17.1.289. [DOI] [PubMed] [Google Scholar]
- 31.Woo T, et al. Up-regulation of S100A11 in lung adenocarcinoma: Its potential relationship with cancer progression. PLoS One. 2015;10:e0142642. doi: 10.1371/journal.pone.0142642. [DOI] [PMC free article] [PubMed] [Google Scholar]
- 32.Hao J, et al. Selective expression of S100A11 in lung cancer and its role in regulating proliferation of adenocarcinomas cells. Mol Cell Biochem. 2012;359:323–332. doi: 10.1007/s11010-011-1026-8. [DOI] [PubMed] [Google Scholar]
- 33.Tian T, et al. Determination of metastasis-associated proteins in non-small cell lung cancer by comparative proteomic analysis. Cancer Sci. 2007;98:1265–1274. doi: 10.1111/j.1349-7006.2007.00514.x. [DOI] [PMC free article] [PubMed] [Google Scholar]
- 34.Orend G. Potential oncogenic action of tenascin-C in tumorigenesis. Int J Biochem Cell Biol. 2005;37:1066–1083. doi: 10.1016/j.biocel.2004.12.002. [DOI] [PubMed] [Google Scholar]
- 35.Lowy CM, Oskarsson T. Tenascin C in metastasis: A view from the invasive front. Cell Adhes Migr. 2015;9:112–124. doi: 10.1080/19336918.2015.1008331. [DOI] [PMC free article] [PubMed] [Google Scholar]
- 36.Talts JF, Wirl G, Dictor M, Muller WJ, Fässler R. Tenascin-C modulates tumor stroma and monocyte/macrophage recruitment but not tumor growth or metastasis in a mouse strain with spontaneous mammary cancer. J Cell Sci. 1999;112:1855–1864. doi: 10.1242/jcs.112.12.1855. [DOI] [PubMed] [Google Scholar]
- 37.Oskarsson T, et al. Breast cancer cells produce tenascin C as a metastatic niche component to colonize the lungs. Nat Med. 2011;17:867–874. doi: 10.1038/nm.2379. [DOI] [PMC free article] [PubMed] [Google Scholar]
- 38.Saupe F, et al. Tenascin-C down-regulates wnt inhibitor Dickkopf-1, promoting tumorigenesis in a neuroendocrine tumor model. Cell Reports. 2013;5:482–492. doi: 10.1016/j.celrep.2013.09.014. [DOI] [PubMed] [Google Scholar]
- 39.O’Connell JT, et al. VEGF-A and tenascin-C produced by S100A4+ stromal cells are important for metastatic colonization. Proc Natl Acad Sci USA. 2011;108:16002–16007. doi: 10.1073/pnas.1109493108. [DOI] [PMC free article] [PubMed] [Google Scholar]
- 40.Spenlé C, et al. Tenascin-C: Exploitation and collateral damage in cancer management. Cell Adhes Migr. 2015;9:141–153. doi: 10.1080/19336918.2014.1000074. [DOI] [PMC free article] [PubMed] [Google Scholar]
- 41.Midwood KS, Chiquet M, Tucker RP, Orend G. Tenascin-C at a glance. J Cell Sci. 2016;129:4321–4327. doi: 10.1242/jcs.190546. [DOI] [PubMed] [Google Scholar]
- 42.DuPage M, Dooley AL, Jacks T. Conditional mouse lung cancer models using adenoviral or lentiviral delivery of Cre recombinase. Nat Protoc. 2009;4:1064–1072. doi: 10.1038/nprot.2009.95. [DOI] [PMC free article] [PubMed] [Google Scholar]
- 43.Dimitrova N, et al. Stromal expression of miR-143/145 promotes neoangiogenesis in lung cancer development. Cancer Discov. 2016;6:188–201. doi: 10.1158/2159-8290.CD-15-0854. [DOI] [PMC free article] [PubMed] [Google Scholar]
- 44.Hyvärinen A, Oja E. Independent component analysis: Algorithms and applications. Neural Netw. 2000;13:411–430. doi: 10.1016/s0893-6080(00)00026-5. [DOI] [PubMed] [Google Scholar]
- 45.Li CM-C, et al. Foxa2 and Cdx2 cooperate with Nkx2-1 to inhibit lung adenocarcinoma metastasis. Genes Dev. 2015;29:1850–1862. doi: 10.1101/gad.267393.115. [DOI] [PMC free article] [PubMed] [Google Scholar]
- 46.Rutledge DN, Jouan-Rimbaud Bouveresse D. Independent components analysis with the JADE algorithm. TrAC Trends Anal Chem. 2013;50:22–32. [Google Scholar]
- 47.Miettinen J, Nordhausen K, Taskinen S. Blind source separation based on joint diagonalization in R: The packages JADE and BSSasymp. J Stat Softw. 2017 doi: 10.18637/jss.v076.i02. [DOI] [Google Scholar]
- 48.Biton A, et al. Independent component analysis uncovers the landscape of the bladder tumor transcriptome and reveals insights into luminal and basal subtypes. Cell Rep. 2014;9:1235–1245. doi: 10.1016/j.celrep.2014.10.035. [DOI] [PubMed] [Google Scholar]
Associated Data
This section collects any data citations, data availability statements, or supplementary materials included in this article.
Supplementary Materials
Supplementary File
Supplementary File
Supplementary File
