Greater Whole-Grain Intake Is Associated with Lower Risk of Type 2 Diabetes, Cardiovascular Disease, and Weight Gain (original) (raw)
Abstract
Whole-grain and high fiber intakes are routinely recommended for prevention of vascular diseases; however, there are no comprehensive and quantitative assessments of available data in humans. The aim of this study was to systematically examine longitudinal studies investigating whole-grain and fiber intake in relation to risk of type 2 diabetes (T2D), cardiovascular disease (CVD), weight gain, and metabolic risk factors. We identified 45 prospective cohort studies and 21 randomized-controlled trials (RCT) between 1966 and February 2012 by searching the Cumulative Index to Nursing and Allied Health Literature, Cochrane, Elsevier Medical Database, and PubMed. Study characteristics, whole-grain and dietary fiber intakes, and risk estimates were extracted using a standardized protocol. Using random effects models, we found that compared with never/rare consumers of whole grains, those consuming 48–80 g whole grain/d (3–5 serving/d) had an ~26% lower risk of T2D [RR = 0.74 (95% CI: 0.69, 0.80)], ~21% lower risk of CVD [RR = 0.79 (95% CI: 0.74, 0.85)], and consistently less weight gain during 8–13 y (1.27 vs 1.64 kg; P = 0.001). Among RCT, weighted mean differences in post-intervention circulating concentrations of fasting glucose and total and LDL-cholesterol comparing whole-grain intervention groups with controls indicated significantly lower concentrations after whole-grain interventions [differences in fasting glucose: −0.93 mmol/L (95% CI: −1.65, −0.21), total cholesterol: −0.83 mmol/L (−1.24, −0.42); and LDL-cholesterol: −0.72 mmol/L (−1.34, −0.11)]. Findings from this meta-analysis provide evidence to support beneficial effects of whole-grain intake on vascular disease prevention. Potential mechanisms responsible for whole grains' effects on metabolic intermediates require further investigation in large intervention trials.
Introduction
Type 2 diabetes (T2D)10 and cardiovascular disease (CVD) are the most prevalent diseases of our time. Although dietary modification is critical for the prevention of these vascular disorders and related risk factors, including obesity, specific food groups that may be beneficial for vascular health remain to be clarified. Several national and international authorities recommend whole grains for the maintenance of vascular health (1–4). Whole grains are defined as intact, ground, cracked, or flaked fruit of grains in which all components of the kernel, i.e., the bran, germ, and endosperm, are present in the same relative proportions as in the intact grain. Examples of whole grains include whole wheat, dark bread, oats, brown rice, rye, barley, and bulgur. Increased whole-grain intake may lower the risk of weight gain/obesity (5–7), T2D (8–13), and CVD (14–20), although specific bioactive components responsible for whole grains' protective effect remain uncertain (21). Potential biological mechanisms are not fully elucidated but may be linked to improvements in glucose metabolism due to the slower digestion and absorption of whole-grain foods or an increased rate of gastric emptying and enhanced postprandial glucose and insulin response after dietary fiber intake. However, despite the vast literature available concerning whole-grain and fiber intakes in relation to risk of T2D, CVD, and weight gain, no study has comprehensively reviewed and summarized the available research on this topic to inform recommendations and determine the risk-benefit balance.
Therefore, we undertook this systematic review and meta-analysis to comprehensively assess and synthesize findings from: 1) prospective cohort studies investigating the association between both whole-grain and fiber intake and risk of T2D, CVD, and weight gain; and 2) randomized controlled trials (RCT) investigating changes in metabolic intermediates that can be more readily measured in the short duration of randomized settings, including fasting glucose, insulin, total and LDL-cholesterol, blood pressure, and weight gain.
Materials and Methods
Data sources and literature search.
We conducted a comprehensive literature search for: 1) prospective cohort studies examining the association of whole-grain and fiber intakes in relation to T2D, CVD, and weight gain; and 2) RCT investigating metabolic intermediate risk factors for these outcomes, including fasting glucose, insulin, total and LDL-cholesterol, and blood pressure. We searched several databases, including the Cumulative Index to Nursing and Allied Health Literature, Cochrane Central Register of Controlled Trials, Elsevier Medical Database, and MEDLINE. A standard search protocol was followed in all databases. Specifically, we used the keywords whole grain, dietary fiber, diabetes, CVD, weight gain, obesity, insulin, glucose, blood pressure, and cholesterol and restricted the search to articles published in English from 1966 to February 2012. CVD was defined to include stroke, myocardial ischemia, cardiovascular death, atrial fibrillation, coronary heart disease, coronary artery disease, and myocardial infarction. We retrieved additional studies by cross-checking relevant references in articles identified in the initial search.
Study selection.
In our first round of searching, we identified 3642 articles from the Cumulative Index to Nursing and Allied Health Literature, Cochrane Central Registry of Controlled Trials, Elsevier Medical Database, and MEDLINE. After a review of titles and abstracts, we excluded 3520 articles. We reviewed the full text of the remaining 122 articles and after final exclusions, 66 studies were included in the final analysis (Supplemental Fig. 1). Prospective cohort studies included in this study satisfied the following criteria: 1) free-living humans; 2) outcome as T2D, CVD, or weight gain; 3) explicit description of the quantitative methodology used in assessing whole grain and/or dietary fiber intake; 4) effect size measures, including RR, OR, or HR for disease endpoints; and 5) detailed descriptions of multivariable adjustments. Relevant RCT included: 1) interventions including whole grains with detailed descriptions of intake during the intervention period; and 2) mean changes in fasting insulin, fasting glucose, systolic and diastolic blood pressure, total cholesterol, LDL-cholesterol, or weight gain. Studies examining intake from supplements were excluded.
Data extraction and quality assessment.
Three investigators (S.A.C., Q.Y., and M.K.) extracted and tabulated all data for prospective cohort studies and RCT, including lead author, publication year, country of origin, sample size, sex, race, and age of participants. For prospective cohort studies, additional data extracted included date of enrollment, length of follow-up, method of dietary intake assessment, median levels of whole-grain intake in highest and lowest categories, outcome assessment, case ascertainment, adjustment for potential confounders, diagnostic criteria of diabetes [National Diabetes Data group 1979 (22) or WHO 1985 cutpoint ≥7.8 mmol/L (23) vs. American Diabetes Association 1997 (24) or WHO 1999 cutpoint of ≥7.0 mmol/L (25)], total number of cases, RR of event comparing groups with the highest and lowest levels of intake, and CI and P values. For RCT, study design, duration, health status, number of treatment and control groups, post-treatment means in fasting insulin, glucose, total and LDL-cholesterol, systolic and diastolic blood pressure, weight gain, and differences in means between intervention and controls were extracted.
Statistical analysis.
Multivariable-adjusted RR, OR, and HR estimates were pooled via DerSimonian and Laird random effects models (26) to determine summary measures of association from prospective cohort studies. Participants in the highest category of whole-grain and dietary fiber intakes [median whole-grain intake = 44.4 g/d (2.75 serving/d); median fiber intake = 25.4 g/d] were compared with those in the lowest category of intake (rare/never consumers). When estimates were presented based on continuous dietary intake (e.g., increase in risk per g/d), we multiplied the estimate in the log scale by a constant, approximating the difference between the highest and lowest category and exponentiated back to the original scale. For RCT, weighted mean differences between treatment (whole grains) and control (refined or normal diet) groups were combined via random effects models to estimate the size of intervention effects on metabolic intermediates, including fasting glucose, insulin, total and LDL-cholesterol, blood pressure, and weight gain. Randomized trials comparing the effects of specific grains or fibers without a refined or normal diet control were excluded.
To explore potential sources of heterogeneity across studies and examine the impact on final summary estimates, we conducted a series of prespecified subgroup analyses according to sex, study quality, health status, study duration, level of dietary intake, and method of outcome measurement. We also formally tested between-study heterogeneity using the Cochrane's χ2 test (Q test) and the I2 statistic. Publication bias was evaluated using funnel plots in which the RR was plotted on a logarithmic scale against its corresponding SE. The power for formal tests for publication bias was limited due to the small number of studies for each outcome. All statistical analyses were conducted using STATA 12.0 (StataCorp); P < 0.05 was considered significant.
Results
We identified a total of 66 articles that met the inclusion criteria, including 45 prospective cohort studies and 21 RCT (Supplemental Fig. 1). Of the 45 prospective cohort studies, 16 examined the relation between whole-grain intake and risk of T2D and CVD (Tables 1 and 2), 26 examined dietary fiber intake with respect to T2D and CVD risk (Tables 3 and 4), and 5 assessed the relation of whole-grain and fiber intake to weight gain (Supplemental Tables 1 and 2). A total of 21 RCT were identified that examined the effects of a whole-grain intervention on metabolic intermediate endpoints for T2D and CVD (Supplemental Table 3).
TABLE 1.
Characteristics of prospective cohort studies of whole-grain intake and risk of T2D1
| Author (reference) | Sex | Age, y | n | Follow-up, y | Exposure measurement | Exposure categorization | T2D outcome ascertainment | Adjustments |
|---|---|---|---|---|---|---|---|---|
| Meyer (11) | F | 55–69 | 35,988 | 6 | FFQ | Quintiles | Self-report | Age, energy intake, BMI, education, smoking, alcohol, physical activity |
| Liu (10) | F | 38–63 | 75,521 | 10 | FFQ | Quintiles | Self-report | Age, energy intake, BMI, education, smoking, alcohol, physical activity, use of medication |
| Fung (9) | M | 40–75 | 42,898 | 12 | FFQ | Quintiles | Self-report | Age, energy intake, BMI, education, smoking, alcohol, physical activity, use of medication, dietary factors |
| Montonen (12) | 47% M, 53% F | 40–69 | 4316 | 10 | Diet history | Quartiles | Self-report | Age, sex, geographic area, energy intake, BMI, smoking, dietary factors |
| Van Dam (13) | F | 21–69 | 41,186 | 8 | FFQ | 4 groups | Self-report | Age, energy intake, BMI, education, smoking, alcohol, physical activity, history of diabetes, dietary factors |
| De Munter (8) | F | 26–46 | 88,410 | 12 | FFQ | Quintiles | Self-report | Age, energy intake, BMI, smoking, alcohol, physical activity, history of T2D, dietary factors |
TABLE 2.
Characteristics of prospective cohort studies of whole grain intake and risk of CVD outcomes1
| Author (reference) | Sex | Age, y | n | Follow-up, y | Exposure measurement | Exposure categories | CVD outcome ascertainment | Adjustments |
|---|---|---|---|---|---|---|---|---|
| Jacobs (14) | F | 55–69 | 34,492 | 9 | FFQ | Quintiles | Ischemic heart disease mortality (death certificate) | Age, energy intake, BMI, education, smoking, alcohol, physical activity, use of medication, dietary factors, diabetes, hypertension |
| Jacobs (15) | F | 55–90 | 38,740 | 9 | FFQ | Quintiles | CVD mortality (death certificate) | Age, energy intake, BMI, education, smoking, alcohol, physical activity, use of medication, dietary factors, diabetes, hypertension, cancer, heart disease |
| Liu (19) | F | 38–63 | 75,521 | 10 | FFQ | Quintiles | CHD (medical records) | Age, energy intake, BMI, education, smoking, alcohol, physical activity, use of medication, dietary factors, diabetes, history of hypertension/high cholesterol |
| Liu (17) | F | 38–63 | 75,521 | 12 | FFQ | Quintiles | Ischemic stroke (medical records) | Age, energy intake, BMI, education, smoking, alcohol, physical activity, use of medication, dietary factors, diabetes, history of hypertension/high cholesterol |
| Liu (18) | M | 40–84 | 86,190 | 5.5 | FFQ | Quartiles | CVD mortality (death certificate) | Age, BMI, smoking, alcohol, physical activity, use of multivitamins, history of T2D, high cholesterol, hypertension |
| Steffen (20) | F | 45–64 | 11,940 | 11 | FFQ | Quintiles | CAD (medical records/registry) | Age, race, sex, energy intake, education, smoking, alcohol, physical activity, hormone use |
| Jensen (16) | M | 45–75 | 42,850 | 14 | FFQ | Quintiles | CHD (medical records) | Age, energy intake, smoking, alcohol, physical activity, dietary factors, history of hypertension/high cholesterol/ diabetes/MI |
| Djousse (27) | M | 40–86 | 21,376 | 19.6 | FFQ | Four categories | Heart failure (self-report) | Age, smoking, alcohol, physical activity, dietary factors, use of multivitamins, history of CVD |
| Nettleton (28) | F | 45–64 | 14,153 | 13.3 | FFQ | — | Heart failure (medical records/ death certificates) | Age, race, sex, education, smoking, alcohol, physical activity, CVD/diabetes/hypertension |
| He (29) | F | 30–55 | 7822 | 26 | FFQ | Quintiles | CVD mortality (death certificate) | Age, energy intake, smoking, alcohol, physical activity, dietary factors, hormone use, menopausal status, diabetes duration |
TABLE 3.
Characteristics of prospective cohort studies of total dietary and cereal fiber intake and risk of T2D1
| Author (reference) | Sex | Age, y | n | Follow-up, y | Exposure measurement | Exposure categories | T2D outcome ascertainment | Adjustments |
|---|---|---|---|---|---|---|---|---|
| Meyer (11) | F | 55–69 | 35,988 | 6 | FFQ | Quintiles | Self-report | Age, energy intake, BMI, education, smoking, alcohol, physical activity |
| Stevens (35) | Age, sex, BMI, education, physical activity | |||||||
| White | M/F | 45–64 | 9529 | 9 | FFQ | —2 | Self-report/exam | |
| African American | M/F | 45–64 | 2722 | 9 | FFQ | — | Self-report/exam | |
| Montonen (12) | Age, energy intake, BMI, geographic area, | |||||||
| Men | M | 40–69 | 2286 | 10 | Diet history | Quartiles | Self-report/exam | smoking, dietary factors |
| Women | F | 40–69 | 2030 | 10 | Diet history | Quartiles | Self-report/exam | |
| Hodge (31) | F | 40–69 | 31,641 | 4 | FFQ | — | Self-report | Age, sex, BMI, education, physical activity |
| Schulze (33) | F | 24–44 | 91,249 | 8 | FFQ | Quintiles | Self-report | Age, BMI, energy intake, smoking, alcohol, physical activity, use of medication, family history of T2D, history of hypertension/high cholesterol, dietary factors |
| Barclay (30) | M/F | 49+ | 2123 | 10 | FFQ | — | Self-report | Age, sex, physical activity, family history of T2D, smoking, triglycerides, HDL-cholesterol |
| Krishnan (38) | F | 21–69 | 40,078 | 8 | FFQ | Quintiles | Self-report | Age, energy intake, BMI, education, smoking, alcohol, physical activity, family history of T2D, dietary factors |
| Schulze (34) | 39% M 61% F | 35–65 | 25,067 | 7 | FFQ | Quintiles | Self-report | Age, sex, energy intake, education, smoking, alcohol, physical activity, dietary factors |
| Wannamethee (36) | M | 60–79 | 34,248 | 7 | 7-d recall FFQ | Quartiles | Self-report/medical records | Age, energy intake, waist circumference, smoking, alcohol physical activity, SES, stroke, MI, use of statins |
| Hopping (32) | Age, ethnicity, energy intake, BMI, physical activity, education | |||||||
| Men | M | 45–75 | 36,256 | 14 | FFQ | 5 groups | Self-report/medical records | |
| Women | F | 45–75 | 39,256 | 14 | FFQ | 5 groups | Self-report/medical records | |
| Slujis (37) | 26% M 74%F | 21–70 | 37,846 | 10 | FFQ | — | Self-report | Age, BMI, waist circumference, education, smoking, alcohol, physical activity, family history of T2D, dietary factors |
TABLE 4.
Characteristics of prospective cohort studies of total dietary and cereal fiber intake and risk of CVD outcomes1
| Author (reference) | Sex | Age, y | n | Follow-up, y | Exposure measurement | Exposure categories | CVD outcome ascertainment | Adjustments |
|---|---|---|---|---|---|---|---|---|
| Khaw (39) | Ischemic heart disease mortality (death certificate) | Age, sex, BMI, systolic blood pressure, cholesterol, fasting glucose, smoking | ||||||
| Men | M | 50–79 | 356 | 12 | 24-h recall | Tertiles | ||
| Women | F | 50–70 | 503 | 12 | 24-h recall | Tertiles | ||
| Pietinen (40) | M | 50–69 | 21,930 | 6.1 | Diet history | Quintiles | Coronary event (registry/death certificate) | Age, energy intake, smoking, alcohol, BMI, blood pressure, education, physical activity, dietary factors |
| Todd (41) | CHD (medical records) | Age, energy intake, BMI, alcohol, physical activity, metabolic risk factors | ||||||
| Men | M | 40–59 | 5754 | 7.7 | FFQ | Quartiles | ||
| Women | F | 40–59 | 5875 | 7.7 | FFQ | Quartiles | ||
| Wolk (42) | F | 37–64 | 68,782 | 10 | FFQ | Quintiles | CHD (medical records) | Age, BMI, smoking, physical activity, menopausal status, aspirin use, multivitamin use, hypertension, family history of MI, dietary factors |
| Liu (43) | F | 38–63 | 39,876 | 6 | FFQ | Quintiles | CVD (medical records) | Age, energy intake, smoking, exercise, alcohol, hormone use, BMI, multivitamin use, history of hypertension/high cholesterol/diabetes, dietary factors |
| Bazzano (44) | M/F | 25–74 | 9776 | 19 | 24-h recall | Quartiles | CVD (medical records/death certificate) | Age, sex, race, BMI education, physical activity, systolic blood pressure, total cholesterol, diabetes, alcohol, smoking, dietary factors |
| Merchant (45) | M | 40–75 | 46,032 | 12 | FFQ | Quintiles | Peripheral arterial disease (medical record) | Age, smoking, BMI, alcohol, physical activity, hypertension, high cholesterol, family history of heart disease |
| Mozaffarian (46) | M/F | > 65 | 3588 | 8.6 | FFQ | Quintiles | CVD (medical record) | Age, sex, education, diabetes, smoking, physical activity, alcohol, cereal, fruit, and vegetable fiber intake |
| Oh (47) | F | 30–55 | 78,779 | 18 | FFQ | Quintiles | Stroke (medical record) | Age, BMI, energy intake, smoking, alcohol, physical activity, history of MI/hypertension/high cholesterol/ diabetes, menopausal status, use of medication, multivitamins |
| Eshak (48) | CVD mortality (death certificate) | Age, BMI, history of hypertension, diabetes, alcohol, smoking, education, physical act, dietary factors | ||||||
| Men | M | 40–79 | 23,119 | 14 | FFQ | Quintiles | ||
| Women | F | 40–79 | 35,611 | 14 | FFQ | Quintiles | ||
| Shen (50) | 62 ± 10 | 4526 | 4 | FFQ | Quartiles | Atrial fibrillation (medical records) | Age, sex, BMI, systolic blood pressure, hypertension, ECG, PR interval2, heart murmur, heart failure | |
| Kokubo (49) | CVD (medical records) | Age, sex, smoking, alcohol, BMI, history of diabetes, medication for hypertension/hypercholesterolemia, physical activity, dietary factors | ||||||
| Men | M | 45–65 | 40,046 | 10.4 | FFQ | Quintiles | ||
| Women | F | 45–65 | 46,341 | 10.4 | FFQ | Quintiles | ||
| Park (51) | CVD mortality (death certificate) | Age, race, total energy intake, education, marital status, health status, BMI, physical activity, smoking, alcohol, dietary factors | ||||||
| Men | M | 50–71 | 219,123 | 9 | FFQ | Quintiles | ||
| Women | F | 50–71 | 168,999 | 9 | FFQ | Quintiles | ||
| Larsson (52) | M | 50–69 | 26,556 | 13.6 | FFQ | Quintiles | Stroke (hospital registry) | Age, energy intake smoking, BMI, blood pressure, cholesterol, history of T2D and CHD, physical act, alcohol, total dietary factors |
| Streppel (53) | M | 49–83 | 1373 | 40 | Diet history | — | CHD mortality (death certificate) | Age, energy intake, alcohol, smoking, BMI, SES, dietary factors |
Prospective cohort studies
Whole-grain intake and risk of T2D.
We identified 6 prospective cohort studies (8–13) that investigated the relation of whole-grain intake to T2D risk (Table 1). Studies were primarily conducted in the US with the exception of one Finnish study (12) and comprised 2,919,482 person-years of follow-up. The overall estimated multivariable-adjusted RR of T2D comparing the highest with the lowest level of intake was RR = 0.74 (95% CI: 0.69, 0.80) (Fig. 1A). No significant heterogeneity between studies was observed. After excluding one study with a substantially higher median intake of fiber in the highest category than other included studies (12), we observed no significant difference in the overall summary estimate. No evidence of publication bias was apparent.
FIGURE 1.

Multivariable-adjusted RR of T2D (A) and CVD (B) comparing the highest and lowest categories of whole-grain intake in prospective cohort studies. Squares indicate the RR estimate in each study. The size of the square is proportional to the weight of each study in the overall random effects estimate. The horizontal line represents the 95% CI. The overall summary estimate and its 95% CI are indicated by the open diamond. I2 = 0.0%, P = 0.44 for T2D; I2 = 0.0%, P = 0.82 for CVD. CVD, cardiovascular disease; T2D, type 2 diabetes.
Whole-grain intake and risk of CVD.
We identified 10 prospective cohort studies that directly investigated whole-grain intake in relation to CVD risk including 4,336,411 person-years of follow-up (14–20, 27–29) (Table 2). All studies were conducted in the US. Compared with the lowest category of whole-grain intake, the highest category of intake was associated with a 21% reduction in CVD risk [RR = 0.79 (95% CI: 0.74, 0.85)] after adjustment for known CVD risk factors (Fig. 1B). No significant heterogeneity among studies was observed, although we did observe slight asymmetry in the funnel plot (Begg's test P = 0.03), indicating possible publication bias.
Dietary fiber and risk of T2D.
We identified 11 prospective cohort studies that examined the relation of total dietary and/or cereal fiber intake to T2D risk (11, 12, 30–38) encompassing 3,202,850 person-years (Table 3). The overall estimate of the multivariable-adjusted RR of T2D comparing the highest and lowest category of fiber intake was 0.84 (95% CI: 0.76, 0.93) for total dietary fiber (Fig. 2A) and 0.87 (95% CI: 0.81, 0.94) for total cereal fiber (Fig. 3A). However, we observed borderline significant heterogeneity across studies (dietary fiber: I2 = 44.1%, P = 0.04; cereal fiber: I2 = 73.6%, P < 0.001). Subgroup analyses in men and women revealed a slightly more protective association among men [dietary fiber: RR = 0.80 (95% CI: 0.65, 0.98); cereal fiber: RR = 0.77 (95% CI: 0.59, 1.01)] than among women [RR = 0.86 (95% CI: 0.72, 1.03); RR = 0.80 (95% CI: 0.65, 1.00)] with no significant heterogeneity, indicating the original heterogeneity may have been explained by this sex difference. We observed no evidence of publication bias.
FIGURE 3.

Multivariable-adjusted RR of T2D (A) and CVD (B) comparing the highest and lowest categories of dietary cereal fiber intake in prospective cohort studies. Squares indicate the RR estimate in each study. The size of the square is proportional to the weight of each study in the overall random-effects estimate. The horizontal line represents the 95% CI. The overall summary estimate and its 95% CI are indicated by the open diamond. I2 = 73.6%, P < 0.001 for T2D; I2 = 61.3%, P = 0.003 for CVD. CVD, cardiovascular disease; T2D, type 2 diabetes.
Dietary fiber intake and risk of CVD.
Fifteen prospective cohort studies (39–53) comprising 9,129,408 person-years of follow-up, reported an association between total dietary fiber and/or cereal fiber intake with CVD risk (Table 4). In pooled analyses, the overall multivariable-adjusted RR of CVD comparing the highest with the lowest category of total dietary fiber intake was 0.81 (95% CI: 0.77, 0.86) (Fig. 2B) and 0.80 (95% CI: 0.73, 0.88) for total cereal fiber intake . No significant heterogeneity was observed between studies included in the total dietary fiber analyses [dietary fiber intake (I2 = 21%, P = 0.19)]; however, we did observe significant heterogeneity between studies assessing cereal fiber intake (I2 = 61.3%, P = 0.003). Subgroup analyses (data not shown) did not change the magnitude or direction of the overall estimate. We also observed borderline significant evidence of publication bias (Begg's test P = 0.04), potentially related to other sources of heterogeneity across these studies.
FIGURE 2.
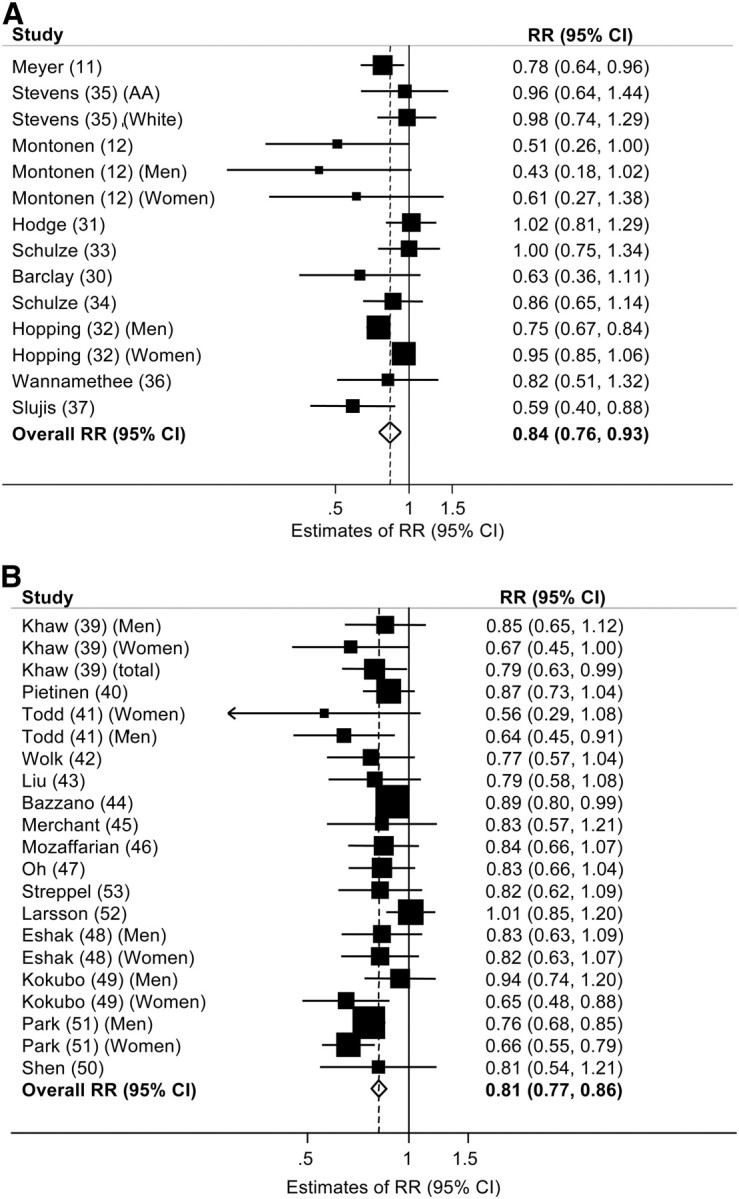
Multivariable-adjusted RR of T2D (A) and CVD (B) comparing the highest and lowest categories of dietary fiber intake in prospective cohort studies. Squares indicate the RR estimate in each study. The size of the square is proportional to the weight of each study in the overall random effects estimate. The horizontal line represents the 95% CI. The overall summary estimate and its 95% CI are indicated by the open diamond. I2 = 44.1%, P = 0.04 for T2D; I2 = 21.0%, P = 0.19 for CVD. CVD, cardiovascular disease; T2D, type 2 diabetes.
Whole-grain and dietary fiber intake and weight gain.
We identified 3 prospective cohort studies investigating whole-grain intake and weight gain (5–7) and 2 examining the relation between dietary fiber intake and weight gain (6, 7) (Supplemental Tables 3 and 4). Although the small number of studies combined with the lack of available data on numbers within categories limited our ability to pool the data, the findings generally indicated an inverse association between whole-grain and dietary fiber intakes and weight gain over time. Among 74,091 apparently healthy female nurses followed for 12 y, those with the greatest increase in whole-grain intake over time gained less weight than those with lower increases (ranging from 1.52 kg in the lowest quintile of intake to 1.23 kg in the highest quintile) every 2–4 y (7). In the same cohort, women in the highest quintile of whole-grain intake had a 23% lower risk of major weight gain [OR = 0.77 (95% CI: 0.59, 1.01)]; those in the highest quintile of dietary fiber intake had a 49% lower risk of weight gain [OR = 0.51 (95% CI: 0.39, 0.67)] (7). In another prospective study of 27,082 men aged 40–75 y at baseline, a 40-g/d increase in whole-grain intake was associated with reduced long-term weight gain by 0.49 kg during 8 y of follow-up (6). Among 17,881 male physicians, weight gain was 0.35 kg lower among participants who consumed at least 16 g/d of whole-grain cereals (1 serving/d) compared with those who rarely or never consumed whole-grain cereals during 8 y of follow-up (5). Of the 3 prospective studies investigating whole-grain consumption and risk of weight gain, whole-grain intake was associated with a reduction in weight gain ranging from 0.4 to 1.5 kg during 8–13 y.
RCT
Whole-grain interventions and metabolic intermediates.
We identified 21 RCT that directly investigated the effects of whole-grain interventions on metabolic intermediate risk factors, including fasting insulin, fasting glucose, systolic and diastolic blood pressure, circulating total and LDL-cholesterol, and weight gain (54–74). Interventions ranged from 4 to 16 wk (9 parallel in design and 12 crossover studies) (Supplemental Table 3). Participants were either healthy or had one or more major risk factors for T2D or CVD, including hyperinsulinemia, hypercholesterolemia, hypertension, or overweight. Characteristics of the whole-grain interventions, control groups, duration, and design varied widely across studies. On average, we observed significantly lower concentrations of fasting glucose, insulin, total and LDL-cholesterol, lower systolic and diastolic blood pressure, and less weight gain after whole-grain interventions compared with controls regardless of formulation and dosage (Table 5;Supplemental Fig. 2A_–_G). Weighted mean differences in post-intervention concentrations of fasting glucose and total and LDL-cholesterol between whole-grain intervention groups compared with controls indicated significantly lower concentrations after the whole-grain interventions [differences in fasting glucose: −0.93 mmol/L (95% CI: 1.65, −0.21), total cholesterol: −0.83 mmol/L (95% CI: −1.24, −0.42); and LDL-cholesterol: −0.72 mmol/L (95% CI: −1.34, −0.11)]. We observed heterogeneity across trials (P < 0.05), which remained significant in subgroups after stratification by duration, study quality, and health status.
TABLE 5.
Weighted mean difference in post-treatment metabolic biomarker concentrations comparing whole-grain intervention groups to controls
| Metabolic biomarkers | Studies, n | Weighted mean difference (95% CI) |
|---|---|---|
| Fasting insulin, pmol/L | 10 | −0.29 (−0.59, 0.01) |
| Fasting glucose, mmol/L | 11 | −0.93 (−1.65, −0.21) |
| Total cholesterol, mmol/L | 16 | −0.83 (−1.24, −0.42) |
| LDL-cholesterol, mmol/L | 15 | −0.72 (−1.34, −0.11) |
| Systolic blood pressure, mm Hg | 6 | −0.06 (−0.21, 0.10) |
| Diastolic blood pressure, mm Hg | 6 | −0.05 (−0.21, 0.11) |
| Weight gain, kg | 9 | −0.18 (−0.54, 0.18) |
Discussion
Findings from this comprehensive meta-analysis indicate that intake of whole grains is inversely associated with risk of T2D and CVD risk. Compared with those who rarely or never consume whole grains, those reporting an average of 48–80 g/d of whole grain (3–5 serving/d) had a 26% reduction in T2D risk and a 21% reduction in CVD risk, independent of known CVD risk factors. We also observed an inverse association between whole-grain intake and weight gain, with consistently less weight gain observed in those consuming 48–80 g/d of whole grain (3–5 servings/d) compared with never/rare consumers (1.27 vs. 1.64 kg) during 8–13 y of follow-up.
Whole-grain foods are a rich source of vitamins, minerals, phytochemicals, and lignans (21). Compared with refined grains, whole grains generally have a lower glycemic index because of their intact structure (75,76). Constituents of whole grains, including magnesium and antioxidants such as vitamin E, phytic acid, and selenium, may help to maintain glucose and insulin homeostasis (21) and reduce CVD risk (77). In addition to this rich source of phytochemicals, whole grains contain 20–50% of soluble fiber, which can lower serum cholesterol, LDL-cholesterol, and apoB concentrations (78, 79). It has also been reported that the presence of undigested carbohydrates in whole grains can increase fecal weight and shorten the intestinal transit time and may reduce risk of weight gain (21). Dietary fiber may be one important component of whole grains responsible for their reported beneficial effects on T2D and CVD risk driven in part by increased gastric emptying and macronutrient absorption and an improved postprandial glucose response (80–82). Findings from this meta-analysis suggest that greater intake of total dietary and cereal fiber were significantly and inversely associated with risk of T2D and CVD, although substantial heterogeneity across studies was observed.
Relatively few well-controlled and long-term randomized trials have directly examined the effects of whole-grain interventions on metabolic intermediaries for T2D and CVD, including weight gain, fasting blood glucose, insulin, and lipids and blood pressure, and trials to date have been of short duration with small sample sizes. Although we observed substantial heterogeneity across trials likely stemming from variability in study duration, types of whole-grain foods included in each intervention, comparison groups, and sample sizes, our overall findings suggest that higher levels of whole-grain intake were associated with lower levels of fasting glucose, total and LDL-cholesterol, systolic and diastolic blood pressure, and weight gain. Consistent with prior studies (83), our meta-analysis indicated that increased intake of whole grains for 4–16 wk significantly improved an individual's lipid profile, reducing total cholesterol by 0.83 mmol/L and LDL-cholesterol by 0.72 mmol/L. Given the varied whole-grain dosages in these trials, further randomized trials should further investigate these intermediates to explore possible mechanistic explanations for the consistently reported observation that whole grains may be beneficial for these intermediate risk factors for vascular disease.
Several limitations of this meta-analysis should be noted. First, although known confounders were comprehensively considered in most studies, residual confounding remains a possibility. Inadequate or incomplete adjustment for lifestyle and dietary factors may potentially overestimate the strength of the inverse association observed in these studies. Nevertheless, the consistent inverse associations observed across multiple cohort studies, in addition to supportive mechanistic investigation of whole-grain intake and metabolic intermediaries from randomized trials, reduce the likelihood of these biases. Second, the majority of studies were conducted among Caucasians in the US, limiting the generalizability of our findings to ethnic groups with differing dietary practices. Heterogeneity of trials combined with small sample sizes and short intervention periods highlight the importance of adopting a consistent strategy for study design in future trials guided by observations from prospective studies. Adopting a standardized method in identifying and classifying dietary carbohydrates as proposed by Englyst et al. (84) on behalf of the WHO's expert committee would help distinguish fiber from whole grain, intact grains from processed flours and various viscous fiber sources for future studies. Addressing these issues in future RCT may help to establish potential causal relations between whole-grain intake and intermediate metabolic biomarkers as well as uncover other mechanisms not yet recognized.
In conclusion, our systematic review and meta-analysis of 45 prospective cohorts and 21 randomized intervention trials indicates that increased intake of whole grain and fiber may lower the risk of T2D, CVD, and weight gain. Our findings support current recommendations stating that consumption of at least 48 g whole grains/d (approximately 3 servings/d) may offer beneficial effects for weight maintenance and the prevention of vascular disease (85). To further elucidate mechanisms underlying the potential beneficial effects of whole-grain intake for the prevention of chronic diseases, long-term RCT seem warranted.
Supplementary Material
nutrition155325SupplementaryData1.pdf
nutrition155325SupplementaryData2.pdf
Acknowledgments
The authors thank Yilin Chen for her substantive support in the search, data extraction, and statistical analyses. E.Q.Y. and S.L. designed research; E.Q.Y., S.A.C., E.L.C., M.K., and S.L conducted research, analyzed and interpreted the data, and wrote the manuscript. All authors read and approved the final manuscript.
Abbreviations
CVD
cardiovascular disease
RCT
randomized controlled trial
T2D
type 2 diabetes
Footnotes
1
Supported by the University of California at Los Angeles Burroughs Wellcome Fund Inter-school Program in Metabolic Diseases (http://mdtp.mednet.ucla.edu). Funding agencies had no role in the design, execution, analysis, and writing of this manuscript.
Literature Cited
- 1.WHO Diet, nutrition and the prevention of chronic diseases: report of a joint WHO/FAO expert consultation. Geneva: WHO Technical Report Series; 2002. p. 916. [Google Scholar]
- 2.Dietary Guidelines for Americans 2010. Washington, DC: U.S. Government Printing; 2010. [Google Scholar]
- 3.Bantle JP, Wylie-Rosett J, Albright AL, Apovian CM, Clark NG, Franz MJ, Hoogwerf BJ, Lichtenstein AH, Mayer-Davis E, Mooradian AD, et al. Nutrition recommendations and interventions for diabetes: a position statement of the American Diabetes Association. Diabetes Care. 2008;31Suppl 1:S61–78. [DOI] [PubMed] [Google Scholar]
- 4.Mann JI, De Leeuw I, Hermansen K, Karamanos B, Karlstrom B, Katsilambros N, Riccardi G, Rivellese AA, Rizkalla S, Slama G, et al. Evidence-based nutritional approaches to the treatment and prevention of diabetes mellitus. Nutr Metab Cardiovasc Dis. 2004;14:373–94. [DOI] [PubMed] [Google Scholar]
- 5.Bazzano LA, Song Y, Bubes V, Good CK, Manson JE, Liu S. Dietary intake of whole and refined grain breakfast cereals and weight gain in men. Obes Res. 2005;13:1952–60. [DOI] [PubMed] [Google Scholar]
- 6.Koh-Banerjee P, Franz M, Sampson L, Liu S, Jacobs DR, Jr, Spiegelman D, Willett W, Rimm E. Changes in whole-grain, bran, and cereal fiber consumption in relation to 8-y weight gain among men. Am J Clin Nutr. 2004;80:1237–45. [DOI] [PubMed] [Google Scholar]
- 7.Liu S, Willett WC, Manson JE, Hu FB, Rosner B, Colditz G. Relation between changes in intakes of dietary fiber and grain products and changes in weight and development of obesity among middle-aged women. Am J Clin Nutr. 2003;78:920–7. [DOI] [PubMed] [Google Scholar]
- 8.de Munter JS, Hu FB, Spiegelman D, Franz M, van Dam RM. Whole grain, bran, and germ intake and risk of type 2 diabetes: a prospective cohort study and systematic review. PLoS Med. 2007;4:e261. [DOI] [PMC free article] [PubMed] [Google Scholar]
- 9.Fung TT, Hu FB, Pereira MA, Liu S, Stampfer MJ, Colditz GA, Willett WC. Whole-grain intake and the risk of type 2 diabetes: a prospective study in men. Am J Clin Nutr. 2002;76:535–40. [DOI] [PubMed] [Google Scholar]
- 10.Liu S, Manson JE, Stampfer MJ, Hu FB, Giovannucci E, Colditz GA, Hennekens CH, Willett WC. A prospective study of whole-grain intake and risk of type 2 diabetes mellitus in US women. Am J Public Health. 2000;90:1409–15. [DOI] [PMC free article] [PubMed] [Google Scholar]
- 11.Meyer KA, Kushi LH, Jacobs DR, Jr, Slavin J, Sellers TA, Folsom AR. Carbohydrates, dietary fiber, and incident type 2 diabetes in older women. Am J Clin Nutr. 2000;71:921–30. [DOI] [PubMed] [Google Scholar]
- 12.Montonen J, Knekt P, Jarvinen R, Aromaa A, Reunanen A. Whole-grain and fiber intake and the incidence of type 2 diabetes. Am J Clin Nutr. 2003;77:622–9. [DOI] [PubMed] [Google Scholar]
- 13.van Dam RM, Hu FB, Rosenberg L, Krishnan S, Palmer JR. Dietary calcium and magnesium, major food sources, and risk of type 2 diabetes in U.S. black women. Diabetes Care. 2006;29:2238–43. [DOI] [PubMed] [Google Scholar]
- 14.Jacobs DR, Jr, Meyer KA, Kushi LH, Folsom AR. Whole-grain intake may reduce the risk of ischemic heart disease death in postmenopausal women: the Iowa Women's Health Study. Am J Clin Nutr. 1998;68:248–57. [DOI] [PubMed] [Google Scholar]
- 15.Jacobs DR, Jr, Meyer KA, Kushi LH, Folsom AR. Is whole grain intake associated with reduced total and cause-specific death rates in older women? The Iowa Women's Health Study. Am J Public Health. 1999;89:322–9. [DOI] [PMC free article] [PubMed] [Google Scholar]
- 16.Jensen MK, Koh-Banerjee P, Hu FB, Franz M, Sampson L, Gronbaek M, Rimm EB. Intakes of whole grains, bran, and germ and the risk of coronary heart disease in men. Am J Clin Nutr. 2004;80:1492–9. [DOI] [PubMed] [Google Scholar]
- 17.Liu S, Manson JE, Stampfer MJ, Rexrode KM, Hu FB, Rimm EB, Willett WC. Whole grain consumption and risk of ischemic stroke in women: a prospective study. JAMA. 2000;284:1534–40. [DOI] [PubMed] [Google Scholar]
- 18.Liu S, Sesso HD, Manson JE, Willett WC, Buring JE. Is intake of breakfast cereals related to total and cause-specific mortality in men? Am J Clin Nutr. 2003;77:594–9. [DOI] [PubMed] [Google Scholar]
- 19.Liu S, Stampfer MJ, Hu FB, Giovannucci E, Rimm E, Manson JE, Hennekens CH, Willett WC. Whole-grain consumption and risk of coronary heart disease: results from the Nurses' Health Study. Am J Clin Nutr. 1999;70:412–9. [DOI] [PubMed] [Google Scholar]
- 20.Steffen LM, Jacobs DR, Jr, Stevens J, Shahar E, Carithers T, Folsom AR. Associations of whole-grain, refined-grain, and fruit and vegetable consumption with risks of all-cause mortality and incident coronary artery disease and ischemic stroke: the Atherosclerosis Risk in Communities (ARIC) Study. Am J Clin Nutr. 2003;78:383–90. [DOI] [PubMed] [Google Scholar]
- 21.Slavin J. Why whole grains are protective: biological mechanisms. Proc Nutr Soc. 2003;62:129–34. [DOI] [PubMed] [Google Scholar]
- 22.Classification and diagnosis of diabetes mellitus and other categories of glucose intolerance. National Diabetes Data Group. Diabetes. 1979;28:1039–57. [DOI] [PubMed] [Google Scholar]
- 23.Diabetes mellitus. Report of a WHO Study Group. World Health Organ Tech Rep Ser. 1985;727:1–113. [PubMed] [Google Scholar]
- 24.Report of the Expert Committee on the Diagnosis and Classification of Diabetes Mellitus. Diabetes Care. 1997;20:1183–97. [DOI] [PubMed] [Google Scholar]
- 25.Alberti KG, Zimmet PZ. Definition, diagnosis and classification of diabetes mellitus and its complications. Part 1: diagnosis and classification of diabetes mellitus provisional report of a WHO consultation. Diabet Med. 1998;15:539–53. [DOI] [PubMed] [Google Scholar]
- 26.DerSimonian R, Laird N. Meta-analysis in clinical trials. Control Clin Trials. 1986;7:177–88. [DOI] [PubMed] [Google Scholar]
- 27.Djoussé L, Gaziano JM. Breakfast cereals and risk of heart failure in the physicians' health study I. Arch Intern Med. 2007;167:2080–5. [DOI] [PubMed] [Google Scholar]
- 28.Nettleton JA, Steffen LM, Loehr LR, Rosamond WD, Folsom AR. Incident heart failure is associated with lower whole-grain intake and greater high-fat dairy and egg intake in the Atherosclerosis Risk in Communities (ARIC) study. J Am Diet Assoc. 2008;108:1881–7. [DOI] [PMC free article] [PubMed] [Google Scholar]
- 29.He M, van Dam RM, Rimm E, Hu FB, Qi L. Whole-grain, cereal fiber, bran, and germ intake and the risks of all-cause and cardiovascular disease-specific mortality among women with type 2 diabetes mellitus. Circulation. 2010;121:2162–8. [DOI] [PMC free article] [PubMed] [Google Scholar]
- 30.Barclay AW, Flood VM, Rochtchina E, Mitchell P, Brand-Miller JC. Glycemic index, dietary fiber, and risk of type 2 diabetes in a cohort of older Australians. Diabetes Care. 2007;30:2811–3. [DOI] [PubMed] [Google Scholar]
- 31.Hodge AM, English DR, O'Dea K, Giles GG. Glycemic index and dietary fiber and the risk of type 2 diabetes. Diabetes Care. 2004;27:2701–6. [DOI] [PubMed] [Google Scholar]
- 32.Hopping BN, Erber E, Grandinetti A, Verheus M, Kolonel LN, Maskarinec G. Dietary fiber, magnesium, and glycemic load alter risk of type 2 diabetes in a multiethnic cohort in Hawaii. J Nutr. 2010;140:68–74. [DOI] [PMC free article] [PubMed] [Google Scholar]
- 33.Schulze MB, Liu S, Rimm EB, Manson JE, Willett WC, Hu FB. Glycemic index, glycemic load, and dietary fiber intake and incidence of type 2 diabetes in younger and middle-aged women. Am J Clin Nutr. 2004;80:348–56. [DOI] [PubMed] [Google Scholar]
- 34.Schulze MB, Schulz M, Heidemann C, Schienkiewitz A, Hoffmann K, Boeing H. Fiber and magnesium intake and incidence of type 2 diabetes: a prospective study and meta-analysis. Arch Intern Med. 2007;167:956–65. [DOI] [PubMed] [Google Scholar]
- 35.Stevens J, Ahn K. Juhaeri, Houston D, Steffan L, Couper D. Dietary fiber intake and glycemic index and incidence of diabetes in African-American and white adults: the ARIC Study. Diabetes Care. 2002;25:1715–21. [DOI] [PubMed] [Google Scholar]
- 36.Wannamethee SG, Whincup PH, Thomas MC, Sattar N. Associations between dietary fiber and inflammation, hepatic function, and risk of type 2 diabetes in older men: potential mechanisms for the benefits of fiber on diabetes risk. Diabetes Care. 2009;32:1823–5. [DOI] [PMC free article] [PubMed] [Google Scholar]
- 37.Sluijs I, van der Schouw YT. van der A DL, Spijkerman AM, Hu FB, Grobbee DE, Beulens JW. Carbohydrate quantity and quality and risk of type 2 diabetes in the European Prospective Investigation into Cancer and Nutrition-Netherlands (EPIC-NL) study. Am J Clin Nutr. 2010;92:905–11. [DOI] [PubMed] [Google Scholar]
- 38.Krishnan S, Rosenberg L, Singer M, Hu FB, Djousse L, Cupples LA, Palmer JR. Glycemic index, glycemic load, and cereal fiber intake and risk of type 2 diabetes in US black women. Arch Intern Med. 2007;167:2304–9. [DOI] [PubMed] [Google Scholar]
- 39.Khaw KT, Barrett-Connor E. Dietary fiber and reduced ischemic heart disease mortality rates in men and women: a 12-year prospective study. Am J Epidemiol. 1987;126:1093–102. [DOI] [PubMed] [Google Scholar]
- 40.Pietinen P, Rimm EB, Korhonen P, Hartman AM, Willett WC, Albanes D, Virtamo J. Intake of dietary fiber and risk of coronary heart disease in a cohort of Finnish men. The Alpha-Tocopherol, Beta-Carotene Cancer Prevention Study. Circulation. 1996;94:2720–7. [DOI] [PubMed] [Google Scholar]
- 41.Todd S, Woodward M, Tunstall-Pedoe H, Bolton-Smith C. Dietary antioxidant vitamins and fiber in the etiology of cardiovascular disease and all-causes mortality: results from the Scottish Heart Health Study. Am J Epidemiol. 1999;150:1073–80. [DOI] [PubMed] [Google Scholar]
- 42.Wolk A, Manson KE, Stampfer MJ, Colditz GA, Hu FB, Speizer FE, Hennekens CH, Willett WC. Long-term intake of dietary fiber and decreased risk of coronary heart disease among women. JAMA. 1999;281:1998–2004. [DOI] [PubMed] [Google Scholar]
- 43.Liu S, Buring JE, Sesso HD, Rimm EB, Willett WC, Manson JE. A prospective study of dietary fiber intake and risk of cardiovascular disease among women. J Am Coll Cardiol. 2002;39:49–56. [DOI] [PubMed] [Google Scholar]
- 44.Bazzano LA, He J, Ogden LG, Loria CM, Whelton PK. Dietary fiber intake and reduced risk of coronary heart disease in US men and women: the National Health and Nutrition Examination Survey I Epidemiologic Follow-up Study. Arch Intern Med. 2003;163:1897–904. [DOI] [PubMed] [Google Scholar]
- 45.Merchant AT, Hu FB, Spiegelman D, Willett WC, Rimm EB, Ascherio A. Dietary fiber reduces peripheral arterial disease risk in men. J Nutr. 2003;133:3658–63. [DOI] [PubMed] [Google Scholar]
- 46.Mozaffarian D, Kumanyika SK, Lemaitre RN, Olson JL, Burke GL, Siscovick DS. Cereal, fruit, and vegetable fiber intake and the risk of cardiovascular disease in elderly individuals. JAMA. 2003;289:1659–66. [DOI] [PubMed] [Google Scholar]
- 47.Oh K, Hu FB, Cho E, Rexrode KM, Stampfer MJ, Manson JE, Liu S, Willett WC. Carbohydrate intake, glycemic index, glycemic load, and dietary fiber in relation to risk of stroke in women. Am J Epidemiol. 2005;161:161–9. [DOI] [PubMed] [Google Scholar]
- 48.Eshak ES, Iso H, Date C, Kikuchi S, Watanabe Y, Wada Y, Wakai K, Tamakoshi A. Dietary fiber intake is associated with reduced risk of mortality from cardiovascular disease among Japanese men and women. J Nutr. 2010;140:1445–53. [DOI] [PubMed] [Google Scholar]
- 49.Kokubo Y, Iso H, Saito I, Yamagishi K, Ishihara J, Inoue M, Tsugane S. Dietary fiber intake and risk of cardiovascular disease in the Japanese population: the Japan Public Health Center-based study cohort. Eur J Clin Nutr. 2011;65:1233–41. [DOI] [PubMed] [Google Scholar]
- 50.Shen J, Johnson VM, Sullivan LM, Jacques PF, Magnani JW, Lubitz SA, Pandey S, Levy D, Vasan RS, Quatromoni PA, et al. Dietary factors and incident atrial fibrillation: the Framingham Heart Study. Am J Clin Nutr. 2011;93:261–6. [DOI] [PMC free article] [PubMed] [Google Scholar]
- 51.Park Y, Subar AF, Hollenbeck A, Schatzkin A. Dietary fiber intake and mortality in the NIH-AARP diet and health study. Arch Intern Med. 2011;171:1061–8. [DOI] [PMC free article] [PubMed] [Google Scholar]
- 52.Larsson SC, Mannisto S, Virtanen MJ, Kontto J, Albanes D, Virtamo J. Dietary fiber and fiber-rich food intake in relation to risk of stroke in male smokers. Eur J Clin Nutr. 2009;63:1016–24. [DOI] [PMC free article] [PubMed] [Google Scholar]
- 53.Streppel MT, Ocke MC, Boshuizen HC, Kok FJ, Kromhout D. Dietary fiber intake in relation to coronary heart disease and all-cause mortality over 40 y: the Zutphen Study. Am J Clin Nutr. 2008;88:1119–25. [DOI] [PubMed] [Google Scholar]
- 54.Andersson A, Tengblad S, Karlstrom B, Kamal-Eldin A, Landberg R, Basu S, Aman P, Vessby B. Whole-grain foods do not affect insulin sensitivity or markers of lipid peroxidation and inflammation in healthy, moderately overweight subjects. J Nutr. 2007;137:1401–7. [DOI] [PubMed] [Google Scholar]
- 55.Brownlee IA, Moore C, Chatfield M, Richardson DP, Ashby P, Kuznesof SA, Jebb SA, Seal CJ. Markers of cardiovascular risk are not changed by increased whole-grain intake: the WHOLEheart study, a randomised, controlled dietary intervention. Br J Nutr. 2010;104:125–34. [DOI] [PMC free article] [PubMed] [Google Scholar]
- 56.Juntunen KS, Laaksonen DE, Poutanen KS, Niskanen LK, Mykkanen HM. High-fiber rye bread and insulin secretion and sensitivity in healthy postmenopausal women. Am J Clin Nutr. 2003;77:385–91. [DOI] [PubMed] [Google Scholar]
- 57.Katcher HI, Legro RS, Kunselman AR, Gillies PJ, Demers LM, Bagshaw DM, Kris-Etherton PM. The effects of a whole grain-enriched hypocaloric diet on cardiovascular disease risk factors in men and women with metabolic syndrome. Am J Clin Nutr. 2008;87:79–90. [DOI] [PubMed] [Google Scholar]
- 58.Pereira MA, Jacobs DR, Jr, Pins JJ, Raatz SK, Gross MD, Slavin JL, Seaquist ER. Effect of whole grains on insulin sensitivity in overweight hyperinsulinemic adults. Am J Clin Nutr. 2002;75:848–55. [DOI] [PubMed] [Google Scholar]
- 59.Saltzman E, Das SK, Lichtenstein AH, Dallal GE, Corrales A, Schaefer EJ, Greenberg AS, Roberts SB. An oat-containing hypocaloric diet reduces systolic blood pressure and improves lipid profile beyond effects of weight loss in men and women. J Nutr. 2001;131:1465–70. [DOI] [PubMed] [Google Scholar]
- 60.Tighe P, Duthie G, Vaughan N, Brittenden J, Simpson WG, Duthie S, Mutch W, Wahle K, Horgan G, Thies F. Effect of increased consumption of whole-grain foods on blood pressure and other cardiovascular risk markers in healthy middle-aged persons: a randomized controlled trial. Am J Clin Nutr. 2010;92:733–40. [DOI] [PubMed] [Google Scholar]
- 61.Keenan JM, Pins JJ, Frazel C, Moran A, Turnquist L. Oat ingestion reduces systolic and diastolic blood pressure in patients with mild or borderline hypertension: a pilot trial. J Fam Pract. 2002;51:369. [PubMed] [Google Scholar]
- 62.McIntosh GH, Noakes M, Royle PJ, Foster PR. Whole-grain rye and wheat foods and markers of bowel health in overweight middle-aged men. Am J Clin Nutr. 2003;77:967–74. [DOI] [PubMed] [Google Scholar]
- 63.Landberg R, Andersson SO, Zhang JX, Johansson JE, Stenman UH, Adlercreutz H, Kamal-Eldin A, Aman P, Hallmans G. Rye whole grain and bran intake compared with refined wheat decreases urinary C-peptide, plasma insulin, and prostate specific antigen in men with prostate cancer. J Nutr. 2010;140:2180–6. [DOI] [PubMed] [Google Scholar]
- 64.Pins JJ, Geleva D, Keenan JM, Frazel C, O'Connor PJ, Cherney LM. Do whole-grain oat cereals reduce the need for antihypertensive medications and improve blood pressure control? J Fam Pract. 2002;51:353–9. [PubMed] [Google Scholar]
- 65.Lankinen M, Schwab U, Kolehmainen M, Paananen J, Poutanen K, Mykkanen H, Seppanen-Laakso T, Gylling H, Uusitupa M, Oresic M. Whole grain products, fish and bilberries alter glucose and lipid metabolism in a randomized, controlled trial: the Sysdimet study. PLoS ONE. 2011;6:e22646. [DOI] [PMC free article] [PubMed] [Google Scholar]
- 66.Ross AB, Bruce SJ, Blondel-Lubrano A, Oguey-Araymon S, Beaumont M, Bourgeois A, Nielsen-Moennoz C, Vigo M, Fay LB, Kochhar S, et al. A whole-grain cereal-rich diet increases plasma betaine, and tends to decrease total and LDL-cholesterol compared with a refined-grain diet in healthy subjects. Br J Nutr. 2011;105:1492–502. [DOI] [PubMed] [Google Scholar]
- 67.Leinonen KS, Poutanen KS, Mykkanen HM. Rye bread decreases serum total and LDL cholesterol in men with moderately elevated serum cholesterol. J Nutr. 2000;130:164–70. [DOI] [PubMed] [Google Scholar]
- 68.Li J, Kaneko T, Qin LQ, Wang J, Wang Y. Effects of barley intake on glucose tolerance, lipid metabolism, and bowel function in women. Nutrition. 2003;19:926–9. [DOI] [PubMed] [Google Scholar]
- 69.Costabile A, Klinder A, Fava F, Napolitano A, Fogliano V, Leonard C, Gibson GR, Tuohy KM. Whole-grain wheat breakfast cereal has a prebiotic effect on the human gut microbiota: a double-blind, placebo-controlled, crossover study. Br J Nutr. 2008;99:110–20. [DOI] [PubMed] [Google Scholar]
- 70.Maki KC, Beiseigel JM, Jonnalagadda SS, Gugger CK, Reeves MS, Farmer MV, Kaden VN, Rains TM. Whole-grain ready-to-eat oat cereal, as part of a dietary program for weight loss, reduces low-density lipoprotein cholesterol in adults with overweight and obesity more than a dietary program including low-fiber control foods. J Am Diet Assoc. 2010;110:205–14. [DOI] [PubMed] [Google Scholar]
- 71.Sofi F, Ghiselli L, Cesari F, Gori AM, Mannini L, Casini A, Vazzana C, Vecchio V, Gensini GF, Abbate R, et al. Effects of short-term consumption of bread obtained by an old Italian grain variety on lipid, inflammatory, and hemorheological variables: an intervention study. J Med Food. 2010;13:615–20. [DOI] [PubMed] [Google Scholar]
- 72.Tucker AJ, Mackay KA, Robinson LE, Graham TE, Bakovic M, Duncan AM. The effect of whole grain wheat sourdough bread consumption on serum lipids in healthy normoglycemic/normoinsulinemic and hyperglycemic/hyperinsulinemic adults depends on presence of the APOE E3/E3 genotype: a randomized controlled trial. Nutr Metab (Lond). 2010;7:37. [DOI] [PMC free article] [PubMed] [Google Scholar]
- 73.Kristensen M, Bugel S. A diet rich in oat bran improves blood lipids and hemostatic factors, and reduces apparent energy digestibility in young healthy volunteers. Eur J Clin Nutr. 2011;65:1053–8. [DOI] [PubMed] [Google Scholar]
- 74.Davidson MH, Dugan LD, Burns JH, Bova J, Story K, Drennan KB. The hypocholesterolemic effects of beta-glucan in oatmeal and oat bran. A dose-controlled study. JAMA. 1991;265:1833–9. [PubMed] [Google Scholar]
- 75.Hallfrisch J. Facn, Behall KM. Mechanisms of the effects of grains on insulin and glucose responses. J Am Coll Nutr. 2000;19Suppl:S320–5. [DOI] [PubMed] [Google Scholar]
- 76.Liu S. Intake of refined carbohydrates and whole grain foods in relation to risk of type 2 diabetes mellitus and coronary heart disease. J Am Coll Nutr. 2002;21:298–306. [DOI] [PubMed] [Google Scholar]
- 77.Slavin JL, Martini MC, Jacobs DR, Jr, Marquart L. Plausible mechanisms for the protectiveness of whole grains. Am J Clin Nutr. 1999;70Suppl 3:S459–63. [DOI] [PubMed] [Google Scholar]
- 78.Glore SR, Van Treeck D, Knehans AW, Guild M. Soluble fiber and serum lipids: a literature review. J Am Diet Assoc. 1994;94:425–36. [DOI] [PubMed] [Google Scholar]
- 79.Anderson JW, Hanna TJ. Impact of nondigestible carbohydrates on serum lipoproteins and risk for cardiovascular disease. J Nutr. 1999;129Suppl 7:S1457–66. [DOI] [PubMed] [Google Scholar]
- 80.Jenkins DJ, Wolever TM, Leeds AR, Gassull MA, Haisman P, Dilawari J, Goff DV, Metz GL, Alberti KG. Dietary fibres, fibre analogues, and glucose tolerance: importance of viscosity. BMJ. 1978;1:1392–4. [DOI] [PMC free article] [PubMed] [Google Scholar]
- 81.Holt S, Heading RC, Carter DC, Prescott LF, Tothill P. Effect of gel fibre on gastric emptying and absorption of glucose and paracetamol. Lancet. 1979;1:636–9. [DOI] [PubMed] [Google Scholar]
- 82.Torsdottir I, Alpsten M, Holm G, Sandberg AS, Tolli J. A small dose of soluble alginate-fiber affects postprandial glycemia and gastric emptying in humans with diabetes. J Nutr. 1991;121:795–9. [DOI] [PubMed] [Google Scholar]
- 83.Brown L, Rosner B, Willett WW, Sacks FM. Cholesterol-lowering effects of dietary fiber: a meta-analysis. Am J Clin Nutr. 1999;69:30–42. [DOI] [PubMed] [Google Scholar]
- 84.Englyst KN, Liu S, Englyst HN. Nutritional characterization and measurement of dietary carbohydrates. Eur J Clin Nutr. 2007;61Suppl 1:S19–39. [DOI] [PubMed] [Google Scholar]
- 85.Ross CM. Dairy, vitamin D, and type 2 diabetes mellitus. Arch Intern Med. 2005;165:2434–, author reply 2435. [DOI] [PubMed] [Google Scholar]
Associated Data
This section collects any data citations, data availability statements, or supplementary materials included in this article.
Supplementary Materials
nutrition155325SupplementaryData1.pdf
nutrition155325SupplementaryData2.pdf