PML is induced by oncogenic ras and promotes premature senescence - PubMed (original) (raw)
. 2000 Aug 15;14(16):2015-27.
Affiliations
- PMID: 10950866
- PMCID: PMC316863
PML is induced by oncogenic ras and promotes premature senescence
G Ferbeyre et al. Genes Dev. 2000.
Abstract
Oncogenic ras provokes a senescent-like arrest in human diploid fibroblasts involving the Rb and p53 tumor suppressor pathways. To further characterize this response, we compared gene expression patterns between ras-arrested and quiescent IMR90 fibroblasts. One of the genes up-regulated during ras-induced arrest was promyelocytic leukemia (PML) protein, a potential tumor suppressor that encodes a component of nuclear structures known as promyelocytic oncogenic domains (PODs). PML levels increased during both ras-induced arrest and replicative senescence, leading to a dramatic increase in the size and number of PODs. Forced PML expression was sufficient to promote premature senescence. Like oncogenic ras, PML increased the levels of p16, hypophosphorylated Rb, phosphoserine-15 p53, and expression of p53 transcriptional targets. The fraction of Rb and p53 that colocalized with PML markedly increased during ras-induced arrest, and expression of PML alone forced p53 to the PODs. E1A abolished PML-induced arrest and prevented PML induction and p53 phosphorylation in response to oncogenic ras. These results imply that PML acts with Rb and p53 to promote ras-induced senescence and provide new insights into PML regulation and activity.
Figures
Figure 1
Oncogenic ras induces PML. (A) 33P-labeled cDNA probes were generated from quiescent (top) and _ras_-arrested (bottom) IMR90 fibroblasts and used to hybridize to GDA arrays. The portion of each array that contains the PML cDNA (n-5, see arrows) is shown; each cDNA is arrayed in duplicate and in different orientations (see
). Note that the cDNAs located at p-1 and 1–1 are controls that show equal intensity between the filters, whereas several other cDNAs in this section displayed up- or down-regulation in _ras_-arrested cells. (B) Northern blot analysis of PML and the senescence-related genes PAI-1, stromelysin, and IL-1β. IMR90 cells were infected with a control vector (V), oncogenic ras (R), or coinfected with E1A and oncogenic ras (ER). Alternatively, the cells were serially passaged until they had become senescent (S). Three major transcripts were visualized for PML (Goddard et al. 1991). The smaller of the two PAI-1 transcripts is the one whose up-regulation correlates better with senescence (Mu and Higgins 1995).
Figure 2
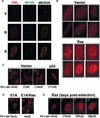
PODs accumulate during premature senescence. PML and Sp100 localization in IMR90 cells was determined by indirect immunofluorescence using the PGM3 monoclonal antibody and the rabbit Anti-Sp100 polyclonal antibody AB1380. To facilitate comparison, photomicrographs of each cell were prepared using identical microscope settings and exposure times. In all instances, similar results were obtained with a polyclonal antibody directed to a different epitope of human PML (see Materials and Methods). (A) Confocal images of costaining for PML and Sp100 in cells expressing an empty vector (V), oncogenic ras (R) and senescent cells (S). (B) PML staining in a representative series of cells expressing an empty vector (V) and oncogenic ras (R). (C) PML staining in exponentially growing subconfluent (SC) cells was compared to cells arrested by confluence (C), low serum (LS), or enforced p53 expression. (D) PML staining in cells expressing E1A or coexpressing E1A and oncogenic ras. (E) PML staining of _ras_-expressing cells fixed 2, 4, 6, and 10 days after selection for cells expressing oncogenic ras. In panels B–D, the percentage of SA-β-gal positive cells in each population is indicated below each picture.
Figure 3
Impact of enforced PML expression on IMR90 cells. (A) IMR90 cells or IMR90 cells expressing E1A were infected with a control vector (V) or a virus expressing PML. PML staining and POD structure were visualized by indirect immunofluorescence using 4′6-diamidino-2-phenylindole (DAPI) staining to highlight the nucleus. Representative samples are shown. The arrow in the bottom right panel (E1A) points to a cytoplasmic PML conglomerate. (B) Cell morphology and in situ bromodeoxyuridine (BrdU) incorporation of control IMR90 cells or E1A-expressing IMR90 (E1A) cells infected with an empty vector (V), or viruses expressing oncogenic ras (R) or PML (P). The cells were pulsed with 10 μ
m
BrdU for 2 hours a day 4 postselection, and BrdU incorporation was visualized using immunohistochemistry. (C) Quantitation of the results presented in B, showing the percentage of BrdU-positive nuclei. The average and standard deviation of three independent counts of 200 cells are shown. The abbreviations are as follows: (V) vector; (R) oncogenic ras; (P) PML; (E) E1A. (D) 3H-thymidine incorporation in cells containing a vector control (V), PML, oncogenic ras, or two PML mutants, PML Nls- and PML prb-. All cell populations were pulsed with 3H-thymidine for 24 hours, beginning 3 days postselection and the amount of incorporation was measured as described in Materials and Methods. Each point represents the mean ± standard deviation of data obtained in three independent experiments.
Figure 4
Characteristics of _PML_-induced arrest. (A) Growth curves of IMR90 cells containing empty vector (ς), oncogenic ras (λ) or PML (ν). Each value was determined in triplicate and normalized to the cell number at day 0, which corresponded to the time in which the cells finished drug selection. (B) Cell-cycle analysis of populations containing an empty vector, oncogenic ras or PML. The cells were pulsed with BrdU for 4 hours and analyzed for BrdU uptake and DNA content by two-color flow cytometry using a fluorescein isothiocyanate (FITC)-conjugated anti-BrdU antibody and propidium iodide (see Materials and Methods). The percentage of BrdU incorporation is indicated at the top of each panel.
Figure 5
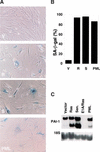
PML induces premature senescence. (A) IMR90 cell populations containing an empty vector (V), oncogenic ras (R) or PML were stained for SA-β-gal 6 days postselection. IMR90 cells that were serially passaged until senescent (S) are shown for comparison. Representative photomicrographs are shown; senescent-cells display a cytoplasmic blue stain. (B) Quantitation of data in A, showing the percentage of SA-β-gal positive cells. The data represent the mean ± standard deviation of three independent counts of 200 cells. (C) Expression of PAI-1 in the indicated populations was measured by Northern blot.
Figure 6
PML engages the Rb and p53 pathways. (A) The expression of Rb, cyclin A, p16, and p53 was measured by immunoblotting of lysates from IMR90 cells containing an empty vector (V), oncogenic ras (R) or PML (P). (B) Expression of p53 targets p21 and mdm2 by Northern blot analysis of total RNA extracted from the cells indicated above. (C) p53 phosphorylation on serine 15 was detected by immunoblotting using antibodies that specifically bind PS-15 p53. Lysates were prepared from cells infected with a empty vector (V), oncogenic ras (R), wild-type human p53 (p53), PML (P), or both the p53 and PML expressing viruses (p53 +P). The expression of total p53 was measured using a polyclonal antibody that recognizes all p53. The expression of the p53-target p21 is shown for comparison. Lysates were prepared from cells containing an empty vector (V), oncogenic ras (R), p53, PML (P) and a combination of p53 and PML (p53 +P). (D) The impact of E1A on PS-15 p53 was determined as in B, in which (ER) indicates cells co-expressing E1A and oncogenic ras.
Figure 7
Colocalization of PML, Rb, and p53 by laser scanning confocal microscopy. (A) Representative images of IMR90 cells containing an empty vector (V) or oncogenic ras (R) costained with anti-pRb and anti-PML antibodies. (B) Representative images of IMR90 cells containing an empty vector (V) or oncogenic ras (R) costained with anti-p53 and anti-PML antibodies. (C) Representative images of cells expressing a p53-green fluorescent protein (GFP) fusion protein and either a control vector (V), oncogenic ras (R), or PML (P). In this series, p53 was localized by direct GFP fluorescence, whereas PML was localized using an anti-PML antibody.
Figure 8
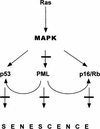
A tumor suppressor network is activated by oncogenic ras and inhibited by E1A in human diploid fibroblasts. Expression of oncogenic ras in human diploid fibroblasts induces first uncontrolled proliferation and then a permanent cell-cycle arrest with characteristics of cellular senescence. The process involves the mitogen-associated protein (MAP) kinase pathway (Lin et al. 1998) and the tumor suppressors p53, p16, Rb (Serrano et al. 1997) and PML (this paper). PML modulates both the Rb and p53 pathways but may have additional activities. Lesions that alter individual tumor suppressors in isolation do not override _ras_-induced arrest (Serrano et al. 1997; Morales et al. 1999). However, E1A disables multiple tumor-suppressor pathways and, hence, overrides _ras_-induced arrest (see bars).
Similar articles
- PML regulates p53 acetylation and premature senescence induced by oncogenic Ras.
Pearson M, Carbone R, Sebastiani C, Cioce M, Fagioli M, Saito S, Higashimoto Y, Appella E, Minucci S, Pandolfi PP, Pelicci PG. Pearson M, et al. Nature. 2000 Jul 13;406(6792):207-10. doi: 10.1038/35018127. Nature. 2000. PMID: 10910364 - Human fibroblasts require the Rb family of tumor suppressors, but not p53, for PML-induced senescence.
Mallette FA, Goumard S, Gaumont-Leclerc MF, Moiseeva O, Ferbeyre G. Mallette FA, et al. Oncogene. 2004 Jan 8;23(1):91-9. doi: 10.1038/sj.onc.1206886. Oncogene. 2004. PMID: 14712214 - E2FBP1 antagonizes the p16(INK4A)-Rb tumor suppressor machinery for growth suppression and cellular senescence by regulating promyelocytic leukemia protein stability.
Fukuyo Y, Takahashi A, Hara E, Horikoshi N, Pandita TK, Nakajima T. Fukuyo Y, et al. Int J Oral Sci. 2011 Oct;3(4):200-8. doi: 10.4248/IJOS11071. Int J Oral Sci. 2011. PMID: 22010578 Free PMC article. - PML interaction with p53 and its role in apoptosis and replicative senescence.
Pearson M, Pelicci PG. Pearson M, et al. Oncogene. 2001 Oct 29;20(49):7250-6. doi: 10.1038/sj.onc.1204856. Oncogene. 2001. PMID: 11704853 Review. - PML a target of translocations in APL is a regulator of cellular senescence.
Ferbeyre G. Ferbeyre G. Leukemia. 2002 Oct;16(10):1918-26. doi: 10.1038/sj.leu.2402722. Leukemia. 2002. PMID: 12357343 Review.
Cited by
- MOZ increases p53 acetylation and premature senescence through its complex formation with PML.
Rokudai S, Laptenko O, Arnal SM, Taya Y, Kitabayashi I, Prives C. Rokudai S, et al. Proc Natl Acad Sci U S A. 2013 Mar 5;110(10):3895-900. doi: 10.1073/pnas.1300490110. Epub 2013 Feb 19. Proc Natl Acad Sci U S A. 2013. PMID: 23431171 Free PMC article. - Cellular senescence as a possible mechanism for halting progression of keloid lesions.
Varmeh S, Egia A, McGrouther D, Tahan SR, Bayat A, Pandolfi PP. Varmeh S, et al. Genes Cancer. 2011 Nov;2(11):1061-6. doi: 10.1177/1947601912440877. Genes Cancer. 2011. PMID: 22737272 Free PMC article. - Cellular senescence limits translational readthrough.
Del Toro N, Lessard F, Bouchard J, Mobasheri N, Guillon J, Igelmann S, Tardif S, Buffard T, Bourdeau V, Brakier-Gingras L, Ferbeyre G. Del Toro N, et al. Biol Open. 2021 Dec 1;10(12):bio058688. doi: 10.1242/bio.058688. Epub 2021 Dec 2. Biol Open. 2021. PMID: 34676390 Free PMC article. - Dynamics of histone H3.3 deposition in proliferating and senescent cells reveals a DAXX-dependent targeting to PML-NBs important for pericentromeric heterochromatin organization.
Corpet A, Olbrich T, Gwerder M, Fink D, Stucki M. Corpet A, et al. Cell Cycle. 2014;13(2):249-67. doi: 10.4161/cc.26988. Epub 2013 Nov 5. Cell Cycle. 2014. PMID: 24200965 Free PMC article. - Engaging a senescent response to cure leukemia.
Bourdeau V, Ferbeyre G. Bourdeau V, et al. Nat Med. 2014 Feb;20(2):123-4. doi: 10.1038/nm.3469. Nat Med. 2014. PMID: 24504403 No abstract available.
References
- Artandi SE, DePinho RA. A critical role for telomeres in suppressing and facilitating carcinogenesis. Curr Opin Genet Dev. 2000;10:39–46. - PubMed
- Bhattacharya S, Eckner R, Grossman S, Oldread E, Arany Z, D'Andrea A, Livingston DM. Cooperation of Stat2 and p300/CBP in signalling induced by interferon-alpha. Nature. 1996;383:344–347. - PubMed
- Campisi J. The biology of replicative senescence. Eur J Cancer. 1997;33:703–709. - PubMed
- Chang BD, Broude EV, Dokmanovic M, Zhu H, Ruth A, Xuan Y, Kandel ES, Lausch E, Christov K, Roninson IB. A senescence-like phenotype distinguishes tumor cells that undergo terminal proliferation arrest after exposure to anticancer agents. Cancer Res. 1999;59:3761–3767. - PubMed
Publication types
MeSH terms
Substances
LinkOut - more resources
Full Text Sources
Other Literature Sources
Research Materials
Miscellaneous


