Long-range comparison of human and mouse SCL loci: localized regions of sensitivity to restriction endonucleases correspond precisely with peaks of conserved noncoding sequences - PubMed (original) (raw)
Comparative Study
Long-range comparison of human and mouse SCL loci: localized regions of sensitivity to restriction endonucleases correspond precisely with peaks of conserved noncoding sequences
B Göttgens et al. Genome Res. 2001 Jan.
Abstract
Long-range comparative sequence analysis provides a powerful strategy for identifying conserved regulatory elements. The stem cell leukemia (SCL) gene encodes a bHLH transcription factor with a pivotal role in hemopoiesis and vasculogenesis, and it displays a highly conserved expression pattern. We present here a detailed sequence comparison of 193 kb of the human SCL locus to 234 kb of the mouse SCL locus. Four new genes have been identified together with an ancient mitochondrial insertion in the human locus. The SCL gene is flanked upstream by the SIL gene and downstream by the MAP17 gene in both species, but the gene order is not collinear downstream from MAP17. To facilitate rapid identification of candidate regulatory elements, we have developed a new sequence analysis tool (SynPlot) that automates the graphical display of large-scale sequence alignments. Unlike existing programs, SynPlot can display the locus features of more than one sequence, thereby indicating the position of homology peaks relative to the structure of all sequences in the alignment. In addition, high-resolution analysis of the chromatin structure of the mouse SCL gene permitted the accurate positioning of localized zones accessible to restriction endonucleases. Zones known to be associated with functional regulatory regions were found to correspond precisely with peaks of human/mouse homology, thus demonstrating that long-range human/mouse sequence comparisons allow accurate prediction of the extent of accessible DNA associated with active regulatory regions.
Figures
Figure 1
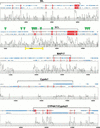
Structure of the human and murine SCL loci. The gene structure of the human and mouse SCL loci is shown above a profile displaying the respective G/C content. Arrows indicate the direction of genes. M1 and M2 refer to the sequences homologous to mitochondrial DNA, and (pCYP1) and (pCYP2) refer to partial segments of CYP4 genes present in the mouse locus.
Figure 2
A transposition of mitochondrial DNA 3′ of the human MAP17 gene. (A) Diagram showing the position of the two mitochondrial homology regions relative to the MAP17 and CYP4A11 genes. Boxes labeled M correspond to the mitochondrial homology regions shown in (B), and boxes labeled R show the position of repeat elements. (B) Alignment of mitochondrial homology regions 1 and 2 to mitochondrial sequence of cow and human.
Figure 3
SynPlot analysis of the human and mouse SCL loci. Human and mouse clones starting with the last five exons of SIL, and ranging to beyond the CYP4A11/Cyp4a21 genes, were aligned using Dialign. The alignment, together with locus features, was displayed using SynPlot. Numbers on the horizontal axis represent distance (nucleotides) from the beginning of the aligned file. Numbers on the vertical axis represent the proportion of identical nucleotides within a 49 nt window, moved by 25 nt increments across the entire alignment. Hence, regions with gaps of >50 bp show 0% identity. The horizontal lines above the profile represent the human and mouse sequences and illustrate the position of gaps introduced to permit optimum alignment. Red boxes show exon positions, and the smaller boxes represent repeats as follows: (dark blue) LINEs,(light blue) SINEs, (magenta) tandem repeats. Green arrowheads indicate the positions of previously mapped DNaseI hypersensitive sites, and the yellow bar delimits the portion of the profile shown in Figure 4. Gray shading indicates background similarity of ≤25%.
Figure 4
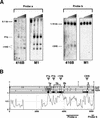
Localized regions of sensitivity to restriction endonucleases correspond to peaks of human/mouse homology. (A) Restriction endonuclease accessibility assay showing the mapping of the hypersensitive sites at promoter 1b, +1 (+1HS), and +3 (+3HS) (numbering corresponds to distances in kb from the start of exon 1a) in the 416B and M1 primitive myeloid cell lines. Nuclei were incubated with _Hae_III. DNA was subsequently extracted, digested with _Sac_I, and hybridized with probes indicated in B. The absence of the +3 hypersensitive site in M1 is consistent with previous DNaseI hypersensitive site analysis (Göttgens et al. 1997). (B) Summary of restriction endonuclease data for the 5′ region of the mouse SCL gene. The top part of the diagram shows the approximate locations of previously mapped DNaseI hypersensitive sites (gray arrowheads labeled P1a, P1b, +1HS, and +3HS) followed by the positions of mouse SCL exons 1a to 3 and the _Sac_I sites used for the Southern blots shown in part A. This is followed by restriction maps for the three enzymes (_Ava_II, _Hha_I, and _Hae_III) used to determine endonuclease sensitivity, and a summary of the endonuclease sensitivity experiments in which black and gray boxes represent the minimum and maximum regions of endonuclease accessibility in 416B and/or M1 cells. The profile of the mouse/human alignment underneath is a 6250 nucleotide section of the alignment from Fig. 3 (see yellow bar in Fig. 3) and shows the concordance of endonuclease accessibility and sequence conservation.
Similar articles
- Transcriptional regulation of the stem cell leukemia gene (SCL)--comparative analysis of five vertebrate SCL loci.
Göttgens B, Barton LM, Chapman MA, Sinclair AM, Knudsen B, Grafham D, Gilbert JG, Rogers J, Bentley DR, Green AR. Göttgens B, et al. Genome Res. 2002 May;12(5):749-59. doi: 10.1101/gr.45502. Genome Res. 2002. PMID: 11997341 Free PMC article. - Analysis of vertebrate SCL loci identifies conserved enhancers.
Göttgens B, Barton LM, Gilbert JG, Bench AJ, Sanchez MJ, Bahn S, Mistry S, Grafham D, McMurray A, Vaudin M, Amaya E, Bentley DR, Green AR, Sinclair AM. Göttgens B, et al. Nat Biotechnol. 2000 Feb;18(2):181-6. doi: 10.1038/72635. Nat Biotechnol. 2000. PMID: 10657125 - Regulation of the stem cell leukemia (SCL) gene: a tale of two fishes.
Barton LM, Gottgens B, Gering M, Gilbert JG, Grafham D, Rogers J, Bentley D, Patient R, Green AR. Barton LM, et al. Proc Natl Acad Sci U S A. 2001 Jun 5;98(12):6747-52. doi: 10.1073/pnas.101532998. Epub 2001 May 29. Proc Natl Acad Sci U S A. 2001. PMID: 11381108 Free PMC article. - The stem cell leukaemia (SCL) gene: a critical regulator of haemopoietic and vascular development.
Barton LM, Göttgens B, Green AR. Barton LM, et al. Int J Biochem Cell Biol. 1999 Oct;31(10):1193-207. doi: 10.1016/s1357-2725(99)00082-5. Int J Biochem Cell Biol. 1999. PMID: 10582347 Review. No abstract available. - The SCL gene: from case report to critical hematopoietic regulator.
Begley CG, Green AR. Begley CG, et al. Blood. 1999 May 1;93(9):2760-70. Blood. 1999. PMID: 10216069 Review. No abstract available.
Cited by
- Alteration of CTCF-associated chromatin neighborhood inhibits TAL1-driven oncogenic transcription program and leukemogenesis.
Li Y, Liao Z, Luo H, Benyoucef A, Kang Y, Lai Q, Dovat S, Miller B, Chepelev I, Li Y, Zhao K, Brand M, Huang S. Li Y, et al. Nucleic Acids Res. 2020 Apr 6;48(6):3119-3133. doi: 10.1093/nar/gkaa098. Nucleic Acids Res. 2020. PMID: 32086528 Free PMC article. - The conservation landscape of the human ribosomal RNA gene repeats.
Agrawal S, Ganley ARD. Agrawal S, et al. PLoS One. 2018 Dec 5;13(12):e0207531. doi: 10.1371/journal.pone.0207531. eCollection 2018. PLoS One. 2018. PMID: 30517151 Free PMC article. - Generation and phenotypic characterisation of a cytochrome P450 4x1 knockout mouse.
Kharkwal H, Batool F, Koentgen F, Bell DR, Kendall DA, Ebling FJP, Duce IR. Kharkwal H, et al. PLoS One. 2017 Dec 11;12(12):e0187959. doi: 10.1371/journal.pone.0187959. eCollection 2017. PLoS One. 2017. PMID: 29227996 Free PMC article. - Genomic Alterations of Non-Coding Regions Underlie Human Cancer: Lessons from T-ALL.
Rivera-Reyes A, Hayer KE, Bassing CH. Rivera-Reyes A, et al. Trends Mol Med. 2016 Dec;22(12):1035-1046. doi: 10.1016/j.molmed.2016.10.004. Epub 2016 Oct 27. Trends Mol Med. 2016. PMID: 28240214 Free PMC article. Review. - First genome-wide association study in an Australian aboriginal population provides insights into genetic risk factors for body mass index and type 2 diabetes.
Anderson D, Cordell HJ, Fakiola M, Francis RW, Syn G, Scaman ES, Davis E, Miles SJ, McLeay T, Jamieson SE, Blackwell JM. Anderson D, et al. PLoS One. 2015 Mar 11;10(3):e0119333. doi: 10.1371/journal.pone.0119333. eCollection 2015. PLoS One. 2015. PMID: 25760438 Free PMC article.
References
- Altschul SF, Gish W, Miller W, Meyers EW, Lipman DJ. Basic local alignment search tool. J Mol Biol. 1990;215:403–410. - PubMed
- Ansari-Lari MA, Oeltjen JC, Schwartz S, Zhang Z, Muzny DM, Lu J, Gorrell JH, Chinault AC, Belmont JW, Miller W, et al. Comparative sequence analysis of a gene-rich cluster at human chromosome 12p13 and its syntenic region in mouse chromosome 6. Genome Res. 1998;8:29–40. - PubMed
- Barton LM, Göttgens B, Green AR. The stem cell leukemia (SCL) gene: A critical regulator of haemopoietic and vascular development. Int J Biochem Cell Biol. 1999;31:1193–1207. - PubMed
Publication types
MeSH terms
Substances
LinkOut - more resources
Full Text Sources
Molecular Biology Databases
Research Materials
Miscellaneous


