Proteomic approach to identify novel mitochondrial proteins in Arabidopsis - PubMed (original) (raw)
. 2001 Dec;127(4):1694-710.
Affiliations
- PMID: 11743114
- PMCID: PMC133574
Proteomic approach to identify novel mitochondrial proteins in Arabidopsis
V Kruft et al. Plant Physiol. 2001 Dec.
Abstract
An Arabidopsis mitochondrial proteome project was started for a comprehensive investigation of mitochondrial functions in plants. Mitochondria were prepared from Arabidopsis stems and leaves or from Arabidopsis suspension cell cultures, and the purity of the generated fractions was tested by the resolution of organellar protein complexes applying two-dimensional blue-native/N-[2-hydroxy-1,1-bis(hydroxymethyl)ethyl]glycine (Tricine) sodium dodecyl sulfate-polyacrylamide gel electrophoresis. The Arabidopsis mitochondrial proteome was analyzed by two-dimensional isoelectric focusing/ Tricine sodium dodecyl sulfate-polyacrylamide gel electrophoresis and 650 different proteins in a pI range of pH 3 to 10 were separated on single gels. Solubilization conditions, pH gradients for isoelectric focusing, and gel staining procedures were varied, and the number of separable proteins increased to about 800. Fifty-two protein spots were identified by immunoblotting, direct protein sequencing, and mass spectrometry. The characterized proteins cooperate in various processes, such as respiration, citric acid cycle, amino acid and nucleotide metabolism, protection against O(2), mitochondrial assembly, molecular transport, and protein biosynthesis. More than 20% of the identified proteins were not described previously for plant mitochondria, indicating novel mitochondrial functions. The map of the Arabidopsis mitochondrial proteome should be useful for the analysis of knockout mutants concerning nuclear-encoded mitochondrial genes. Considerations of the total complexity of the Arabidopsis mitochondrial proteome are discussed. The data from this investigation will be made available at http://www.gartenbau.uni-hannover.de/genetik/AMPP.
Figures
Figure 1
Documentation of the purity of mitochondria prepared from green tissue (leaves and stems) of Arabidopsis. Mitochondria were isolated as described in “Materials and Methods” by differential centrifugation and density gradient centrifugation on Percoll step gradients (18%, 29%, 45% Percoll). A fraction containing mitochondria was isolated from the 29%/45% interphase and a fraction containing thylakoids was isolated from the 18%/29% interphase. The protein complexes of both fractions were separated by 2D blue-native/Tricine SDS-PAGE and visualized by silver staining. Left, Mitochondria; right, thylakoids. The designations on the top indicate the identity of the separated protein complexes: I, NADH dehydrogenase; V, F0F1 ATP synthase complex; III, cytochrome c reductase; F1, F0, F1, and F0 parts of the ATP synthase complex; FDH, formate dehydrogenase; HSP, heat stress protein 60; PS1, photosystem 1; PS2, photosystem 2; [PS1], subcomplex of photosystem 1; [PS2], subcomplex of photosystem 2, b6f, cytochrome b6f complex. The numbers on the gels mark the following proteins: 1, the PsaA/B proteins of photosystem 1 (approximately 80 kD); 2, the CP47/43 proteins of photosystem 2 (approximately 45 kD); 3, mitochondrial HSP60 (approximately 60 kD); 4, the MPP subunits of the mitochondrial cytochrome c reductase (approximately 55 kD); 5, light-harvesting chlorophyll protein of photosystem 1 (approximately 22 kD). The identifications are taken from Jänsch et al. (1996 [mitochondrial proteins]) and Kügler et al. (1997 [chloroplast proteins]).
Figure 2
Resolution of the mitochondrial protein complexes from Arabidopsis cell suspension cultures by 2D blue-native/Tricine SDS-PAGE. The gel was silver stained. A scheme of the gel is presented on the right. Designations on top refer to the identity of the resolved protein complexes (see Fig. 1), and the numbers on the right refer to the molecular masses of standard proteins (in kD).
Figure 3
2D map of mitochondrial proteins from Arabidopsis. Mitochondrial proteins (50 μg) were solubilized by lysis solution A (8
m
urea, 4% Triton X-100, and 50 m
m
DTT) and IEF was carried out using a nonlinear IPG stripe of pH 3 to 10. Proteins were detected by silver staining. The numbers above the gel indicate pI values, and the numbers on the right indicate molecular masses of standard proteins. The arrows mark spots identified by direct protein sequencing, mass spectrometry, or immunoblotting (spot numbers correspond to the numbers in Table I).
Figure 4
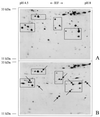
2D pattern of mitochondrial proteins from Arabidopsis with IEP values between 4.5 and 8 and molecular masses between 11 and 33 kD after solubilization of proteins in lysis solution A (8
m
urea, 2% Triton X-100, 20 m
m
DTT; A) or lysis solution B (5
m
urea, 2
m
thiourea, 2% CHAPS, 2% SB 3–10, 2 m
m
TBP; B). The gels were silver stained. The arrows mark proteins that are much better solubilized with lysis solution B.
Figure 5
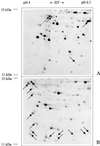
2D pattern of mitochondrial proteins from Arabidopsis with IEP values between 4 and 6.3 and molecular masses between 11 and 35 kD after silver staining (A) or Coomassie Blue staining (B). Proteins were solubilized with lysis solution A (8
m
urea, 4% Triton X-100, 50 m
m
DTT). Fifty micrograms of mitochondrial protein was loaded onto the silver-stained gel, and 1,000 μg of protein was loaded on the Coomassie-stained gel. Arrows mark protein spots not stained with Coomassie or silver.
Figure 6
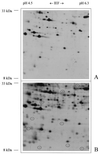
2D pattern of mitochondrial proteins from Arabidopsis with IEP values between 4.5 and 6.3 and molecular masses between 8 and 33 kD after silver staining for 10 min (A) or for 30 min (B). Both gels were loaded with 50 μg of protein. Circles indicate protein spots visible only after prolonged silver staining.
Figure 7
2D pattern of mitochondrial proteins from Arabidopsis with IEP values between 5.1 and 5.9 and molecular masses between 15 and 100 kD after separation on IPG stripes with a pH gradient of 3 to 10 (A), of 4 to 7 (B), or of 5 to 6 (C). Boxes/arrows indicate regions/spots of improved resolution on narrow-range pH gradients.
Similar articles
- New insights into the respiratory chain of plant mitochondria. Supercomplexes and a unique composition of complex II.
Eubel H, Jänsch L, Braun HP. Eubel H, et al. Plant Physiol. 2003 Sep;133(1):274-86. doi: 10.1104/pp.103.024620. Plant Physiol. 2003. PMID: 12970493 Free PMC article. - Analysis of the Arabidopsis mitochondrial proteome.
Millar AH, Sweetlove LJ, Giegé P, Leaver CJ. Millar AH, et al. Plant Physiol. 2001 Dec;127(4):1711-27. Plant Physiol. 2001. PMID: 11743115 Free PMC article. - Defining the protein complex proteome of plant mitochondria.
Klodmann J, Senkler M, Rode C, Braun HP. Klodmann J, et al. Plant Physiol. 2011 Oct;157(2):587-98. doi: 10.1104/pp.111.182352. Epub 2011 Aug 12. Plant Physiol. 2011. PMID: 21841088 Free PMC article. - The plant mitochondrial proteome.
Millar AH, Heazlewood JL, Kristensen BK, Braun HP, Møller IM. Millar AH, et al. Trends Plant Sci. 2005 Jan;10(1):36-43. doi: 10.1016/j.tplants.2004.12.002. Trends Plant Sci. 2005. PMID: 15642522 Review. - Proteomic analysis of the Arabidopsis cell wall reveals unexpected proteins with new cellular locations.
Slabas AR, Ndimba B, Simon WJ, Chivasa S. Slabas AR, et al. Biochem Soc Trans. 2004 Jun;32(Pt3):524-8. doi: 10.1042/BST0320524. Biochem Soc Trans. 2004. PMID: 15157177 Review.
Cited by
- Topological data analysis reveals a core gene expression backbone that defines form and function across flowering plants.
Palande S, Kaste JAM, Roberts MD, Segura Abá K, Claucherty C, Dacon J, Doko R, Jayakody TB, Jeffery HR, Kelly N, Manousidaki A, Parks HM, Roggenkamp EM, Schumacher AM, Yang J, Percival S, Pardo J, Husbands AY, Krishnan A, Montgomery BL, Munch E, Thompson AM, Rougon-Cardoso A, Chitwood DH, VanBuren R. Palande S, et al. PLoS Biol. 2023 Dec 5;21(12):e3002397. doi: 10.1371/journal.pbio.3002397. eCollection 2023 Dec. PLoS Biol. 2023. PMID: 38051702 Free PMC article. - Genome-Wide Identification and Expression Profiling of Aconitase Gene Family Members Reveals Their Roles in Plant Development and Adaptation to Diverse Stress in Triticum aestivum L.
Kesawat MS, Kherawat BS, Ram C, Singh A, Dey P, Gora JS, Misra N, Chung SM, Kumar M. Kesawat MS, et al. Plants (Basel). 2022 Dec 12;11(24):3475. doi: 10.3390/plants11243475. Plants (Basel). 2022. PMID: 36559588 Free PMC article. - Protein Processing in Plant Mitochondria Compared to Yeast and Mammals.
Heidorn-Czarna M, Maziak A, Janska H. Heidorn-Czarna M, et al. Front Plant Sci. 2022 Feb 2;13:824080. doi: 10.3389/fpls.2022.824080. eCollection 2022. Front Plant Sci. 2022. PMID: 35185991 Free PMC article. Review. - Subcellular Proteomics as a Unified Approach of Experimental Localizations and Computed Prediction Data for Arabidopsis and Crop Plants.
Hooper CM, Castleden IR, Tanz SK, Grasso SV, Millar AH. Hooper CM, et al. Adv Exp Med Biol. 2021;1346:67-89. doi: 10.1007/978-3-030-80352-0_4. Adv Exp Med Biol. 2021. PMID: 35113396 - Aconitase: To Be or not to Be Inside Plant Glyoxysomes, That Is the Question.
De Bellis L, Luvisi A, Alpi A. De Bellis L, et al. Biology (Basel). 2020 Jul 12;9(7):162. doi: 10.3390/biology9070162. Biology (Basel). 2020. PMID: 32664680 Free PMC article. Review.
References
- Abdallah F, Salamini F, Leister D. A prediction of the size and evolutionary origin of the proteome of chloroplasts of Arabidopsis. Trends Plant Sci. 2000;5:141–142. - PubMed
- Berkelman T, Stenstedt T. 2-D Electrophoresis using Immobilized pH Gradients: Principles and Methods. Piscataway, NJ: Amersham Pharmacia Biotech; 1998.
- Berkemeyer M, Scheibe R, Ocheretina O. A novel, non-redox-regulated NAD-dependent malate dehydrogenase from chloroplasts of Arabidopsis thalianaL. J Biol Chem. 1998;273:27927–27933. - PubMed
Publication types
MeSH terms
Substances
LinkOut - more resources
Full Text Sources
Other Literature Sources
Molecular Biology Databases
Research Materials
Miscellaneous


