NF-kappaB is essential for epithelial-mesenchymal transition and metastasis in a model of breast cancer progression - PubMed (original) (raw)
Comparative Study
. 2004 Aug;114(4):569-81.
doi: 10.1172/JCI21358.
Affiliations
- PMID: 15314694
- PMCID: PMC503772
- DOI: 10.1172/JCI21358
Comparative Study
NF-kappaB is essential for epithelial-mesenchymal transition and metastasis in a model of breast cancer progression
Margit A Huber et al. J Clin Invest. 2004 Aug.
Abstract
The transcription factor NF-kappaB is activated in a range of human cancers and is thought to promote tumorigenesis, mainly due to its ability to protect transformed cells from apoptosis. To investigate the role of NF-kappaB in epithelial plasticity and metastasis, we utilized a well-characterized in vitro/in vivo model of mammary carcinogenesis that depends on the collaboration of the Ha-Ras oncoprotein and TGF-beta. We show here that the IKK-2/IkappaBalpha/NF-kappaB pathway is required for the induction and maintenance of epithelial-mesenchymal transition (EMT). Inhibition of NF-kappaB signaling prevented EMT in Ras-transformed epithelial cells, while activation of this pathway promoted the transition to a mesenchymal phenotype even in the absence of TGF-beta. Furthermore, inhibition of NF-kappaB activity in mesenchymal cells caused a reversal of EMT, suggesting that NF-kappaB is essential for both the induction and maintenance of EMT. In line with the importance of EMT for invasion, blocking of NF-kappaB activity abrogated the metastatic potential of mammary epithelial cells in a mouse model system. Collectively, these data provide evidence of an essential role for NF-kappaB during distinct steps of breast cancer progression and suggest that the cooperation of Ras- and TGF-beta-dependent signaling pathways in late-stage tumorigenesis depends critically on NF-kappaB activity.
Figures
Figure 1
NF-κB activity is induced during EMT. (A) Schematic illustrates the morphology and epithelial/mesenchymal marker redistribution or expression found in the cell types used in our study. Nontransformed EpH4 mammary epithelial cells were stably transfected with the Ha-Ras oncogene to yield transformed epithelial EpRas cells that undergo EMT upon treatment with TGF-β, resulting in mesenchymal EpRasXT cells further stabilized by an autocrine TGF-β loop. DPP-IV, dipeptidyl peptidase IV; ZO-1, zona occludens 1. (B) EMSAs of whole-cell extracts (6 μg) of exponentially growing EpRas and EpRasXT cells were performed with an NF-κB–specific probe (upper panel) and with an octamer-specific probe (Oct; lower panel) used as a control. Quantified relative DNA-binding levels are indicated below the EMSAs. Similar data were obtained using different protein extract preparations (see also Figure 2A).
Figure 2
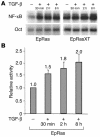
TGF-β induces NF-κB activity in EpRas cells. (A) EpRas and EpRasXT cells were stimulated with TGF-β1 (5 ng/ml) for the indicated times. EMSA with whole-cell extracts (6 μg) was performed with an NF-κB–specific probe (upper panel) and with an octamer-specific probe (lower panel) used as a control. (B) NF-κB transcriptional activity. EpRas cells were transiently transfected in triplicate with a 3xκB.luc or β-globin-TATA reporter construct. At 20 hours after transfection, cells were treated with TGF-β1 (5 ng/ml) for the indicated times. Then, the luciferase activities of extracts were determined and were normalized based on Renilla luciferase expression. The ratio of 3xκB.luc and β-globin-TATA is shown. The expression level of unstimulated empty vector-infected EpRas cells was used as the reference luciferase activity and was arbitrarily set to 1. Means and standard deviations are representative of two independent experiments carried out in triplicate. Bars represent standard deviations.
Figure 3
Modulation of NF-κB activity in EpRas cells. (A and B) Expression levels of dominant interfering mutants in ΦNX producer cells (A) and in stably infected EpRas cells (B) were determined by Western blot analysis of whole-cell extracts, using IκBα- and IKK-specific antibodies CA–IKK-2, endogenous IKK-2 (comigrating with CA–IKK-2), TD-IκBα, and endogenous IκBα. Equal loading was assessed using a p65/RelA–specific antibody (B, bottom panel). (C) Extracts from stably infected EpRas mutants left untreated (–) or stimulated with TGF-β (5 ng/ml) for 2 hours (+) were analyzed by EMSA with an NF-κB–specific probe (upper panel) and with an octamer-specific probe (lower panel) as loading control. Quantified relative DNA-binding levels are indicated. (D) Stably infected cells were transiently transfected in triplicate with 3xκB.luc or β-globin-TATA reporter constructs. After 24 hours, cells were treated with TGF-β (5 ng/ml for 4 hours) (+) or were left untreated (–). Luciferase activity was measured and normalized based on Renilla luciferase expression (as described in Figure 2B). The ratio of 3xκB.luc and β-globin-TATA is shown. Expression levels of unstimulated empty vector–transfected EpRas cells were used as a reference and arbitrarily set to 1. Bars represent standard deviations. (E) EpRas mutants and EpRasXT cells were stimulated with TGF-β (5 ng/ml) for the times indicated, and RT-PCR analysis was carried out for transcript expression of MMP-13, MCP-1, cholecystokinin, and β_-actin_, as described in Methods. C, control (water); Empty, EpRas cells infected with empty vector control.
Figure 4
EpRas cells expressing TD-IκBα fail to undergo EMT, while CA–IKK-2 expression drives EMT in the absence of TGF-β (analysis on porous support). EpRas cells expressing the empty vector control, TD-IκBα, or CA–IKK-2 were cultivated on porous supports for 7 days in the presence (+) or absence (–) of TGF-β (5 ng/ml; days 2–7). (A) Photographs of cultivated cells are shown; regions with strands of spindle-shaped mesenchymal cells are indicated by red dotted lines. Original magnification, ×100. (B) Quantification of the area on porous supports covered by mesenchymal strands as percentage relative to total area covered by adherent cells (cultures shown in A; day 6). (C) E-cadherin levels in EpRas cells expressing empty vector, TD-IκBα, or CA–IKK-2 and not treated with TGF-β were determined by Western blot analysis with an E-cadherin–specific antibody (E-Cad; upper panel). Subsequent stripping and reprobing of the blot with a p65/RelA–specific antibody (lower panel) was done to demonstrate equal loading. (D) Cells as indicated were cultivated on porous supports for 7 days in the presence or absence of TGF-β (5 ng/ml; days 2–7). Cells were immunostained for E-cadherin or vimentin (red) with DAPI counterstaining for DNA (blue), as described in Methods. Regions of mesenchymal, E-cadherin–negative and vimentin-positive cells are outlined by white dotted lines and correspond to the “mesenchymal” areas shown in A (red dotted lines). Original magnification, ×400.
Figure 5
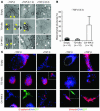
TD-IκBα expressed in EpRas cells prevents EMT, whereas CA–IKK-2 induces EMT in the absence of TGF-β (analysis in collagen gels). EpRas cells expressing the empty vector control, TD-IκBα, or CA–IKK-2 were seeded into collagen gels, were allowed to form structures for 3–5 days, and were left untreated for no induction (–) or were induced to undergo EMT by the addition of TGF-β (+) for 5–6 days. (A) Left column, culture without TGF-β for 7 days; middle column, culture without TGF-β for 5 days, plus TGF-β treatment (5 ng/ml) for 1 day; right column, culture without TGF-β for 5 days, plus TGF-β treatment (5 ng/ml) for 5 days. Photographs of representative tubular structures with lumina (yellow arrows) or distended chords and strands of invasive cells with mesenchymal morphology (white arrows) are shown. Original magnification, ×100. (B) Quantification of mesenchymal structures (see white arrows in A for the CA–IKK-2, –TGF-β culture) as the percentage relative to that of 60 randomly chosen structures per gel after 3 days of culture in the absence of TGF-β. Below graph, n indicates the number of collagen gels analyzed. Bars represent the standard deviations obtained in analyzing individual collagen gels. (C) Collagen gel structures were stained for the epithelial marker E-cadherin (first and second columns) or the mesenchymal marker vimentin (third and fourth columns). Bottom row, second from left (CA–IKK-2–expressing cells, –TGF-β): GFP expression (green) of structures stained for E-cadherin. Inset, third panel from left, middle row (TD-IκBα–expressing cells, +TGF-β): disintegrating structure stained for E-cadherin. Inset, second panel from right, bottom row (CA–IKK-2–expressing cells, –TGF-β): GFP expression (green) of structures stained for vimentin. Original magnification, ×400.
Figure 6
Suppression of NF-κB activity in EpRas cells leads to apoptosis and prevents EMT. (A) EpRas cells expressing the empty vector control, TD-IκBα, or CA–IKK-2 were seeded into collagen gels, were allowed to form structures for 3 days, and were treated with TGF-β for 6 days or were left untreated. Collagen cultures were subjected to in situ TUNEL staining (red) and DAPI staining (blue, indicating living cells). Light microscopy images of collagen gels from the same experiment photographed prior to TUNEL staining are also shown. Arrows indicate TUNEL-positive nuclei. Inset, right middle panel: another structure with TUNEL-positive nuclei. Original magnification, ×200. (B) Quantification of TUNEL-positive cells from collagen gel structures shown in A. TUNEL staining of nuclei was assessed in at least 300 cells from three to six randomly chosen fields. The average from two to three collagen gels was used to calculate the apoptotic index and standard deviation. Average percentage of apoptotic cells, assessed in 2–3 collagen gels (at least 300 cells per gel) for each cell type, are indicated above bars. (C) EpRas cells expressing the empty vector control or TD-IκBα were cultivated for 5 days on porous support in the presence or absence of 25 μM Z-VAD-FMK (Z-VAD; days 0–5) and/or TGF-β (5 ng/ml; days 1–5). The quantification of the area on porous support covered by mesenchymal strands is shown as the percentage relative to the total area covered by adherent cells (at day 4, after 3 days with or without TGF-β treatment). (D) Cells as indicated (with or without 25 μM Z-VAD-FMK; days 0–5) were cultivated on porous support for 5 days in the presence or absence of TGF-β (5 ng/ml; days 1–5). Cells were immunostained for E-cadherin or vimentin (red) plus DAPI counterstaining for DNA (blue) after 5 days of culture on porous support. Original magnification, ×400.
Figure 7
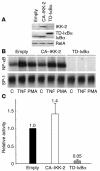
Effect of retrovirus-expressed TD-IκBα and CA–IKK-2 on NF-κB activity in EpRasXT cells. (A) Expression levels of dominant interfering mutants compared with that of their endogenously expressed wild-type counterparts in stably infected EpRasXT cells were determined by Western blot analysis of whole-cell extracts using IκBα- and IKK-specific antibodies for visualization. Protein bands of CA–IKK-2/endogenous IKK-2 (comigrating), TD-IκBα, and endogenous IκBα are indicated. Equal loading was assessed by stripping and reprobing of blots with a p65/RelA antibody (bottom panel). (B) Stably infected EpRasXT cells were not treated (control) or were stimulated with TNF-α (TNF; 40 ng/ml) for 1 hour or with PMA (50 ng/ml) for 1 hour. Then, NF-κB DNA-binding activity was assessed with an NF-κB–specific probe (upper panel) or with an Sp-1–specific probe (lower panel) as a loading control. (C) NF-κB transcriptional activity in the EpRasXT derivatives described in A and B was determined by luciferase assay, as described in Figure 3D. The expression level of empty vector–transfected EpRasXT cells was used as a reference luciferase activity and was arbitrarily set to 1. Mean values are indicated above bars.
Figure 8
Inhibition of NF-κB activity in mesenchymal EpRasXT cells causes reversal of EMT. EpRasXT cells expressing the empty vector control, TD-IκBα, or CA–IKK-2 were cultivated on porous supports for 6 days. (A) Cells were immunostained for E-cadherin (red; left column) or vimentin (red; right column) and were counterstained for DNA (blue; omitted in top and middle panels, right column). Original magnification, ×200. (B) E-cadherin and vimentin levels were determined by Western blot analysis with antibodies specific for E-cadherin and vimentin, respectively. Subsequent stripping and reprobing of the blot with a p65/RelA–specific antibody was carried out to show equal loading (bottom panel). (C) EpRasXT cells infected with either the TD-IκBα–expressing virus or the control virus were grown on porous supports to allow EMT reversal in TD-IκBα cells. Apoptotic cells were identified by annexin V staining and FACS analysis.
Figure 9
Inhibition of NF-κB activity prevents metastasis of EpRas cells. (A) EpRas cells infected with empty GFP vector (Empty) or TD-IκBα were injected (5 × 10⁵ cells per injection) into the tail veins of nude mice (four animals per cell type), and mice were analyzed for the presence of lung metastases. Note large metastatic nodules (white arrows) in the lung from the mouse injected with EpRas cells that had been infected with empty vector (EpRas empty; left). (B) Metastases in lungs similar to those shown in A were quantified in serial sections to determine the mean numbers of metastases per lung (four lungs per cell type). (C) Hematoxylin and eosin staining of lungs from mice injected with EpRas cells that had been infected with empty vector or TD-IκBα. Note large metastases in the mouse injected with EpRas cells that had been infected with empty vector. Original magnification, ×10. (D) The same cells analyzed in A–C were injected (2 × 10⁵ cells per injection site; four injection sites per animal) into the fat pads of nude mice (three animals per cell type), and total tumor weight was determined for each individual mouse after 3 weeks. Average total tumor weights are shown.
Similar articles
- Ras and TGF[beta] cooperatively regulate epithelial cell plasticity and metastasis: dissection of Ras signaling pathways.
Janda E, Lehmann K, Killisch I, Jechlinger M, Herzig M, Downward J, Beug H, Grünert S. Janda E, et al. J Cell Biol. 2002 Jan 21;156(2):299-313. doi: 10.1083/jcb.200109037. Epub 2002 Jan 14. J Cell Biol. 2002. PMID: 11790801 Free PMC article. - Molecular signature and therapeutic perspective of the epithelial-to-mesenchymal transitions in epithelial cancers.
Sabbah M, Emami S, Redeuilh G, Julien S, Prévost G, Zimber A, Ouelaa R, Bracke M, De Wever O, Gespach C. Sabbah M, et al. Drug Resist Updat. 2008 Aug-Oct;11(4-5):123-51. doi: 10.1016/j.drup.2008.07.001. Epub 2008 Aug 20. Drug Resist Updat. 2008. PMID: 18718806 Review. - Transcriptome profiling of a TGF-beta-induced epithelial-to-mesenchymal transition reveals extracellular clusterin as a target for therapeutic antibodies.
Lenferink AE, Cantin C, Nantel A, Wang E, Durocher Y, Banville M, Paul-Roc B, Marcil A, Wilson MR, O'Connor-McCourt MD. Lenferink AE, et al. Oncogene. 2010 Feb 11;29(6):831-44. doi: 10.1038/onc.2009.399. Epub 2009 Nov 23. Oncogene. 2010. PMID: 19935703 - NF-kappaB and epithelial to mesenchymal transition of cancer.
Min C, Eddy SF, Sherr DH, Sonenshein GE. Min C, et al. J Cell Biochem. 2008 Jun 1;104(3):733-44. doi: 10.1002/jcb.21695. J Cell Biochem. 2008. PMID: 18253935 Review. - Nuclear factor-kappaB-mediated transforming growth factor-beta-induced expression of vimentin is an independent predictor of biochemical recurrence after radical prostatectomy.
Zhang Q, Helfand BT, Jang TL, Zhu LJ, Chen L, Yang XJ, Kozlowski J, Smith N, Kundu SD, Yang G, Raji AA, Javonovic B, Pins M, Lindholm P, Guo Y, Catalona WJ, Lee C. Zhang Q, et al. Clin Cancer Res. 2009 May 15;15(10):3557-67. doi: 10.1158/1078-0432.CCR-08-1656. Epub 2009 May 15. Clin Cancer Res. 2009. PMID: 19447876
Cited by
- The biological kinship of hypoxia with CSC and EMT and their relationship with deregulated expression of miRNAs and tumor aggressiveness.
Bao B, Azmi AS, Ali S, Ahmad A, Li Y, Banerjee S, Kong D, Sarkar FH. Bao B, et al. Biochim Biophys Acta. 2012 Dec;1826(2):272-96. doi: 10.1016/j.bbcan.2012.04.008. Epub 2012 May 10. Biochim Biophys Acta. 2012. PMID: 22579961 Free PMC article. Review. - Mitochondrial SOD2 regulates epithelial-mesenchymal transition and cell populations defined by differential CD44 expression.
Kinugasa H, Whelan KA, Tanaka K, Natsuizaka M, Long A, Guo A, Chang S, Kagawa S, Srinivasan S, Guha M, Yamamoto K, St Clair DK, Avadhani NG, Diehl JA, Nakagawa H. Kinugasa H, et al. Oncogene. 2015 Oct 8;34(41):5229-39. doi: 10.1038/onc.2014.449. Epub 2015 Feb 9. Oncogene. 2015. PMID: 25659582 Free PMC article. - Inflammation and skeletal metastasis.
Roca H, McCauley LK. Roca H, et al. Bonekey Rep. 2015 Jun 10;4:706. doi: 10.1038/bonekey.2015.75. eCollection 2015. Bonekey Rep. 2015. PMID: 26131358 Free PMC article. Review. - RLN2 Is a Positive Regulator of AKT-2-Induced Gene Expression Required for Osteosarcoma Cells Invasion and Chemoresistance.
Ma J, Huang H, Han Z, Zhu C, Yue B. Ma J, et al. Biomed Res Int. 2015;2015:147468. doi: 10.1155/2015/147468. Epub 2015 Jul 1. Biomed Res Int. 2015. PMID: 26229955 Free PMC article. - New ruthenium-xanthoxylin complex eliminates colorectal cancer stem cells by targeting the heat shock protein 90 chaperone.
Santos LS, Silva VR, de Castro MVL, Dias RB, Valverde LF, Rocha CAG, Soares MBP, Quadros CA, Dos Santos ER, Oliveira RMM, Carlos RM, Nogueira PCL, Bezerra DP. Santos LS, et al. Cell Death Dis. 2023 Dec 15;14(12):832. doi: 10.1038/s41419-023-06330-w. Cell Death Dis. 2023. PMID: 38102125 Free PMC article.
References
- Orlowski RZ, Baldwin Jr. AS. NF-κB as a therapeutic target in cancer. Trends Mol. Med. 2002;8:385–389. - PubMed
- Karin M, Cao Y, Greten FR, Li ZW. NF-κB in cancer: from innocent bystander to major culprit. Nat. Rev. Cancer. 2002;2:301–310. - PubMed
- Ghosh S, May MJ, Kopp EB. NF-κB and Rel proteins: evolutionarily conserved mediators of immune responses. Annu. Rev. Immunol. 1998;16:225–260. - PubMed
- Karin M, Ben-Neriah Y. Phosphorylation meets ubiquitination: the control of NF-κB activity. Annu. Rev. Immunol. 2000;18:621–663. - PubMed
- Gilmore TD. Multiple mutations contribute to the oncogenicity of the retroviral oncoprotein v-Rel. Oncogene. 1999;18:6925–6937. - PubMed
Publication types
MeSH terms
Substances
LinkOut - more resources
Full Text Sources
Other Literature Sources
Research Materials


