Tumor antigen-specific CD8 T cells infiltrating the tumor express high levels of PD-1 and are functionally impaired - PubMed (original) (raw)
Tumor antigen-specific CD8 T cells infiltrating the tumor express high levels of PD-1 and are functionally impaired
Mojgan Ahmadzadeh et al. Blood. 2009.
Abstract
Tumor antigen-specific T cells are found within melanomas, yet tumors continue to grow. Although the tumor microenvironment is thought to influence the suppression of tumor-reactive T cells, the underlying mechanisms for this T-cell dysfunction are not clear. Here, we report that the majority of tumor infiltrating T lymphocytes (TIL), including MART-1/Melan-A melanoma antigen-specific CD8 T cells, predominantly expressed PD-1, in contrast to T cells in normal tissues and peripheral blood T lymphocytes (PBL). PD-1(+) TIL expressed CTLA-4 and Ki-67, markers that were not expressed by PD-1(-) TIL and T cells in the normal tissues and PBL. Moreover, PD-1(+) TIL were primarily HLA-DR(+) and CD127(-), in contrast to PD-1(-) TIL. Effector cytokine production by PD-1(+) TIL was impaired compared with PD-1(-) TIL and PBL. Collectively, the phenotypic and functional characterizations of TIL revealed a significantly higher frequency and level of PD-1 expression on TIL compared with normal tissue T-cell infiltrates and PBL, and PD-1 expression correlated with an exhausted phenotype and impaired effector function. These findings suggest that the tumor microenvironment can lead to up-regulation of PD-1 on tumor-reactive T cells and contribute to impaired antitumor immune responses.
Figures
Figure 1
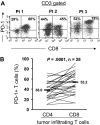
Expression of PD-1 by CD4 and CD8 T cells infiltrating into tumors. Cryopreserved tumor digests from patients with metastatic melanoma (Pt) were thawed and immediately stained with CD3, CD8, and PD-1 mAbs. (A) The dot plots were gated on CD3+ lymphocytes. Quadrants were set based on isotype control mAbs. The percentages represent the fraction of PD-1+ T cells in CD8 T cells (top right) or CD4 T cells (top left). CD3+ CD8− T cells were considered CD4 T cells throughout the study. (B) The percentage of PD-1+ CD4 T cells per total CD4 T-cell population and PD-1+ CD8 T cells per total CD8 T-cell population in tumor digests from 28 patients with metastatic melanoma is shown. P value was calculated using the paired t test.
Figure 2
Tumor antigen–specific CD8 T cells express PD-1 in tumors. Tumor digests from patients were thawed and immediately stained with anti-CD3, anti-CD8, and anti–PD-1 mAb and MART-1 tetramer. (A) Three representative patients are shown. The dot plots were gated on CD3+ CD8+ lymphocytes. The numbers represent the percentage of CD3+ CD8+ T cells for each quadrant, and the percentage values represent the fraction of PD-1+ T cells in MART-1 tetramer+ CD8 T cells (top right) and in MART-1 tetramer− CD8 T cells (bottom left). (B) The overall frequency of PD-1+ T cells in MART-1 tetramer− (MART-1−) and MART-1 tetramer+ (MART-1+) tumor-infiltrating CD8 T cells is shown for 6 patients. P value was calculated using the paired t test.
Figure 3
PD-1 is predominantly expressed by tumor-infiltrating T cells compared with peripheral blood T cells. Cryopreserved tumor digests from patients with metastatic melanoma (Pt) and PBL from the same patients and healthy donors were thawed and immediately stained with CD3, CD8, and PD-1 mAbs. (A) Dot plots were gated on CD3+ lymphocytes. The percentage for each quadrant represents the fraction of PD-1+ T cells in CD8 T cells (top right quadrant) or in CD4 T cells (top left quadrant). These were representative of 14 patients and 7 healthy donors. (B) The percentage of PD-1+ CD8 T cells per total CD8 T-cell population and (C) the percentage of PD-1+ CD4 T cells per total CD4 T-cell population were quantified in PBL and tumor digests from the same patients (n = 14). P value was calculated using the paired t test. (D) In 3 patients who had detectable circulating MART-1 tetramer CD8 T cells in their peripheral blood, we compared PD-1 expression on MART-1 tetramer+ CD8 T cells in tumor digest samples versus those in peripheral blood in the same patients as described in Figure 2.
Figure 4
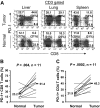
The frequency of PD-1+ T cells is significantly higher in tumor than adjacent normal tissue. Cryopreserved tumor digests (Tumor) and normal tissue digests (Normal) isolated from the same patients were thawed and immediately stained with CD3, CD8, and PD-1 mAbs. (A) The dot plots were gated on CD3+ lymphocytes. Quadrants were set based on isotype control mAbs. Numbers represent the percentages of T cells in each quadrant and the percentage values represent the fraction of PD-1+ T cells in CD8 T cells (top right quadrant) and CD4 T cells (top left quadrant). The percentage of PD-1+ CD8 T cells per total CD8 T-cells population (B) and PD-1+ CD4 T cells per total CD4 T-cell population (C) in tumors and normal tissues for 11 patients with metastatic melanoma are shown. P value was calculated using the paired t test.
Figure 5
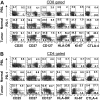
Phenotypic comparison of CD8 and CD4 T cells infiltrating into tumor, normal tissue, and peripheral blood in the same patient. Cryopreserved digests from a tumor metastasized into lung (Tumor), normal lung tissue (Normal), and peripheral blood lymphocytes (PBL) from the same patient were thawed and immediately stained with CD3, CD8, PD-1 mAbs, and appropriate marker as described in “Flow cytometric analysis.” For CD8 T cells, dot plots were gated on CD3+CD8+ lymphocytes (A) and for CD4 T cells dot plots were gated on CD3+CD8− lymphocytes (B). The numbers represent the percentages of CD8 or CD4 T cells in each quadrant. This is representative of 8 independent experiments from patients with metastatic melanoma lesions and normal tissue isolated from lung (n = 6), liver (n = 1), and spleen (n = 1).
Figure 6
PD-1 expression on tumor-infiltrating T cells correlates with impaired effector function. Tumor digests and peripheral blood sample from patients with metastatic melanoma were thawed and immediately stimulated with PMA/I for 6 to 8 hours in the presence of monensin. Cells were subsequently stained with anti-CD3, anti-CD8, and anti–PD-1 mAb along with anti–IL-2 and anti–IFN-γ mAbs. (A) Dot plots were gated on CD3+ T cells. The numbers represent the percentages of T cells in each quadrant and the value in parentheses represents the MFI for each quadrant. (B) The percentage of CD3+CD8+ T cells that were IFN-γ+ is depicted for PD-1+ and PD-1− CD8 TILs. (C) The MFI for IFN-γ+ CD3+CD8+ T cells are depicted for PD-1+ and PD-1− CD8 TILs. (D) The percentage of CD3+CD8+ T cells that were IL-2+ is depicted for PD-1+ and PD-1− CD8 TILs for 6 patients. P values are calculated based on the paired t test. (E) IFN-γ production by MART-1 tetramer+ CD8 T cells in tumor digests versus peripheral blood (PBL) from the same patient is shown. The percentage values represent the fraction of MART-1 tetramer+ CD8 T cells that produced IFN-γ.
Comment in
- Immunotherapy. 2009 Nov;1(6):921-4
- Blocking PD-1 in cancer immunotherapy.
Dotti G. Dotti G. Blood. 2009 Aug 20;114(8):1457-8. doi: 10.1182/blood-2009-05-223412. Blood. 2009. PMID: 19696208
Similar articles
- PD-1 and CD103 Are Widely Coexpressed on Prognostically Favorable Intraepithelial CD8 T Cells in Human Ovarian Cancer.
Webb JR, Milne K, Nelson BH. Webb JR, et al. Cancer Immunol Res. 2015 Aug;3(8):926-35. doi: 10.1158/2326-6066.CIR-14-0239. Epub 2015 May 8. Cancer Immunol Res. 2015. PMID: 25957117 - T-cell immune function in tumor, skin, and peripheral blood of advanced stage melanoma patients: implications for immunotherapy.
Tjin EP, Konijnenberg D, Krebbers G, Mallo H, Drijfhout JW, Franken KL, van der Horst CM, Bos JD, Nieweg OE, Kroon BB, Haanen JB, Melief CJ, Vyth-Dreese FA, Luiten RM. Tjin EP, et al. Clin Cancer Res. 2011 Sep 1;17(17):5736-47. doi: 10.1158/1078-0432.CCR-11-0230. Epub 2011 Jul 12. Clin Cancer Res. 2011. PMID: 21750202 - Antibodies Against Immune Checkpoint Molecules Restore Functions of Tumor-Infiltrating T Cells in Hepatocellular Carcinomas.
Zhou G, Sprengers D, Boor PPC, Doukas M, Schutz H, Mancham S, Pedroza-Gonzalez A, Polak WG, de Jonge J, Gaspersz M, Dong H, Thielemans K, Pan Q, IJzermans JNM, Bruno MJ, Kwekkeboom J. Zhou G, et al. Gastroenterology. 2017 Oct;153(4):1107-1119.e10. doi: 10.1053/j.gastro.2017.06.017. Epub 2017 Jun 23. Gastroenterology. 2017. PMID: 28648905 - Effector, Memory, and Dysfunctional CD8(+) T Cell Fates in the Antitumor Immune Response.
Reiser J, Banerjee A. Reiser J, et al. J Immunol Res. 2016;2016:8941260. doi: 10.1155/2016/8941260. Epub 2016 May 22. J Immunol Res. 2016. PMID: 27314056 Free PMC article. Review. - Focus on TILs: prognostic significance of tumor infiltrating lymphocytes in human melanoma.
Oble DA, Loewe R, Yu P, Mihm MC Jr. Oble DA, et al. Cancer Immun. 2009 Apr 2;9:3. Cancer Immun. 2009. PMID: 19338264 Free PMC article. Review.
Cited by
- Dual blockade of PD-1 and CTLA-4 combined with tumor vaccine effectively restores T-cell rejection function in tumors.
Duraiswamy J, Kaluza KM, Freeman GJ, Coukos G. Duraiswamy J, et al. Cancer Res. 2013 Jun 15;73(12):3591-603. doi: 10.1158/0008-5472.CAN-12-4100. Epub 2013 Apr 30. Cancer Res. 2013. PMID: 23633484 Free PMC article. - NSCLC: from tumorigenesis, immune checkpoint misuse to current and future targeted therapy.
Raskova Kafkova L, Mierzwicka JM, Chakraborty P, Jakubec P, Fischer O, Skarda J, Maly P, Raska M. Raskova Kafkova L, et al. Front Immunol. 2024 Feb 7;15:1342086. doi: 10.3389/fimmu.2024.1342086. eCollection 2024. Front Immunol. 2024. PMID: 38384472 Free PMC article. Review. - The promise of PD-1 inhibitors in gastro-esophageal cancers: microsatellite instability vs. PD-L1.
Jin Z, Yoon HH. Jin Z, et al. J Gastrointest Oncol. 2016 Oct;7(5):771-788. doi: 10.21037/jgo.2016.08.06. J Gastrointest Oncol. 2016. PMID: 27747091 Free PMC article. Review. - Activation of CD8 T cells accelerates anti-PD-1 antibody-induced psoriasis-like dermatitis through IL-6.
Tanaka R, Ichimura Y, Kubota N, Saito A, Nakamura Y, Ishitsuka Y, Watanabe R, Fujisawa Y, Kanzaki M, Mizuno S, Takahashi S, Fujimoto M, Okiyama N. Tanaka R, et al. Commun Biol. 2020 Oct 15;3(1):571. doi: 10.1038/s42003-020-01308-2. Commun Biol. 2020. PMID: 33060784 Free PMC article. - Clinical implication of genetic composition and molecular mechanism on treatment strategies of HER2-positive breast cancers.
Chow CYC, Lie EF, Wu CH, Chow LWC. Chow CYC, et al. Front Oncol. 2022 Oct 31;12:964824. doi: 10.3389/fonc.2022.964824. eCollection 2022. Front Oncol. 2022. PMID: 36387174 Free PMC article. Review.
References
- Chen L. Co-inhibitory molecules of the B7-CD28 family in the control of T-cell immunity. Nat Rev Immunol. 2004;4:336–347. - PubMed
- Greenwald RJ, Freeman GJ, Sharpe AH. The B7 family revisited. Annu Rev Immunol. 2005;23:515–548. - PubMed
- Sharpe AH, Wherry EJ, Ahmed R, Freeman GJ. The function of programmed cell death 1 and its ligands in regulating autoimmunity and infection. Nat Immunol. 2007;8:239–245. - PubMed
- Nishimura H, Nose M, Hiai H, Minato N, Honjo T. Development of lupus-like autoimmune diseases by disruption of the PD-1 gene encoding an ITIM motif-carrying immunoreceptor. Immunity. 1999;11:141–151. - PubMed
- Nishimura H, Okazaki T, Tanaka Y, et al. Autoimmune dilated cardiomyopathy in PD-1 receptor-deficient mice. Science. 2001;291:319–322. - PubMed
MeSH terms
Substances
LinkOut - more resources
Full Text Sources
Other Literature Sources
Medical
Research Materials


