AR-C155858 is a potent inhibitor of monocarboxylate transporters MCT1 and MCT2 that binds to an intracellular site involving transmembrane helices 7-10 - PubMed (original) (raw)
AR-C155858 is a potent inhibitor of monocarboxylate transporters MCT1 and MCT2 that binds to an intracellular site involving transmembrane helices 7-10
Matthew J Ovens et al. Biochem J. 2010.
Abstract
In the present study we characterize the properties of the potent MCT1 (monocarboxylate transporter 1) inhibitor AR-C155858. Inhibitor titrations of L-lactate transport by MCT1 in rat erythrocytes were used to determine the Ki value and number of AR-C155858-binding sites (Et) on MCT1 and the turnover number of the transporter (kcat). Derived values were 2.3+/-1.4 nM, 1.29+/-0.09 nmol per ml of packed cells and 12.2+/-1.1 s-1 respectively. When expressed in Xenopus laevis oocytes, MCT1 and MCT2 were potently inhibited by AR-C155858, whereas MCT4 was not. Inhibition of MCT1 was shown to be time-dependent, and the compound was also active when microinjected, suggesting that AR-C155858 probably enters the cell before binding to an intracellular site on MCT1. Measurement of the inhibitor sensitivity of several chimaeric transporters combining different domains of MCT1 and MCT4 revealed that the binding site for AR-C155858 is contained within the C-terminal half of MCT1, and involves TM (transmembrane) domains 7-10. This is consistent with previous data identifying Phe360 (in TM10) and Asp302 plus Arg306 (TM8) as key residues in substrate binding and translocation by MCT1. Measurement of the Km values of the chimaeras for L-lactate and pyruvate demonstrate that both the C- and N-terminal halves of the molecule influence transport kinetics consistent with our proposed molecular model of MCT1 and its translocation mechanism that requires Lys38 in TM1 in addition to Asp302 and Arg306 in TM8 [Wilson, Meredith, Bunnun, Sessions and Halestrap (2009) J. Biol. Chem. 284, 20011-20021].
Figures
Figure 1. Inhibition of L-lactate uptake into rat erythrocytes by AR-C155858
Rat erythrocytes were freshly isolated and resuspended at the specified haematocrit as outlined in the Experimental section. Cells were pre-incubated for 1 h at room temperature in the presence or absence of the specified concentration of AR-C155858 (structure shown). Transport was measured by continuous monitoring of the extracellular pH, and calibration of pH changes in terms of proton uptake was achieved by addition of standardized NaOH (10 μM final) just before addition of 10 mM
L
-lactate to initiate transport. Initial rates of transport were calculated by first-order regression analysis of the time course of pH change. The data were then fitted by non-linear least squares inhibition to the equation for a tight-binding non-competitive inhibitor using inhibitor concentration and haematocrit as the two _x_-variables [41,42]. The derived values (±S.E. of the fit shown) for the _K_i and concentration of binding sites were 2.3±1.4 nM and 1.29±0.09 nmol per ml of packed cells respectively.
Figure 2. MCT1 expressed in Xenopus oocytes is inhibited by AR-C155858 in a time- and concentration-dependent manner
Xenopus oocytes were injected with the appropriate cRNA and after 72 h expression were pre-incubated in pH 6 oocyte transport buffer in the presence or absence of 0.1 μM or 1 μM AR-C155858 for the times shown. The uptake of 0.5 mM
L
-[14C]lactate uptake was then determined after 2.5 min over which period it was found to be linear with time. Data are shown as means±S.E.M of ten separate oocytes. The inset shows the uptake of 20 mM
L
-lactate measured at pH 6.0 using the pH-sensitive dye BCECF. Data are presented for the same oocyte in the absence of inhibitor and then after 20 min superfusion with 0.1 μM and 1 μM AR-C155858.
Figure 3. When expressed in Xenopus oocytes, MCT1 and MCT2, but not MCT4, are sensitive to inhibition by AR-C155858
Xenopus oocytes were injected with appropriate cRNA or water and after 72 h expression they were incubated with the concentration of AR-C155858 shown for 45 min prior to measurement of
L
-[14C]lactate uptake over 2.5 min. Data are shown as the means±S.E.M. of 15–40 separate oocytes for each inhibitor concentration. The inset images show the expression of the relevant MCT in oocyte sections revealed using immunoflourescence microscopy with C-terminal antibodies against the relevant MCT. Arrows indicate the location of the plasma membrane. Note that for MCT2 a significant proportion of the MCT remains in an intracellular compartment.
Figure 4. Microinjection of AR-C155858 inhibits MCT1 expressed in Xenopus oocytes
MCT1 was expressed in Xenopus oocytes for 72 h prior to inhibitor treatment and assay of
L
-[14C]lactate uptake over 2.5 min. For addition of AR-C155858 internally, 20 oocytes were individually injected with 9.2 nl of 1 mM AR-C155858 or DMSO as a control, incubated for 5 min in 5 ml of pH 6 transport buffer and washed once prior to transport assay. For incubation with the equivalent amount of AR-C155858 added externally, 20 aliquots (9.2 nl) of 1 mM AR-C155858 were added to 5 ml of pH 6 transport buffer (final concentration of 35 nM) and incubated with the oocytes for 5 min prior to a single wash and transport assay as above. Uptake was corrected for the uptake by water-injected eggs under the same conditions and are presented as means±S.E.M. of 18–20 separate oocytes. The two images on the right-hand side show the plasma membrane expression of MCT1 in control oocytes and those incubated for 1 h with 1 μM AR-C155858 revealed by immunofluorescence microscopy.
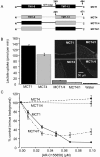
Figure 5. The binding site of MCT1 for AR-C155858 resides within the C-terminal half of the transporter
(A) Shows a schematic of the MCT1/4 and MCT4/1 chimaeras used, with MCT1 sequence being shown in black and MCT4 sequence in grey. The numbered arrows indicate the position that the switch was made between MCT1 and MCT4. Native and chimaeric MCTs were expressed in oocytes for 72 h prior to incubation with AR-C155858 after which assay of
L
-[14C]lactate uptake was determined as described in Figures 2 and 3. Note that different times of uptake were employed depending on the activity of the chimaera as detailed in Supplementary Table S2 (at
http://www.BiochemJ.org/bj/425/bj4250523add.htm
). (B) Data on the absolute rate of transport of each chimaera in the absence of inhibitor. (C) The activity at each inhibitor concentration expressed as a percentage of the uninhibited rate, after the background uptake rate of water-injected oocytes was subtracted. Data are shown as the means±S.E.M. of 20–50 separate oocytes for each condition. The inset images of (B) show the plasma membrane expression of each native and chimaeric MCT revealed by immunofluorescence microscopy.
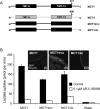
Figure 6. The C-terminus of MCT1 is not involved in AR-C155858 sensitivity
(A) Shows a schematic of the MCT1/4 and MCT4/1 chimaeras used, with MCT1 sequence being shown in black and MCT4 sequence in grey. The numbered arrows indicate the position that the switch was made between MCT1 and MCT4. Native and chimaeric MCTs were expressed in oocytes for 72 h prior to incubation with or without 0.1 μM AR-C155858 for 45 min, after which assay of
L
-[14C]lactate uptake was determined over 2.5 min as described in Figures 2 and 3. (B) Provides mean data (±S.E.M. for ten oocytes) on the absolute rate of transport of each chimaera in the absence and presence of inhibitor. The inset images show the plasma membrane expression of each native and chimaeric MCT revealed by immunofluorescence microscopy.
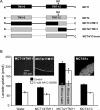
Figure 7. A region within TMs 7–10 of MCT1 is required for sensitivity to AR-C155858
(A) Shows a schematic of the MCT1/4 and MCT4/1 chimaeras used, with MCT1 sequence being shown in black and MCT4 sequence in grey. The numbered arrows indicate the position that the switch was made between MCT1 and MCT4. Native and chimaeric MCTs were expressed in oocytes for 72 h prior to incubation with or without 0.1 μM AR-C155858 for 45 min, after which assay of
L
-[14C]lactate uptake was determined over 1 h. This prolonged uptake period was required because of the low rates of transport being measured. (B) Provides mean data (±S.E.M. for ten oocytes) on the absolute rate of transport of each chimaera in the absence and presence of inhibitor. The inset images show the plasma membrane expression of each native and chimaeric MCT revealed by immunofluorescence microscopy.
Similar articles
- Identification of key binding site residues of MCT1 for AR-C155858 reveals the molecular basis of its isoform selectivity.
Nancolas B, Sessions RB, Halestrap AP. Nancolas B, et al. Biochem J. 2015 Feb 15;466(1):177-88. doi: 10.1042/BJ20141223. Biochem J. 2015. PMID: 25437897 Free PMC article. - The inhibition of monocarboxylate transporter 2 (MCT2) by AR-C155858 is modulated by the associated ancillary protein.
Ovens MJ, Manoharan C, Wilson MC, Murray CM, Halestrap AP. Ovens MJ, et al. Biochem J. 2010 Oct 15;431(2):217-25. doi: 10.1042/BJ20100890. Biochem J. 2010. PMID: 20695846 Free PMC article. - Cellular Uptake of MCT1 Inhibitors AR-C155858 and AZD3965 and Their Effects on MCT-Mediated Transport of L-Lactate in Murine 4T1 Breast Tumor Cancer Cells.
Guan X, Rodriguez-Cruz V, Morris ME. Guan X, et al. AAPS J. 2019 Jan 7;21(2):13. doi: 10.1208/s12248-018-0279-5. AAPS J. 2019. PMID: 30617815 Free PMC article. - Monocarboxylate transporter 1 and 4 inhibitors as potential therapeutics for treating solid tumours: A review with structure-activity relationship insights.
Puri S, Juvale K. Puri S, et al. Eur J Med Chem. 2020 Aug 1;199:112393. doi: 10.1016/j.ejmech.2020.112393. Epub 2020 May 1. Eur J Med Chem. 2020. PMID: 32388280 Review. - The monocarboxylate transporter family--Structure and functional characterization.
Halestrap AP. Halestrap AP. IUBMB Life. 2012 Jan;64(1):1-9. doi: 10.1002/iub.573. Epub 2011 Nov 30. IUBMB Life. 2012. PMID: 22131303 Review.
Cited by
- Dichloroacetate for Cancer Treatment: Some Facts and Many Doubts.
Koltai T, Fliegel L. Koltai T, et al. Pharmaceuticals (Basel). 2024 Jun 6;17(6):744. doi: 10.3390/ph17060744. Pharmaceuticals (Basel). 2024. PMID: 38931411 Free PMC article. Review. - Crucial residue involved in L-lactate recognition by human monocarboxylate transporter 4 (hMCT4).
Sasaki S, Kobayashi M, Futagi Y, Ogura J, Yamaguchi H, Takahashi N, Iseki K. Sasaki S, et al. PLoS One. 2013 Jul 31;8(7):e67690. doi: 10.1371/journal.pone.0067690. Print 2013. PLoS One. 2013. PMID: 23935841 Free PMC article. - Targeting Metabolic Cross Talk between Cancer Cells and Cancer-Associated Fibroblasts.
Jung JG, Le A. Jung JG, et al. Adv Exp Med Biol. 2018;1063:167-178. doi: 10.1007/978-3-319-77736-8_12. Adv Exp Med Biol. 2018. PMID: 29946783 Review. - Rapid uptake of glucose and lactate, and not hypoxia, induces apoptosis in three-dimensional tumor tissue culture.
Kasinskas RW, Venkatasubramanian R, Forbes NS. Kasinskas RW, et al. Integr Biol (Camb). 2014 Apr;6(4):399-410. doi: 10.1039/c4ib00001c. Epub 2014 Feb 6. Integr Biol (Camb). 2014. PMID: 24503640 Free PMC article. - Glucose and lactate as metabolic constraints on presynaptic transmission at an excitatory synapse.
Lucas SJ, Michel CB, Marra V, Smalley JL, Hennig MH, Graham BP, Forsythe ID. Lucas SJ, et al. J Physiol. 2018 May 1;596(9):1699-1721. doi: 10.1113/JP275107. Epub 2018 Mar 26. J Physiol. 2018. PMID: 29430661 Free PMC article.
References
- Halestrap A. P., Meredith D. The SLC16 gene family: from monocarboxylate transporters (MCTs) to aromatic amino acid transporters and beyond. Pflugers Arch. 2004;447:619–628. - PubMed
- Grollman E. F., Philp N. J., McPhie P., Ward R. D., Sauer B. Determination of transport kinetics of chick MCT3 monocarboxylate transporter from retinal pigment epithelium by expression in genetically modified yeast. Biochemistry. 2000;39:9351–9357. - PubMed
Publication types
MeSH terms
Substances
LinkOut - more resources
Full Text Sources
Other Literature Sources
Molecular Biology Databases
Research Materials


