Multipolar mitosis of tetraploid cells: inhibition by p53 and dependency on Mos - PubMed (original) (raw)
. 2010 Apr 7;29(7):1272-84.
doi: 10.1038/emboj.2010.11. Epub 2010 Feb 25.
Laura Senovilla, Mohamed Jemaà, Mickaël Michaud, Lorenzo Galluzzi, Oliver Kepp, Lisa Nanty, Alfredo Criollo, Santiago Rello-Varona, Gwenola Manic, Didier Métivier, Sonia Vivet, Nicolas Tajeddine, Nicholas Joza, Alexander Valent, Maria Castedo, Guido Kroemer
Affiliations
- PMID: 20186124
- PMCID: PMC2857458
- DOI: 10.1038/emboj.2010.11
Multipolar mitosis of tetraploid cells: inhibition by p53 and dependency on Mos
Ilio Vitale et al. EMBO J. 2010.
Abstract
Tetraploidy can constitute a metastable intermediate between normal diploidy and oncogenic aneuploidy. Here, we show that the absence of p53 is not only permissive for the survival but also for multipolar asymmetric divisions of tetraploid cells, which lead to the generation of aneuploid cells with a near-to-diploid chromosome content. Multipolar mitoses (which reduce the tetraploid genome to a sub-tetraploid state) are more frequent when p53 is downregulated and the product of the Mos oncogene is upregulated. Mos inhibits the coalescence of supernumerary centrosomes that allow for normal bipolar mitoses of tetraploid cells. In the absence of p53, Mos knockdown prevents multipolar mitoses and exerts genome-stabilizing effects. These results elucidate the mechanisms through which asymmetric cell division drives chromosomal instability in tetraploid cells.
Conflict of interest statement
The authors declare that they have no conflict of interest.
Figures
Figure 1
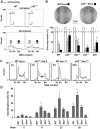
Effect of p53 on the survival and on the genomic stability of tetraploid HCT 116 cells. (A, B) The absence of p53 increases the clonogenic survival of freshly generated polyploid cells. Wild type (WT), _p53_−/−, _Bax_−/− and _p21_−/− diploid human colon carcinoma HCT 116 cells and HCT 116 cells stably transfected with a plasmid encoding the baculoviral inhibitor of caspases p35 (p35) were left untreated or treated with 100 nM nocodazole (Noco) for 48 h. After washing, cells were cultured for additional 48 h in drug-free culture medium, then stained with Hoechst 33342, followed by fluorescence-activated cell sorter (FACS) purification of diploid (2n, white and grey symbols for untreated and nocodazole-treated cells, respectively) or polyploid (>4n, black symbols) cell populations. In A, representative cell cycle distributions of WT and _p53_−/− cells from one out of three independent experiments are shown. _X_-axis = Hoechst 33342 fluorescence (DNA content); _Y_-axis = cell number per channel (counts). In B, the results of clonogenic survival assays carried out on such FACS-purified cells are reported. The upper part shows representative pictures of colonies formed by WT and _p53_−/− cells as observed upon crystal violet staining 10 days after FACS purification. Columns depict the survival fraction (mean±s.e.m., _n_=3 parallel wells, normalized for plating efficiency and to control diploid cells) of the diploid and polyploid cell populations with the indicated genotype and corresponding to the FACS-purified populations represented in A. Asterisks indicate statistically significant differences as compared to WT tetraploid cells (Student's _t_-test, P<0.05). (**C**, **D**) Genomic instability of viable polyploid cells. Diploid HCT 116 cells with the indicated genotype were treated for 48 h with nocodazole and tetraploid populations were FACS-purified as in **A** (>4n, black symbols). Cells then were cultured for the indicated number of days and analyzed for DNA content. Representative cell cycle profiles of WT and _p53_−/− tetraploid cells are shown in C, whereas quantitative data are reported in D (mean±s.e.m., _n_=6 independent determinations). In C, the percentages of cells with a sub-tetraploid DNA content (indicating chromosomal loss) are indicated. Statistical significance resulting from the comparison to WT cells is highlighted by asterisks (Student's _t_-test, P<0.05).
Figure 2
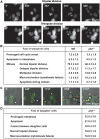
Multipolar divisions of p53-deficient tetraploid cells. Isogenic wild type (WT) and _p53_−/− diploid HCT 116 cells expressing a histone 2B–green fluorescent protein (H2B–GFP) chimera were treated for 48 h with nocodazole and then cultured in drug-free medium for additional 48 h. Polyploid cells were fluorescence-activated cell sorter (FACS)-sorted as in Figure 1A (>4n, black symbols) and monitored by fluorescence videomicroscopy for 48 h. In A snapshots taken at the indicated time points exemplify the appearance of tripolar and tetrapolar mitosis, thus exhibiting the representative Y- and X-shaped metaphase, respectively. Full-length movies proving the completion of cell division are available as Supplementary Videos S1 and S2. B reports the percentage of cell cycle arrest, apoptosis induction and various mitotic aberrations as quantified among 150 to 200 mitoses for each genotype (mean ± s.e.m., _n_=3 independent experiments). In C representative images captured at the indicated time points show that some daughter cells that originated from _p53_−/− tetraploid HCT 116 cells by multipolar mitosis can enter and terminate normal bipolar divisions (red arrows), whereas others undergo apoptosis (yellow arrows). A full-length movie that demonstrates the completion of a normal cell division by such a daughter cell is available as Supplementary Video S3. D reports the percentage of these cells (arisen from _p53_−/− tetraploid HCT 116 cells by multipolar mitosis) that underwent the indicated fate by the end of the experiment (as quantified among 150-200 daughter cells, mean±s.e.m., _n_=3 independent experiments). Note that only cells entering multipolar mitosis within the first 18 h of the assays were tracked for the subsequent 30 h. A full-colour version of this figure is available at The EMBO Journal Online.
Figure 3
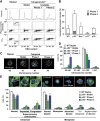
Chromosome instability and centrosome amplification in p53−/− tetraploid HCT 116 clones. (A, B) p53 deficiency increases the percentage of unstable tetraploid clones. Tetraploid HCT 116 clones were generated from wild type (WT), _p53_−/−, Bax_−/−, p21_−/− and p35-expressing parental cells as described in Supplementary Data. Cell cycle distribution and apoptosis-related parameters were evaluated 4 weeks after cloning by multiparametric cytofluorometry upon staining with Hoechst 33342 (which measures DNA content), the mitochondrial transmembrane potential (ΔΨm)-sensitive dye 3,3′-dihexyloxacarbocyanine iodide (DiOC6(3)) and propidium iodide (PI, an exclusion dye that only stains dead cells). Representative plots are shown in A, the inserts therein showing positive controls for ΔΨm dissipation (as obtained by treating the cells for 30 min with 100 μM protonophore carbonyl cyanide 4-(trifluoromethoxy)phenylhydrazone, FCCP) and plasma membrane permeabilization (as resulting from a 2 min-long incubation in 0.5% (w/v) saponin (Sapo)). Tetraploid clones were classified according to genomic instability (as evaluated by the quantification of viable sub-tetraploid populations) in stable (sub-tetraploid cells <10%) and unstable (sub-tetraploid cells >10%). Unstable clones were subdivided into ‘phase 1' and ‘phase 2' clones, characterized by broad and sharp sub-tetraploid peaks, respectively. B reports the frequency of unstable clones generated from parental tetraploid cells of the indicated genotype. Frequency was calculated among 50–100 clones for each genotype (mean±s.e.m., _n_=3 independent series of clones). (C, D) Chromosome count in tetraploid clones. Representative examples of 4′,6 diamidino-2-phenylindole (DAPI)-stained metaphase spreads with the corresponding number of chromosomes are shown in C. For WT and _p53_−/− clones of the indicated type, D reports the percentage of cells containing 40–60, 61–80, 81–100 or >101 chromosomes, as quantified among 100 metaphases per condition (mean±s.e.m., _n_=4 different clones in independent assessments) (E) Centrosome amplification correlates with genomic instability. WT and _p53_−/− clones of the indicated class were cultured on glass coverslips and subjected to immunofluorescence detection of mitotic spindles (β-tubulin staining, green fluorescence) and centrosomes (γ-tubulin staining, red fluorescence). Nuclei were counterstained with Hoechst 33342 (emitting in blue). According to the number of centrosomes, interphase cells were divided in normal (1 or 2 centrosomes) and abnormal (more than 2 centrosomes, either congressed in a single pole or not), whereas metaphases were classified as monopolar (2 congressed centrosomes), normal and abnormal bipolar (2 centrosomes, the latter exhibiting the misalignment of one or more chromosomes), and multipolar (tripolar, tetrapolar or of higher-order polarity, characterized by 3, 4 or more centrosomes, respectively). Representative immunofluorescence microscopy images of each category are shown. The percentage of occurrence of each category is reported, as quantified among 150 to 200 cells for WT and _p53_−/− clones of the indicated type (mean±s.e.m., _n_=4 distinct clones). A full-colour version of this figure is available at The EMBO Journal Online.
Figure 4
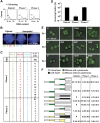
Characterization and fate of the sub-tetraploid offspring of p53−/− tetraploid cells. (A–C) An important fraction of sub-tetraploid cells are aneuploid. Sub-tetraploid cells derived from phase 1 and 2 unstable p53−/− tetraploid HCT 116 clones or the 2n population of the parental _p53_−/− diploid cell line were fluorescence-activated cell sorter (FACS)-purified as indicated in A. Thereafter, nuclei from the sorted populations were subjected to fluorescence in situ hybridization (FISH) with probes specific for the centromeric region of chromosome 8, 10 and 18 (green, red and blue fluorescence, respectively). Representative immunofluorescence microphotographs are shown in B. In C the percentage of wild type (WT) diploid or _p53_−/− sub-tetraploid cells characterized by the indicated chromosomal setup is reported, as scored among ⩾100 metaphases for each cell type (mean±s.e.m., _n_=3 independent determinations). Alternatively, FACS-purified cells obtained as in A were subjected to clonogenic survival assays (D). Columns depict the survival fraction (mean±s.e.m., _n_=3 independent experiments carried out in triplicate with at least three distinct clones for each type) of WT diploid or sub-tetraploid cells derived from _p53_−/− tetraploid clones of the indicated class. (E, F) Videomicroscopy of sub-tetraploid cells. _p53_−/− diploid cells and tetraploid HCT 116 clones expressing a histone 2B–green fluorescent protein chimera (H2B–GFP) were subjected to FACS-purification of diploid or sub-tetraploid populations as in A. Purified cells with a ∼2n DNA content were then monitored by fluorescence videomicroscopy for 40 h. Representative snapshots taken at the indicated time points illustrate sub-tetraploid cells that undergo two consecutive rounds of symmetric division (example 1), divide into two daughter cells that die by apoptosis (example 2), or undergo mitosis followed by incomplete cytokinesis, resulting in increased ploidy (example 3). Full-length movies can be found in Supplementary Videos S4, S5 and S6. F provides a graphic representation and quantitative data (%, mean±s.e.m., _n_=3 independent experiment, 100-150 cells analyzed) about the fate of WT diploid or _p53_−/− sub-tetraploid cells derived from clones of the indicated type. Only cells entering mitosis within the first 10 h were tracked for subsequent 30 h. Please note that cytokinesis failure (leading to an increase in ploidy as well as in cell volume) is depicted with a duplication in bar thickness. The entire catalogue of the observed cell fates is available in Supplementary Figure S5.
Figure 5
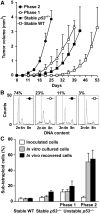
Phase 2 unstable p53−/− tetraploid clones form aggressive tumours. (A) Nude mice were subcutaneously xenografted with similar numbers of wild type (WT) or tetraploid cells that were fluorescence-activated cell sorter (FACS)-purified from _p53_−/− tetraploid clones of the indicated type (stable, phase 1 or 2 unstable). Tumour volumes (mean±s.e.m., _n_=10 mice for each clone type) were monitored over time. (B, C) Tumour cells were recovered from mice (in vivo) and the DNA-content was assessed by propidium iodide (PI) staining and cytofluorometry. The same was done on aliquots of the FACS-purified parental cells that were kept frozen or that were cultured in vitro for the same time as tumours proliferated in vivo. B reports representative cell cycle distributions of tumour cells of the indicated type upon recovery from mice. Percentages refer to the sub-tetraploid populations. C depicts the percentage of sub-tetraploid cells (mean±s.e.m., _n_=3 independent assessments) observed for the indicated cell type.
Figure 6
Correlation between Mos expression and genomic instability in p53−/− tetraploid clones. (A) Mos is upregulated in unstable tetraploid clones. Protein extracts obtained from wild type (WT) or _p53_−/− clones of the indicated type (S=stable, P1=phase 1, P2=phase 2), were subjected to immunoblotting with antibodies that specifically recognize Mos or glyceraldehyde-3-phosphate dehydrogenase (GAPDH, monitored as a loading control). (B) Mos overexpression triggers genomic instability in stable tetraploid cells. Stable p53−/− HCT 116 cells were transfected for 48 h with a polycystronic plasmid expressing green fluorescent protein (GFP) alone or co-expressing Mos and GFP. The GFP+ populations were fluorescence-activated cell sorter (FACS)-purified, cultured for 48 h, and then subjected to subsequent rounds of transfections with the same constructs at intervals of ∼5 days. Columns depict the percentage of sub-tetraploid cells (mean±s.e.m., _n_=3 independent experiments) as assessed after one (I) or multiple (II, III) rounds of transfection. Representative cell cycle distributions as observed after three rounds of transfection are illustrated in Supplementary Figure S6. (C) Mos depletion stabilizes unstable p53−/− tetraploid clones. Phase 1 unstable p53−/− tetraploid HCT 116 cells were left untreated (−) or were transfected with a control (UNR) or Mos-silencing siRNAs for 72 h, followed by DNA content analysis. Representative cell cycle distributions are illustrated in Supplementary Figure S6. The percentage of sub-tetraploid cells (mean±s.e.m., _n_=5 independent experiments) was determined. The efficacy of the small interfering RNA (siRNA)-mediated downregulation of Mos was confirmed by immunoblotting (insert). (D) A non-interferable Mos variant restores genomic instability of originally unstable p53−/− tetraploid cells stabilized by transfection with siRNAs that deplete endogenous Mos. Phase 1 unstable p53−/− tetraploid HCT 116 cells were transfected with a control (UNR) or a Mos-depleting siRNA (Mos_1) for 24 h, followed by further transfection with a control vector encoding green fluorescent protein (GFP) alone or with constructs for the co-expression of GFP and wild type (Mos–GFP) or mutant non-interferable Mos (Mosmut–GFP). After 48 h, Mos expression was controlled by immunoblotting (insert), and 24 h later the percentage of sub-tetraploid cells was quantified (mean±s.e.m., _n_=3 independent assessments). (E) Mos depletion avoids genomic instability caused by p53 knockdown. Wild type (WT) tetraploid HCT 116 clones were repeatedly (6 times) transfected with a control (UNR), a p53-specific (p53_2) and a Mos-specific (Mos_1) siRNA alone or in combination for 72 h, followed by DNA content analysis and quantification of sub-tetraploid cells. The histogram summarizes data (mean±s.e.m.) from five independent experiments.
Figure 7
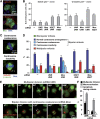
Effects of Mos on centrosome coalescence in p53−/− tetraploid clones. (A) Mos localizes to centrosomes. Immunofluorescence staining for the detection of β- or γ-tubulin (both in red) in _p53_−/− tetraploid cells transfected with a plasmid for the expression of a Mos–green fluorescent protein (Mos–GFP) chimera. Nuclei were counterstained with Hoechst 33342 (emitting in blue). Yellow dots that result from the overlap of green and red fluorescence signals suggest that Mos and γ-tubulin colocalizes at centrosomes (arrows). Representative immunofluorescence microphotographs are shown for cells in interphase. Single-channel microphotographs are provided in Supplementary Figure S8. (B) Mos depletion partially reverts genomic instability induced by HSET downregulation. Stable and unstable _p53_−/− tetraploid HCT 116 clones were transfected with a control (UNR), a Mos-specific (Mos_1) or a HSET-specific (HSET_1) small interfering RNA (siRNA) alone or in combination for 72 h, followed by cytofluorometric analysis of DNA content and quantification of sub-tetraploid cells (mean±s.e.m., _n_=3 independent experiments). (C, D) Increased coalescence and inactivation of supernumerary centrosomes upon Mos depletion. Unstable p53−/− tetraploid HCT 116 cells were co-transfected with the indicated siRNA combinations for 72 h, and then subjected to immunofluorescence staining for the detection of β- and γ-tubulin (green and red fluorescence, respectively). Hoechst 33342 was employed for nuclear counterstaining. C shows representative immunofluorescence microphotographs of supernumerary centrosomes coalescing or being inactivated (ci), which allows for the bipolar organization of spindles. Single-channel microphotographs are provided in Supplementary Figure S8. D depicts the percentage of metaphases (mean±s.e.m., _n_=3 independent experiments) characterized by the indicated mitotic spindle arrangements, as scored among at least 100 cells per for each condition. All experiments have been performed on at least three distinct clones of each type. (E, F) Live-cell imaging of the Mos effects on centrosomal and chromosomal dynamics. A (phase 2) unstable tetraploid _p53_−/− GFP–H2B-expressing clone was transiently transfected with a Mos-specific or a control siRNA (UNR) together with a construct coding for centrin–DsRed (E). E shows representative snapshots. Please note that bipolar divisions are characterized by the coalescence of DsRed-positive centrosomes in two clusters. Full-length movies can be found in Supplementary Videos S7 and S8. Hatched lines indicate the position of daughter cells arising from the observed mitoses. The frequency of multipolar divisions and failed cytokineses observed by live-cell imaging is reported in F (mean±s.e.m., _n_=3 independent experiments).
Similar articles
- Involvement of p38alpha in the mitotic progression of p53(-/-) tetraploid cells.
Vitale I, Jemaà M, Senovilla L, Galluzzi L, Rello-Varona S, Metivier D, Ripoche H, Lazar V, Dessen P, Castedo M, Kroemer G. Vitale I, et al. Cell Cycle. 2010 Jul 15;9(14):2823-9. Epub 2010 Jul 3. Cell Cycle. 2010. PMID: 20686359 - p53 dependent centrosome clustering prevents multipolar mitosis in tetraploid cells.
Yi Q, Zhao X, Huang Y, Ma T, Zhang Y, Hou H, Cooke HJ, Yang DQ, Wu M, Shi Q. Yi Q, et al. PLoS One. 2011;6(11):e27304. doi: 10.1371/journal.pone.0027304. Epub 2011 Nov 4. PLoS One. 2011. PMID: 22076149 Free PMC article. - Formation of bipolar spindles with two centrosomes in tetraploid cells established from normal human fibroblasts.
Ohshima S, Seyama A. Ohshima S, et al. Hum Cell. 2012 Sep;25(3):78-85. doi: 10.1007/s13577-012-0046-3. Epub 2012 Jun 14. Hum Cell. 2012. PMID: 22696268 - Deregulation of the centrosome cycle and the origin of chromosomal instability in cancer.
Lingle WL, Lukasiewicz K, Salisbury JL. Lingle WL, et al. Adv Exp Med Biol. 2005;570:393-421. doi: 10.1007/1-4020-3764-3_14. Adv Exp Med Biol. 2005. PMID: 18727509 Review. - Illicit survival of cancer cells during polyploidization and depolyploidization.
Vitale I, Galluzzi L, Senovilla L, Criollo A, Jemaà M, Castedo M, Kroemer G. Vitale I, et al. Cell Death Differ. 2011 Sep;18(9):1403-13. doi: 10.1038/cdd.2010.145. Epub 2010 Nov 12. Cell Death Differ. 2011. PMID: 21072053 Free PMC article. Review.
Cited by
- In vitro evidence for senescent multinucleated melanocytes as a source for tumor-initiating cells.
Leikam C, Hufnagel AL, Otto C, Murphy DJ, Mühling B, Kneitz S, Nanda I, Schmid M, Wagner TU, Haferkamp S, Bröcker EB, Schartl M, Meierjohann S. Leikam C, et al. Cell Death Dis. 2015 Apr 2;6(4):e1711. doi: 10.1038/cddis.2015.71. Cell Death Dis. 2015. PMID: 25837487 Free PMC article. - Transcriptome analysis of tetraploid cells identifies cyclin D2 as a facilitator of adaptation to genome doubling in the presence of p53.
Potapova TA, Seidel CW, Box AC, Rancati G, Li R. Potapova TA, et al. Mol Biol Cell. 2016 Oct 15;27(20):3065-3084. doi: 10.1091/mbc.E16-05-0268. Epub 2016 Aug 24. Mol Biol Cell. 2016. PMID: 27559130 Free PMC article. - Transgenerational cell fate profiling: a method for the graphical presentation of complex cell cycle alterations.
Jemaà M, Galluzzi L, Kepp O, Castedo M, Rello-Varona S, Vitale I, Kroemer G. Jemaà M, et al. Cell Cycle. 2013 Jan 1;12(1):183-90. doi: 10.4161/cc.23046. Epub 2012 Dec 19. Cell Cycle. 2013. PMID: 23255111 Free PMC article. - Genomic instability and colon carcinogenesis: from the perspective of genes.
Rao CV, Yamada HY. Rao CV, et al. Front Oncol. 2013 May 21;3:130. doi: 10.3389/fonc.2013.00130. eCollection 2013. Front Oncol. 2013. PMID: 23734346 Free PMC article. - Increased asymmetric and multi-daughter cell division in mechanically confined microenvironments.
Tse HT, Weaver WM, Di Carlo D. Tse HT, et al. PLoS One. 2012;7(6):e38986. doi: 10.1371/journal.pone.0038986. Epub 2012 Jun 25. PLoS One. 2012. PMID: 22761717 Free PMC article.
References
- Boveri T (2008) Concerning the origin of malignant tumours by Theodor Boveri. Translated and annotated by Henri Harris. J Cell Sci 121(Suppl. 1): 1–84 - PubMed
Publication types
MeSH terms
Substances
LinkOut - more resources
Full Text Sources
Other Literature Sources
Research Materials
Miscellaneous
