p53 regulates epithelial-mesenchymal transition through microRNAs targeting ZEB1 and ZEB2 - PubMed (original) (raw)
. 2011 May 9;208(5):875-83.
doi: 10.1084/jem.20110235. Epub 2011 Apr 25.
Angelo Veronese, Flavia Pichiorri, Tae Jin Lee, Young-Jun Jeon, Stefano Volinia, Pascal Pineau, Agnès Marchio, Jeff Palatini, Sung-Suk Suh, Hansjuerg Alder, Chang-Gong Liu, Anne Dejean, Carlo M Croce
Affiliations
- PMID: 21518799
- PMCID: PMC3092351
- DOI: 10.1084/jem.20110235
p53 regulates epithelial-mesenchymal transition through microRNAs targeting ZEB1 and ZEB2
Taewan Kim et al. J Exp Med. 2011.
Abstract
p53 suppresses tumor progression and metastasis. Epithelial-mesenchymal transition (EMT) is a key process in tumor progression and metastasis. The transcription factors ZEB1 and ZEB2 promote EMT. Here, we show that p53 suppresses EMT by repressing expression of ZEB1 and ZEB2. By profiling 92 primary hepatocellular carcinomas (HCCs) and 9 HCC cell lines, we found that p53 up-regulates microRNAs (miRNAs), including miR-200 and miR-192 family members. The miR-200 family members transactivated by p53 then repress ZEB1/2 expression. p53-regulated miR-192 family members also repress ZEB2 expression. Inhibition or overexpression of the miRNAs affects p53-regulated EMT by altering ZEB1 and ZEB2 expression. Our findings indicate that p53 can regulate EMT, and that p53-regulated miRNAs are critical mediators of p53-regulated EMT.
Figures
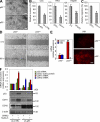
Figure 1.
p53 inhibition induces EMT resulting in increased cell invasion and migration. (A) Phase-contrast view of RKO (p53+/+ and p53−/−) cells. (B) C3A (stably expressing sh-control, sh-CTRL, or sh-p53) cells, RKO (p53+/+ and p53−/−) cells, and Hep3B (stably expressing empty vector, EV, or WT p53 expression vector [WTp53]) cells were subjected to in vitro invasion assay for 48 h. (C) RKO (p53+/+ and p53−/−) cells were subjected to in vitro migration assay for 24 h. (D) Wound-healing assay using RKO (p53+/+ and p53−/−) cells that were plated and disrupted with a 200-μl tip. 60 h after disruption, the cell layer was photographed. (E) Relative expression levels of CDH1 and VIM mRNA (left) and VIM protein (right) in RKO (p53+/+ and p53−/−) cells. (F) Relative expression of CDH1 and CDH2 mRNA (top) and protein (bottom) in C3A cells stably expressing sh-CTRL or sh-p53 and treated with DMSO or 10 µM nutlin-3 for 24 h. (top) Densitometry values of p53 protein levels were normalized with those of β-actin protein levels. (A and D) A representative experiment out of three independent experiments. (B, C, E, and F) Data are mean ± SEM of three independent experiments and each measured in triplicate (**, P < 0.05; *, P ≤ 0.01). Bars, 50 µm.
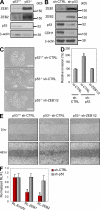
Figure 2.
p53 inhibits EMT through ZEB1 and ZEB2 repression in a 3′UTR-dependent manner. (A) Protein levels of ZEB1, ZEB2, and p53 in RKO (p53+/+ and p53−/−) cells. (B) Protein levels of ZEB1, ZEB2, p53, and CDH1 in C3A-sh-CTRL and C3A-sh-p53 cells. (C) Phase contrast view of RKO (p53+/+ and p53−/−) cells stably expressing sh-CTRL or sh-ZEB1/2. (D) In vitro invasion assay using C3A-sh-CTRL and C3A-sh-p53 cells transfected with si-CTRL or si-ZEB1/2. (E) Wound-healing assay using RKO (p53+/+ and p53−/−) cells stably expressing sh-CTRL or sh-ZEB1/2. A representative experiment out of three independent experiments. (F) Luciferase assay of ZEB1 (RL-ZEB1) or ZEB2 (RL-ZEB2) 3′UTR in C3A-sh-CTRL and C3A-sh-p53 cells. RL, Renilla luciferase; FL, Firefly luciferase. (A–C) A representative experiment out of two independent experiments. (D and F) Data are mean ± SEM of three independent experiments and each is measured in triplicate (**, P < 0.05; *, P ≤ 0.01). Bars, 50 µm.
Figure 3.
miR-200 and miR-192 family members are regulated by p53. (A) Expression levels of miR-141, miR-200c, and miR-34a in nine HCC cell lines harboring WT p53, p53 deletion (Null), or mutant p53 (Mutant). (B) Relative expression of miR-200 family members, miR-34a (positive control), and miR-146b (negative control) in C3A-sh-CTRL and C3A-sh-p53 cells. (C) Relative expression levels of miR-200 family members, miR-192, miR-34a (positive control), and miR-146b (negative control) in Hep3B cells stably expressing WT p53, mutant (MUT) p53, or empty vectors. (D) Expression levels of miR-141, miR-200c, miR-192, and miR-215 in RKO (p53−/− and p53+/+) cells. (E) Expression levels of miR-200 family members in MEF (p53−/− and p53+/+) cells with (right) or without (left) doxorubicin (200 ng/ml) treatment for 24 h. (A–E) Data are mean ± SEM of three independent experiments and each is measured in triplicate (**, P < 0.05; *, P ≤ 0.01).
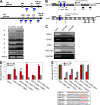
Figure 4.
miR-200 family members are directly regulated by p53 at the transcriptional level. (A) sqRT-PCR of miR-200 family clusters. The regions (A–F) amplified by sqRT-PCR are indicated with blue-colored bars in a schematic (top). (B) Schematic view of miRNA-200 family clusters and chromosomal locations of TSS and putative p53BS (blue ovals: 200c1, 200c2, and 200b). Gray and white fragments represent 500 bp in length. Small gray arrows indicate primers (F, forward; R, reverse) used for the constructs of luciferase assay (D). Large black arrows indicate locations of precursor miRNAs. (C) ChIP analysis using C3A cells. 200c1 and 200c2 designate p53BSs of miR-200c–141 cluster and 200b designates p53BS of miR-200b–429 cluster. 200c AR designates a region adjacent (∼200 bp from 200c2) to p53BS of miR-200c–141 cluster. 200c AR and GAPDH are used as negative controls. Input represents 1% of the total chromatin used in this analysis. (D) Luciferase assay of 5′ promoters of miR-200 family clusters in C3A-sh-CTRL and C3A-sh-p53 cells. The regions inserted into luciferase reporters are depicted in B. RL, Renilla luciferase; FL, Firefly luciferase. (E, top) Luciferase assay of 5′ promoter with WT or mutant (MUT) p53BSs of miR-200 family clusters in C3A-sh-CTRL and C3A-sh-p53 cells. (bottom) Sequence information on p53BSs mutations. (A and C) A representative experiment out of two independent experiments. (D and E) Data are mean ± SEM of three independent experiments and each is measured in triplicate (**, P < 0.05; *, P ≤ 0.01).
Figure 5.
miR-200 and miR-192 family members regulate p53-mediated EMT by targeting ZEB1 and ZEB2. (A) p53+/+ and p53−/− RKO cells were transfected twice a week for 2 wk with indicated premiRs (50 nM). Cells were then photographed. A representative experiment out of three independent experiments is shown. (B) RKO (p53+/+ and p53−/−) cells transfected with indicated premiRs were subjected to in vitro invasion (top) and migration (bottom) assays. (C) C3A cells were transfected with luciferase constructs driven by 3′UTRs of ZEB1 or ZEB2 (RL-ZEB1, RL-ZEB2), together with scrambled miRNA inhibitor (Scr) or inhibitors of miR-141 (α-141) or miR-200c (α-200c). RL, Renilla luciferase; FL, Firefly luciferase. (D) RKO (p53+/+) cells were transfected with luciferase constructs driven by 3′UTRs of ZEB1 or ZEB2 (RL-ZEB1, RL-ZEB2), together with scrambled miRNA inhibitor (Scr) or inhibitors of miR-192 (α-192) or miR-215 (α-215). (E) Luciferase assay using C3A-sh-CTRL and C3A-sh-p53 cells transfected with pCIneo-hRL constructs containing ZEB1 or ZEB2 3′UTR with (200MUT) or without (WT) mutations in miR-200 family binding sites. (B-E) Data are mean ± SEM of three independent experiments and each is measured in triplicate (**, P < 0.05; *, P ≤ 0.01). Bars, 50 µm.
Similar articles
- miR-139-5p inhibits epithelial-mesenchymal transition, migration and invasion of hepatocellular carcinoma cells by targeting ZEB1 and ZEB2.
Qiu G, Lin Y, Zhang H, Wu D. Qiu G, et al. Biochem Biophys Res Commun. 2015 Jul 31;463(3):315-21. doi: 10.1016/j.bbrc.2015.05.062. Epub 2015 May 27. Biochem Biophys Res Commun. 2015. PMID: 26022123 - The miR-200 family inhibits epithelial-mesenchymal transition and cancer cell migration by direct targeting of E-cadherin transcriptional repressors ZEB1 and ZEB2.
Korpal M, Lee ES, Hu G, Kang Y. Korpal M, et al. J Biol Chem. 2008 May 30;283(22):14910-4. doi: 10.1074/jbc.C800074200. Epub 2008 Apr 14. J Biol Chem. 2008. PMID: 18411277 Free PMC article. - MiR-101 suppresses the epithelial-to-mesenchymal transition by targeting ZEB1 and ZEB2 in ovarian carcinoma.
Guo F, Cogdell D, Hu L, Yang D, Sood AK, Xue F, Zhang W. Guo F, et al. Oncol Rep. 2014 May;31(5):2021-8. doi: 10.3892/or.2014.3106. Epub 2014 Mar 21. Oncol Rep. 2014. PMID: 24677166 Free PMC article. - Role of ZEB Family Members in Proliferation, Metastasis, and Chemoresistance of Prostate Cancer Cells: Revealing Signaling Networks.
Soleymani L, Zarrabi A, Hashemi F, Hashemi F, Zabolian A, Banihashemi SM, Moghadam SS, Hushmandi K, Samarghandian S, Ashrafizadeh M, Khan H. Soleymani L, et al. Curr Cancer Drug Targets. 2021;21(9):749-767. doi: 10.2174/1568009621666210601114631. Curr Cancer Drug Targets. 2021. PMID: 34077345 Review. - Post-Translational Modification of ZEB Family Members in Cancer Progression.
Park MK, Lee H, Lee CH. Park MK, et al. Int J Mol Sci. 2022 Dec 1;23(23):15127. doi: 10.3390/ijms232315127. Int J Mol Sci. 2022. PMID: 36499447 Free PMC article. Review.
Cited by
- To differentiate or not--routes towards metastasis.
Brabletz T. Brabletz T. Nat Rev Cancer. 2012 May 11;12(6):425-36. doi: 10.1038/nrc3265. Nat Rev Cancer. 2012. PMID: 22576165 Review. - Dual Effect of Taxifolin on ZEB2 Cancer Signaling in HepG2 Cells.
Dostal Z, Sebera M, Srovnal J, Staffova K, Modriansky M. Dostal Z, et al. Molecules. 2021 Mar 9;26(5):1476. doi: 10.3390/molecules26051476. Molecules. 2021. PMID: 33803107 Free PMC article. - P53-regulated miR-320a targets PDL1 and is downregulated in malignant mesothelioma.
Costa C, Indovina P, Mattioli E, Forte IM, Iannuzzi CA, Luzzi L, Bellan C, De Summa S, Bucci E, Di Marzo D, De Feo M, Mutti L, Pentimalli F, Giordano A. Costa C, et al. Cell Death Dis. 2020 Sep 14;11(9):748. doi: 10.1038/s41419-020-02940-w. Cell Death Dis. 2020. PMID: 32929059 Free PMC article. - The microRNA-200 family: small molecules with novel roles in cancer development, progression and therapy.
Humphries B, Yang C. Humphries B, et al. Oncotarget. 2015 Mar 30;6(9):6472-98. doi: 10.18632/oncotarget.3052. Oncotarget. 2015. PMID: 25762624 Free PMC article. Review. - MicroRNA-129-5p modulates epithelial-to-mesenchymal transition by targeting SIP1 and SOX4 during peritoneal dialysis.
Xiao L, Zhou X, Liu F, Hu C, Zhu X, Luo Y, Wang M, Xu X, Yang S, Kanwar YS, Sun L. Xiao L, et al. Lab Invest. 2015 Jul;95(7):817-832. doi: 10.1038/labinvest.2015.57. Epub 2015 May 11. Lab Invest. 2015. PMID: 25961171 Free PMC article.
References
Publication types
MeSH terms
Substances
LinkOut - more resources
Full Text Sources
Medical
Research Materials
Miscellaneous


